B OND INDICES FOR THE EURO ZONE Dutch Commission on Bonds Sub Committee on Indices January 2001 Members of the Sub Committee Drs. I.S.A. Ruis-Sijstermans RBA (Chairperson) Drs. J.J. ‘t Hart Drs. J. de Wit RBA
Transcript
BOND INDICES FOR THEEURO ZONE
Dutch Commission on BondsSub Committee on Indices
January 2001
Members of the Sub Committee
Drs. I.S.A. Ruis-Sijstermans RBA(Chairperson)Drs. J.J. ‘t HartDrs. J. de Wit RBA
bondindiceseurozone 25-01-2001 16:06 Pagina 1
bondindiceseurozone 25-01-2001 16:06 Pagina 2
Foreword
In 1996 the Dutch Commission on Bonds published a report containingdefinitions and characteristics of the most important data, like redemp-tion yields and bond indices, available for the Dutch fixed income mar-ket. Because of the start of the EMU in January 1999 a diversity of new bondindices for the Euro zone as a whole were introduced. These includeindices specialising in government bonds and also indices for non-government (‘credit’) bonds and composite indices including both sove-reign and credit bonds. For diversification reasons the importance of cre-dit bonds in fixed income portfolios has increased dramatically since theintroduction of the Euro. The low level of interest rates has also addedmomentum to the use of defaultable securities by investors. This newpublication guides investors through the currently most widely usedbond indices in the Euro-zone capital market in the categories sovereign,credit and composite.
After having discussed the characteristics of the individual indices, theyare analysed against a set of criteria and a number of recommendationsare given to fixed income investors how to use the indices in the mostefficient way.
We like to thank Mr Con Keating (a member of the EFFAS EuropeanBond Commission), all the colleagues from the Dutch Commission onBonds and the index providers for their helpful comments. We welcomeall future remarks on the report and we stimulate the discussion on theuse of bond indices in the European capital markets.
Amsterdam, January 2001Drs. R.P.J.M. ter Horst RBAChairman Dutch Commission on Bonds (DCB)
3
bondindiceseurozone 25-01-2001 16:06 Pagina 3
1 Bond Indices Euro Zone and criteria for comparison
Since the introduction of the Euro on January 1, 1999 a large number ofinstitutions have started to publish indices that should describe the valueof bonds issued in the new European currency. In addition to indices forgovernment (‘sovereign’) bonds of the member countries of EMU, theattention of investors has increasingly focused on indices for non-govern-ment bonds. In this report we will refer to the category non-governmentbonds as ‘credit bonds’, while we realise that some market participantsdefine ‘credit bonds’ differently. The non-government bond indices, socalled ‘credit indices’, include a wide range of securities and includestructured products. There are also a number of composite indices con-sisting of both government and credit bonds.
In this publication we intend to compare the available indices for theEuro zone in the above mentioned categories in order to derive a moti-vated recommendation as to which index is most suited to the invest-ment strategy of a particular manager. We conclude this publication ofthe Dutch Commission on Bonds (DCB) with a number of recommen-dations on how to use the indices in the daily investment managementprocess. The range of uses of bond indices as described by the EFFAS-EBC1 (2) isa starting point for our evaluation. The following purposes can be distin-guished:
– To act as a benchmark for portfolio management;– To act as an indicator of market performance and development. This
should include price and yield performance, as well as information onthe characteristics such as average maturity, duration, convexity, etc.;
– The basis on which market options and futures, and other derivativesmay be derived;
– A comparator for different markets
It is apparent that the use of indices as a benchmark in performance ana-lysis plays a key role in the practice of portfolio management. Regardless
4
1) Numbers in brackets refer to the list of references in Annex 2.
bondindiceseurozone 25-01-2001 16:06 Pagina 4
of the character of the investment policy (active or passive), it is ofutmost importance that a portfolio manager in fixed income has a com-plete insight into the way the indices have been constructed and calcula-ted, and in particular, into the procedures to select bonds that are incor-porated in the indices.
It is only with full knowledge of the structure of an index that it is possi-ble to pursue an investment policy relative to that chosen index securely;a statement which becomes rather obvious in the case of passive bondmanagement. For an active bond strategy, knowledge of the selectionand calculation criteria helps the manager to optimise his portfolio givena desired Tracking Error.
Therefore transparency, availability of data and knowledge of the methodof calculation of the indices are important criteria by which fixed incomeportfolio managers must evaluate the available bond indices; the basis forthe decision as to which index is relevant as a benchmark for their port-folio(s) under management. As we will see there are differences in thedegree of transparency. While one portfolio manager has access to a verydetailed description of the index composition, the criteria and rules ofcalculation of a particular index, another may not. In many cases this isdependent upon the relationship of the investor with the index provider;information on the same index is often unavailable to managers who donot regularly trade with the index provider. In practice, representative-ness is often used by investors as an additional criterion. The other crite-ria are not directly linked to the main application of indices (i.e. perfor-mance measurement), but have a more theoretical application.
In the following chapters we will compare in depth the pros and cons ofthe three categories of Euro zone indices: sovereign, credit and composi-te indices. Our selection of the index providers is based on a quarterlysurvey in Risk Publications (3) from which it is evident that the bondindices offered by JP Morgan, Salomon Smith Barney, Lehman Brothers,Bloomberg EFFAS, Merrill Lynch and MSCI are most actively used byportfolio managers. Bond indices that are published by Barclays, WarburgDillon Read and Bear Stearns are according to this source not currentlywidely used by international fixed income managers. The same holds forthe Indices by CSFB and Deutsche Bank, which also still have a shorthistory. Therefore, we have chosen to exclude the latter indices from ourevaluation.
5
bondindiceseurozone 25-01-2001 16:06 Pagina 5
We also decided not to consider high yield indices that have recentlybeen introduced for the Euro zone by some index providers. Finally, it is not appropriate to compare the bond indices in the yearsbefore 1999, because:– most of the Euro zone indices started being published with the start
of the EMU and– indices for which history is available in the pre-EMU years, are rather
artificial by nature.
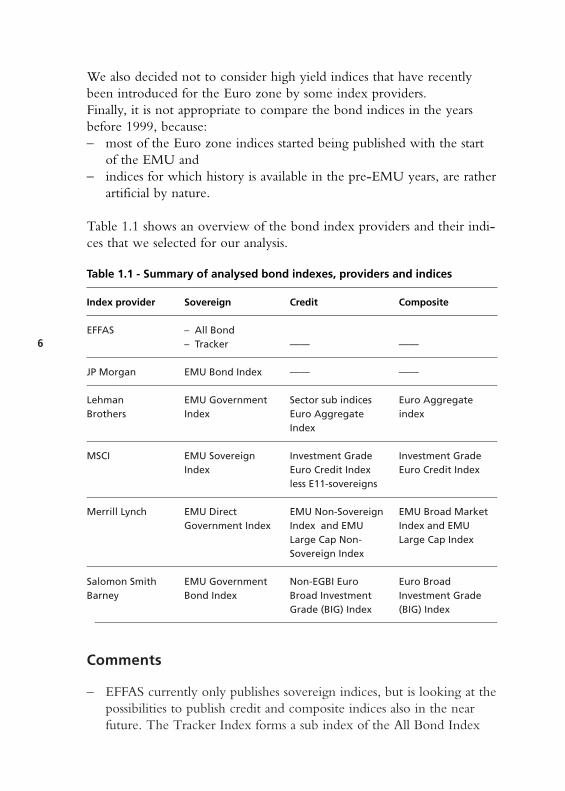
Table 1.1 shows an overview of the bond index providers and their indi-ces that we selected for our analysis.
Table 1.1 - Summary of analysed bond indexes, providers and indices
Index provider Sovereign Credit Composite
EFFAS – All Bond– Tracker —— ——
JP Morgan EMU Bond Index —— ——
Lehman EMU Government Sector sub indices Euro Aggregate Brothers Index Euro Aggregate index
Index
MSCI EMU Sovereign Investment Grade Investment Grade Index Euro Credit Index Euro Credit Index
less E11-sovereigns
Merrill Lynch EMU Direct EMU Non-Sovereign EMU Broad MarketGovernment Index Index and EMU Index and EMU
Large Cap Non- Large Cap IndexSovereign Index
Salomon Smith EMU Government Non-EGBI Euro Euro BroadBarney Bond Index Broad Investment Investment Grade
Grade (BIG) Index (BIG) Index
Comments
– EFFAS currently only publishes sovereign indices, but is looking at thepossibilities to publish credit and composite indices also in the nearfuture. The Tracker Index forms a sub index of the All Bond Index
6
bondindiceseurozone 25-01-2001 16:06 Pagina 6
containing only the largest issues in each sector. The return on theTracker Index is expected to track the return on the All Bond Index
– JP Morgan did not publish data on Euro credit or composite indicesuntil recently. For the last several months, however, JP Morgan haspublished data on Euro credit swap indices via their Bloomberg pageand website. The published return data are based on the performanceof credit linked notes written on the constituent names with an initialmaturity of five years. The data are provided by rating category andindustry level. The weekly data on this index are available fromFebruary 2000 and the monthly data from February 1999. Due to theinherent difference in characteristics of these indices, and limited his-tory, we have decided not to include them in our evaluation. On September 14, 2000 JP Morgan launched the JP MorganAggregate Index Euro (MAGGIE), which includes government andcredit bonds. Separate data on the individual components of the mainindex will also be published: the Government Bond Index EMU, theCredit Index Euro and the Pfandbrief Index. Data on these new indi-ces will be provided via Reuters and the Bloomberg pages, which arefreely available to everybody and via the Internet site, which is acces-sible to authorised users. The JP Morgan Credit Index includes bondswith a size larger than 100 million Euro’s, but additional liquidity cri-teria in terms of quality of pricing are defined. As a price source JPMorgan uses Reuters for the Pfandbriefe and ISMA for its other cre-dit bonds. JP Morgan considers the regularity and quality of pricesfrom ISMA as a proxy for liquidity of the credit bonds. The mainMAGGIE index also includes bonds that do not have an investmentgrade rating and thus includes high yield bonds. JP Morgan willhowever publish data on many sub-indices on the basis of rating,including an investment grade index. The composite index is splitinto four sectors and the industrials are further divided into ten subca-tegories. There are plans to further divide the Supras, Agencies andSovereigns and Financial Sectors into sub groupings in the near futu-re. Because the JP Morgan Aggregate Index Euro has just beenlaunched, we decided not yet to include the index into our furtherevaluation, although JP Morgan has published (‘artificial’) historicaldata back to 1997. While all euro credit and composite indices evalu-ated in this report also have a short history, the publication of data forthese indices started at latest in the beginning of 1999.
– Lehman Brothers does not publish an explicit non-government bondindex, but does publish indices concerning different credit sectors.
7
bondindiceseurozone 25-01-2001 16:06 Pagina 7
The sectors sovereign/supranational, corporate and collateralised aredistinguished. There is also information on a more detailed sectorlevel. It is possible for the investor to create his own credit (non-government bond) index by combining the different sector indices,but this requires some calculations.
– Besides the ‘main’ Euro Aggregate indices Lehman Brothers alsopublishes data for the Euro Aggregate Index including only bondswith an outstanding volume of 500 million Euro or more. However,the data on this index are less detailed in their publications. Therefore,we decided not to take this index into account in the further analysis.
– MSCI, Merrill Lynch and Salomon Smith Barney explicitly publishdetailed data on credit (non-government bond) indices.
Generally, the decision of an investor to use a particular index as a bench-mark for performance measurement depends on the following criteria:
– Transparency: the selection criteria (size and rating), the changes inthe composition of the index and the method of calculation of theindices should be available to portfolio managers who use the indexas a benchmark.
– Replicability: especially passive managers should be able to track theindex with a minimal Tracking Error.
– Representativeness: the index should be a perfect representation ofthe various characteristics of the market that it intends to describe.
– Investibility: the benchmark should consist of bonds in which inve-stors can easily invest (in terms of liquidity).
– Acceptance: the index should be widely used by international inve-stors. In general, this facilitates a better understanding of the perfor-mance of that index and the comparison of manager performance.
– Consistency: a set of rules for index calculation is necessary to guar-antee consistency of the calculations over time.
– Relevancy: the benchmark should fit into the investment strategy ofthe portfolio.
– Flexibility: application of the classifications (like maturity segments,type of issuer, rating) in the future should not be hampered by a rigi-dity in the definition of the boundaries of the segments that have ini-tially been defined.
– Availability: performance, composition, inclusion rules and otherrelevant data or information on the indices should be easily availablefor investors.
8
bondindiceseurozone 25-01-2001 16:06 Pagina 8
– Price Quality: the prices used to calculate the performance of theindex (closing prices, matrix prices, basket prices like Bloomberg gene-ric) should be consistent and accurate.
Comments on availability
The table below summarises the sources of information on the variousindices.
Table 1.2 – Data sources indices for the Euro zone
EFFAS JP Morgan Lehman Merrill Lynch MSCI SalomonBrothers Smith
Internet —— Www.morgan Www.client. www.research. www.msci. www.direct2.markets.com lehman.com ml.com com sbi.com
& www.ml.com
Data- —— JAGALLE Several data MLEMUCU —— SBEGEII stream (Euro Sov. on Lehman (Broad Market) (Euro Sov.)
Tot.) Euro Aggre- MLDGVCU SBEBAMEAlso data gate sub (Direct Govt. (Comp.BIG)available by indices & Euro Also datacountry and by rating Sovereign) availablematurity category MLQGVCU by ratingbuckets and maturity (Quasi Govt.) category,in different buckets MLCRPU industry currencies (Corporates) sector and
maturity buckets
– JP Morgan, Merrill Lynch and Salomon Brothers provide general infor-mation on returns and duration of their indices on Reuters. Only aut-horised users can view information on Reuters on the LehmanBrothers indices. Data on EFFAS and MSCI indices are not found onthe Reuters screens.
9
bondindiceseurozone 25-01-2001 16:06 Pagina 9
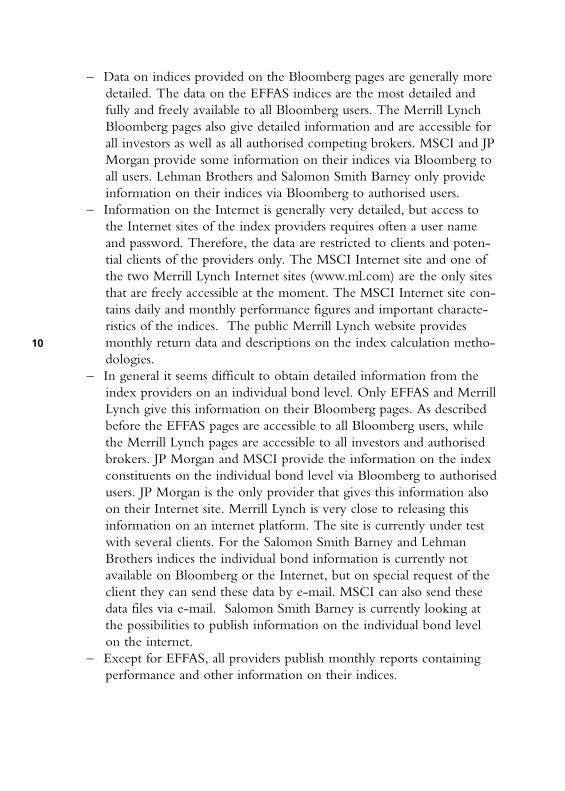
– Data on indices provided on the Bloomberg pages are generally moredetailed. The data on the EFFAS indices are the most detailed andfully and freely available to all Bloomberg users. The Merrill LynchBloomberg pages also give detailed information and are accessible forall investors as well as all authorised competing brokers. MSCI and JPMorgan provide some information on their indices via Bloomberg toall users. Lehman Brothers and Salomon Smith Barney only provideinformation on their indices via Bloomberg to authorised users.
– Information on the Internet is generally very detailed, but access tothe Internet sites of the index providers requires often a user nameand password. Therefore, the data are restricted to clients and poten-tial clients of the providers only. The MSCI Internet site and one ofthe two Merrill Lynch Internet sites (www.ml.com) are the only sitesthat are freely accessible at the moment. The MSCI Internet site con-tains daily and monthly performance figures and important characte-ristics of the indices. The public Merrill Lynch website providesmonthly return data and descriptions on the index calculation metho-dologies.
– In general it seems difficult to obtain detailed information from theindex providers on an individual bond level. Only EFFAS and MerrillLynch give this information on their Bloomberg pages. As describedbefore the EFFAS pages are accessible to all Bloomberg users, whilethe Merrill Lynch pages are accessible to all investors and authorisedbrokers. JP Morgan and MSCI provide the information on the indexconstituents on the individual bond level via Bloomberg to authorisedusers. JP Morgan is the only provider that gives this information alsoon their Internet site. Merrill Lynch is very close to releasing thisinformation on an internet platform. The site is currently under testwith several clients. For the Salomon Smith Barney and LehmanBrothers indices the individual bond information is currently notavailable on Bloomberg or the Internet, but on special request of theclient they can send these data by e-mail. MSCI can also send thesedata files via e-mail. Salomon Smith Barney is currently looking atthe possibilities to publish information on the individual bond levelon the internet.
– Except for EFFAS, all providers publish monthly reports containingperformance and other information on their indices.
10
bondindiceseurozone 25-01-2001 16:06 Pagina 10
Comments on price quality
In practice, the valuation of investment portfolios is often based on clo-sing prices provided by a data vendor. Although this is common practice,it is rather arbitrary and the results will often be influenced by incidentalfactors. Theoretically, the use of ‘basket’ prices (like the Bloomberggeneric prices, which are calculated as a median of daily quotes) might berecommended. But, given the common practice of investors of valuingportfolios at closing prices, use of ‘basket priced’ indices will result into aTracking Error of the performance of the portfolio relative to the bench-mark. EFFAS research shows, however, that, in practice, this TrackingError is small for periods of a week or longer. Due to differences in the timing of valuations by different providersdirect comparison of indices and portfolios is also difficult. The timing ofvaluations can also bias cross-market measures such as correlation.
The calculation of the total return of less actively traded bonds in an (AllBond) index will regularly be based upon so called “Matrix Prices”which prices are normally derived from comparable government andcorporate bonds in the same maturity or duration segment. Dependenton the quality of the issuer this basis yield is augmented with an appro-priate yield spread. An important factor in the use of matrix prices is thatthe spread matrix must always be up-to-date and represent the currentmarket situation adequately. It is commonly observed that matrix pricinglags changes in ‘true’ spread levels.
11
bondindiceseurozone 25-01-2001 16:06 Pagina 11
2 Euro Sovereign Bond Indices
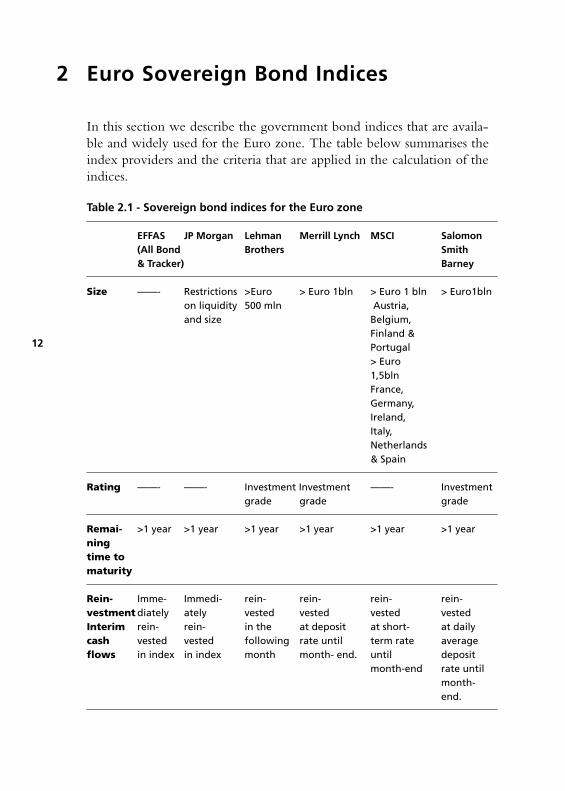
In this section we describe the government bond indices that are availa-ble and widely used for the Euro zone. The table below summarises theindex providers and the criteria that are applied in the calculation of theindices.
Table 2.1 - Sovereign bond indices for the Euro zone
EFFAS JP Morgan Lehman Merrill Lynch MSCI Salomon(All Bond Brothers Smith & Tracker) Barney
Size ——- Restrictions >Euro > Euro 1bln > Euro 1 bln > Euro1blnon liquidity 500 mln Austria, and size Belgium,
Finland & Portugal> Euro 1,5bln France, Germany, Ireland, Italy, Netherlands & Spain
Remai- >1 year >1 year >1 year >1 year >1 year >1 yearning time to maturity
Rein- Imme- Immedi- rein- rein- rein- rein-vestment diately ately vested vested vested vested Interim rein- rein- in the at deposit at short- at daily cash vested vested following rate until term rate average flows in index in index month month- end. until deposit
month-end rate untilmonth- end.
12
bondindiceseurozone 25-01-2001 16:06 Pagina 12
Table 2.1 - (continued)
EFFAS JP Morgan Lehman Merrill Lynch MSCI Salomon(All Bond Brothers Smith & Tracker) Barney
Rebalan-Every last Monthly Monthly Every last Monthly Every 25th cing day of day of month of month
month
Pricesused Bloomberg JP Morgan Lehman Merrill prices, MSCI prices Salomon
Generic prices prices, Market and Market prices and Prices and Market Market makers makers small part (BGN) makers makers and ISMA Market
and matrix makersprices
Source: index provider publications and (5)
Comments
– None of the providers uses closing prices from the different exchangesin the calculation of the indices. As concluded in a study on theDutch bond market (4) it was observed that Salomon Smith Barneyused in the past closing prices for the monthly indices and marketmaker prices for the daily series. The daily calculation of indices nowdominates and, therefore, the summary only shows the use of marketmaker prices.
– While Merrill Lynch, MSCI and Salomon Smith Barney select bondswith an amount outstanding larger than Euro 1 billion, LehmanBrothers includes bonds with an amount outstanding which exceedsEuro 500 million. JP Morgan does not only look at size, but also atliquidity of the government bonds. EFFAS does not apply a size restriction for the All Bond Index.
13
bondindiceseurozone 25-01-2001 16:06 Pagina 13
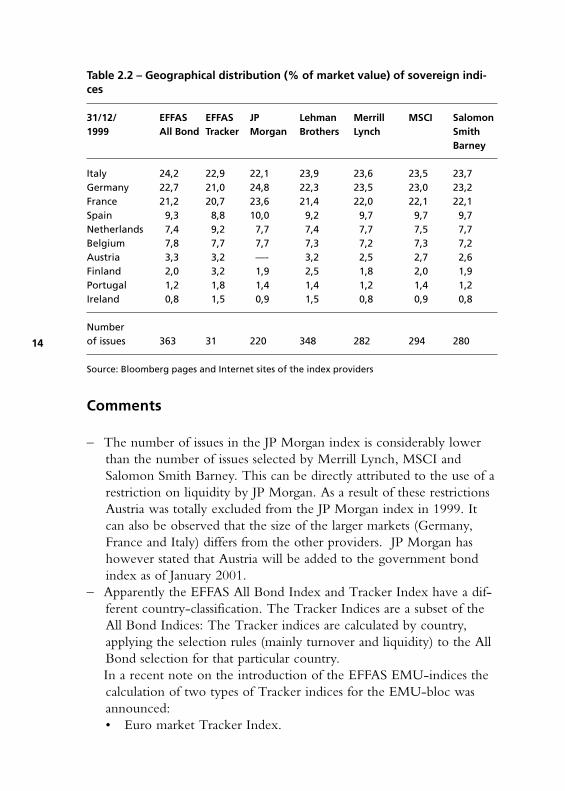
Table 2.2 – Geographical distribution (% of market value) of sovereign indi-ces
31/12/ EFFAS EFFAS JP Lehman Merrill MSCI Salomon1999 All Bond Tracker Morgan Brothers Lynch Smith
Source: Bloomberg pages and Internet sites of the index providers
Comments
– The number of issues in the JP Morgan index is considerably lowerthan the number of issues selected by Merrill Lynch, MSCI andSalomon Smith Barney. This can be directly attributed to the use of arestriction on liquidity by JP Morgan. As a result of these restrictionsAustria was totally excluded from the JP Morgan index in 1999. Itcan also be observed that the size of the larger markets (Germany,France and Italy) differs from the other providers. JP Morgan hashowever stated that Austria will be added to the government bondindex as of January 2001.
– Apparently the EFFAS All Bond Index and Tracker Index have a dif-ferent country-classification. The Tracker Indices are a subset of theAll Bond Indices: The Tracker indices are calculated by country,applying the selection rules (mainly turnover and liquidity) to the AllBond selection for that particular country.In a recent note on the introduction of the EFFAS EMU-indices thecalculation of two types of Tracker indices for the EMU-bloc wasannounced:• Euro market Tracker Index.
14
bondindiceseurozone 25-01-2001 16:06 Pagina 14
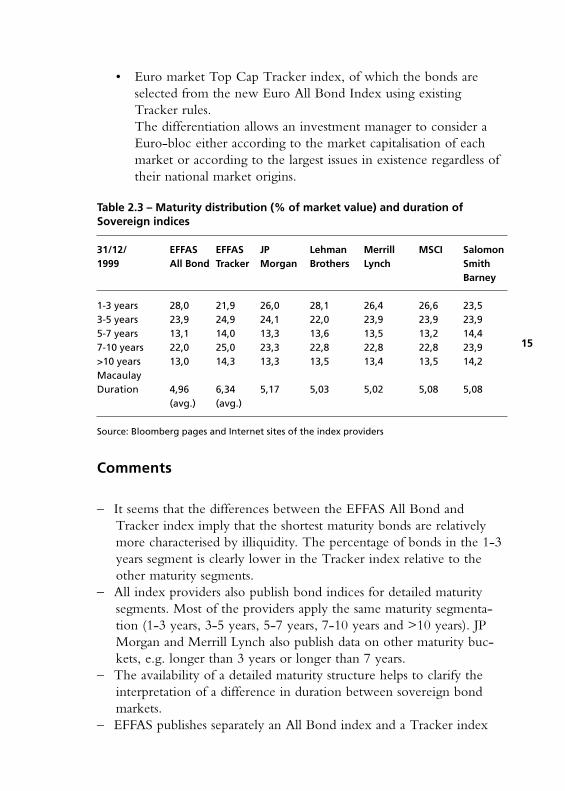
• Euro market Top Cap Tracker index, of which the bonds areselected from the new Euro All Bond Index using existingTracker rules.The differentiation allows an investment manager to consider aEuro-bloc either according to the market capitalisation of eachmarket or according to the largest issues in existence regardless oftheir national market origins.
Table 2.3 – Maturity distribution (% of market value) and duration ofSovereign indices
31/12/ EFFAS EFFAS JP Lehman Merrill MSCI Salomon1999 All Bond Tracker Morgan Brothers Lynch Smith
Barney
1-3 years 28,0 21,9 26,0 28,1 26,4 26,6 23,53-5 years 23,9 24,9 24,1 22,0 23,9 23,9 23,95-7 years 13,1 14,0 13,3 13,6 13,5 13,2 14,47-10 years 22,0 25,0 23,3 22,8 22,8 22,8 23,9>10 years 13,0 14,3 13,3 13,5 13,4 13,5 14,2Macaulay Duration 4,96 6,34 5,17 5,03 5,02 5,08 5,08
(avg.) (avg.)
Source: Bloomberg pages and Internet sites of the index providers
Comments
– It seems that the differences between the EFFAS All Bond andTracker index imply that the shortest maturity bonds are relativelymore characterised by illiquidity. The percentage of bonds in the 1-3years segment is clearly lower in the Tracker index relative to theother maturity segments.
– All index providers also publish bond indices for detailed maturitysegments. Most of the providers apply the same maturity segmenta-tion (1-3 years, 3-5 years, 5-7 years, 7-10 years and >10 years). JPMorgan and Merrill Lynch also publish data on other maturity buc-kets, e.g. longer than 3 years or longer than 7 years.
– The availability of a detailed maturity structure helps to clarify theinterpretation of a difference in duration between sovereign bondmarkets.
– EFFAS publishes separately an All Bond index and a Tracker index
15
bondindiceseurozone 25-01-2001 16:06 Pagina 15
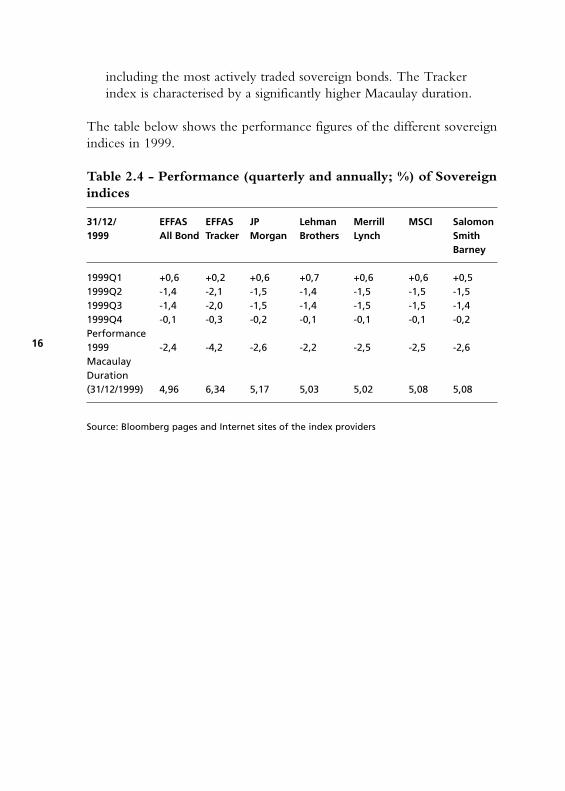
including the most actively traded sovereign bonds. The Trackerindex is characterised by a significantly higher Macaulay duration.
The table below shows the performance figures of the different sovereignindices in 1999.
Table 2.4 - Performance (quarterly and annually; %) of Sovereign
indices
31/12/ EFFAS EFFAS JP Lehman Merrill MSCI Salomon1999 All Bond Tracker Morgan Brothers Lynch Smith
Source: Bloomberg pages and Internet sites of the index providers
16
bondindiceseurozone 25-01-2001 16:06 Pagina 16
3 Credit Indices for the Euro zone
This section considers the most widely used Credit indices for the Eurozone. Since the start of the Euro in January 1999, many new indiceshave been introduced for the EMU bond markets. Moreover, some exis-ting indices had been adjusted for the new environment of the Europeancapital markets. Credit Indices in particular have enjoyed a growing inte-rest amongst international investors, reflecting the greater activity in non-sovereign issuance. This can be explained by:– Reduction or elimination of convergence opportunities between the
EMU-11 bond markets;– Low historical levels of interest rates inducing a larger demand for
higher yielding bonds;– A broader Euro market gives more room for sector and issuer diversi-
fication with respect to default risk.
The table on the next two pages summarises the current selection criteriaof the Credit Indices for the Euro zone.
17
bondindiceseurozone 25-01-2001 16:06 Pagina 17
18
Tab
le 3
.1 -
Cre
dit
Ind
ices
fo
r th
e Eu
ro z
on
e
Cri
teri
aLe
hm
an
M
err
ill
Lyn
chM
SC
ISalo
mo
n S
BB
roth
ers
Size
> E
uro
150
mln
Eu
ro
> E
uro
100
mln
(B
road
>
Eu
ro 2
00 m
ln C
orp
ora
te>
Eu
ro 5
00 m
ln
Ag
gre
gat
e su
b in
dic
esM
arke
t In
dex
) Eu
rob
on
ds
> E
uro
500
mln
Eu
ro>
Eu
ro 5
00 m
ln (
Larg
e >
Eu
ro 2
50 m
ln N
on
-co
rp.
Ag
gre
gat
e ‘5
00M
M
Cap
Ind
ex)
Euro
bo
nd
so
uts
tan
din
g’ s
ub
ind
ices
> E
uro
500
mln
Pfa
nd
bri
efe
> E
uro
1b
ln s
ove
reig
ns
Au
s.,
Bel
g.,
Fin
lan
d &
Po
rtu
gal
> E
uro
1,5
bln
oth
er
sove
reig
ns
Rat
ing
–In
vest
men
t G
rad
e is
sues
–
Inve
stm
ent
Gra
de
issu
es
–In
vest
men
t G
rad
e is
sues
–In
vest
men
t G
rad
e is
sue
–N
on
-rat
ed b
on
ds
in
–N
on
-rat
ed b
on
ds
–N
on
-rat
ed b
on
ds
Sove
reig
n, S
up
ran
atio
nal
in
Qu
asi S
ove
reig
ns
in S
ove
reig
n, S
up
ra-
& C
olla
tera
lised
sec
tors
an
d P
fan
db
rief
e se
cto
rs
nat
ion
al, G
ove
rnm
ent
if is
suer
has
an
if
issu
er/P
fan
db
rief
G
uar
ante
ed, J
um
bo
in
vest
men
t g
rad
e ra
tin
gra
tin
g is
inve
stm
ent
& G
lob
al P
fan
db
rief
e s
ecto
rsg
rad
e
Rem
ain
ing
tim
e to
mat
uri
ty>
1 y
ear
> 1
yea
r>
2 y
ears
> 1
yea
r
bondindiceseurozone 25-01-2001 16:06 Pagina 18
19
Tab
le 3
.1 -
(co
nti
nu
ed)
Cri
teri
aLe
hm
an
M
err
ill
Lyn
chM
SC
ISalo
mo
n S
BB
roth
ers
Mat
uri
ty t
ype
Fixe
d R
ate,
no
ass
et b
acke
dFi
xed
Rat
e Eu
rob
on
ds
Fixe
d r
ate
Stra
igh
t B
ulle
tFi
xed
rat
e Eu
rob
on
ds
and
do
mes
tic
bo
nd
san
d d
om
esti
c b
on
ds;
o
pti
on
s al
low
ed
Rei
nve
stm
ent
Rei
nve
stm
ent
in
Rei
nve
sted
at
Wit
hin
a m
on
th
Wit
hin
a m
on
tho
f in
teri
m
a fo
llow
ing
mo
nth
dep
osi
t ra
te u
nti
l re
inve
stm
ent
in
rein
vest
men
t in
ca
sh f
low
sn
ext
mo
nth
en
d
mo
ney
mar
ket
mo
ney
mar
ket
Reb
alan
cin
gLa
st t
rad
ing
day
of
the
Last
cal
end
ar d
ay o
f th
eLa
st t
rad
ing
day
of
the
25th
of
each
mo
nth
m
on
thm
on
thm
on
th
Sou
rces
of
Ow
n t
rad
ers
and
th
ird
O
wn
tra
der
s p
rice
s an
dLa
rges
t p
art
ow
n t
rad
ers
Ow
n t
rad
ers
pri
ces
on
lyp
rice
sp
arti
es p
rice
s, m
atri
x la
rges
t p
art
thir
d p
arti
esp
rice
s, s
mal
l par
tp
rice
s f
or
rela
tive
ly
pri
ces
thir
d p
arti
es p
rice
sill
iqu
id b
on
ds
Sou
rce:
Ind
ex p
rovi
der
pu
blic
atio
ns
and
(5)
bondindiceseurozone 25-01-2001 16:06 Pagina 19
Comments
– Although the rules for the selection of bonds, rebalancing and themethod of calculation are objective and clear, the application of thecriteria can lead to discrepancies between the various providers andcan cause differences in composition between the indices.
– In particular, the different definitions of rating criterions the indexproviders use are rather confusing. Historically, the Merrill LynchBroad Market Index included non-rated bonds in the corporate sec-tor. Recently, though, Merrill Lynch has announced that the indexrules on the rating criteria will be changed from September 30, 2000.If bonds within the corporate sector - including financial, non-finan-cial and asset-backed securities – are not rated by Moody’s or S&P,the bonds will be excluded from the index in the future. Bonds wit-hin the Quasi-Government and Pfandbriefe sector that do not haveindividual bond ratings can still qualify for the index in the future ifthey have an investment grade senior unsecured debt issuer rating orPfandbrief rating from either Moody’s or S&P (12). These rules arealso applied to the Merrill Lynch Large Cap Index. Lehman Brothers includes bonds in their indices if the issuer has anofficial rating, while the particular bond does not have to be officiallyrated. This rule however only applies for the sovereign, supranationaland collateralised bonds in the Lehman Brothers index and not forthe corporate bonds. Salomon Smith Barney also include non-rated bonds in their indicesin the sovereign, supranational, government guaranteed andPfandbriefe sectors.
– Indices including issues with an outstanding volume of > Euro 500million are generally easier to track than indices that also include issu-es with lower outstanding volumes. Replication of indices with alower threshold (Euro 100 million) is more difficult. However, therelative illiquid character of the credit market makes large transactioncosts (bid-offer spreads) in all cases unavoidable. Generally, it is notpossible to buy all the bonds that have been selected for the creditindices that are currently available for the Euro zone. This holds forboth the larger and smaller indices because of a lack of liquidity andthe high number of bonds included in the indices. By far the largestnumber of issues, almost 5000 at the end of 1999, are included in theMerrill Lynch Broad Market index. In all cases the number of bonds
20
bondindiceseurozone 25-01-2001 16:06 Pagina 20
included in the credit indices are still increasing because the Euro cre-dit market is a fast growing market.
– All indices are based on daily prices and most of the providers con-firm the use of trader prices. Lehman Brothers also makes use ofmatrix pricing.
– MSCI is the only index provider that differs in issue size restrictionsbetween industry sectors. The other providers all have a general res-triction on issue size for their indices.
– Lehman Brothers changed the Euro Aggregate Index rules on 1October 1999. From that day they raised the issue size requirementfrom Euro 100 million to Euro 150 million. According to LehmanBrothers this change would enhance their ability to price properly allindex securities in a timely fashion.
– As already mentioned in the introductory chapter Lehman Brothersalso publishes data of the Euro Aggregate Index including only bondswith an outstanding volume of 500 million Euro or more. As the dataon this index are less detailed in the publications, we decided not totake this index into account in our analysis.
– As mentioned in the introductory chapter Lehman Brothers does notpublish an explicit non-government bond index (‘credit index’), butdoes publish indices concerning different credit sectors. Because thereare no official data published on a Lehman Brothers Credit Index,and an investor would need to make some calculations to combinethe different sub indices, we have chosen not to give details on theLehman Brothers indices in the following analysis on credit indices.We will discuss the Lehman Brothers Euro Aggregate Index in depthin chapter 4.
Table 3.2 shows the different broad industry sector sub indices and ratingcategories per index provider. Concerning the credit ratings it is to be noticed that the index providersoften give implicit ratings to bonds in the categories Sovereign,Government Guaranteed, Supranational and Pfandbriefe that are not offi-cially rated. Generally, they do not publish separate explicit data on thenon-rated category, so that it is difficult for the investor to see whichpart of the bonds included in the index is rated and which part is not.
21
bondindiceseurozone 25-01-2001 16:06 Pagina 21
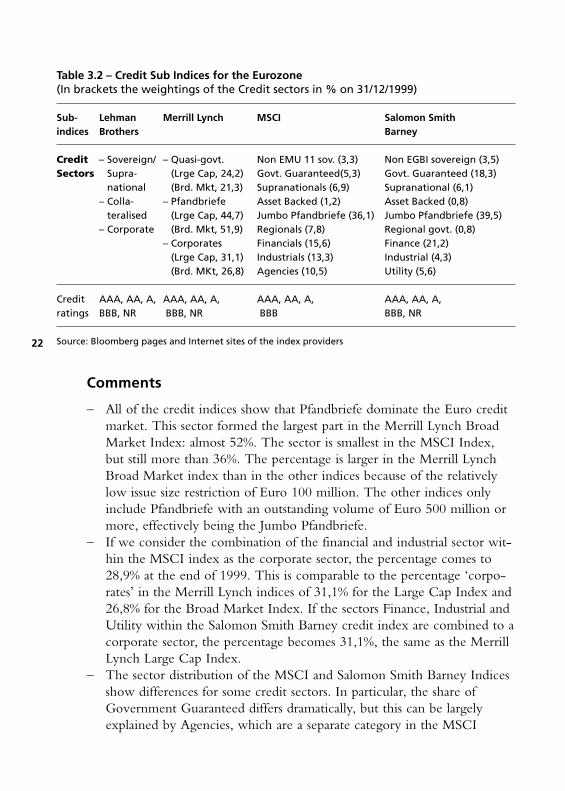
Table 3.2 – Credit Sub Indices for the Eurozone(In brackets the weightings of the Credit sectors in % on 31/12/1999)
Sub- Lehman Merrill Lynch MSCI Salomon Smith indices Brothers Barney
Credit – Sovereign/ – Quasi-govt. Non EMU 11 sov. (3,3) Non EGBI sovereign (3,5)Sectors Supra- (Lrge Cap, 24,2) Govt. Guaranteed(5,3) Govt. Guaranteed (18,3)
Credit AAA, AA, A, AAA, AA, A, AAA, AA, A, AAA, AA, A, ratings BBB, NR BBB, NR BBB BBB, NR
Source: Bloomberg pages and Internet sites of the index providers
Comments
– All of the credit indices show that Pfandbriefe dominate the Euro creditmarket. This sector formed the largest part in the Merrill Lynch BroadMarket Index: almost 52%. The sector is smallest in the MSCI Index,but still more than 36%. The percentage is larger in the Merrill LynchBroad Market index than in the other indices because of the relativelylow issue size restriction of Euro 100 million. The other indices onlyinclude Pfandbriefe with an outstanding volume of Euro 500 million ormore, effectively being the Jumbo Pfandbriefe.
– If we consider the combination of the financial and industrial sector wit-hin the MSCI index as the corporate sector, the percentage comes to28,9% at the end of 1999. This is comparable to the percentage ‘corpo-rates’ in the Merrill Lynch indices of 31,1% for the Large Cap Index and26,8% for the Broad Market Index. If the sectors Finance, Industrial andUtility within the Salomon Smith Barney credit index are combined to acorporate sector, the percentage becomes 31,1%, the same as the MerrillLynch Large Cap Index.
– The sector distribution of the MSCI and Salomon Smith Barney Indicesshow differences for some credit sectors. In particular, the share ofGovernment Guaranteed differs dramatically, but this can be largelyexplained by Agencies, which are a separate category in the MSCI
22
bondindiceseurozone 25-01-2001 16:06 Pagina 22
index. Furthermore, there are differences in the definition ofFinancials and Industrials, while Salomon Smith Barney also distin-guishes the category of Utilities. Also noticeable is the difference inthe sector Regionals, which is clearly larger within the MSCI index.This can be explained by the difference in issue size restriction.
The table below outlines the development of the sector classification ofthe Merrill Lynch Credit Indices during 1999. For a detailed definitionof the levels of sectors by Merrill Lynch, see Annex 1 of this report.
Table 3.3 – Distribution (%) into sectors of the Merrill Lynch Credit Indices
ML EMU Large Cap ML EMU (Broad Market) Non-Sovereign Index Non-Sovereign Index
The sector Corporates is becoming of increasing importance, while thepercentage of Quasi Governments is decreasing. The percentage ofPfandbriefe in the index was relatively constant in 1999.
In the next table the distribution by rating categories is shown for theCredit Indices of the various index providers.
Table 3.4 - Distribution (%) of Credit Indices by rating categories
Source: Bloomberg pages and Internet sites of the index providers
23
bondindiceseurozone 25-01-2001 16:06 Pagina 23
Comments
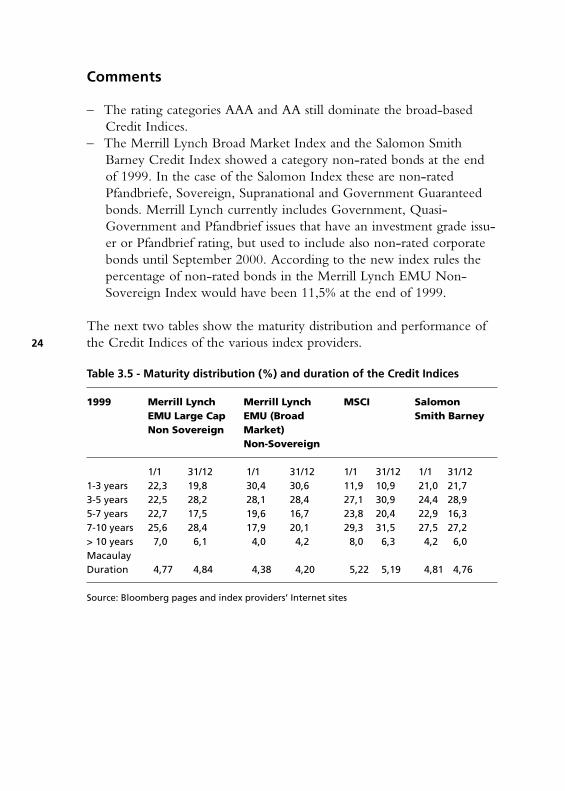
– The rating categories AAA and AA still dominate the broad-basedCredit Indices.
– The Merrill Lynch Broad Market Index and the Salomon SmithBarney Credit Index showed a category non-rated bonds at the endof 1999. In the case of the Salomon Index these are non-ratedPfandbriefe, Sovereign, Supranational and Government Guaranteedbonds. Merrill Lynch currently includes Government, Quasi-Government and Pfandbrief issues that have an investment grade issu-er or Pfandbrief rating, but used to include also non-rated corporatebonds until September 2000. According to the new index rules thepercentage of non-rated bonds in the Merrill Lynch EMU Non-Sovereign Index would have been 11,5% at the end of 1999.
The next two tables show the maturity distribution and performance ofthe Credit Indices of the various index providers.
Table 3.5 - Maturity distribution (%) and duration of the Credit Indices
1999 Merrill Lynch Merrill Lynch MSCI Salomon EMU Large Cap EMU (Broad Smith BarneyNon Sovereign Market)
Source: Bloomberg pages and index providers’ Internet sites
24
bondindiceseurozone 25-01-2001 16:06 Pagina 24
Comments
– The MSCI index consists of a relatively small number of bonds witha maturity of 1 to 3 years and a relatively large number with a matu-rity longer than 10 years. The reason is that MSCI as the only provi-der only includes bonds with a maturity longer than 2 years instead of 1 year. The resulting duration of the overall MSCI credit index is alsolongest among the four indices.
– The Merrill Lynch Broad Market Index shows by far the lowest dura-tion and the largest percentage of bonds in the shortest maturity buc-ket. This can be explained by the lower size restriction for includingbonds in the index compared with the other indices.
– The Merrill Lynch EMU Large Cap Non-Sovereign Index and theSalomon Smith Barney Credit (Non-EGBI EuroBIG) Index havevery similar characteristics because similar restrictions are used forincluding bonds in the index.
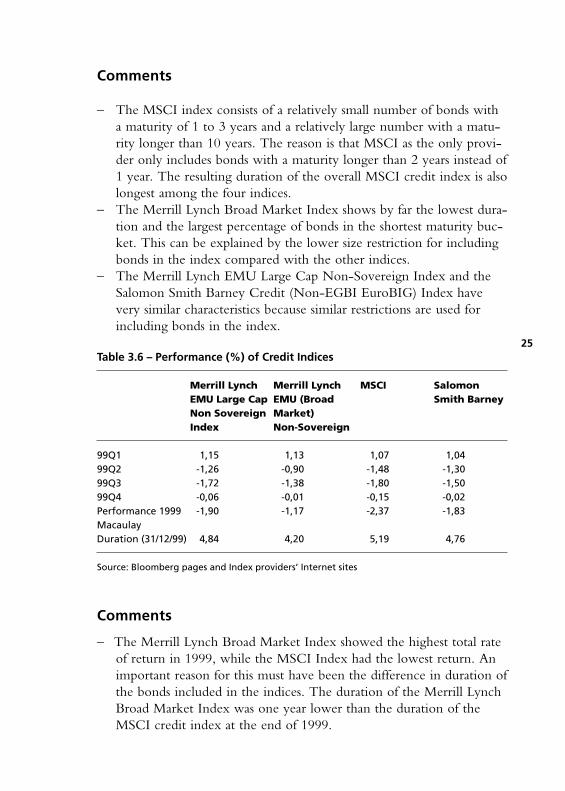
Table 3.6 – Performance (%) of Credit Indices
Merrill Lynch Merrill Lynch MSCI SalomonEMU Large Cap EMU (Broad Smith BarneyNon Sovereign Market)Index Non-Sovereign
Source: Bloomberg pages and Index providers’ Internet sites
Comments
– The Merrill Lynch Broad Market Index showed the highest total rateof return in 1999, while the MSCI Index had the lowest return. Animportant reason for this must have been the difference in duration ofthe bonds included in the indices. The duration of the Merrill LynchBroad Market Index was one year lower than the duration of theMSCI credit index at the end of 1999.
25
bondindiceseurozone 25-01-2001 16:06 Pagina 25
4 Euro Composite Indices
The following index providers currently publish so called composite bondindices, which consist of Euro denominated government bonds and creditbonds:– Lehman Brothers: Euro Aggregate Index– Merrill Lynch: EMU Broad Market Index and EMU Large Cap index – MSCI: Investment Grade Euro Credit Index– Salomon Smith Barney: Euro Broad Investment Grade (EuroBIG)
Index
Although the name ‘MSCI Investment Grade Euro Credit Index’ mightsuggest it is a credit index, it is in fact a composite index, including Eurosovereign bonds. The pure credit index is called ‘MSCI Investment GradeEuro Credit Index less E-11 sovereigns’.
Deutsche Bank, JP Morgan and EFFAS are still in the process of develo-ping a composite index. As said earlier the indices that have been publis-hed by Bear Stearns are not widely used and will not be evaluated in ourreport.
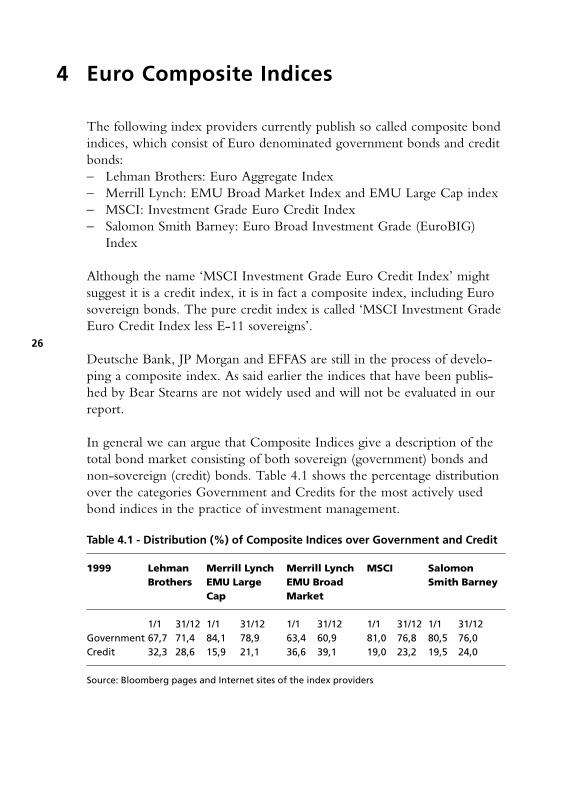
In general we can argue that Composite Indices give a description of thetotal bond market consisting of both sovereign (government) bonds andnon-sovereign (credit) bonds. Table 4.1 shows the percentage distributionover the categories Government and Credits for the most actively usedbond indices in the practice of investment management.
Table 4.1 - Distribution (%) of Composite Indices over Government and Credit
1999 Lehman Merrill Lynch Merrill Lynch MSCI SalomonBrothers EMU Large EMU Broad Smith Barney
Source: Bloomberg pages and Internet sites of the index providers
26
bondindiceseurozone 25-01-2001 16:06 Pagina 26
Comments
– At the end of 1999 the percentage of government bonds in the Composite Indices varies between 60,9 and 78,9. Most indices showan increasing percentage in credit bonds in 1999. The government partof the index only increases in the Lehman Brothers index. This can beexplained by the increase in the issue size requirement in the course of1999.
– The Merrill Lynch Broad Market index is characterised by a relativelylarger percentage of credit bonds. The reason is the lower issue sizecompared to the other indices that is used as a selection criterion forincluding bonds.
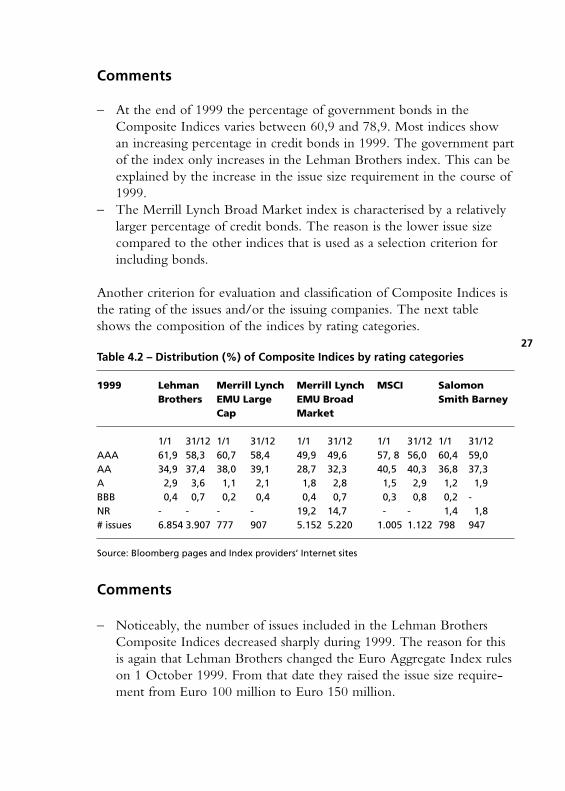
Another criterion for evaluation and classification of Composite Indices isthe rating of the issues and/or the issuing companies. The next tableshows the composition of the indices by rating categories.
Table 4.2 – Distribution (%) of Composite Indices by rating categories
1999 Lehman Merrill Lynch Merrill Lynch MSCI SalomonBrothers EMU Large EMU Broad Smith Barney
Source: Bloomberg pages and Index providers’ Internet sites
Comments
– Noticeably, the number of issues included in the Lehman BrothersComposite Indices decreased sharply during 1999. The reason for thisis again that Lehman Brothers changed the Euro Aggregate Index ruleson 1 October 1999. From that date they raised the issue size require-ment from Euro 100 million to Euro 150 million.
27
bondindiceseurozone 25-01-2001 16:06 Pagina 27
– As a result of the lower issue size restrictions there are four to fivetimes as many bonds included in the Lehman Brothers and theMerrill Lynch Broad Market Index than in the other indices.
– For the purposes of classification, where there is a split rating,Lehman Brothers uses Moody’s rating whilst Salomon Smith Barneyuses S&P’s rating. MSCI uses a composite rating – that is the lower ofthe two ratings is selected as the credit bucket (1). Merrill Lynch usesa composite rating that is an average of Moody’s and S&P.
– By far the largest part of the indices still consists of high-grade creditbonds in the AAA and AA category (more than 95%). Only theMerrill Lynch Broad Market Index consisted of a slightly lower per-centage of AAA and AA bonds, namely 80%. According to the newMerrill Lynch Broad Market Index rules, however, this percentagewould have been 91,9% at the end of 1999, which makes the diffe-rence with the other indices smaller.
– It can be observed from the table that especially the percentage of Aand BBB bonds in the Composite Indices has risen in the course of1999 due to a strong increase in new issuance for these rating catego-ries.
In the following tables an overview of the sector distribution is given forthe different composite indices. Table 4.3.1 shows the distribution of the Lehman Aggregate Index overthe four main sectors. Lehman Brothers also provides figures on a moredetailed level as shown in table 4.3.2.
Table 4.3.1 - Sector distribution (%) of Lehman Brothers Aggregate Index(Composite)
1/1/1999 31/12/1999
Government 68,3 71,4Sovereign/Supranational 3,6 3,5Corporate 11,3 11,1Collateralized 16,8 14,0
Source: Internet site Lehman Brothers
28
bondindiceseurozone 25-01-2001 16:06 Pagina 28
Table 4.3.2 - Detailed sector distribution of the Lehman Brothers AggregateIndex
Government Government Corporate FinancialAgency IndustrialLocal Authority Utility
Sovereign & Sovereign Collateralized PfandbriefeSupranational Supranational Jumbo Pfandbriefe
Foreign Agency Others
Source: Internet site Lehman Brothers
The sector distribution over the four main sectors of the two MerrillLynch Composite Indices is given in the following table.
Table 4.4 - Sector distribution (%) of Merrill Lynch Composite indices
Merrill Lynch EMU Large Cap Merrill Lynch EMU Broad Market1/1/1999 31/12/1999 1/1/1999 31/12/1999
The Merrill Lynch credit and composite indices can be divided intothree more detailed levels of sector distribution, which are shown inAnnex 1. By far the largest part of the composite indices of MerrillLynch consist of government bonds, although the share of non-govern-ment bonds has increased in 1999. The corporate sector is becomingmore important in the indices. To be noticed is the difference in theweightings of ‘Pfandbriefe’ between the two Merrill Lynch indices. Theweight in the Broad Market Index is twice as high as in the Large CapIndex. The sector Quasi Government includes non-Euro sovereigns,supranationals, regional governments and government guaranteed issuers.
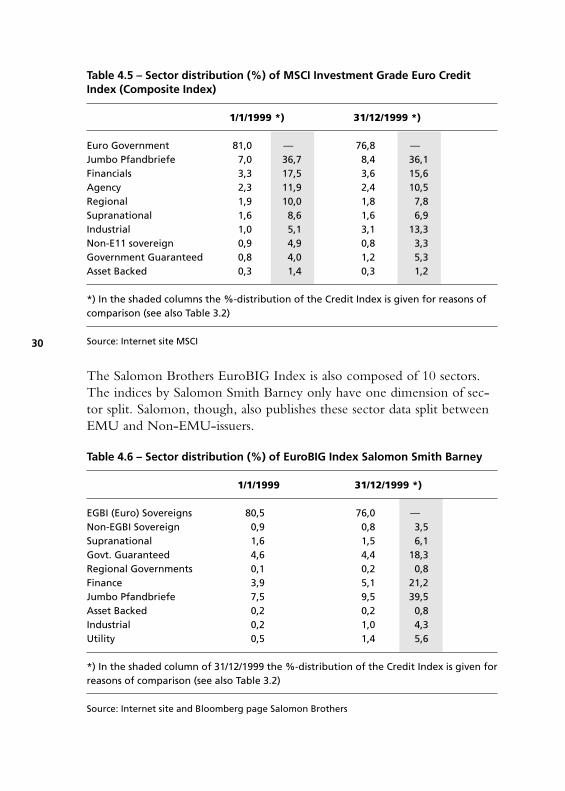
MSCI divides its Investment Grade Euro Credit Index into the following10 sectors.
29
bondindiceseurozone 25-01-2001 16:06 Pagina 29
Table 4.5 – Sector distribution (%) of MSCI Investment Grade Euro CreditIndex (Composite Index)
*) In the shaded columns the %-distribution of the Credit Index is given for reasons ofcomparison (see also Table 3.2)
Source: Internet site MSCI
The Salomon Brothers EuroBIG Index is also composed of 10 sectors.The indices by Salomon Smith Barney only have one dimension of sec-tor split. Salomon, though, also publishes these sector data split betweenEMU and Non-EMU-issuers.
Table 4.6 – Sector distribution (%) of EuroBIG Index Salomon Smith Barney
*) In the shaded column of 31/12/1999 the %-distribution of the Credit Index is given forreasons of comparison (see also Table 3.2)
Source: Internet site and Bloomberg page Salomon Brothers
30
bondindiceseurozone 25-01-2001 16:06 Pagina 30
Comments
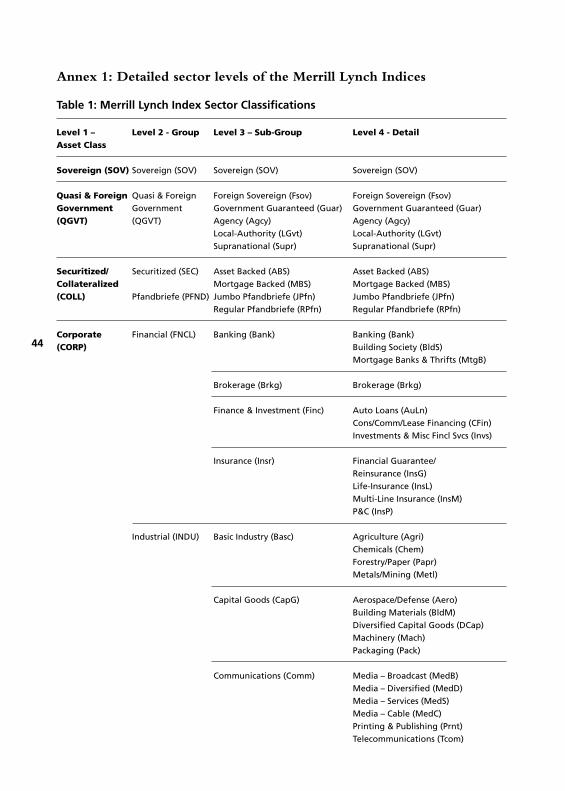
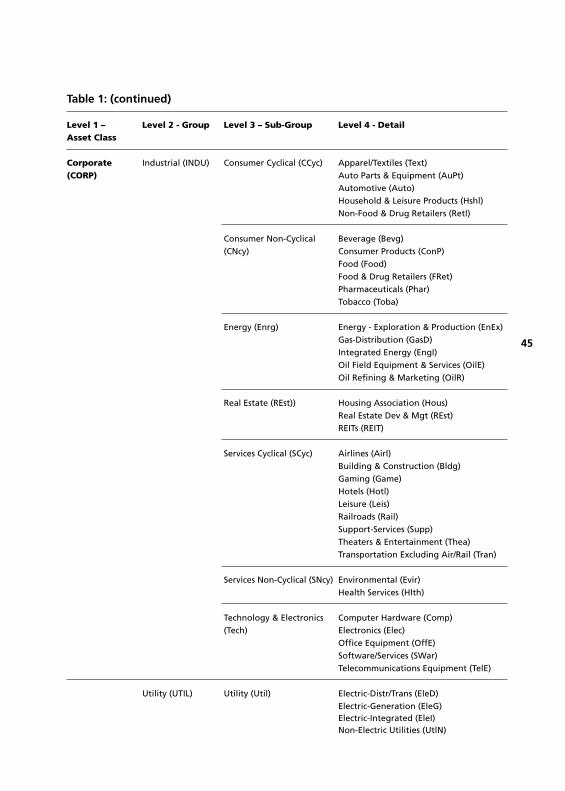
– Merrill Lynch splits their indices into the most detailed level of sectorclassification. Merrill publishes data on four levels of sector split up:level 1 is the broadest (4 sectors) and level 4 is the most detailed (75sectors) (see Annex 1). All detailed sector data can be found on theirBloomberg pages. MSCI and Salomon Smith Barney split their com-posite indices data, on the detailed level, into 10 sectors and LehmanBrothers into 12 sectors.
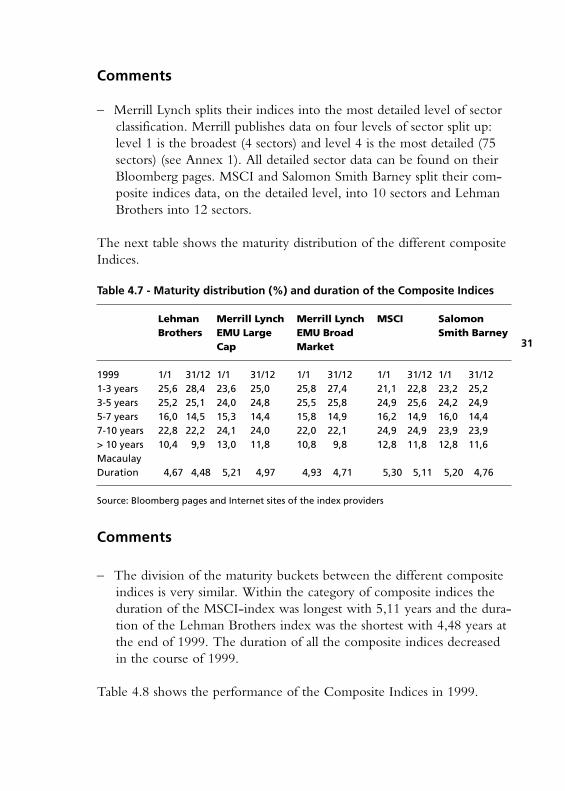
The next table shows the maturity distribution of the different compositeIndices.
Table 4.7 - Maturity distribution (%) and duration of the Composite Indices
Lehman Merrill Lynch Merrill Lynch MSCI SalomonBrothers EMU Large EMU Broad Smith Barney
Source: Bloomberg pages and Internet sites of the index providers
Comments
– The division of the maturity buckets between the different compositeindices is very similar. Within the category of composite indices theduration of the MSCI-index was longest with 5,11 years and the dura-tion of the Lehman Brothers index was the shortest with 4,48 years atthe end of 1999. The duration of all the composite indices decreasedin the course of 1999.
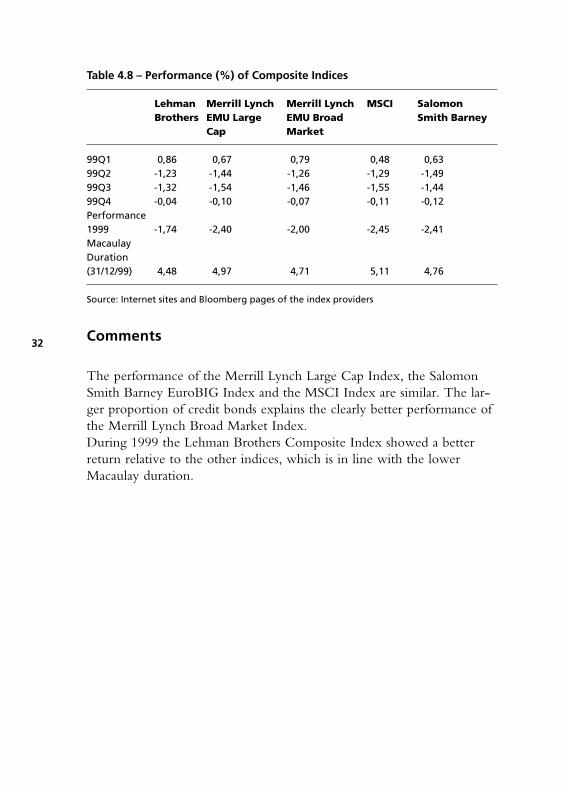
Table 4.8 shows the performance of the Composite Indices in 1999.
31
bondindiceseurozone 25-01-2001 16:06 Pagina 31
Table 4.8 – Performance (%) of Composite Indices
Lehman Merrill Lynch Merrill Lynch MSCI SalomonBrothers EMU Large EMU Broad Smith Barney
Source: Internet sites and Bloomberg pages of the index providers
Comments
The performance of the Merrill Lynch Large Cap Index, the SalomonSmith Barney EuroBIG Index and the MSCI Index are similar. The lar-ger proportion of credit bonds explains the clearly better performance ofthe Merrill Lynch Broad Market Index. During 1999 the Lehman Brothers Composite Index showed a betterreturn relative to the other indices, which is in line with the lowerMacaulay duration.
32
bondindiceseurozone 25-01-2001 16:06 Pagina 32
5 Conclusions on Euro Zone Indices and DCB-recommendations
The relevance of an index for an investor depends on the aims he wantsto use the index for. It makes a difference, for instance, if an investorwould like to use the index as the basis of an index-tracking fund or asan analytical tool to compare different segments of the market for anactively managed bond portfolio. The choice for an index thus dependson the investment strategy and objectives of the investor. This is thereason why it is difficult to make a general recommendation to investorson the index choice for their fixed income portfolio in the Euro zone.Below we will summarise and evaluate the characteristics of the differentEuro indices against the criteria that have been mentioned in the intro-duction. We will thereby refer to issues that are important for investorsto consider when choosing a relevant benchmark index. Considering hisinvestment strategy, the individual investor has to decide about theimportance of the different criteria by which the indices are judged.
Transparency
– The methodology of index calculation and the applied selection crite-ria are for the largest part quite clear in the descriptions of the variousindex providers. To completely understand these selection criteria,though, the investor in most cases needs an Index Catalogue from theprovider in which the rules are explained. EFFAS explains its rules onits Bloomberg pages, which are available to all Bloomberg users.Furthermore, the selection criteria and the method of calculation aredescribed in an official EFFAS-guide on bond indices (2). MerrillLynch publishes a Rules and Definitions report explaining construc-tion rules and calculation methodology which can be downloadedfrom Bloomberg. Furthermore this document is also on the publicMerrill Lynch website (www.ml.com), which is accessible to everyo-ne. MSCI explains the main rules for the calculations of their indiceson their Internet site that is freely accessible. Salomon Smith Barneyand Lehman Brothers publish a report on the methodology on theirInternet sites, which are accessible to authorised users.
– One of the characteristics that can be confusing for investors is therating criterion. The Merrill Lynch Broad Market Index used toinclude non-rated corporate bonds. As mentioned before, though,
33
bondindiceseurozone 25-01-2001 16:06 Pagina 33
Merrill Lynch has recently announced a change in the index rules bywhich corporate sector bonds which are not rated will be excludedfrom the index from September 30, 2000. However, bonds withinthe quasi-government and Pfandbriefe sectors that do not have arating can still be included in the index from that date if the debtissuer has a senior secured debt rating or Pfandbriefe rating. Thesame rules apply to the Merrill Lynch Large Cap Index. LehmanBrothers and Salomon Smith Barney also include non-rated bonds inthe sovereign, suprantional, government guaranteed, collateralised andPfandbriefe sectors. Generally, the index providers often give implicitratings to bonds that are not officially rated, which makes it difficultfor the investor to see which part of the bonds included in the indexis rated and which part is not.
– The price source and as a result prices differ widely between theindex providers as all of them, except EFFAS, use their own tradingprices for a substantial part of the bonds included in the indices.Partly also third parties prices are used. Lehman Brothers explicitlymentions the use of matrix prices to price relatively illiquid bonds intheir index. To the investor it is not really clear in which case whichprice source is used. However, Salomon indicates that they only usetheir own traders’ prices.
Replicability
– Generally, bond indices containing relatively more large-cap issuescan be replicated more easily. Bonds with a lower issue size are relati-vely illiquid, which makes it more difficult and expensive (unfavoura-ble bid-ask spread) for investors to buy those bonds.
– The lower the restriction on the issue size the more bonds are inclu-ded in the index. The large amount of bonds in itself makes it alsodifficult to replicate the index, e.g. the Lehman Brothers EuroAggregate Index consisted of almost 4.000 issues and the MerrillLynch Broad Market Index of more than 5.000 issues at the end of1999. Lehman Brothers, however, published a study on the USMarket, which concludes that it is relatively easy to replicate their USCorporate Index. This index has a market value of approximately 1.1trillion dolllars and consists of 4000 securities. The study showed thata portfolio of about 30 securities can replicate this index with insideof 30 basis points of tracking error (8).
34
bondindiceseurozone 25-01-2001 16:06 Pagina 34
Representativeness
– The larger the size of the individual bonds in an index (Merrill LynchLarge Cap Index and the Salomon Brothers EuroBIG Index), the lar-ger the share of government bonds and high grade bonds is in thatparticular index. Indices that also include bonds with a lower issuesize, are more representative of the total market and are more diver-sified across rating categories, sectors and issuers.
– Concerning Government Bond Indices it has to be mentioned that JPMorgan uses restrictions on liquidity and size to include bonds intheir index. While this is positive for the replicability and investibility,it is negative for the representativeness. The number of issues is con-siderably lower than in the other Government Bond indices and thesize of the markets in the indices differs from the other providers.Austria was until now totally excluded from the index, but JPMorgan stated that Austria will be included in the index from January2001.
Investibility
– Trading in (Euro) credit bonds, and particularly in corporate creditbonds, is influenced negatively by the relative illiquidity of this mar-ket segment. This is the reason why investibility is not in all caseswarranted. Because the liquidity of smaller issues is in general lessthan for larger issues, this problem is larger for indices that includeissues with a lower size (Merrill Lynch Broad Market Index, MSCIInvestment Grade Euro Credit Index and Lehman Euro AggregateIndex). It should be noted that none of the providers of credit andcomposite indices uses an explicit liquidity criterion to include orexclude bonds of their index. However, MSCI makes a difference inissue size per sector of credit bonds.
– Investing in the Euro government bonds seems less of a problem forinvestors, although investing in bonds with a low issue size in thesmaller EMU countries could be difficult because these bonds are lessactively traded. Merrill Lynch and Salomon Smith Barney only inclu-de government bonds in their indices with a size larger than Euro1 billion. Lehman Brothers has a lower issue size criterion of Euro500 million. MSCI uses different standards, dependent on the localmarket. JP Morgan uses restrictions on liquidity and size in its gover-nment bond indices.
35
bondindiceseurozone 25-01-2001 16:06 Pagina 35
Acceptation
– A recent quarterly Euro Magazine survey (3) shows that the indicespublished by Salomon Smith Barney, Merrill Lynch, LehmanBrothers and JP Morgan are most frequently used, but did not provide a Credit Index or a Composite Index until recently.For investors who also invest outside the Euro zone it can be impor-tant that the index provider also publishes data on indices in othercountries. For reasons of uniformity in the use of indices the investormight therefore choose a global index provider. All index providersdiscussed in this report also provide indices outside the Euro zone.
Consistency
– As to the application of the rules and methodology: the consistency intime is difficult to evaluate for the Credit and Composite Indicesbecause of the still rather short history (launch dates: Merrill LynchMarch 1998; MSCI Euro Credit Index November 1998; SalomonSmith Barney EuroBIG January 1999). This also applies to the EMUGovernment Bond Indices. The JP Morgan EMU Government Bondindex and the Merrill Lynch EMU Government Bond Index weree.g. launched in March 1998.
– After the launch of the Composite Indices, Lehman Brothers changedthe rules for their Euro Aggregate Index (on October 1 1999): theissue size requirement was raised from Euro 100 million to Euro 150million. As a consequence the number of issues included in the indexdecreased by 42%. The market value declined by 8,1%. The increaseof the minimum size requirement, though, as Lehman Brothers itselfremarks, was the first upward adjustment in the history of theirEuropean indices (7).
– Merrill Lynch changed the selection criteria for the Broad MarketIndex from September 30, 2000. Bonds within the corporate sectorare no longer be included in the index if they do not have an indivi-dual bond rating. Bonds within the quasi-government and Pfandbriefesector are only included in the index if the issuer has an investmentgrade senior unsecured debt rating or a Pfandbrief rating from eitherMoody’s or S&P. This change resulted in the removal of approximate-ly 369 bonds of the Broad Market Index, representing 3,3% of theIndex. The number of issues decreased by about 7%. Duration charac-teristics and sector weights were largely unaffected (12).
36
bondindiceseurozone 25-01-2001 16:06 Pagina 36
– The Composite Indices should ideally be consisted with both thegovernment and (sub) credit indices. This is the case for all theComposite Indices that we described in this report.
Relevancy
Generally, the relevancy of the indices depends on the investment strate-gy of the fixed income portfolio manager. In other words, every indexanalysed in this report can in principal be relevant for an investor depen-dent on the objectives of the underlying investment strategy. Below wewill refer to some general issues that are important to consider whenchoosing a relevant benchmark index.
Government bonds versus credit bonds
– If investments within the Euro zone only involve Euro governmentbonds, the investor has the possibility to choose between all indexproviders that we analysed. If the investor also invests in Euro creditbonds and would like to have one index provider for the Euro area,EFFAS must be excluded because this provider does not publishCredit Indices or Composite Indices yet. JP Morgan has recentlyannounced the launch of the JP Morgan Aggregate Index Euro(MAGGIE). Data on the new JP Morgan credit and composite indi-ces are published from September 2000. Because of the recent launchthese indices were not yet analysed in this report.
– One of the important features is if the investor is willing to follow acomposite Euro index with market size related weights to gover-nment bonds and credit bonds. If this is the case, it is important tolook at the percentage of credit bonds in the index. The lower theminimum issue size of credit bonds the larger the weight becomes inthe index:• lowest are the Merrill Lynch Large Cap and the Salomon Smith
Barney and MSCI Index. • highest are the Lehman Brothers Aggregate and the Merrill Lynch
Broad Market Index. It has to be noticed however that every Composite Index still consists ofa large part of government bonds. – If the investor decides to attach other than market weights to the
government bonds and credit bonds within the portfolio, it is betterto choose an index provider who also publishes separate data for acredit index. This enables the investor to build a customised govern-
37
bondindiceseurozone 25-01-2001 16:06 Pagina 37
ment and credit bond benchmark based on his specific needs. For theLehman Brothers Aggregate Index there is no separate credit bondindex. The investor can create a credit bond index by combining thepublished sub indices, excluding the Euro sovereign sector. It has tobe noticed, though, that this can be time consuming.
Rated bonds versus non-rated bonds
Another choice within the credit portfolio is whether the investor wouldlike to invest just in credit bonds that have an investment grade rating oralso in bonds that do not have an official rating. If the investor prefers toinvest only in bonds that have an investment grade rating, it is importantto realise that non-rated bonds are included in most indices. The MerrillLynch Broad Market Index consisted for a considerable part of non-ratedbonds (36,4% of the Credit Index at the end of 1999). The part of non-rated bonds within this index, will, however, decline from September30, 2000, when Merrill Lynch adds a rating requirement for the index. Apart of the bonds in the credit (EMU Non-Sovereign Index) and com-posite index (EMU Broad Market Index) will remain non-rated though,because non-rated bonds within the Quasi-Government and Pfandbriefesector are still included in the index if the issuer has an investment gradesenior unsecured debt rating or a Pfandbrief rating from either Moody’sor S&P (12). After the change of the index rules the part of non-ratedbonds within the Merrill Lynch EMU Non Sovereign Index (creditindex) would have been 11,5% at the end of 1999. The Salomon indices also include non-rated bonds (5% of the CreditIndex at the end of 1999) within the Pfandbriefe, Sovereign,Government Guaranteed and Supranational sector. Because Lehman Brothers looks at the rating of the issuer for theSovereign/Supranational and Collateralised sectors, the Lehman indicesalso include non-rated bonds. It is not clear how large the percentage ofnon-rated bonds is in this index.
Diversification and market representativeness versus liquidity
For investors who prefer liquidity and replicability, an index includingonly the larger issues (like the Merrill Lynch Large Cap and the SalomonSmith Barney EuroBIG Index) can best be recommended. However, formanagers who prefer representativeness, an all bond index reflects thecomposition of the total market. In other words: smaller issues are also aninvestment vehicle for fixed income portfolio managers, although theyare not very liquid. Because more bonds are included in the Lehman
38
bondindiceseurozone 25-01-2001 16:06 Pagina 38
Brothers Aggregate Index and the Merrill Lynch Broad Market Index,the credit part of the index is also more diversified in industry sectors,ratings and issuers.
Specific market segments strategy
The criteria Relevancy and Flexibility are closely related. Clientsapplying specific strategies often need detailed indices data. Within thecredit bond portfolio it is important to know how deep the investorwould like to look into the sector classification. Merrill Lynch publishesby far the most detailed data on sector split up of the indices. The otherindices are comparable on the detail of sector classification (10 to 12 sec-tors).
Flexibility
– All Composite and Credit Index providers distinguish the followingsegmentations: maturity buckets, rating categories and industry sec-tors. JP Morgan and EFFAS publish data on the different maturitybuckets and countries for their government bond indices.
– As to the classification into rating categories generally the categoriesAAA, AA, A and BBB are distinguished. Merrill Lynch also publishesfurther partitions of data within these main rating categories (e.g. Aa1,Aa2,...), which can be derived from using the analytics of the indexsystem in Bloomberg.
– The industry classification differs per provider:• The Salomon Smith Barney EuroBIG Index and the MSCI Index
distinguish the indices into 10 sectors; Lehman Brothers distin-guishes 12 sectors.
• Merrill Lynch can deliver the most detailed data about performan-ce and characteristics, namely on 4 levels of industry sectors (firstlevel: 4 industry sectors; second level: 7 industry sectors; thirdlevel: breakdown to 25 sectors; fourth level: 75 sectors).
Availability
In general there is no single source containing all information on theindices, except for the EFFAS index:– The description of the methodology of index calculation and the data
on the EFFAS indices are fully and freely available on their Bloombergpages, but only to Bloomberg users.
39
bondindiceseurozone 25-01-2001 16:06 Pagina 39
– JP Morgan provides general information on returns and duration oftheir EMU Government Bond Indices on Reuters. More, but not all,information is given on Bloomberg and available to all Bloombergusers. For clients who have a username and password detailed infor-mation is available on the JP Morgan Internet site. JP Morgan is cur-rently the only provider who also provides information on the indivi-dual bond level through the website.
– Lehman Brothers has an Index Subscription Service where onlyclients have access to daily (and historical) index data on Reuters,Bloomberg, the Internet site and via monthly publications or researchreports.
– Both recent and historical total returns and characteristics of theMSCI indices are published on Bloomberg and the MSCI Internetsite. The information is available for industry sectors and maturitybuckets. The MSCI data on Bloomberg and the Internet are generallyaccessible without passwords.• The MSCI Internet site gives information on the most recent
monthly and daily performance of the indices (total and by sector,maturity and country), but no history. The historical data can befound on the Bloomberg pages.
• On special request MSCI can send data files by e-mail with moredetailed data on the indices.
– Merrill Lynch provides very detailed data and a publication on themethodology on their Bloomberg pages to all investors and authori-sed brokers who use Bloomberg. Merrill also publishes the rules, cal-culation methodology and index results on a public website(www.ml.com). The data on Bloomberg (code IND) are delivered by maturity buc-ket, rating category and industry sector, but also on the individualbond level. • Daily performance data, but no historical data of the Merrill
Lynch Broad Market Index are also shown on Reuters by maturi-ty buckets and sector.
• The Merrill Lynch Internet site contains an annual publicationincluding characteristics and performance during the past year.
– Daily and monthly total returns and other characteristics of theSalomon Smith Barney indices are available on Bloomberg. The dataare provided by maturity bucket, rating category and industry sector.Most characteristics (monthly profile) can also be found in detail onthe Salomon Smith Barney Internet site. A disadvantage is that there
40
bondindiceseurozone 25-01-2001 16:06 Pagina 40
is no breakdown on an individual bond level yet and that historicalreports, older than a few months, are removed from the Internet site.For clients of Salomon Smith Barney it is possible to receive historicaldata and information on individual bond level by e-mail.
Price Quality
– The rules of the index providers seem to warrant that the prices ofthe bonds are set in a consistent way. • EFFAS uses Bloomberg Generic Prices for their indices. These
prices can be considered as market consensus prices, which arecalculated by using prices contributed to Bloomberg. The actualmethodology is proprietary and depends on the type of pricingand the markets involved. Generally, these prices can be conside-red as market realisable if liquid government bonds are concerned.
• JP Morgan uses for 90% own traders’ prices and for 10% thirdparties prices.
• Lehman Brothers uses, in fixed percentages, prices from their owntraders, third parties and matrix prices for the relatively illiquidbonds.
• MSCI uses the prices of their own traders for by far the largestpart, while they rely on local market makers for a small percentageof the bonds (in the Composite Index 96% own traders’ pricesand 4% local market makers prices).
• Merrill Lynch uses their own traders’ prices for a part of the bondsincluded in their index and for the larger part third parties prices.
• Salomon Smith Barney fully uses the prices of their own traders.– Because credit bonds are generally less actively traded, large differen-
ces in prices between banks and brokers can create a difference inperformance of the benchmark and the portfolio. These differenceswill be largest if you compare daily data. Probably the differences aresmaller if returns are calculated on a monthly or annual basis.
– It is not easy to see which index provider uses the best price sources.In all cases it is difficult for an investor to check if the used pricesrepresent realistic market prices, especially for credit bonds. Because itis unlikely that traders within one organisation can provide prices forall the bonds in the index, the use of third party prices and matrixprices is often inevitable. Salomon Smith Barney is the only providerwho indicates using just its own traders’ prices. Lehman Brothersexplicitly indicates using matrix prices for relatively illiquid bonds.
41
bondindiceseurozone 25-01-2001 16:06 Pagina 41
– Matrix prices are prices that have normally been derived from com-parable government and corporate bonds in the same maturity orduration segment. Dependent on the quality of the issuer this basisyield is augmented with an appropriate yield spread. Important in theuse of matrix prices is that the spread matrix must always be up-to-date and represent the current market situation adequately. For thisform of prices it is the most difficult to check if they are realistic mar-ket prices. If a benchmark includes relatively more illiquid issues, thismay however be the only option for the provider to price the bonds.
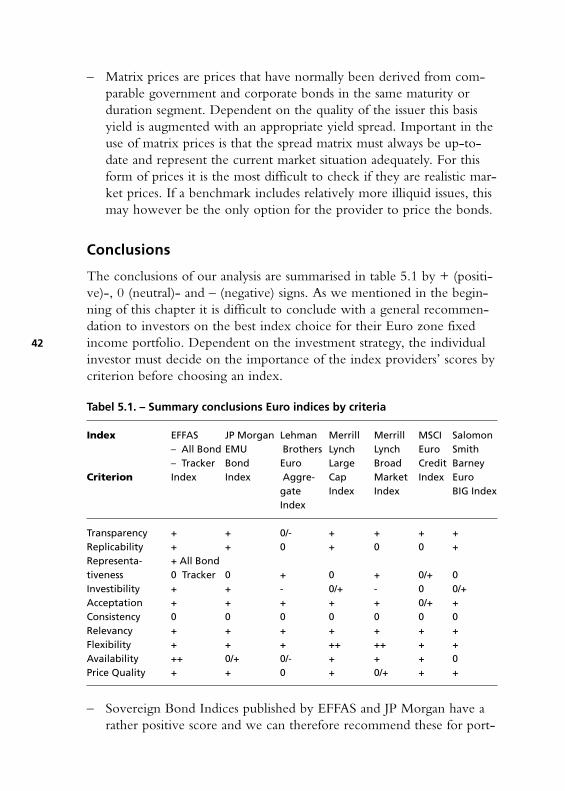
Conclusions
The conclusions of our analysis are summarised in table 5.1 by + (positi-ve)-, 0 (neutral)- and – (negative) signs. As we mentioned in the begin-ning of this chapter it is difficult to conclude with a general recommen-dation to investors on the best index choice for their Euro zone fixedincome portfolio. Dependent on the investment strategy, the individualinvestor must decide on the importance of the index providers’ scores bycriterion before choosing an index.
Tabel 5.1. – Summary conclusions Euro indices by criteria
Index EFFAS JP Morgan Lehman Merrill Merrill MSCI Salomon – All Bond EMU Brothers Lynch Lynch Euro Smith – Tracker Bond Euro Large Broad Credit Barney
Criterion Index Index Aggre- Cap Market Index Eurogate Index Index BIG IndexIndex
– Sovereign Bond Indices published by EFFAS and JP Morgan have arather positive score and we can therefore recommend these for port-
42
bondindiceseurozone 25-01-2001 16:06 Pagina 42
folios containing sovereigns only. The investor hereby has to consi-der that JP Morgan uses restrictions on liquidity when includingbonds in the index, so that there are some differences in compositionwith other EMU-government bond indices2. The EFFAS TrackerIndices are a subset of the EFFAS All Bond Indices, also applyingselection rules on turnover and liquidity to the All Bond selection bycountry. We consider the availability of the EFFAS indices as better because allinformation on these indices can be found on the Bloomberg pagesand are available to all Bloomberg users.
– For portfolios, containing both sovereigns and credits, we considerthe indices by Merrill Lynch (Large Cap), MSCI and Salomon SmithBarney as the most attractive tool for portfolio measurement, basedon the criteria in the table. These indices are rather transparent andthe data are easily available and accessible. Because of the higherthreshold in issue size for including bonds in the indices, the investi-bility can be judged as relatively good. Besides, these indices enablethe investors to customise the weight of government and credit bondsbased on his specific needs, because for these indices a separate credit(non-government) bond index is published. Data on the MSCI- and Merrill Lynch indices are even generallyavailable via Internet. Detailed data on the Merrill Lynch are alsoeasily accessible to all investors who use Bloomberg. Salomon SmithBarney provides detailed index information to all (authorised) inve-stors via Internet and Bloomberg. Clear advantages of the MerrillLynch indices are that, relatively, the most detailed information ispublished on industry sector level (the indices data can be split upinto 75 industry sectors) and that information, also on the individualbond level, is available to all investors who use Bloomberg.
43
2) JP Morgan has recently also launched a credit and composite index, called the JPMorgan Aggregate Index Euro (MAGGIE). Because of the recent launch thisindex was not analysed in this report.
bondindiceseurozone 25-01-2001 16:06 Pagina 43
Annex 1: Detailed sector levels of the Merrill Lynch Indices
Table 1: Merrill Lynch Index Sector Classifications
Level 1 – Level 2 - Group Level 3 – Sub-Group Level 4 - DetailAsset Class
Sovereign (SOV) Sovereign (SOV) Sovereign (SOV) Sovereign (SOV)
Quasi & Foreign Quasi & Foreign Foreign Sovereign (Fsov) Foreign Sovereign (Fsov)Government Government Government Guaranteed (Guar) Government Guaranteed (Guar)(QGVT) (QGVT) Agency (Agcy) Agency (Agcy)
Food (Food)Food & Drug Retailers (FRet)Pharmaceuticals (Phar)Tobacco (Toba)
Energy (Enrg) Energy - Exploration & Production (EnEx)Gas-Distribution (GasD)Integrated Energy (EngI)Oil Field Equipment & Services (OilE)Oil Refining & Marketing (OilR)
Real Estate (REst)) Housing Association (Hous)Real Estate Dev & Mgt (REst)REITs (REIT)
Services Cyclical (SCyc) Airlines (Airl)Building & Construction (Bldg)Gaming (Game)Hotels (Hotl)Leisure (Leis)Railroads (Rail)Support-Services (Supp)Theaters & Entertainment (Thea)Transportation Excluding Air/Rail (Tran)
1 Barclays Global Investors – The Euro Zone Bond Indices, September1998
2 Brown, Patrick J. - Constructing & Calculating Bond Indices,Probus, 1994
3 Euro Magazine - Bond Indices Survey, Risk Publications, 20004 Hart J.J. ‘t, J.P. Kleverlaan, P.P.F. van der Linde, J.C. van Roekel -
Vastrentende Waarden: een inventarisatie van beleggingsinformatie,VBA Katern 2 (in Dutch), Delwel, 1997
5 Investment & Pensions Europe - Focus: Fixed Income Investing,March 2000
6 JP Morgan – The JP Morgan EMU Bond Index, March 19987 Lehman Brothers International (Europe) – Fixed Income Strategies,
September 9,19998 Lehman Brothers, Fixed Income Research – Quantitative
Management of Bond Portfolios, May 20009 Merrill Lynch – Unlocking the Index Black Box, A guide to the
Merrill Lynch Global Index System on Bloomberg, April 199810 Merrill Lynch – Introducing the EMU Broad Market Index, April 27
199811 Merrill Lynch – Bond Index Almanac, European High Grade
Markets, January 200012 Merrill Lynch – Upcoming Changes in EMU Indices, August 200013 Salomon Smith Barney, Global Index Group – The Salomon Smith
Barney EMU Bond Indexes, May 199814 Salomon Smith Barney, Global Index Group – Salomon Smith
Barney Global Index Catalog, 1999 Edition, February 1999
Other publications of index providers
1 EFFAS - documentation of the European Bond Commission andBloomberg
2 Morgan J.P. - Global Bond Index Monitor, monthly3 Lehman Brothers4 Merrill Lynch5 Morgan Stanley Dean Witter6 Salomon Smith Barney - International Market Indexes, monthly
46
bondindiceseurozone 25-01-2001 16:06 Pagina 46
Summary of Internet sites of the Index Providers
JP Morgan www.morganmarkets.comLehman Brothers www.client.lehman.comMerrill Lynch www.research.ml.com& www.ml.comMSCI www.msci.comSalomon Smith Barney www.direct2.sbi.com