Bond of reinforcement in self-compacting steel-fibre reinforced concrete Anette Jansson, Ingemar Löfgren, Karin Lundgren and Kent Gylltoft Published in Magazine of Concrete Research, see journal homepage http://www.icevirtuallibrary.com/content/journals “Permission is granted by ICE Publishing to print one copy for personal use. Any other use of these PDF files is subject to reprint fees.”
Transcript
Bond of reinforcement in self-compacting steel-fibre reinforced concrete Anette Jansson, Ingemar Löfgren, Karin Lundgren and Kent Gylltoft Published in Magazine of Concrete Research, see journal homepage http://www.icevirtuallibrary.com/content/journals “Permission is granted by ICE Publishing to print one copy for personal use. Any other use of these PDF files is subject to reprint fees.”
Magazine of Concrete Research, 2012, 64(7), 617–630
http://dx.doi.org/10.1680/macr.11.00091
Paper 1100091
Received 24/05/2011; revised 19/12/2011; accepted 22/12/2011
Published online ahead of print 15/06/2012
Thomas Telford Ltd & 2012
Magazine of Concrete ResearchVolume 64 Issue 7
Bond of reinforcement in self-compactingsteel-fibre-reinforced concreteJansson, Lofgren, Lundgren and Gylltoft
Bond of reinforcement inself-compacting steel-fibre-reinforced concreteAnette JanssonPhD student, Chalmers University of Technology, Goteborg, Sweden
Ingemar LofgrenPhD student, Chalmers University of Technology, Goteborg, Sweden
Karin LundgrenAssociate Professor, Chalmers University of Technology, Goteborg,Sweden
Kent GylltoftProfessor, Chalmers University of Technology, Goteborg, Sweden
Crack control, one of the main benefits of using fibre reinforcement, depends to a large extent on the concrete–
rebar bond. Pull-out tests of specimens with short embedment length were carried out and the results showed no
effect from the fibres on the normalised bond–slip behaviour before peak load. After this, the fibre reinforcement
provided extra confinement, changing the failure mode from splitting to pull-out failure. The test results were used
to calibrate a finite-element bond model that considers both tangential stresses and stresses in the radial direction
from the rebar. Splitting cracks may be thus considered in the finite-element analyses. The model proved to yield
results in good agreement with the experimental results regarding failure mode, load–slip relation and splitting
strains on the surfaces of the pull-out specimens. The analyses revealed that two types of action were active in the
cracking process. In addition, the confinement effect of the fibre reinforcement was compared with the confinement
of conventional stirrups using the bond model in CEB-FIP model code 2010.
IntroductionAlthough it is well known that adding fibres to a matrix will lead
to smaller crack widths and increase tension stiffening (Noghabai,
1998) while also reducing the distance between cracks (Bischoff,
2003), there is still a need for better knowledge of the cracking
behaviour regarding the small crack widths related to the
serviceability state of a structure. Crack control, one of the main
benefits of using fibre reinforcement, depends to a large extent on
the bond mechanism of the reinforcement bar–matrix system.
The pull-out behaviour depends on the characteristics of the
reinforcement bar (geometry and steel type), the surrounding
matrix (packing grade, and fibre type and amount) and the level
of lateral confinement (cover thickness, amount of transverse
reinforcement, possible support pressure, etc.). During pull-out,
inclined transverse cracks are initiated at the contact points
between the steel lugs and concrete, and the bond action gener-
ates inclined forces that radiate outwards in the concrete. The
inclined stress is often divided into a longitudinal component,
called the bond stress, and a radial component, called the normal
or splitting stress. The inclined forces are balanced by tensile ring
stresses in the surrounding concrete, as explained by Tepfers
(1973) (Figure 1). If the tensile stress becomes larger than the
tensile strength of the matrix, longitudinal splitting cracks will
form in the concrete. Fibre reinforcement will suppress the
opening of these cracks and thus provide extra confinement.
Researchers agree that fibre reinforcement improves bond
strength in the case of splitting failure. Regarding the effect at
pull-out failure and the bond stiffness (pre-peak behaviour),
contradictory results have been reported, as concluded in the
state-of-the-art report of Bigaj-van Vliet (2001).
Different fibre materials and geometry yield different pull-out
behaviour; for example, Chao et al. (2009) show that the
addition of 1% by volume of the synthetic fibre UHM-PE
38 mm (polyethylene) yielded a markedly higher peak stress
and residual stress compared with a matrix reinforced with
1% regular hooked-end steel fibres of 30 mm length. With a
diameter of only 0.038 mm, for random three-dimensional
(3D) distribution, the average number of synthetic fibres was
400/cm2 compared with 2/cm2 for steel fibre of diameter
Splitting crack
Figure 1. Tensile ring stresses in the anchorage zone according to
Tepfers (1973)
617
0.55 mm. The larger number of polyethylene fibres can
effectively maintain the early confinement. For larger deforma-
tions, the steel fibre, with its higher Young’s modulus, became
more effective.
Self-compacting concrete (SCC) has been found to improve
bond properties of single fibres. Grunewald (2004) reported an
increase in fibre pull-out force of 15–50% for SCC in strength
class C45/55. The concrete–rebar bond may also gain from the
use of SCC. Zhu et al. (2004) found that SCC improved the
magnitude of the bond stress in pull-out tests. They compared
plain non-fibrous vibrated concrete, plain non-fibrous SCC and
fibre-reinforced SCC. In their tests, the peak bond strength was
increased by the use of SCC compared with plain vibrated
concrete, but there was no additional improvement from the
addition of fibres (RC 65/35BN 30 kg/m3) to the SCC.
The aim of the present study was to obtain relevant bond
properties for self-compacting steel-fibre-reinforced concrete
(SCSFRC) to steel bars. These properties were then used in
finite-element (FE) analyses of the cracking behaviour of
reinforced SCSFRC prisms, known as tie elements. To simulate
the cracking behaviour of these tie elements with FE analysis, it
is necessary to properly describe the interaction between the rebar
and the concrete. Owing to the contradictory findings in the
literature, it was decided to carry out pull-out tests on specimens
with a short embedment length.
The results from the pull-out tests were used to calibrate a bond–
slip model developed by Lundgren (2005). This model describes
both the tangential and the radial deformation between the rebar
and the concrete. Hence, the splitting stresses developing from
the inclined compressive struts can also be studied. By combining
tests and analyses of this kind, it is possible to study the effect of
fibres – both the confining action they provide and their local
effect on the rebar–concrete interface.
Experimental programme
Materials
Concrete mix
The concrete used was self-compacting (slump flow spread 650–
780 mm) with a water/cement ratio of between 0.53 and 0.55.
The concrete mixes were manufactured at a ready-mix plant in
batches of 2 m3 using a central drum mixer with a capacity of
6 m3: Table 1 shows the concrete mix compositions.
Fibre washout
To determine the actual fibre content, a washout control was
carried out for each of the batches with steel fibres. The washout
control was done in accordance with SS-EN 14721: 2005 (SIS,
2005a) and three samples of 8 l each were taken from each batch.
As the concrete was poured from the truck, one sample was taken
at the beginning, one in the middle and one at the end of the
pouring. The concrete from the beginning of each batch (�200 l)
was discarded.
It was found that for the fourth mix, with 80 kg/m3 steel fibres
added, there was a large scatter between the three washout
samples. Consequently, a second batch was cast with the same
amount of fibres (Table 2). Both batches with a fibre content of
80 kg/m3 were used for further testing, and are referred to as
series 1.0a and 1.0b. The five series are named according to
nominal (added) fibre content as shown in Table 1.
Material properties
For each mix, the compressive strength fccm:28d and the elastic
modulus Ecm were tested on cylinders of diameter 150 mm and
height 300 mm. The compressive strength was tested according to
the Swedish standard SS-EN 12390-3: 2009 (SIS, 2009) and the
elastic modulus according to SS-137232: 2005 (SIS, 2005b). The
splitting tensile strength fctm:sp:28d was determined after 28 days
on water-cured cubes (150 3 150 3 150 mm3) following the
Swedish standard SS-EN 12390-6. The direct tensile strength was
obtained as
f ctm ¼ 0:7 f ctm:sp:28d1:
Series Content: kg/m3
0.0 0.25 0.5 1.0a 1.0b
CEM II/A-LL 359 361 362 368 357
Water 197 195 197 202 189
Sand 0–4 mm 679 748 808 693 661
Sand 0–8 mm 231 146 161 160 168
Gravel 5–8 mm 156 122 54 166 183
Gravel 8–16 mm 590 566 554 569 580
Limestone filler 182 207 182 172 182
Superplasticiser 1.3 1.3 1.3 1.3 1.3
Fibre (Dramix RC 65/35) 0 20 40 80 80
Table 1. Concrete mix composition
Series Sample Average: kg/m3
1 2 3
0.25 13 14.7 14.6 14.1 (0.18%)
0.5 33 34.5 36.0 34.5 (0.44%)
1.0a 68 74.0 93.0 77.5 (1.0%)
1.0b 65 65.0 67.5 65.8 (0.85%)
Table 2. Results from fibre washout
618
Magazine of Concrete ResearchVolume 64 Issue 7
Bond of reinforcement in self-compactingsteel-fibre-reinforced concreteJansson, Lofgren, Lundgren and Gylltoft
Table 3 shows the mean compressive strength, splitting strength,
tensile strength, elastic modulus and density for each series.
The fibres used were hooked-end steel fibres (Dramix RC 65/35,
Bekaert) with a tensile strength of 1100 MPa. Ribbed bars
(diameter 16 mm) of Swedish quality B500BT were used as
longitudinal reinforcement; the yield strength was 535 MPa and
the elastic modulus was 200 GPa, both measured in tensile tests
by the manufacturer.
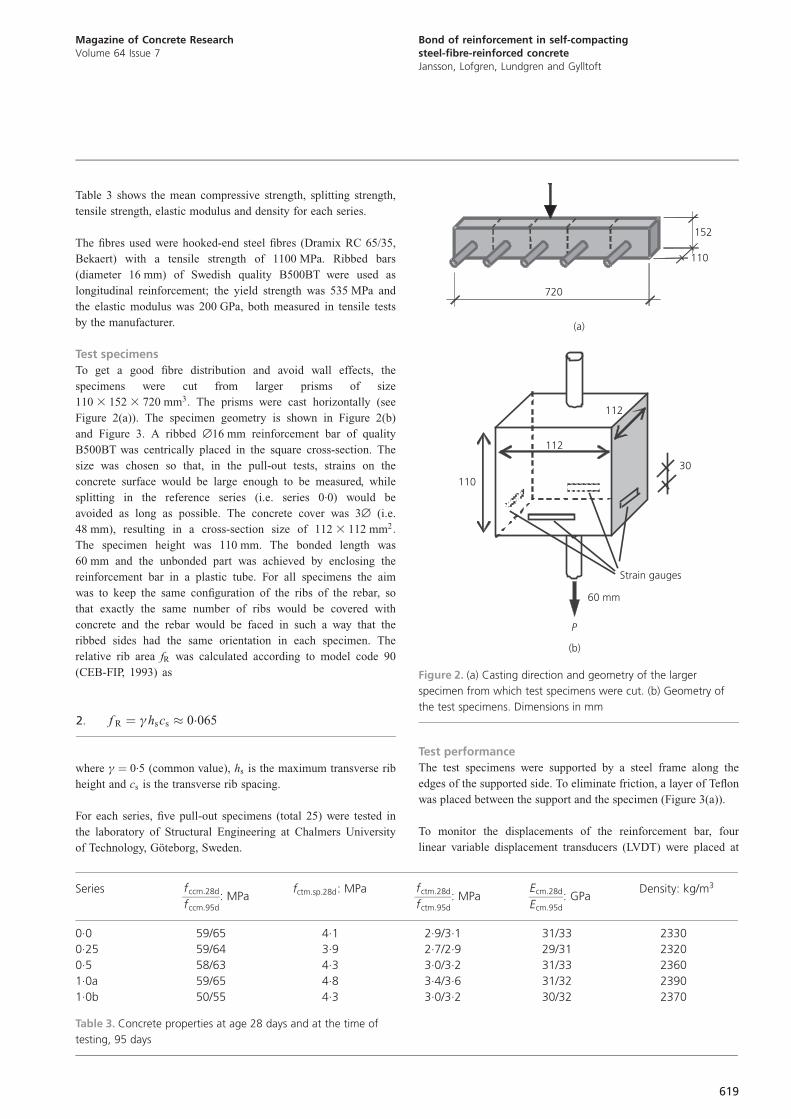
Test specimens
To get a good fibre distribution and avoid wall effects, the
specimens were cut from larger prisms of size
110 3 152 3 720 mm3: The prisms were cast horizontally (see
Figure 2(a)). The specimen geometry is shown in Figure 2(b)
and Figure 3. A ribbed ˘16 mm reinforcement bar of quality
B500BT was centrically placed in the square cross-section. The
size was chosen so that, in the pull-out tests, strains on the
concrete surface would be large enough to be measured, while
splitting in the reference series (i.e. series 0.0) would be
avoided as long as possible. The concrete cover was 3˘ (i.e.
48 mm), resulting in a cross-section size of 112 3 112 mm2:
The specimen height was 110 mm. The bonded length was
60 mm and the unbonded part was achieved by enclosing the
reinforcement bar in a plastic tube. For all specimens the aim
was to keep the same configuration of the ribs of the rebar, so
that exactly the same number of ribs would be covered with
concrete and the rebar would be faced in such a way that the
ribbed sides had the same orientation in each specimen. The
relative rib area fR was calculated according to model code 90
(CEB-FIP, 1993) as
f R ¼ ªhscs � 0:0652:
where ª ¼ 0.5 (common value), hs is the maximum transverse rib
height and cs is the transverse rib spacing.
For each series, five pull-out specimens (total 25) were tested in
the laboratory of Structural Engineering at Chalmers University
of Technology, Goteborg, Sweden.
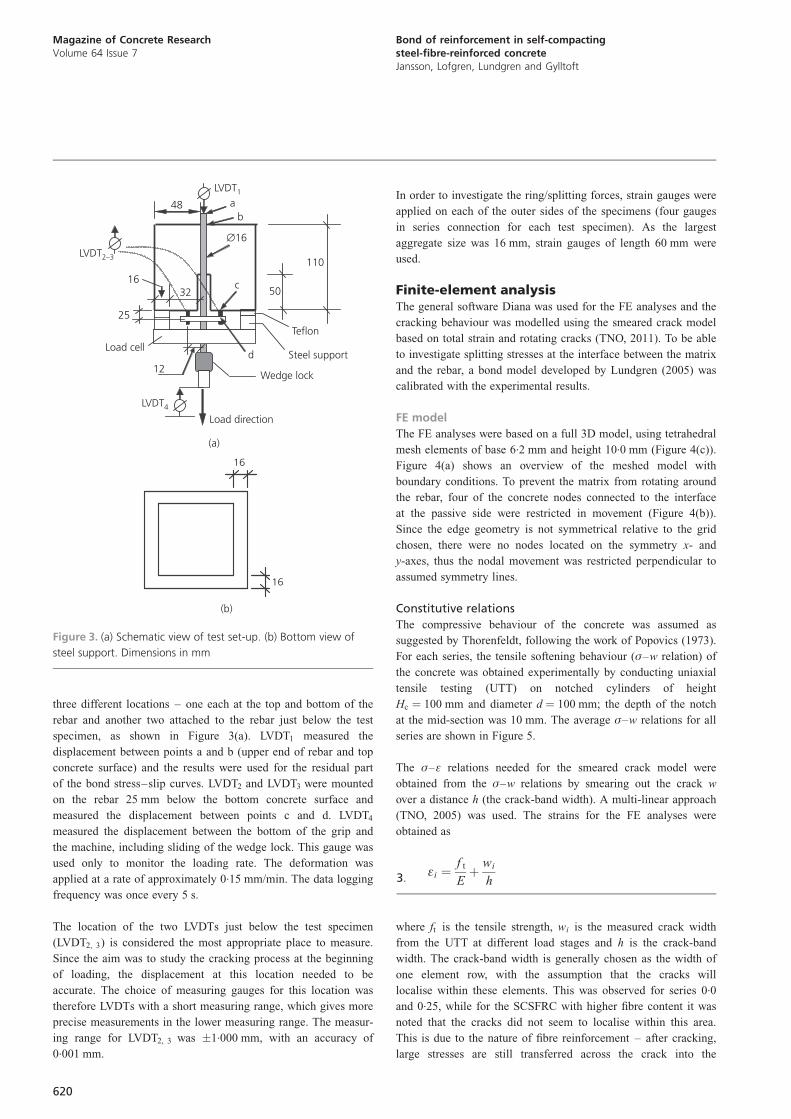
Test performance
The test specimens were supported by a steel frame along the
edges of the supported side. To eliminate friction, a layer of Teflon
was placed between the support and the specimen (Figure 3(a)).
To monitor the displacements of the reinforcement bar, four
linear variable displacement transducers (LVDT) were placed at
Series fccm:28d
fccm:95d: MPa
fctm:sp:28d: MPa fctm:28d
fctm:95d: MPa
Ecm:28d
Ecm:95d: GPa
Density: kg/m3
0.0 59/65 4.1 2.9/3.1 31/33 2330
0.25 59/64 3.9 2.7/2.9 29/31 2320
0.5 58/63 4.3 3.0/3.2 31/33 2360
1.0a 59/65 4.8 3.4/3.6 31/32 2390
1.0b 50/55 4.3 3.0/3.2 30/32 2370
Table 3. Concrete properties at age 28 days and at the time of
testing, 95 days
110
152
720
30
Strain gauges
60 mm
112
112
P
110
(b)
(a)
Figure 2. (a) Casting direction and geometry of the larger
specimen from which test specimens were cut. (b) Geometry of
the test specimens. Dimensions in mm
619
Magazine of Concrete ResearchVolume 64 Issue 7
Bond of reinforcement in self-compactingsteel-fibre-reinforced concreteJansson, Lofgren, Lundgren and Gylltoft
three different locations – one each at the top and bottom of the
rebar and another two attached to the rebar just below the test
specimen, as shown in Figure 3(a). LVDT1 measured the
displacement between points a and b (upper end of rebar and top
concrete surface) and the results were used for the residual part
of the bond stress–slip curves. LVDT2 and LVDT3 were mounted
on the rebar 25 mm below the bottom concrete surface and
measured the displacement between points c and d. LVDT4
measured the displacement between the bottom of the grip and
the machine, including sliding of the wedge lock. This gauge was
used only to monitor the loading rate. The deformation was
applied at a rate of approximately 0.15 mm/min. The data logging
frequency was once every 5 s.
The location of the two LVDTs just below the test specimen
(LVDT2, 3) is considered the most appropriate place to measure.
Since the aim was to study the cracking process at the beginning
of loading, the displacement at this location needed to be
accurate. The choice of measuring gauges for this location was
therefore LVDTs with a short measuring range, which gives more
precise measurements in the lower measuring range. The measur-
ing range for LVDT2, 3 was �1.000 mm, with an accuracy of
0.001 mm.
In order to investigate the ring/splitting forces, strain gauges were
applied on each of the outer sides of the specimens (four gauges
in series connection for each test specimen). As the largest
aggregate size was 16 mm, strain gauges of length 60 mm were
used.
Finite-element analysisThe general software Diana was used for the FE analyses and the
cracking behaviour was modelled using the smeared crack model
based on total strain and rotating cracks (TNO, 2011). To be able
to investigate splitting stresses at the interface between the matrix
and the rebar, a bond model developed by Lundgren (2005) was
calibrated with the experimental results.
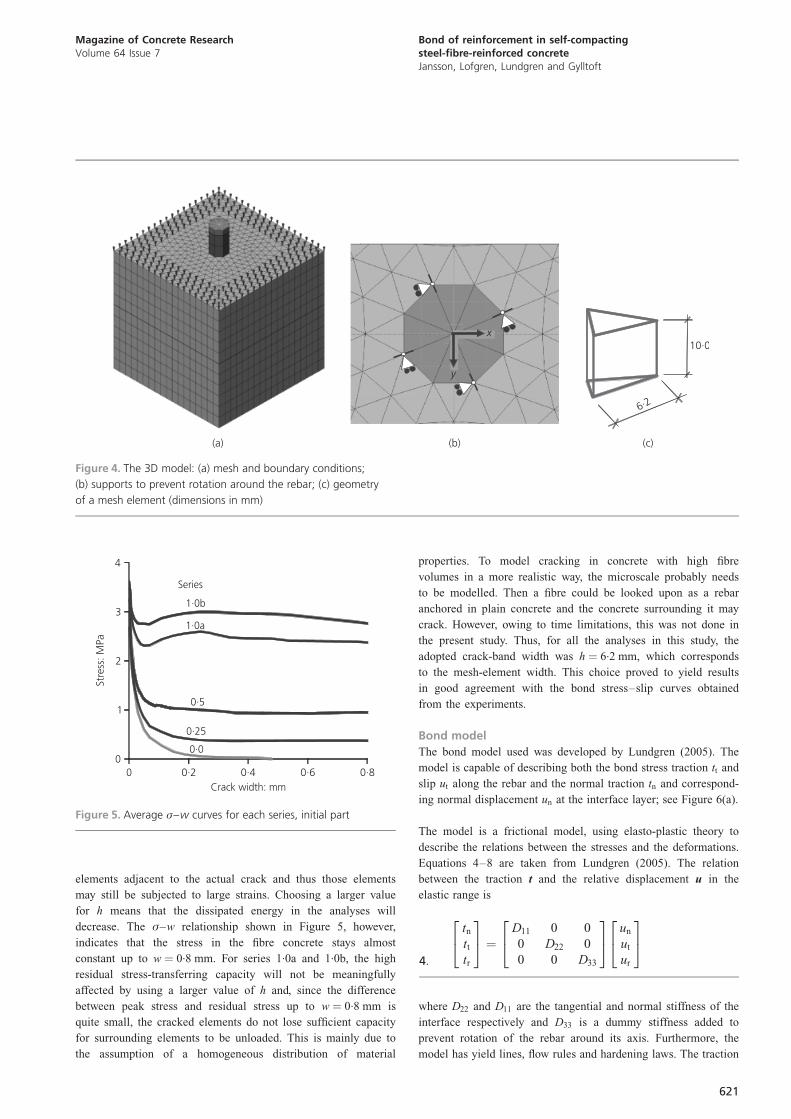
FE model
The FE analyses were based on a full 3D model, using tetrahedral
mesh elements of base 6.2 mm and height 10.0 mm (Figure 4(c)).
Figure 4(a) shows an overview of the meshed model with
boundary conditions. To prevent the matrix from rotating around
the rebar, four of the concrete nodes connected to the interface
at the passive side were restricted in movement (Figure 4(b)).
Since the edge geometry is not symmetrical relative to the grid
chosen, there were no nodes located on the symmetry x- and
y-axes, thus the nodal movement was restricted perpendicular to
assumed symmetry lines.
Constitutive relations
The compressive behaviour of the concrete was assumed as
suggested by Thorenfeldt, following the work of Popovics (1973).
For each series, the tensile softening behaviour (�–w relation) of
the concrete was obtained experimentally by conducting uniaxial
tensile testing (UTT) on notched cylinders of height
Hc ¼ 100 mm and diameter d ¼ 100 mm; the depth of the notch
at the mid-section was 10 mm. The average �–w relations for all
series are shown in Figure 5.
The �–� relations needed for the smeared crack model were
obtained from the �–w relations by smearing out the crack w
over a distance h (the crack-band width). A multi-linear approach
(TNO, 2005) was used. The strains for the FE analyses were
obtained as
�i ¼f t
Eþ wi
h3:
where ft is the tensile strength, wi is the measured crack width
from the UTT at different load stages and h is the crack-band
width. The crack-band width is generally chosen as the width of
one element row, with the assumption that the cracks will
localise within these elements. This was observed for series 0.0
and 0.25, while for the SCSFRC with higher fibre content it was
noted that the cracks did not seem to localise within this area.
This is due to the nature of fibre reinforcement – after cracking,
large stresses are still transferred across the crack into the
110
50
48
∅16
Load cellSteel support
Teflon
LVDT2–3
LVDT1
Load direction
LVDT4
Wedge lock
32
a
12
16
b
c
d
25
16
16
(b)
(a)
Figure 3. (a) Schematic view of test set-up. (b) Bottom view of
steel support. Dimensions in mm
620
Magazine of Concrete ResearchVolume 64 Issue 7
Bond of reinforcement in self-compactingsteel-fibre-reinforced concreteJansson, Lofgren, Lundgren and Gylltoft
elements adjacent to the actual crack and thus those elements
may still be subjected to large strains. Choosing a larger value
for h means that the dissipated energy in the analyses will
decrease. The �–w relationship shown in Figure 5, however,
indicates that the stress in the fibre concrete stays almost
constant up to w ¼ 0.8 mm. For series 1.0a and 1.0b, the high
residual stress-transferring capacity will not be meaningfully
affected by using a larger value of h and, since the difference
between peak stress and residual stress up to w ¼ 0.8 mm is
quite small, the cracked elements do not lose sufficient capacity
for surrounding elements to be unloaded. This is mainly due to
the assumption of a homogeneous distribution of material
properties. To model cracking in concrete with high fibre
volumes in a more realistic way, the microscale probably needs
to be modelled. Then a fibre could be looked upon as a rebar
anchored in plain concrete and the concrete surrounding it may
crack. However, owing to time limitations, this was not done in
the present study. Thus, for all the analyses in this study, the
adopted crack-band width was h ¼ 6.2 mm, which corresponds
to the mesh-element width. This choice proved to yield results
in good agreement with the bond stress–slip curves obtained
from the experiments.
Bond model
The bond model used was developed by Lundgren (2005). The
model is capable of describing both the bond stress traction tt and
slip ut along the rebar and the normal traction tn and correspond-
ing normal displacement un at the interface layer; see Figure 6(a).
The model is a frictional model, using elasto-plastic theory to
describe the relations between the stresses and the deformations.
Equations 4–8 are taken from Lundgren (2005). The relation
between the traction t and the relative displacement u in the
elastic range is
tn
tt
tr
24
35 ¼
D11 0 0
0 D22 0
0 0 D33
24
35
un
ut
ur
24
35
4:
where D22 and D11 are the tangential and normal stiffness of the
interface respectively and D33 is a dummy stiffness added to
prevent rotation of the rebar around its axis. Furthermore, the
model has yield lines, flow rules and hardening laws. The traction
10·0
6·2
(c)(b)
x
y
(a)
Figure 4. The 3D model: (a) mesh and boundary conditions;
(b) supports to prevent rotation around the rebar; (c) geometry
of a mesh element (dimensions in mm)
0·80·60·40·2
0·0
0·25
0·5
1·0a
Series
1·0b
0
1
2
3
4
0
Stre
ss: M
Pa
Crack width: mm
Figure 5. Average �–w curves for each series, initial part
621
Magazine of Concrete ResearchVolume 64 Issue 7
Bond of reinforcement in self-compactingsteel-fibre-reinforced concreteJansson, Lofgren, Lundgren and Gylltoft
tr is related to the displacement ur and has no influence on the
yield lines, which are described by two yield functions. One
describes the friction F1
F1 ¼ ttj j þ �(tn � f a) ¼ 05:
in which � is the friction and fa is the adhesion in the interface
layer. The other yield line, F2, describes the upper limit at pull-
out failure. This is determined from the stress in the inclined
compressive struts, c(k), which results from the bond action.
F2 ¼ t2t þ (tn þ c)(tn � f a) ¼ 06:
The yield lines are shown in Figure 6(b). For plastic loading
along the yield line describing the upper limit F2, an associated
flow rule is assumed. For the yield line describing the friction F1,
a non-associated flow rule is assumed, where the plastic part of
the deformations is given by
dup ¼ dº@G
@ t
G ¼ utj jut
tt þ �tn ¼ 07:
in which dº is the incremental plastic multiplier and � is the
dilation parameter.
For the hardening rule of the model, a hardening parameter k is
established, defined as
dk ¼ dup2n þ du
p2t
� �1=2
8:
For monotonic loading, dupn and the elastic part of the slip are
very small compared to the plastic part of the slip dupt ; therefore
the hardening parameter k will be almost equivalent to the slip
ut: The variables �, fa and c in the yield functions are assumed to
be functions of k.
Input parameters for the interface
Required input data for the interface are the elastic stiffness
matrix D in Equation 4, the dilatation parameter � defined in
Equation 7 and, for loading in the damaged deformation zone,
parameters �d0 and �d0, as shown in Table 5. Furthermore, the
functions c(k), �(k) and fa(k) must be chosen, as discussed later.
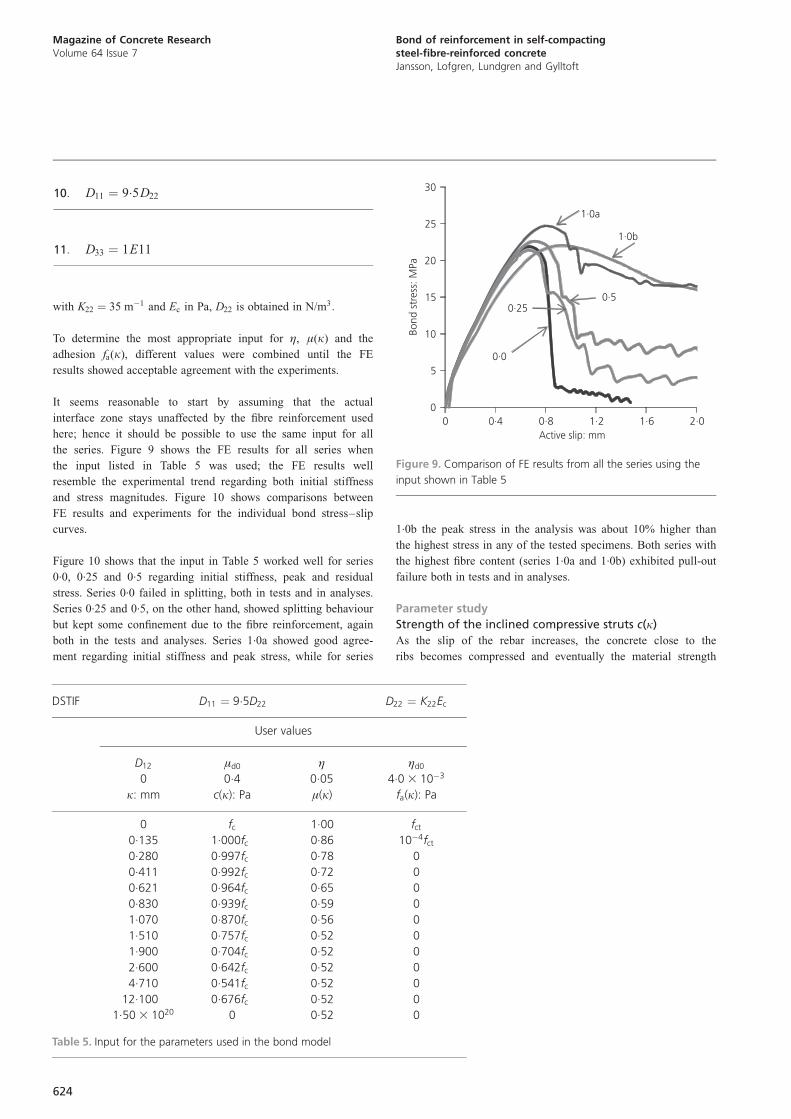
Comparison of experimental and numerical results
Experimental results
The average ascending part of the curves is shown in Figure 7.
Up to peak, the results were plotted against the slip measured on
the active side; for the residual part, the slip measured on the
passive side was used. In the FE model, the displacement was
extracted at the location where LVDT2 and LVDT3 were placed on
the test specimen; therefore, the displacement measured at this
location in the experiments was not adjusted regarding the elastic
elongation of the rebar. For comparison with CEB-FIP model
code 2010 (CEB-FIP, 2010), only the slip on the passive side
(LVDT1) was used.
Table 4 shows the average maximum bond stress for each series.
The series with the lowest compressive strength (series 1.0b)
exhibits the lowest stiffness as well as the lowest maximum value.
As mentioned, this series showed the lowest compressive strength,
Reinforcementbar
ut
tn
tt
un
d dup � λ∂
∂
G
tμ
1
F1
F2
�c
Bondstress
tt
Normalstress tn
1η
G
fa
(a)
ttn
t
normal stress����
bond stresssliprelative normal
displacement in thelayer
uu
t
n
(b)
Figure 6. (a) Physical interpretation of variables tn, tt, un and ut:
(b) Yield lines F1 and F2; the stress in the inclined compressive
struts c(k) determines the upper limit at pull-out failure (F2)
(modified from Lundgren (2005))
622
Magazine of Concrete ResearchVolume 64 Issue 7
Bond of reinforcement in self-compactingsteel-fibre-reinforced concreteJansson, Lofgren, Lundgren and Gylltoft
fcm:95d ¼ 55 MPa compared with 63–65 MPa for the other series.
When normalising the bond stress with the compressive strength
as suggested by Magnusson (2000), Figure 7(b) shows that all the
series show nearly identical initial stiffness and capacity.
Experiments and numerical analyses
The bond model was originally calibrated for normal-strength
concrete without fibres (vibrated) and rebar K500ST with a
diameter of 16 mm. Figure 8 shows the result from using the
originally suggested input for series 0.5, where it can be seen
that the initial stiffness is too low and the peak and residual
stresses are unacceptably high. It should be noted that the
main focus of the original calibration was anchorage failure
(Lundgren, 2005) and thus larger slip values than considered
here were of interest. This is probably the main reason for
the need of change in calibration, even though some part of it
can be attributed to the change from normal vibrated concrete
to SCC.
To fit the experimental results from the SCSFRC, the original
input had to be changed. First, according to the reasons discussed
above, the initially recommended values of the stiffnesses D11
and D22 were increased by approximately factors 2 and 5 respec-
tively in order to fit the initial stiff behaviour of the experimental
bond–slip curves (Equations 9 and 10).
D22 ¼ K22 Ec9:
1·0b
1·0a
0·0
0·5
0·25
0
5
10
15
20
25
0
Bond
str
ess:
MPa
Active slip: mm(a)
Average for each series
0
0·1
0·2
0·3
0·4
0
Nor
mal
ised
bond
stre
ss/τf c
1·0b
0·25
0·5
1·0a
0·0
0·80·60·40·2
0·80·60·40·2
Active slip: mm(b)
Figure 7. Bond stress–slip: (a) comparison of the average
ascending branch for each series; (b) as (a) but normalised with


![Coir Fibre Reinforcement and Application in Polymer ... · Coir Fibre Reinforcement and Application in Polymer Composites: A Review D. Verma1*, ... Matrices [5] materials in composites](https://static.documents.pub/doc/80x56/5e3d60412c5aab7cd60ded2f/coir-fibre-reinforcement-and-application-in-polymer-coir-fibre-reinforcement.jpg)


