An Unintended Consequence of Book-Tax Conformity: A Loss of Earnings Informativeness Michelle Hanlon* University of Michigan Edward L. Maydew University of North Carolina Terry Shevlin University of Washington February 27, 2008 Abstract: Increasing the degree of conformity between accounting earnings and taxable income has been put forth as a way of curtailing both earnings management and aggressive tax planning. We find, however, that increasing book-tax conformity has an unintended capital market consequence; namely, it results in accounting earnings that are less informative than they would be otherwise. Our inquiry exploits a unique sample of firms first studied by Guenther et al. (1997) that were required to change from the cash method to the accrual method for tax purposes, thereby increasing their book-tax conformity. We examine the capital market consequences of this increased conformity and find that the increase in book- tax conformity resulted in a decrease in the informativeness of the firms’ accounting earnings. To our knowledge this is a unique result in that it is a case of a tax law change that has an adverse consequence on the informativeness of accounting earnings. *Corresponding author: 701 Tappan Street, Ann Arbor, MI 48109. Phone: 734-647-4954 Fax: 734-936-0282 email: [email protected]Hanlon acknowledges financial support from an Ernst & Young Faculty Fellowship and the Bank One Corporation. Maydew acknowledges financial assistance from the David E. Hoffman Chair. Shevlin acknowledges financial assistance from the Paul Pigott/Paccar Professorship. We thank Scott Dyreng, Dave Guenther, Kyle Peterson, Ross Watts, and workshop participants at Columbia University, Duke University, INSEAD, Massachusetts Institute of Technology, the University of California Los Angeles, and the University of Pennsylvania for comments on earlier drafts. We also thank Nemit Shroff and the late Nader Hafzalla for research assistance. We appreciate Dave Guenther and Sarah Nutter sharing the identification of the firms required to switch to accrual basis accounting for tax purposes. An earlier version of this paper was titled ‘Book-Tax Conformity and the Informativeness of Earnings.’
Transcript
An Unintended Consequence of Book-Tax Conformity: A Loss of Earnings Informativeness
Michelle Hanlon*
University of Michigan
Edward L. Maydew University of North Carolina
Terry Shevlin
University of Washington
February 27, 2008
Abstract: Increasing the degree of conformity between accounting earnings and taxable income has been put forth as a way of curtailing both earnings management and aggressive tax planning. We find, however, that increasing book-tax conformity has an unintended capital market consequence; namely, it results in accounting earnings that are less informative than they would be otherwise. Our inquiry exploits a unique sample of firms first studied by Guenther et al. (1997) that were required to change from the cash method to the accrual method for tax purposes, thereby increasing their book-tax conformity. We examine the capital market consequences of this increased conformity and find that the increase in book-tax conformity resulted in a decrease in the informativeness of the firms’ accounting earnings. To our knowledge this is a unique result in that it is a case of a tax law change that has an adverse consequence on the informativeness of accounting earnings.
*Corresponding author: 701 Tappan Street, Ann Arbor, MI 48109. Phone: 734-647-4954 Fax: 734-936-0282 email: [email protected]
Hanlon acknowledges financial support from an Ernst & Young Faculty Fellowship and the Bank One Corporation. Maydew acknowledges financial assistance from the David E. Hoffman Chair. Shevlin acknowledges financial assistance from the Paul Pigott/Paccar Professorship. We thank Scott Dyreng, Dave Guenther, Kyle Peterson, Ross Watts, and workshop participants at Columbia University, Duke University, INSEAD, Massachusetts Institute of Technology, the University of California Los Angeles, and the University of Pennsylvania for comments on earlier drafts. We also thank Nemit Shroff and the late Nader Hafzalla for research assistance. We appreciate Dave Guenther and Sarah Nutter sharing the identification of the firms required to switch to accrual basis accounting for tax purposes. An earlier version of this paper was titled ‘Book-Tax Conformity and the Informativeness of Earnings.’
Abstract: Increasing the degree of conformity between accounting earnings and taxable income has been put forth as a way of curtailing both earnings management and aggressive tax planning. We find, however, that increasing book-tax conformity has an unintended capital market consequence; namely, it results in accounting earnings that are less informative than they would be otherwise. Our inquiry exploits a unique sample of firms first studied by Guenther et al. (1997) that were required to change from the cash method to the accrual method for tax purposes, thereby increasing their book-tax conformity. We examine the capital market consequences of this increased conformity and find that the increase in book-tax conformity resulted in a decrease in the informativeness of the firms’ accounting earnings. To our knowledge this is a unique result in that it is a case of a tax law change that has an adverse consequence on the informativeness of accounting earnings.
An Unintended Consequence of Book-Tax Conformity: A Loss of Earnings Informativeness
1. Introduction
How taxes affect financial reporting has been the subject of extensive research (see
Shackelford and Shevlin (2001) for a review). The vast majority of the extant research focuses on
how firms respond to trade-offs between financial reporting objectives and tax planning objectives.
To date, there is ample empirical evidence that tax planning objectives can affect firms’ financial
reporting decisions and vice versa. However, the extant research typically stops at the firm level.
Little is known about whether tax-induced changes to financial reporting decisions affect the capital
markets (though capital markets effects are often assumed). In particular, there is little evidence
whether the informativeness of firms’ financial accounting earnings is affected when firms’ change
their financial reporting in response to tax incentives. Moreover, should an effect on earnings
informativeness exist, there is some debate among researchers about whether to expect an increase
or decrease in informativeness.
This paper provides empirical evidence that tax-induced changes in financial reporting
behavior can have adverse effects on the informativeness of financial accounting earnings, even
absent actual changes to the financial accounting rules. Specifically, we find that when the links
between financial reporting and tax become stronger (i.e., stronger book-tax conformity) this has an
adverse effect on the informational role of accounting earnings. As such, this paper documents an
unintended consequence of corporate taxation: a loss of earnings informativeness that is
exacerbated the greater is the conformity between earnings and taxable income.
Our tests exploit a natural experiment first examined by Guenther, Maydew, and Nutter
(1997) in which a set of publicly traded firms were required to switch for tax purposes from the
cash method of accounting to the accrual method thereby increasing the level of conformity
1
between book and taxable incomes. Before they were forced to switch, these firms faced relatively
low levels of book-tax conformity because they used the accrual method for financial reporting
purposes but the cash method for tax purposes. Guenther et al. (1997) find that after the required
change firms deferred more income for financial reporting purposes because of the increased trade-
off between financial accounting and tax. In other words, once the two incomes were more closely
aligned, the firms reported lower financial accounting earnings, all else constant, in order to save
(defer) tax dollars.
This setting has two desirable attributes for studying the effects of taxation on the
informativeness of accounting earnings. First, the change in book-tax conformity came about
because of a change in the tax law, not a change in accounting standards. In other settings that one
could examine, the variation in book-tax conformity comes about because of variation in accounting
standards (e.g., a country moves from basing their financial accounting on the tax code to adopting
international accounting standards). While useful for addressing different questions, those settings
do not lend themselves to isolating the effects of change in book-tax conformity on the
informativeness of accounting earnings, since accounting standards are varying at the same time.
The second advantage of this setting is that the change only affected a subset of firms. This allows
us to control for potential time period effects by comparing the change in earnings informativeness
before and after the change in conformity with the earnings informativeness of firms that were
unaffected by the change.
We call firms that were forced to convert from the cash method to the accrual method for tax
purposes (thereby increasing their book-tax conformity) “converting firms.” To control for possible
time-period effects we compare the earnings informativeness of converting firms before and after
the required conversion to that of a ‘matched’ set of firms from the same industries that did not face
2
increased conformity (hereafter, accrual basis firms).1 We then employ a difference-in-differences
approach comparing the converting firms before and after the change to the accrual basis firms.
Following a long literature dating back to Ball and Brown (1968), we examine the relation between
returns and earnings. Specifically, we measure the informativeness of earnings by examining long-
window earnings response coefficients from regressions of returns on earnings changes and
regressions of returns on both earnings levels and changes. The evidence is consistent with
earnings becoming less informative to the market for the converting firms and this decrease being
significantly different from the observed change in the accrual basis sample. Specifically, the long
window earnings response coefficient declines for the converting firms and significantly more so
than for the accrual basis firms. These results are robust to different measures of earnings (earnings
before extraordinary items and pre-tax earnings) and to the inclusion of other control variables in
the returns - earnings regressions.
The effects of increasing conformity between accounting and tax have been the subject of
much debate. Some studies suggest that increasing conformity can improve the informativeness of
financial accounting earnings by constraining earnings management (Desai, 2005). In this line of
thinking, when conformity is weak, managers are unconstrained by the rules of the other system and
can act opportunistically by reporting low income to the tax authorities while also misleading
shareholders. Similar conclusions have been reached by some policy makers, many of which also
conclude that conformity would curtail what they consider to be aggressive tax planning (we
discuss these further below). In contrast, there is some evidence that conformity does not improve
the informativeness of accounting earnings and may even detract from it. For example, Guenther
and Young (2000) find that accounting earnings tend to be less informative in countries where
linkages between tax and accounting are strong. As Guenther and Young (2000, p. 55) posit “If tax 1 We discuss possible control samples in detail later.
3
and financial accounting income must conform, financial accounting information may differ from
underlying economic activities because firms attempt to minimize taxable income.” Our results are
consistent with Guenther and Young’s reasoning.
One reason that cross-country studies have not focused on the effects of conformity is that it
is difficult to isolate the effects of conformity from the effects of variation in accounting standards
(i.e., variation in accounting standards across countries induces variation in conformity). Using a
sample that allows us to isolate the effect of conformity from other effects, we find that conformity
leads to less informative accounting earnings. Moreover, we find that conformity has an adverse
effect on the informativeness of accounting earnings even when conformity is achieved via a
change in the rules for estimating taxable income, leaving accounting standards unchanged.
To put some structure on the discussion, we present a simple model adapted from
Holthausen and Verrecchia (1988) and Kothari (2001). The basic result from this model is that
noise in a signal reduces the price reaction to the signal. In our model, we show that downward bias
and noise in reported earnings can affect the earnings response coefficient. We argue that noise in
earnings could increase with conformity because of managers’ inability (due to the tax cost of doing
so) to convey private information useful to external stakeholders through earnings. If managers are
constrained in relaying this private information via earnings, noise in earnings will increase,
reducing the earnings response coefficient. Conversely, if book-tax conformity causes firms to
report more accurately, as its proponents suggest, then noise will decrease and the earnings response
coefficient will increase. Our empirical results are consistent with increased book-tax conformity
increasing the amount of noise in earnings, reducing its informativeness.
The paper proceeds as follows. In the next section we review the prior literature, with
particular attention to the sample, tests, and findings of Guenther et al. (1997). In section 3 we
4
develop our hypotheses. In section 4 we discuss our sample, variable measurement, and empirical
tests. Section 5 presents our results and section 6 concludes.
Guenther et al. (1997) show that when the conformity between taxable income and financial
accounting income is made stronger, the tax incentive to defer taxable income can lead to deferral
of financial accounting income (i.e., tax-induced conservatism).2 Guenther et al. (1997) identify a
set of publicly traded firms that, prior to the Tax Reform Act of 1986 (TRA 86), were allowed to
use the cash method of accounting (other than for purchases and sales of inventory items) for tax
purposes and the accrual method of accounting for financial reporting purposes. As a result, for
these firms the year-end acceleration of financial statement income imposed no tax costs as long as
cash collections were not also accelerated. In addition, by deferring (accelerating) cash collections
(payments) firms could defer taxable income without affecting book income. TRA 86 required
large corporations (sales in excess of $5 million) to use the accrual accounting method for tax
purposes, strengthening the degree of book-tax conformity for these firms.
Using both univariate and multivariate analysis, Guenther et al. (1997) report results
consistent with their hypotheses that converting firms recognized greater income before TRA 86
and that they decreased the level of revenue recognized relative to the accrual basis firms after TRA
86. More specifically, prior to TRA 86 the converting firms had significantly higher ratios of
accounts receivable to accounts payable and sales to expenses, indicating that the converting firms
accrued revenues and deferred expenses to a greater degree than did the accrual basis firms.
2 In the nomenclature of Beaver and Ryan (2005), this type of conservatism is unconditional conservatism, not the conditional conservatism as measured by Basu (1997).
5
Guenther et al. (1997) also find that the converting firms reduced these same ratios to a greater
extent than the accrual basis firms after TRA 86, indicative of a greater decrease in the acceleration
of income and deferral of expenses as a result of the tax costs of these actions constraining this
behavior. The authors conduct robustness checks for self-selection (because the group of
converting firms chose to use the cash method of accounting for tax purposes prior to TRA 86),
profitability, and growth and report that these factors had no adverse effect on the results of their
empirical tests. Overall, Guenther et al. (1997) conclude that increasing the extent of book-tax
conformity led firms to alter their financial reporting, but do not conduct any tests regarding the
informativeness of the earnings numbers after TRA 86.3,4 We use the same sample of firms as
Guenther et al. (1997) and examine the market’s interpretation of the financial accounting earnings
after the firms responded to the rule change.
2.2 Other Related Research
Additional motivation for our research question is provided by Hanlon et al. (2005). Using a
large sample of U.S. firms, Hanlon et al. (2005) predict and find that financial accounting earnings
provide more information to the market than estimated taxable income but that both income
3 We also note two other cases where sub-samples of firms have been affected by an increase in conformity as a result of tax law changes in the U.S. One case was the implementation of the Alternative Minimum Tax in 1986, which required a link to book income in the calculation of the alternative tax (see Gramlich 1991, Dhaliwal and Wang 1992, Choi et al. 2001, and Dhaliwal 2001). Another example is the LIFO conformity rules. While much of the early evidence was mixed on the market reaction to a LIFO adoption, Kang (1993) and Hand (1993) provide plausible explanations for the observed negative reaction for LIFO adoptions: firms that adopt LIFO expect input prices to rise. However, to our knowledge there are no studies that examine the informativeness of earnings surrounding these two tax law changes. Testing for any change in earnings’ informativeness of AMT firms is problematic because it is difficult to identify firms likely affected by the AMT Book Income Adjustment (AMTBIA) ex ante. In addition, because the income effect of being on LIFO must be disclosed in the firm’s financial statements, the loss in informativeness because of conformity in this case is likely not comparable to other types of book-tax conformity requirements where disclosure of the low conformity outcome is not required.. 4 Watts (2003a, b) argues that there are four economic determinants of conservatism: contracting, litigation, regulation, and taxation. Watts (2003a) defines conservatism as “the cumulative financial effects represented in the balance sheet and to income or earnings cumulated since the firm began operation” (page 208). By tax-induced conservatism we are referring to unconditional conservatism in the overall reporting of income and balance sheet accounts that results because firms are trying to lower their taxes rather than conditional conservatism (i.e., more timely recognition of economic losses (Basu, 1997)).
6
measures provide incremental information to investors. Thus, if book and taxable incomes were
conformed to one measure, the capital markets would suffer an information loss since both
measures provide incremental information and one would be gone with conformity. The effect on
the informativeness of earnings, however, is unclear. Because their setting does not involve a
change in conformity, it cannot take into account the effect that conformity would have on reporting
behavior (e.g., as documented in Guenther et al. 1997) and what effect this change, if any, would
have on the informativeness of earnings. It is precisely the effects on reporting behavior that are at
the center of the debate on book-tax conformity.5
Because the U.S. has not implemented a regime that closely links financial accounting and
taxable income measures, large sample evidence is unavailable using U.S. data; however, several
international studies have examined these issues. Ali and Hwang (2000) examine the relation
between measures of informativeness of financial accounting data and several country specific
factors, which include the degree to which tax rules influence financial accounting measurements,
the involvement of a private sector body in the standard setting process, and whether the country
has a bank-oriented or market-oriented financial system. Ali and Hwang (2000) find that the
informativeness of earnings is lower when tax rules significantly influence financial accounting
measurements. This result is consistent with tax laws being influenced by political, social, and
economic objectives rather than the information needs of investors (Scholes et al, 2005; Manzon
5 Note also that Hanlon et al. (2005) have to estimate taxable income from financial statement information (and this information is only disclosed and not recognized). This estimation raises concerns about measurement error in their taxable income variable, which could be contributing to their observed results. In contrast, our study examines financial accounting earnings for a set of firms where an increase in conformity was required, thus eliminating the need to estimate taxable income.
7
and Plesko, 2002). This evidence would lead to the prediction that if book and tax incomes are
conformed in the U.S., there would be a loss of information in the capital markets.6
Similarly, Guenther and Young (2000) report evidence consistent with accounting earnings
in the U.K. and the U.S. being more closely related to underlying economic activity than accounting
earnings in France and Germany. They predict these results because of differences in legal systems
and the demand for accounting information, differences in legal protection for external
stakeholders, and differences in the degree of tax conformity in the different countries.7 Hung
(2001) reports evidence consistent with the use of accrual accounting (versus cash accounting)
negatively affecting the informativeness of financial statements in countries with weak shareholder
protection. Hung (2001) uses book-tax conformity as a control variable in her tests; however, book-
tax conformity is not significant (inconsistent with Ali and Hwang, 2000).
Overall, some of the studies comparing countries with differing degrees of book-tax
conformity find evidence consistent with high book-tax conforming countries having less
informative earnings. However, using international data does not directly answer the question of
what would happen in the U.S. because earnings informativeness is an endogenous function of
market demands, political influences, and the incentives of involved parties that are specific to each
6 In addition, Harris, Lang, and Moller (1994) examine the value relevance of German accounting measures over a period in which the German accounting rules were considered by many to be particularly deficient in the information disclosed to investors. The German system included a closer link between book and taxable incomes, and a greater emphasis on both detailed prescriptive regulations and the needs of debtholders. Harris et al. (1994) also examine an earnings number calculated by the German financial analyst society, which was meant to represent the “permanent earnings” of the companies. The study reports that the correlation between 18-month returns and annual earnings for German firms is generally similar to that in the U.S. They also report that the earnings number produced by the analysts has more explanatory power for returns relative to the reported earnings, thus providing an example of an alternative form of information acquisition that arises when financial accounting does not provide the type of information demanded by investors (i.e., analyst groups calculating alternative measures of earnings). 7 Note that Guenther and Young (2000) do not isolate which of the three reasons they give for their prediction drives their results because the US and UK (France and Germany) are each classified the same on each dimension. In another study, Young and Guenther (2003) use the degree of book-tax conformity as one of two proxies for the informativeness of financial accounting in a country (low book-tax conformity, higher informativeness) and test whether capital flows into a country are decreasing with increased book-tax conformity. Their results are consistent with this prediction. Thus, another cost of book-tax conformity documented by Young and Guenther (2003) is decreased capital mobility.
8
country (Ball, Robin, and Wu, 2003). Thus, we examine the question directly using a unique set of
U.S. firms at a time when their level of book-tax conformity increased as a result of a tax law
change. We view our study as triangulating and extending the evidence in Hanlon et al. (2005) and
the international studies described above.
We note that there have also been several recent studies regarding book-tax differences and
earnings quality. Although not directly related, a discussion regarding how those studies relate to
our predictions and findings is warranted. One example is Hanlon (2005), which presents results
consistent with firms that have relatively large book-tax differences in a cross-section of firms also
having lower earnings persistence. Thus, one may be tempted to conclude that eliminating book-tax
differences by requiring conformity would improve earnings quality. However, to assume that
eliminating all book-tax differences would increase earnings quality presumes that the majority of
book-tax differences are driven by earnings management of book income on which firms could
avoid paying taxes. As stated in Hanlon (2005) there are many reasons why firms can have book-
tax differences—1) different rules governing the calculation of the incomes because the two
measures are intended for different purposes, 2) firms being tax aggressive, 3) firms managing
earnings, and 4) a combination of these factors. Because there are many reasons for the book-tax
differences to exist (both prior to and after TRA 86) and because there was likely a behavioral
response by firms after the required increase in conformity to attempt to manage financial
accounting earnings downward (the market knew their conformity increased and lowering book
income would reduce taxes and increase cash flows), this setting is different than that in Hanlon
(2005) (which examined relatively large book-tax differences with no change in book-tax
conformity).8
8 See also Lev and Nissim (2004) for a closely related paper to Hanlon (2005). Also, see Mills and Newberry (2001) and Phillips, Pincus and Rego (2003) for other papers that relate book-tax differences and earnings quality.
9
2.3 The Current Policy Debate About Book-Tax Conformity
In addition to the evidence about the effect of taxes on the information in financial
accounting earnings, our study also contributes to the policy debate about book-tax conformity.
The difference between reported book and taxable incomes grew substantially in the 1990s
according to estimates made by several governmental agencies and researchers (e.g., Plesko, 2000
and 2002; Treasury, 1999). While the reason for this divergence is not known with certainty, many
argue that one or both of the income measures were being opportunistically reported by
management. For example, Desai (2005) argues that because the system of dual reporting allows
(indeed, requires) different computations of income for book and tax purposes, the quality of
earnings reported to both the capital markets and tax authorities is reduced by opportunistic
behavior by managers.9
In addition, Congress has held hearings on corporate tax shelters in which a number of
witnesses testified in favor of increased book-tax conformity, including Charles Rossotti, the former
Commissioner of the IRS,.10 Furthermore, increased book-tax conformity was one of the
alternatives considered by President Bush’s Tax Reform Panel.11 The Panel’s report states that
“The Panel also evaluated a proposal to tax large entities based on net income reported on financial
statements instead of requiring a separate calculation of income for tax purposes. Although the
Panel has decided not to include that proposal as part of the Simplified Income Tax Plan, the Panel
recommends that it be studied further” (President’s Advisory Panel on Federal Tax Reform, page
131).
9 See also Desai’s Testimony before the House Ways and Means Committee, May 9, 2006. 10 Charles Rossotti, Testimony Before the Senate Committee on Finance, September 20, 2006. 11 See also Harris (2005) and Graetz (2005).
10
3. Hypothesis Development
To provide structure for our hypotheses we present a simple model of the effect of noise in a
signal on the price reaction to the signal. The model follows from Holthausen and Verrecchia
(1988) and Kothari (2001) and the basic result is that noise in a signal reduces the price reaction to
the signal. For example, noise in earnings reduces the earnings response coefficient - our measure
of earnings informativeness. We define Xt as reported earnings, xt as economic earnings in the
absence of noise or bias (in Holthausen and Verrecchia, the private signal xt received by managers
is about the liquidating dividend). We label the difference between Xt and xt as ηt. This difference,
ηt, is composed of both noise (or garbling) and bias. In our setting of conformity, and given the
results of Guenther et al. (1997), we expect downward bias (unconditional conservatism) in reported
earnings. We model this by setting ηt = f xt + et, where f < 0 determines the extent of the downward
bias and et is the noise term, which has mean zero and variance σe.12 Thus we can write reported
earnings as
Xt = xt + f xt + et
= (1+f) xt + et. (1)
Further assume (consistent with Kothari, 2001) that stock returns reflect economic earnings, Rt =
xt.13 However, the firm’s reported earnings are not xt but rather Xt and we estimate
Rt = a + b Xt + ut (2)
where b is the estimated ERC = cov(Rt,Xt)/var(Xt). Substituting for Rt and Xt gives
b = cov(xt,(1+f)xt+et)/(σ(1+f)x2+ σe
2) (3)
Assuming xt and et are uncorrelated, 12 With reversals in accruals, and a steady state (i.e., non-growing) firm it is possible that reversal of prior noise offsets on average the introduction of new noise such that f = 0 and the expected mean of the noise term is zero. As shown below, mean zero noise reduces the estimated ERC. 13 We could add a term for the “true” ERC Rt = β xt but this would just add unnecessary clutter and the main point remains. Alternatively, we assume the true ERC is normalized to 1.
11
b = ((1+f)cov(xt,xt))/((1+f)2 σx2
+ σe2)
= ((1+f) σx2)/((1+f)2 σx
2 + σe
2) (4)
Equation (4) shows that the ERC, b, is influenced by both noise, e, and bias, f. Several possibilities
emerge. In the absence of noise and bias, b = σx2/σx
2 = 1 and b is an unbiased estimate. If there is
no noise but f < 0 (simple downward bias), then b is simply biased upward by the scale factor
1/(1+f).14 As in Holthausen and Verrecchia (1988), if there is no bias but there is noise (f = 0 and
σe2> 0), then b = σx
2/(σx2
+ σe2) and b is biased downward. Finally, if there is both bias and noise (f
< 0and σe > 0), then b < 1 if ([((1+f) – (1+f) 2) σx2 ] < σe
2). To illustrate, if f = -.10, then b is
downward biased if .09 σx2 < σe
2. Thus, the ERC is decreasing in the variance of noise, σe2, but
increasing the more downward bias there is in reported earnings (f<0).15
To put the above model more in context for our setting, consider that GAAP provides
managers with considerable discretion in their choice of accounting procedures (Watts and
Zimmerman, 1986, p. 215). Accruals can be used by management to convey private information
useful to external stakeholders (Dechow, 1994), decreasing noise in the underlying cash flows and
increasing the informativeness of earnings. However, accruals can also be used opportunistically,
thus distorting the information provided by management, introducing noise into earnings, σe2 > 0,
and lowering the informativeness of reported earnings. We note that in tests comparing cash flows
and accounting earnings, accounting earnings exhibit greater relative informativeness than cash
flows (Dechow, 1994) in spite of this potential for earnings management.
14 This result implies that if we were to observe an increase in the ERC such increase might simply reflect a scaling from unconditional conservatism rather than a reduction in noise (smaller σe
2) as predicted by Desai (2005). 15 This model is naturally a stylized model and one could, if desired, develop a more complicated model to incorporate other features. Nonetheless, the model captures the two salient effects that a change in book-tax conformity can bring about: i) changes to reported earnings that increase the ERC (downward bias) and ii) changes to reported earnings that decrease the ERC (noise in earnings).
12
Hanlon et al. (2005) argue that conforming book income and taxable income would reduce
the informativeness of earnings because managers would report earnings to minimize taxes rather
than reporting earnings in a manner that conveys relevant and reliable information regarding firm
performance through earnings (f < 0 and σe2 > 0, such that b is biased downward). In contrast,
proponents of book-tax conformity argue that in an unconformed system firms manage accounting
earnings upward (f > 0 and σe2 > 0) and that book-tax conformity would force them to stop (f = 0
and σe2 = 0), resulting in more honest reporting which would, they argue, make earnings more (not
less) informative.
In sum, the increased (unconditional) conservatism in reported earnings that Guenther et al.
(1997) report as a consequence of increased book-tax conformity could have two possible effects
depending on management’s reporting both before and after the increase in conformity (TRA 86 in
our setting). The increased conservatism that results from conformity could result from firms no
longer managing earnings upward because of the tax costs of doing so (thus setting f = 0 and
lowering noise in earnings, σe2, increasing earnings informativeness) or it could arise from firms not
being able to convey private information about performance because of the tax cost of doing so
(thus decreasing f and increasing noise in earnings, σe2, decreasing earnings informativeness).
Although advocates on both sides of the debate argue strongly with regard to their predictions, the
existing literature does not test these predictions. We directly test these predictions using the
unique setting of firms required to switch from cash basis to accrual basis accounting for tax
purposes after TRA 86. Our first hypothesis is as follows, stated in the alternative form:
H1: The informativeness of earnings decreases as firms are forced to increase their book-tax conformity. We also test a second hypothesis regarding the two groups of firms (converting and
accrual) prior to TRA 86. Our main test is the test of H1, which examines whether earnings of
13
converting firms become less informative after the firms are required to use the accrual method
of accounting for tax purposes (i.e, after their tax accounting becomes more conformed with
financial accounting). We use the accrual basis firms as a control group because we conduct an
interrupted time series test and there could have been macroeconomic effects that affected the
earnings informativeness of all firms. Thus, if we did not use a control group for comparison we
may mistakenly attribute an effect that happened to all firms to the increase in book-tax
conformity. As a result, our main test is whether the informativeness of earnings for converting
firms decreased more than for accrual firms. This is the strongest test because it is a difference-
in-differences test. However, because the converting firms are less conformed prior to TRA 86
than accrual basis firms are prior to TRA 86, we also test whether the informativeness of
earnings is different between the two groups of firms prior to TRA 86. In terms of the model, we
predict that the earnings of the converting firms contain less noise prior to TRA 86, and are
therefore more informative, than the earnings of the accrual firms (which have stronger book-tax
conformity). Our second hypothesis is as follows, in the alternative form:
H2: Prior to the required increase in book-tax conformity, earnings of converting firms (those with low conformity) are more informative than are earnings of high-conformity firms.
We have no ex ante prediction about whether the accrual basis firms’ earnings will
become more or less informative after TRA 86 relative to before but include these firms as a
control sample in the event that all firms’ earnings became more or less informative around TRA
86 due to some factor other than an increase in book-tax conformity. We also do not propose a
formal hypothesis regarding the difference in informativeness in earnings between the two
groups after TRA 86; however, our conjecture is that there is likely no difference between the
14
two groups because they now have an equal degree of conformity between tax and book
accounting.
4. Sample, Descriptive Statistics, and Empirical Design
4.1 Sample
Our sample selection criteria are described in Table 1. We begin with the sample of 94
firms identified by Guenther et al. (1997) as using the cash method of accounting for tax purposes
prior to TRA 86.16 We delete observations with missing data for our tests, firms with fiscal year end
changes, and firms which have 1985 sales of $5 million or less because firms with less than $5
million in sales were not required to change accounting methods under TRA 86.17 We also require
firms to have available data in at least both the years 1985 and 1988 to be retained in the sample.18
Our final sample consists of 56 firms that used the cash method for tax purposes prior to TRA 86
and were then required to switch to the accrual for tax purposes. We refer to these firms as the
“converting firms.”19
We also gather a sample of control firms from the same four digit SIC codes that used the
accrual method for tax purposes during the entire period of the study; referred to as the “accrual
basis firms.” We use this control sample for two reasons. First, this is the same control sample as
used in Guenther et al. (1997). Second, this control sample provides a large number of firms to be
16 Guenther et al. (1997) use a keyword search of financial statement tax footnotes on the NAARS file of the LEXIS/NEXIS data base for 1985 using the terms ‘cash basis’ and ‘cash method’. They exclude firms in the commercial banking and savings and loan industries because these firms have special tax and financial accounting rules not applicable to the majority of firms. 17 IRC §448. 18 Consistent with Guenther et al. (1997), we exclude observations from the years 1986 (because of potential income shifting to or from this year) and 1987 (because TRA86 was phased in over that year). In sensitivity analysis, we examine the effect of excluding observations from 1988 because income shifting could have occurred involving this year as well (see section 5.3.f.). 19 We note that Guenther et al. (1997)’s final sample in their paper consisted of only 66 firms. We have additional data requirements (the use of returns) and are using Compustat files ten years later and thus expect to have a smaller sample than Guenther et al. (1997).
15
used in our tests. We include firm-years with available data in the time period from 1981-1985 for
the pre-TRA 86 period and firm-years with available data in the time period from 1988-1992 for the
post-TRA 86 period. In total, we have 3,576 firm-years of data consisting of 450 converting firm-
years and 3,126 accrual basis firm-years.
Ideally we would want to test the informativeness of the earnings of the cash basis firms that
converted compared to what they would look like had they not converted. Of course this is not
possible. The following table identifies the various samples of firms potentially available along
with their method of tax accounting both pre-TRA 86 and post-TRA 86.
Pre-TRA 86 Post-TRA 86
Converting Firms Cash Accrual
Accrual Method Firms Accrual Accrual
Cash Method Firms Cash Cash
Small Sales Firms Cash/Accrual Cash/Accrual
The converting firms are those that are the subject of our analysis – firms that experience a
required increase in book-tax conformity. We use the accrual basis firms as the control sample in
our main analysis – firms from the same industries as the converting firms that were accrual for tax
purposes both before and after TRA 86 (these firms experienced no change in the required level of
book-tax conformity). The third grouping, cash method firms, consists of those firms on the cash
method of accounting for tax purposes both before and after TRA 86. Thus, these firms would be
like our ‘treatment’ sample pre-TRA 86 but not subject to the increase in the conformity
requirement (i.e., they must have sales less than $5 million). While this group would also make a
useful control sample, we cannot obtain a reasonable size sample of cash method firms. Guenther
16
et al. (1997) conducted a thorough search of financial statements on the NAARs database and only
found 94 firms in total that were on the cash basis method for tax accounting prior to TRA 86. Of
course, this small number is likely not the population of firms that were on the cash basis but is the
sample of firms that Guenther et al. (1997) could identify from searching the financial statements.
Out of this sample of 94 firms for which we can still link to Compustat (91 firms) we find only 3
firms with sales less than or equal to $5 million in 1985. Thus the control sample of cash basis
firms that did not convert would consist of at most 3 firms. This does not make for a plausible test.
As a result, we utilize the accrual basis firms as our control group in our main analysis.
We also employ an alternative control sample of firms, labeled the Small Sales Firms in the
above chart, and describe the results of using this sample in our sensitivity analysis below. These
firms have sales less than $5 million and thus could have remained on the cash basis if they were on
the cash basis prior to TRA 86. We cannot identify (any better than Guenther et al., 1997) which of
these are cash or accrual basis either before or after but instead use the entire group as an alternative
control for our interrupted time series tests.
4.2 Descriptive Statistics
Table 2 contains descriptive statistics for the sample. Our measure of earnings is the
change in earnings before extraordinary items (ΔE, Compustat data #18) from year t-1 to year t,
scaled by the market value of equity (MVE, data #199 * data #25) at the end of year t-1.20 Our
measure of returns (R) is the raw buy and hold 12 month return beginning the fourth month after the
fiscal year end of t-1 and ending 3 months after the fiscal year-end of year t. ASSETS are the total
assets of the firm at year-end (data #6), SALES GROWTH is defined as the percentage increase in
current-year sales over the prior year sales (data #12), and LEVERAGE is defined as the long-term
20 We also test earnings defined as pre-tax earnings and find similar results described below in section 5.4.
17
debt of the firm scaled by total assets (data (#9+#34)/#6). Return on assets (ROA) is defined as
earnings before extraordinary items divided by average total assets (data #18/average data #6),
earnings-to-price (E/P) is earnings before extraordinary items divided by market value of equity at
year-end (data #18/MVE), and book-to-market (B/M) is defined as the book value of equity at year-
end divided by MVE (data #60/MVE).
The data indicate that the converting firms tend to be smaller than the accrual firms both
before and after TRA 86, whether measured by MVE or by ASSETS. There is no difference between
the two groups’ stock returns or change in earnings in either the pre-TRA 86 or post-TRA 86
periods. The converting firms exhibit higher sales growth, E/P and M/B (proxies for growth) pre-
TRA but there is no discernable difference post-TRA. Converting firms also exhibit significantly
higher leverage post-TRA but there is no difference pre-TRA – the leverage of converting firms
increased. The tests of differences in ROA between the groups are mixed depending on whether
significance tests are based on means or medians. Where variables changed pre/post-TRA (e.g.,
growth and leverage) we check in sensitivity analysis that these changes are not driving the
observed results (see Section 5.3.c).
The fact that there are some differences between converting and accrual firms underscores
the importance of utilizing a natural experiment with an interrupted time series design as opposed to
a pure cross-sectional approach. If there had been no exogenous change in book-tax conformity and
we had merely compared converting firms to accrual method firms, it would be difficult to isolate
effects of book-tax conformity on reporting behavior given the other differences between the firms.
With the 2 x 2 design in the current study, we are able to observe the same converting firms under
two different book-tax conformity regimes, essentially giving us a within-firm test. To control for
time-varying industry or macroeconomic effects we also compare the converting firms to a set of
18
accrual method firms that were not affected by the change in book-tax conformity in the same pre
and post-time periods.
4.3 Empirical Design
We examine the difference-in-differences in the long-window earnings response coefficient
between the converting and accrual basis firms. Following Francis et al. (2005) and others, we
interpret the slope coefficient relating returns to earnings obtained from regressions of annual
returns on annual earnings changes as a measure of the informativeness of earnings (we also
estimate regressions of annual returns on annual earnings levels and changes).
The interpretation of the slope coefficient in a returns-earnings regression as a measure of
the informativeness of earnings is common in the accounting literature. For example, Lev and
Zarowin (1999) state “We use statistical associations between accounting data and capital market
values (stock prices and returns) to assess the usefulness of financial information to investors” (page
354). “A different perspective on the informativeness of earnings is provided by the combined ERC
(earnings response coefficient), defined as the sum of the slope coefficients of the level and change
of earnings…A low slope coefficient suggests that reported earnings are not particularly
informative to investors, perhaps because they are perceived as transitory or subject to managerial
manipulation. In contrast, a high slope coefficient indicates that a large stock price change is
associated with reported earnings...” (page 356).
Francis and Schipper (1999) describe different interpretations of earnings informativeness.
Two of their interpretations are based on earnings informativeness as indicated by a statistical
association between financial information and prices or returns. One of these (their interpretation
number 3) measures whether investors actually use the information in earnings in setting prices.
“This interpretation implies that value relevance is measured in terms of “news,” implying that
19
value-relevant information changes stock prices because it causes investors to revise their
expectations” (page 326). However, as they state, implementing this type of interpretation requires
taking into account the linked concepts of timeliness and expectations formation. In our setting, we
do not have a good expectations model for the converting or accrual basis firms. Analysts forecast
coverage would be virtually nonexistent for all the firms in 1986, especially for the converting firms
which are on average smaller firms.
Francis and Schipper’s (1999) fourth interpretation (the one they use—long window
association tests) of earnings informativeness is measured by the ability of financial statement
information to capture or summarize information, regardless of source, that affects share values.
This interpretation does not require that financial statements be the earliest source of information.
This is the interpretation of informativeness that we use in our paper.
Thus, we interpret differences in the slope coefficients between our sub-samples of firms as
providing evidence on differences in the noise or informativeness of accounting information. In our
case, this difference, if any, is associated with each of the sub-sample’s level of book-tax
conformity.21 We use the following difference-in-difference regression model:
where CONVERTING is an indicator variable set equal to 1 if the firm is a converting firm and zero
if the firm is an accrual basis firm; POST is an indicator variable set equal to 1 if the year of the
observation is post-TRA 86 (1988-1992) and zero if the observation is prior to TRA 86 (1981-
1985); ΔEt and Rt are as defined above. Using this specification we can investigate whether 21 Francis et al. (2005) cite other papers that capture the informativeness of earnings using the coefficient relating returns to earnings (e.g., Teoh and Wong, 1993; Imhoff and Lobo, 1992; Warfield et al., 1995; Subramanyam and Wild, 1996; Fan and Wong, 2002; and Yeo et al., 2002).
20
converting firms’ average ERC declined post-TRA 86 more so than the average ERC of the accrual
firms. This approach controls for any differential in the post-TRA period for all firms attributable
to other factors and for any differential in returns between the converting and accrual basis firms not
attributable to earnings.
The coefficient on ΔEt , 3β , represents the ERC for accrual firms prior to TRA 86 and
consistent with prior ERC research, we predict a positive sign. The coefficient on
CONVERTING*ΔEt, 4β , represents the incremental effect of being on the cash basis of accounting
for tax purposes and should have a positive sign if converting firms prior to TRA 86 have reported
earnings that are more informative than earnings of accrual basis firms prior to TRA 86. The
significance of the 4β coefficient is the relevant test of H2. The coefficient on POST*ΔEt, 5β , is the
change in the ERC for the accrual basis firm post-TRA 86, which controls for any change in the
return-earnings relation for all firms attributable to something other than the increase in book-tax
conformity required by TRA 86. We have no prediction on the sign of this coefficient. The main
coefficient of interest for H1 is the coefficient on CONVERTING*POSTt*ΔEt, 7β . This coefficient
represents the incremental ERC for a converting firm after TRA 86 relative to the ERC of a
converting firm before TRA 86 and relative to the ERC of an accrual basis firm before and after
TRA 86. Our predicted sign for this coefficient is negative—consistent with the informativeness of
earnings declining for the converting firms from the pre- to post-TRA 86 period after controlling for
any change in the ERC over the same time period for accrual basis firms.22, 23
22 At first blush, estimating a Basu (1997) type regression may seem to be another plausible way to test our research question. A Basu (1997) regression tests whether accounting earnings are conservative, that is whether accounting earnings incorporate economic losses more quickly than economic profits, by testing the return response coefficient (under the assumption that returns reflect economic earnings) for loss firms (negative returns firms—economic losses) as compared to firms with positive returns. However, one must be careful because in our setting, while we predict that the cash firms become more unconditionally conservative (consistent with the findings in Guenther et al., 1997), we would not predict they become more conditionally conservative in the sense that they would recognize economic losses
21
We also estimate an alternative specification, which includes both changes and levels of
earnings in the regression. This specification is as follows:
where Et is earnings before extraordinary items (Compustat data #18), scaled by the market value of
equity (MVE, data #199 * data #25) in year t-1 and all other variables are as defined above. The
combined ERCs, defined as the sum of the slope coefficients of the level and change of earnings,
are the items of interest in this regression. Thus, the sum of the coefficients β10 and β11 is the main
ERC of interest analogous to β7 in equation (5). As with β7 in equation (5), we predict the sum of
β10 and β11 to be negative indicating that the informativeness of earnings declined after TRA 86
more for the converting firms than for the accrual basis firms. The sum of coefficients, β5 and β6,
are analogous to β4 in equation (5) and are the coefficients of interest for H2. We predict this sum
more quickly. Rather the converting firms in our setting would become more conservative only in an effort to reduce tax liabilities and not to reflect a better measure of performance or to reduce the chance of a lawsuit. Thus, the prediction in a Basu (1997) type regression would be that of no difference between the converting and accrual basis firm-years and due to the small sample and resulting low power in our study, testing a null hypothesis prediction is not a strong test. (Indeed, when we estimate a Basu (1997) regression we find no difference between the cash and accrual basis firm-years but because of the low power of the tests we do not place much weight on these results.) We note that there are other studies that compare the timeliness of earnings across countries using a Basu (1997) type regression (e.g., Ball, Kothari, and Robin, 2000 and Ball, Robin, and Wu, 2003) and while appropriate in their setting, that type of analysis is not suitable for our research question for the reasons given above. 23 We note that while Francis et al. (2005) call tests of R2s an alternative measure of informativeness, they do not test the explained variability of the returns-earning relation. They cite problems comparing R2s across samples (see also Gu, 2002 and Cramer, 1987) and the lack of a model that maps signal credibility into the explained variability of the earnings return relation. In addition, Lev and Zarowin (1999) explain that changes in R2s might be driven by changes in the relative importance of nonaccounting information, with no change in the informativeness of earnings on a stand alone basis, whereas the “…declining slope coefficients indicate a deterioration in the value relevance of earnings to investors, irrespective of the effects of other information sources” (page 356). Thus, we rely on the slope coefficient and do not conduct tests on the R2s.
22
to be significantly positive consistent with the converting firms having more informative earnings
relative to the accrual firms prior to TRA 86.24
5. Empirical Results
5.1 Difference-in-Differences ERC Regression Test – Earnings Changes Specification
Table 3 presents the results of estimating regression equation (5). Recall that our first
hypothesis is that the converting firms will have a greater decline in informativeness (as measured
by ERCs) than accrual firms following TRA 86. The coefficient of interest for this hypothesis is 7β
(the coefficient on the variable CONVERTING*POSTt*ΔEt,). The results in Table 3 reveal that 7β
is negative and significant (p-value = 0.001, one-tailed test) indicating that the converting firms
exhibit a decline in their ERC after TRA 86 that is significantly greater than the decline in the ERC
for the accrual basis firms over the same period. Thus, the evidence is consistent with an increased
level of book-tax conformity reducing the informativeness of earnings as predicted in our first
hypothesis.
Our second hypothesis is that the converting firms have more informative earnings pre-TRA
86 than accrual firms pre-TRA 86. The main coefficient of interest for H2 is, β4. Consistent with
our hypothesis, the coefficient on CONVERTING*ΔEt, 4β , is significantly positive (p=0.001, one-
tailed test) indicating that the converting firm-years exhibit a greater ERC relative to the accrual
basis firm-years in the pre-TRA 86 period. This result is consistent with greater information 24 Our analysis is predicated on efficient markets. When we say loss of information we mean a loss of information in earnings as a measure of economic performance for the period. What our tests examine is whether the increase in conformity for the converting firms results in accounting earnings which contain less information useful to the market. While an efficient market can and will get information from other sources, these other sources may be more costly and not equally available to everyone. In a conformed system, firms or analysts may disclose some type of pro-forma earnings measures to better approximate performance. However, it is important to consider how (or whether) this information dissemination would be regulated and whether everyone would have access to this alternative source of information.
23
content of earnings for firms allowed to use different accounting methods for book and tax (the
converting firms) relative to firms where the income measures are conformed to a greater degree
(the accrual basis firms). This result is also similar to the cross-country findings that the
informativeness of earnings is greatest in countries with low degrees of book-tax conformity.
However, the β4 result could be caused by other differences between these two samples for reasons
unrelated to the method of accounting used for tax which is why our primary hypothesis (H1)
focuses on the difference-in-difference test, 7β .
We also note that the coefficient on the change in earnings, 3β , is significant and positive as
expected, indicating that the ERC is positive for accrual firms prior to TRA 86. The coefficient on
POST*ΔE, 5β , is designed to capture any broad changes in informativeness after TRA 86 and is
marginally significant (p=0.09, two-tailed test) indicating that the ERC declined for the accrual
basis firms post-TRA 86.
Panel B of Table 3 presents the separate sub-group coefficients and how these coefficients
are derived from the difference-in-difference regression. Panel B Table 3 also reports tests of the
coefficient differences between all four sub-groups of firm years. The first and third rows repeat the
estimated coefficients, 4β and 5β , from Panel A and the F statistic is the square of the t statistic from
panel A and these results are discussed above. The second and fourth rows present new
information. The second row compares converting firm years pre-TRA 86 to converting firm years
post-TRA 86 and shows that there is a statistically significant decline in informativeness after these
firms were required to increase their degree of book-tax conformity (difference in ERCs pre-to-post
TRA 86 is -2.008, significant at 0.0001). The fourth row of Panel B reveals that there is no
statistically significant difference between the ERCs of converting firms and accrual firms post-
TRA 86. We did not present a formal hypothesis with regard to this comparison but our informal
24
prediction was that there would be no difference between these groups because they now have the
same level of book-tax conformity. The results are consistent with this conjecture.
Overall our results are consistent with both of our hypothesis. The converting firms
experienced a decline in the informativeness of earnings after their degree of book-tax conformity
increased. This result is unlikely to be caused by factors other than the increase in book-tax
conformity because this decline in informativeness is greater than the decline experienced by other
firms in the same industries over the same time period. In addition, the firms on the cash basis
method of accounting for tax purposes have more informative earnings before TRA 86 relative to
accrual basis firms which also supports our conjecture that book-tax conformity reduces the
informativeness of earnings. While this latter result could be caused by other factors that differ
between the groups of firms (i.e., a self-selection problem), this concern is mitigated because we
find that the decrease after TRA 86 is greater for the converting firms than the accrual firms and
because these sub-groups of firms are not significantly different in terms of the informativeness of
earnings after TRA 86 when their degree of book-tax conformity is the same. In sum, the inference
from our results is that book-tax conformity and the resulting managerial response is costly in terms
of a decline in informativeness of earnings.
5.2 Difference-in-Differences ERC Regression Test - Alternative Specification with Earnings
Changes and Earnings Levels
Table 4 presents the results of estimating equation (6). The coefficients of interest are the
sums of the coefficients on the level of and change in earnings. Analogous to the coefficient β7 in
equation (5), our main variable of interest for the difference-in-difference test of H1, is the sum of
the coefficients β10 and β11. The sum of these coefficients represents the incremental effect of being
a converting firm after TRA 86 relative to being an accrual firm and relative to being a converting
25
firm prior to TRA 86. The sum of these coefficients is -1.35 and an F test reveals that the sum is
significantly different from zero (p-value of 0.030) consistent with our first hypothesis. The
coefficients of interest for our second hypothesis are β5 and β6. The data reveal that the sum of
these two coefficients is 1.56 and an F test indicates that this sum is significantly different from zero
with a p-value of 0.009.
In Panel B we present data analogous to Table 3, Panel B. In the first part of Panel B we
show the separate sub-group ERCs and how each of these can be derived from the regression results
in Panel A. In the second part of Panel B we present tests of differences between each of the four
sub-groups. The results are very similar to those in Table 3 with the exception of the accrual firms
no longer having a significant decline in the informativeness of earnings after TRA 86 indicating
less of a need for the control group in this specification. However, the comparisons reveal, similar
to Table 3, that converting firms have a higher ERC prior to TRA 86 than accrual firms (p-value =
0.009) and the converting firms have a significant decline in ERC after TRA 86 (p-value = 0.006).
Also similar to Table 3 results, following TRA 86 there is no discernable difference (p-value =
0.192) between the converting firms and the accrual firms in terms of ERC as would be expected
now that the level of conformity is the same for the two sub-groups.
Thus, as with the changes only specification, the results from this specification are
consistent with both our hypotheses. The converting firms have more informative earnings than
accrual firms prior to TRA 86 consistent with less book-tax conformity leading to more informative
earnings. In addition, after the required increase in conformity the converting firms have a decline
in informativeness and this decline is greater than the decline for accrual basis firms.
26
5.3 Additional Tests
5.3.a Are Changes in Persistence and Growth Driving the Decrease in the ERC?
It is well known that firms with more persistent earnings and firms with greater growth
opportunities have higher ERCs (Collins and Kothari, 1989). While we estimate a differences-in-
differences regression specification, it is possible that our converting firms had a decline in earnings
persistence that is driving the observed decline in their ERCs. In addition, because our descriptive
evidence shows that the converting firms are higher growth firms prior to TRA 86 than the accrual
basis firms and that the converting firms have a greater decrease in sales growth after TRA 86, it
could be that this change in growth (mean reversion) for the converting firms is driving the change
in the ERC. We conduct several tests to investigate the effects of these potential omitted correlated
variables.
First, we estimate earnings persistence for our firms using the following regression:
Et+1 = α + βEt + ε. (7)
Specifically, to test the statistical difference between our converting firms and accrual basis firms
both before and after TRA 86, we estimate the following regression:
where all variables are as defined previously.25 We present the results in Table 5. We
estimate the regression over all firm-years and test the difference in persistence for converting
versus accrual basis firms both before and after TRA 86.
The regression results indicate that there is no significant difference in persistence between
25 We have estimated the same regression with earnings scaled by average total assets (as in Sloan, 1996) and we obtain qualitatively identical results—all inferences are unchanged with respect to whether earnings persistence declines for the converting firms. For example, the coefficient β7 (coefficient on the interaction representing the incremental difference in persistence from pre to post TRA 86 for converting firms as compared to accrual basis firms) is 0.081, with a p-value of 0.608.
27
the converting and accrual firms in the pre-TRA period, no significance difference in the change
(decline) in persistence between the pre and post periods between the two samples, and no
significant difference in persistence between the two samples in the post-TRA period. Further, the
ERC results in Table 3 indicate that the results are driven by a large decline in the ERC of the
converting firms with a much smaller decline in the ERC of the accrual firms. Thus for persistence
to explain the results requires the converting firms to exhibit a larger decline than the accrual firms
in persistence – this is not the case.
To test whether mean reversion in growth is driving our results, we use an alternative
control sample – accrual method firms matched with the converting firms on the basis of average
annual sales growth in the pre-TRA 86 years and industry (4-digit SIC code as before). In other
words, we use a sub-set of the current control sample of accrual basis firms. The sub-set (matched
firm by firm) is one that has average annual sales growth in the Pre TRA 86 years that is within 10
percent of the average annual sales growth of the firms in our converting sample. If there is a
converting firm that does not have a firm in the accrual basis sample that is a close enough match in
terms of SALES GROWTH (i.e., within +/- 10 percent), then we exclude those converting firms. As
a result, for these tests our sample includes only 46 converting firms (374 firm-years) and 46
accrual basis firms (400 firm-years).
Using this new control set of firm-years, we re-estimate equation (5) and present the results
(which are analogous to those in Table 3) in Table 6. Although the sample size is reduced and we
are now matching on SALES GROWTH so that any mean reversion in growth that affects the ERC
will do so similarly across the two firms, the results are very close to those presented in Table 3.
The main coefficient of interest, β7, is negative and significant (p-value of 0.001). This result is
consistent with H1 – the informativeness of earnings decreased as the converting firms were forced
28
to increase conformity.
We also continue to find evidence consistent with H2, which predicts that the converting
firms have more informative earnings relative to the accrual basis firms prior to the tax law change.
The results in Table 6 reveal that the coefficient on CONVERTING*ΔEt, β4, is positive and
significant indicating that the converting firms do indeed have a higher ERC relative to accrual
basis firms prior to TRA 86, consistent with our second hypothesis. Thus, our results with respect
to both our hypotheses hold after matching on pre-TRA 86 SALES GROWTH.
As another test of whether the results in Table 3 are affected by correlated omitted variables
we estimate a regression that includes several additional control variables (for growth and other
factors) in the regression, each interacted with the ΔE variable. The variables we include are 1)
SIZE (measured as the natural log of total assets (data #6)), 2) B/M (book-to-market ratio) (data #60/
(data #199 * data #25)), 3) ROA (return on assets) (data #18/ the average of data #6 in years t and t-
1), 4) LEVERAGE ((data #34 + data #9)/ data #6)), and 5) SALES GROWTH from year t-1 to year t
((data #12 in year t – data # 12 in year t-1)/data # 12 in year t-1).
In untabulated tests that include these additional control variables we find that the
coefficient on 1) SIZE interacted with ΔE is significantly negative (p-value of <0.001), 2) B/M
interacted with ΔE is insignificant (p-value of 0.444)26, 3) ROA interacted with ΔE is marginally
significantly positive (p-value of 0.068), 4) LEVERAGE interacted with ΔE is insignificantly
different from zero (p-value of 0.962), and 5) SALES GROWTH interacted with ΔE is significantly
positive (p-value of 0.044). With regard to the main variable of interest in the difference-in-
differences specification ( 7β in equation (1)) we find that it remains significantly negative (p-value
26 If SALES GROWTH interacted with ΔE is removed from the regression, the book to market interaction term becomes significantly negative indicating both proxy for growth.
29
of 0.002, one-tailed) as predicted. The remaining coefficients in the regression are of similar
significance to the reported results in Table 3.
Thus, based on all the evidence in these robustness checks, our results do not appear to be
driven by any potential differences between groups of firms such as persistence, growth, or size.
5.3.b. Alternative Control Sample
Because of the importance of controlling for macroeconomic events and the possibility that
the accrual basis firms do not properly control for these events, we also conduct our main tests
(difference-in-differences regression as specified in Table 3) on an alternative control sample of all
1,054 firms with sales less than $5 million in 1985 (labeled small sales firms) as described above.
We then restrict the sample to observations in the same industries as our converting basis firms,
which reduces the control sample to 425 observations from 1985. (We note that this sample only
includes 19 of the 38 industries from our converting sample. As a result we keep only the firms in
our converting sample that have firms in these 19 industries resulting in a sample of only 33 firms
from the original converting sample.) We then restrict our new control sample to firms that have
1985 change in earnings data available, which results in 289 firms. We then eliminate observations
not available in CRSP resulting in only 105 firms. Finally, we retain only firms with available data
in 1985 and 1988 and end up with a sample of only 89 firms. Over the five years prior to TRA86
(1981-85) and the five years after (1988-92) these 89 firms provide an alternative control sample of
583 observations and a new converting sample of 33 firms and 263 observations, respectively.
Thus, this alternative control sample yields a considerably smaller N than our original sample.
However, we continue to estimate the same difference-in-difference regression as shown in Table 3.
The results using this alternative control sample are presented in Table 7. The coefficient on
our main test variable, β7, (CONVERTING*POST*ΔE) is -2.54 (p-value of 0.002). Thus,
30
converting firms have a greater decline in the ERC after TRA 86 than do the small-sales firms. The
coefficient, β4, is 2.48 and continues to be significantly positive (p-value of 0.001). Thus, the
converting firms have a higher ERC prior to TRA 86 than the small sales firms.27 We again present
the ERC for each sub-group separately and the tests of ERC differences between each of the four
sub-groups. The converting firms have a significant decline in ERC after these firms are required to
increase their level of conformity (F statistic = 9.17, p-value of 0.003). Again we find that the
converting firms and the small sales firms have no discernable difference in the informativeness of
earnings after TRA 86 indicating that once the level of book-tax conformity is similar between the
groups the difference in terms of informativeness of earnings is eliminated. In sum, the results of
tests using the alternative control sample of firms with sales of less than $5 million are consistent
with our prior results and with both of our hypotheses.
5.3.c. The Effect of Loss Firms
Our first hypothesis predicts and the main results show that greater book-tax conformity is
associated with a loss of informativeness in reported financial accounting earnings. Because the tax
incentives are to lower reported financial accounting income, increasing conformity could result in
more reported financial accounting losses. Indeed, in the sub-samples of firm-years, 18 (20) percent
of the converting (accrual) basis firm-years prior to TRA 86 report a loss, 30 (28) percent of the
converting (accrual) basis firm-years after TRA 86 report a loss, indicating a greater increase in
reported losses for the converting firms relative to the accrual basis firms.
This differential in rates of loss observations could affect the results. Hayn (1995) shows
that the explanatory power and earnings response coefficients are lower for loss observations. To
investigate the effect of loss firm observations on our study we re-estimate equation (1) after
27 This difference suggests this alternative control sample likely contains mostly accrual firms as expected based on the very small number of cash basis firms identified by Guenther et al. (1997) in their search of financial statements.
31
excluding loss observations from the sample and find that the difference-in-differences interaction
term coefficient, 7β (the coefficient on the interaction of CONVERTING*POST*ΔE), is still
negative and significant with a p-value of 0.024 (one-tailed). Thus, the results are not simply driven
by converting firms adopting more conservative accounting and thus reporting more losses, which
have lower ERCs, but also by ERCs for firms with positive earnings actually declining after
conformity increases.28
5.3.d Alternative Definition of Earnings
Because the definition of earnings we use in our analysis, earnings before extraordinary
items, is after the tax expense on the firm’s income statement, we conduct a sensitivity tests using
pre-tax earnings (data #170) in place of earnings before extraordinary items to make sure the
accounting for income taxes before and after TRA 86 does not induce our results. Although there
was no explicit change in the accounting standard regarding the accounting for income taxes during
our sample period, firms’ tax expense could have changed significantly because of tax law changes
in TRA 86. Using the revised definition of earnings, our results are qualitatively unchanged. In the
ERC difference-in-differences regression (Table 3) the coefficient on the main variable of interest,
β7, is negative and significant (p-value of 0.0012, one-tailed). Thus, the results are robust to the use
of pre-tax earnings rather than earnings before extraordinary items.
5.3.e Controls for Income Shifting
Finally, because there is some evidence of firms shifting income into post-TRA 86 tax years
in order to take advantage of lower tax rates (Guenther, 1994; Scholes, Wilson and Wolfson, 1992),
we estimate the difference-in-differences regression by excluding data for the tax year 1988 to 28 However, if one believes the greater incidence of losses for the converting firms is a result of the increase in book-tax conformity and the resulting change in incentives for firm management, then even if our results were due to the increase in loss observations for the converting-basis firm-years this would not be problematic but rather would further exemplify that a consequence of book-tax conformity is that there will be a lowering of earnings informativeness to market participants.
32
ensure that the results are not somehow driven by this income shifting. Again, we find results
consistent with the results in Table 3, the coefficient on the difference-in-difference term, β7, is
negative and significant with a p-value of 0.0005, one-tailed. Overall, the main inferences of the
analysis are unaffected by the inclusion of control variables, the use of pre-tax earnings as the main
regressor, or by the exclusion of tax years to which income may have been shifted by firms in
response to the lower tax rates implemented in TRA 86.
5.4 Discussion of Self-Selection
Because firms could choose to be either cash-basis or accrual-basis firms prior to TRA 86,
the reasons why firms chose to be one or the other could affect how they respond to increased
conformity and perhaps then affect our results (i.e., a self-selection issue). Guenther et al. (1997)
conduct a test for the effects of self-selection using a two stage switching regression and find that
their results are robust.
In our empirical tests we use a difference-in-differences approach to examine our research
question. This means that, in effect, we are using the same converting firm as its own control
(creating the first difference) while at the same time using a sample of accrual basis firm-years as a
control for any macroeconomic effects occurring around TRA 86 that would have caused our results
(the second difference). As a result, the reasons why the firm chose (or did not choose) the tax
accounting method cannot be affecting our results because the firm acts as its own control. The
only case in which the firm would not provide a good control for itself would be if the firm changed
around the same time as TRA 86 and it changed in such a way to affect a factor that impacts
earnings response coefficients. From our statistics (Table 2) we note that growth could be one of
these characteristics. However, in the sensitivity analyses discussed above we conduct two separate
tests to control for growth, 1) we match on pre TRA 86 sales growth, and 2) we include two
33
different proxies for growth (both the book-to-market ratio as in Collins and Kothari (1989) and
sales growth) in the regression as control variables to control for their effect on the earnings
response coefficient. Even after conducting the matched sample test and separately including
growth controls, the main results are still significant. The converting firms have a significant
decrease in their earnings response coefficient from the years prior to TRA 86 to the years after
TRA 86 and this decrease is bigger than any decrease the accrual firms experienced over the same
time period. In addition, as stated above, the result showing that the ERCs of the two groups of
firms (converting and accrual basis firms) are not significantly different after TRA 86 should
mitigate concerns over self-selection. The firms do not appear to be inherently different in terms of
their return-earnings relation for reasons other than the level of conformity because once the degree
of conformity is the same; their ERCs are the same as well.
6. Conclusions
This paper examines the effect of book-tax conformity on the informativeness of financial
accounting earnings. Increasing the degree of conformity between accounting earnings and taxable
income has been put forth as a way of curtailing both earnings management and aggressive tax
planning. Our inquiry exploits a unique sample of firms first studied by Guenther et al. (1997) that
were required to change from the cash method to the accrual method for tax purposes. Despite the
fact that this was a change to the tax code, not to GAAP, Guenther et al. (1997) find that firms
altered their financial accounting choices as a result of increased tax costs from accruing income.
We examine the capital market consequences of this increased conformity. We predict that
earnings that are more closely linked to taxable income will contain more noise and thus will be less
informative to market participants. We predict that increased conformity reduces the
34
informativeness of earnings because managers rather than reporting an earnings number that reflects
their private information will report earnings to minimize taxes, thus introducing possible
downward bias and noise.
We find evidence consistent with our predictions. Firms that were required to convert to the
accrual basis method for tax purposes, which increased the level of conformity between tax and
financial accounting reporting, experience a decline in long-window ERCs following TRA 86. In
order to ensure that this decline was not caused by a macroeconomic event that affected all firms,
not just those subject to the increased conformity requirement of TRA 86, we compare the decline
in the ERC to the change in the ERC for a sample of industry-matched firms not subject to the
conformity changes imposed by TRA 86. We find that the sample of firms required to switch to the
accrual basis method for tax purposes had significantly greater declines in the long-window ERC
over the same time period. Thus, the evidence indicates that increasing book-tax conformity tends
to result in a degradation of the informativeness of financial reporting earnings. To our knowledge
this is a unique result in that it is a case of a tax law change that has an adverse consequence on the
informativeness of accounting earnings.
We view our results as triangulating prior studies on 1) book-tax conformity using estimated
taxable income measures for large samples of U.S. data and 2) studies that investigate the effect of
conformity across countries. Each type of research design has its strengths and weaknesses which
is why it is important to examine the evidence from all the studies together. The strength of our
study is that we use U.S. data after an actual required change in book-tax conformity. As a result,
we overcome the main limitations of the prior work because we do not have to estimate taxable
income and the legal and institutional characteristics are the same both before and after the change
since the data are all from the U.S. A limitation of our study, however, is that we have only a small
35
set of firms for which this rule change applied and thus the results may not be generalizable to the
entire population of U.S. firms if, for example, there is something different about these firms as
compared to the remaining U.S. firms. However, based on the sum of the evidence from the studies
of large samples of U.S. firms (e.g., Hanlon et al., 2005), the international studies (e.g., Guenther
and Young, 2000; Ball, Kothari, and Robin, 2000) and our current paper, the results are consistent
with higher levels of book-tax conformity being associated with less informative earnings.
Many proponents of increased book-tax conformity claim the easy fix for corporate financial
misreporting is to eliminate or reduce the differences between book and taxable incomes. From the
tax side, another set of proponents makes the same argument in terms of constraining aggressive tax
reporting. In both cases the idea is that with stronger conformity firms will have less ability to
simultaneously engage in aggressive tax reporting and aggressive financial reporting. While even
this claim is debatable (see Hanlon and Shevlin 2005), our study provides evidence that the
behavioral response to an increase in book-tax conformity will result in less informative earnings
being reported to shareholders. A loss of information in earnings appears likely even if the tax law
is changed to conform with GAAP (i.e., GAAP does not explicitly change) because that is exactly
what occurred in the small sample of firms in this study.
36
References
Alford, A., J. Jones, R. Leftwich, and M. Zmijewski. 1993. The relative informativeness of accounting disclosures in different countries. Journal of Accounting Research, (Supplement): 183-223.
Ali, A. and L. Hwang. 2000. Country-specific factors related to financial reporting and the
relevance of accounting data. Journal of Accounting Research, (Spring): 1-21. Ball, R., S.P. Kothari and A. Robin. 2000. The effect of institutional factors on properties of
accounting earnings. Journal of Accounting and Economics, (29): 1-51. Ball, R., A. Robin, and J. Wu. 2003. Incentives versus standards: Properties of accounting income
in four East Asian countries. Journal of Accounting and Economics 36 (1-3): 235-270. Basu, S. 1997. The conservatism principle and the asymmetric timeliness of earnings. Journal of
Accounting and Economics (24): 3-38. Beaver, W. H. and S. G. Ryan. 2005. Conditional and unconditional conservatism: Concepts and
modeling. Review of Accounting Studies (10): 269-309. Carnahan, I. and J. Novack. 2002. Two birds, one stone; would firms inflate their earnings if it
meant more taxes? Forbes, March 2, 169 (5): 40. Choi, W., J. Gramlich, and J. Thomas. 2001. Potential errors in detection of earnings management:
Reexamining the studies of the alternative minimum tax of 1986. Contemporary Accounting Research (18): 571-613.
Collins, D. and S.P. Kothari. 1989. An analysis of intertemporal and cross-sectional determinants of
earnings response coefficients. Journal of Accounting and Economics (11): 143-181. Dechow, P. 1994. Accounting earnings and cash flows as measures of performance: The role of
accounting accruals. Journal of Accounting and Economics, (18:1): 3-42. Desai, M. 2005. The degradation of corporation profits. Journal of Economic Perspectives 19
(Fall): 171-192. Dhaliwal, D. 2001. Discussion of ‘potential errors in detecting earnings management: Reexamining
studies investigating the AMT of 1986’. Contemporary Accounting Research (18): 615-623. Dhaliwal, D., D. Guenther, and M. Trombley. 1999. Inventory accounting method and earnings-
price ratios. Contemporary Accounting Research (Fall): 419-436.
37
Dhaliwal, D. and S. Wang. 1992. The effect of the book income adjustment in the 1986 alternative minimum tax on corporate financial reporting. Journal of Accounting and Economics 15 (1): 7-26.
Fan, J., and T.J. Wong. 2002. Corporate ownership structure and the informativeness of accounting
earnings in East Asia. Journal of Accounting and Economics (33): 401-425. Francis, J. and K. Schipper. 1999. Have financial statements lost their relevance? Journal of
Accounting Research (37): 319-352. Francis, J., K. Schipper, and L. Vincent. 2005. Earnings and dividend informativeness when cash
flow rights are separated from voting rights. Journal of Accounting and Economics, 39 (2): 329-360.
Graetz, M. 2005. Graetz offers four-part tax reform plan. Michael Graetz’s Presentation to the
President’s Advisory Panel on Federal Tax Reform. Tax Notes Today, May 11, 2005. TNT 91-81.
Gramlich, J. 1991. The effect of the alternative minimum tax book income adjustment on accrual
decision. Journal of the American Taxation Association, (13): 36-56. Gu, Z. 2002. Cross-sample incomparability of R2s and additional evidence on value relevance
changes over time. Working paper, Carnegie Mellon University. Guenther, D. 1994. Earnings management in response to corporate tax rate changes: Evidence from
the 1986 Tax Reform Act. The Accounting Review, 230-243. Guenther, D., E. Maydew, and S. Nutter. 1997. Financial reporting, tax costs, and book-tax
conformity. Journal of Accounting and Economics (November): 225-248. Guenther, D. and D. Young. 2000. The association between financial accounting measures and real
economic activity: A multinational study. Journal of Accounting and Economics (February): 53-72.
Hand, J. 1993. Resolving LIFO uncertainty: A theoretical and empirical reexamination of 1974-75
LIFO adoptions and nonadoptions. Journal of Accounting Research 31 (1): 21-49. Hanlon, M. 2005. The persistence and pricing of earnings, accruals, and cash flows when firms
have large book-tax differences. The Accounting Review, (80): 137-166. Hanlon, M. and T. Shevlin. 2005. Book-tax conformity for corporate income: An introduction to the
issues. Tax Policy and the Economy 19. Hanlon, M., S. Laplante, and T. Shevlin. 2005. Evidence on the possible information loss of
conforming book income and taxable income. Journal of Law and Economics 48 (October): 407-442.
38
Hayn, C. 1995. The information content of losses. Journal of Accounting and Economics 20: 125-
153. Harris, J.C. 2005. Tax reform panel weighing options, official says. 2005 TNT 106-3. Harris, T., M. Lang, and H.P. Moller. 1994. The value relevance of German accounting measures:
An empirical analysis. Journal of Accounting Research 32 (2): 187-209. Holthausen, R. W. and R. E. Verecchia. 1988. The effect of sequential information releases on the
variance of price changes in an intertemporal multi-asset market. Journal of Accounting Research 26: 82-106.
Hung, M. 2001. Accounting standards and value relevance of financial statements: An international
analysis. Journal of Accounting and Economics 30: 401-420. Imhoff, E. and G. Lobo. 1992. The effect of ex ante earnings uncertainty on earnings response
coefficients. The Accounting Review 67: 427-439. Joos, P., Lang, M. 1994. The effects of accounting diversity: Evidence from the European Union.
Journal of Accounting Research 32 (Suppl.), 141-168. Kang, S. 1993. A conceptual framework for the stock price effects of LIFO tax benefits. Journal of
Accounting Research 31(1): 50-61. Kothari, S.P. 2001. Capital markets research in accounting. Journal of Accounting and Economics
31: 105-231. Lee, C. 1988. Inventory accounting and earnings/price ratios: A puzzle. Contemporary Accounting
Research 5 (Fall): 371-388. Lev, B. and D. Nissim. 2004. Taxable income, future earnings, and equity values. The Accounting
Review (October): 1039-1074. Lev, B. and P. Zarowin. 1999. The boundaries of financial reporting and how to extend them.
Journal of Accounting Research 37: 353-385. Manzon, G. and G. Plesko. 2002. The relation between financial and tax reporting measures of
income. Tax Law Review 55 (2): 175-214. Mills, L. and K. Newberry. 2001. The influence of tax and non-tax costs on book-tax reporting
differences: Public and private firms. The Journal of the American Taxation Association 23 (Spring): 1-19.
Murray, A. 2002. Narrowing tax gap should be a priority of next Congress. Wall Street Journal,
October 8: A4.
39
Phillips, J., M. Pincus, and S. Rego. 2003. Earnings management: New evidence based on the
deferred tax expense. The Accounting Review. Plesko, G. 2000. Book-tax differences and the measurement of corporate income. National Tax
Association Proceedings 1999, 171-176. Plesko, G. 2002. Reconciling corporation book and tax net income, tax years 1996-1998, SOI
Bulletin, U.S. Government Printing Office, Washington, DC, (Spring): 111-132. President’s Advisory Panel on Federal Tax Reform. 2005. Simple, fair, and pro-growth: Proposals
to fix America’s tax system. (November). Scholes, M., P. Wilson and M. Wolfson. 1992. Firms’ responses to anticipated reductions in tax
rates: The Tax Reform Act of 1986. Journal of Accounting Research (Supplement): 161-191.
Scholes, M., M. Wolfson, M. Erickson, E. Maydew and T. Shevlin. 2005. Taxes and business
strategy: A planning approach, Pearson Prentice Hall, Upper Saddle River, NJ 07458. Shackelford, D., and T. Shevlin. 2001. Empirical tax research in accounting. Journal of Accounting
and Economics, (31): 321-387. Sloan, R. 1996. Do stock prices fully reflect information in accruals and cash flows about future
earnings? The Accounting Review 71 (July): 289-315. Subramanyam, K.R. and J. Wild. 1996. Going-concern status, earnings persistence, and
informativeness of earnings. Contemporary Accounting Research (Spring): 251-273. Teoh, S. and T.J. Wong. 1993. Perceived auditor quality and the earnings response coefficient. The
Accounting Review 68: 346-366. U.S. Department of the Treasury. 1999. The problem of corporate tax shelters: Discussion, analysis
and legislative proposals. Washington, D.C., U.S. GPO. Warfield, T., J. Wild and K. Wild. 1995. Managerial ownership, accounting choices and
informativeness of earnings. Journal of Accounting and Economics 20: 61-91. Watts, R. 2003a. Conservatism in accounting part I: Explanations and implications, Accounting
Horizons (17: 3): 207-221. Watts, R. 2003b. Conservatism in accounting part II: Evidence and research opportunities,
Accounting Horizons (17: 4): 287-301. Watts, R., and J. Zimmerman. 1986. Positive accounting theory. Prentice-Hall. Englewood Cliffs,
NJ.
40
41
Weisman, J. 2002. At firms, dual profit pictures, The Washington Post, October 10, Final Edition,
P. A01. Yeo, G., P. Tan, K. Ho, and S. Chen. 2002. Corporate ownership, structure and the informativeness
of earnings. Journal of Business, Finance and Accounting 29: 1023-1046. Young, D. and D. Guenther. 2003. Financial reporting environments and international capital
mobility. Journal of Accounting Research 41 (3): 553-579.
Table 1 Sample Selection
Observations
Converting SampleList of converting firms from Guenther, Maydew, and Nutter (1997) sample 94Less: Firms with missing lagged market value of equity and with fiscal year end change 7
Firms with Compustat data in only 1985 or 1988 18Firms with missing earnings data for either year 2Firms not on CRSP or with missing returns for either year 8Firms that have no matching accrual basis firms in the same four digit sic code 3
Total Converting Sample - number of firms 56
Number of firm-years available for the sample of 56 firms for the years 1981-1985 and 1988-1992 450
Accrual Basis Sample
Firm-years in the Compustat file matching four digit industries as the cash sample with 1985 sales > $5 million, and observations in both years 1985 and 1988, 4,162 for years 1981-1985 and 1988-1992
Less: Firm-years with missing earnings or return data 586Less Converting firm observations 450
Total Accrual Basis Sample - firm-years (377 firms) 3,126
Total Sample -- Converting and Accrual Firm-Year Observations 3,576
Notes: Converting sample includes the firms required to switch from the cash method of accounting for tax purposes to the accrual basis method following TRA 86. Guenther, Maydew, and Nutter (1997) provide evidence with these firms deferring more financial accounting income as a result of the increase in book-tax conformity after this change. The accrual basis sample includes firms in the same industries as the converting firms but were already on the accrual basis of accounting for tax purposes prior to TRA 86.
42
Table 2 Descriptive Statistics
Pre-TRA 1986 n=211 n=1,475 difference in difference in mean median
mean st. dev. median mean st. dev. median p-value p-valueR t 0.213 0.608 0.035 0.159 0.572 0.062 (0.2072) (0.4012)Δ E t 0.00002 0.099 0.011 0.001 0.163 0.006 (0.9083) (0.2331)E t 0.055 0.103 0.066 0.035 0.171 0.066 (0.1034) (0.5025)MVE t 137.651 174.253 68.540 659.471 1,791.409 87.120 (0.0001) (0.0281)MVE t-1 130.638 190.462 65.247 612.556 1,642.174 80.840 (0.0001) (0.0059)ASSETS t 163.739 232.343 81.298 803.317 1,904.721 108.761 (0.0001) (0.0121)SALES GROWTH t 0.216 0.329 0.174 0.156 0.350 0.090 (0.0202) (0.0001)E/P t 0.037 0.109 0.059 0.007 0.248 0.059 (0.0021) (0.9257)B/M t 0.632 0.421 0.524 0.718 0.546 0.604 (0.0075) (0.0313)ROA t 0.057 0.073 0.058 0.044 0.097 0.055 (0.0263) (0.1669)LEVERAGE t 0.215 0.200 0.164 0.228 0.194 0.180 (0.3785) (0.1870)CFO t 0.093 0.167 0.077 0.116 0.212 0.105 (0.1427) (0.0281)
Post-TRA 1986 n=239 n=1,651 difference in difference in mean median
mean st. dev. median mean st. dev. median p-value p-valueR t 0.101 0.532 0.001 0.142 0.520 0.074 (0.2498) (0.1519)
(0.0381) (0.0989) (0.3917) (0.7645)Δ E t 0.043 0.336 0.008 0.032 0.277 0.009 (0.6363) (0.9790)
Notes: This table contains descriptive statistics for the sample. Our measure of change in earnings (ΔE) is the change in earnings before extraordinary items (Compustat data #18) from year t-1 to year t, scaled by the market value of equity (MVE, data #199 * data #25) at the end of year t-1. Our measure of earnings levels is earnings before extraordinary items (Compustat data #18) in year t, scaled by the market value of equity (MVE, data #199 * data #25) at the end of year t-1. Our measure of returns (R) is the raw buy and hold 12 month return beginning in the fourth month after the fiscal year end of t-1 and ending 3 months after the fiscal year-end of year t. ASSETS are the total assets of the firm at year-end (data #6), SALES GROWTH is defined as the percentage increase in current-year sales over the prior year sales (data #12), and LEVERAGE is defined as the long-term debt of the firm scaled by total assets (data (#9+#34)/#6). Return on assets (ROA) is defined as earnings before extraordinary items dividend by average total assets (data #18/average data#6), earnings-to-price (E/P) is earnings before extraordinary items divided by market value of equity at year-end (data#18/MVE), and book-to-market (B/M) is defined as the book value of equity at year-end divided by MVE (data #60/MVE). CFO is cash flows from operations computed following Collins and Hribrar (2002) as the change in current assets minus change in current liabilities minus change in cash plus change in short term debt minus depreciation ( accruals = Δ data4 - Δdata5 - Δdata1 + Δdata34 - data14. CFO = net income (data18) – accruals)). CFO is then scaled by lagged market value of equity. P-values to the right of the table are for tests of means and medians between converting firms and accrual basis firms. The p-values included as rows in the Post-TRA 86 panel of the table (numbers in parentheses) are for tests of differences in the means and medians from Pre-TRA 86 to Post-TRA 86.
RelevantCoefficient differences between groups Coefficients Difference F statistic p-valueConverting pre-TRA 86 vs Accrual pre-TRA 86 2.475 - 0.763 1.712 10.81 0.001Converting post-TRA 86 vs Converting pre-TRA 86 0.467 - 2.475 -2.008 15.39 0.000Accrual post-TRA 86 vs Accrual pre-TRA 86 0.495 - 0.763 -0.268 2.88 0.091Converting post-TRA 86 vs Accrual post-TRA 86 0.467 - 0.495 -0.028 0.03 0.863 Notes: CONVERTING is an indicator variable set equal to one if the firm is a converting firm as defined in Table 1, and zero otherwise. POST is an indicator variable set equal to one for years 1988-1992 (post-TRA 86) and zero otherwise. The pre-TRA 86 period is 1981-1985. All other variables are as defined previously or interactions of previously defined terms. P-values are one tailed if we have a predicted sign and two-tailed where no sign is predicted. Standard errors are computed using Stata's robust command and specifying each firm as a cluster. This statistic is the Huber-White standard errors and fixing within cluster correlation because we have the same firm in the sample repeated times.
45
Table 4 Earnings Response Coefficient Tests – Alternative Specification:
RelevantCoefficient differences between groups Coefficients Difference F statistic p-valueConverting pre-TRA 86 vs Accrual pre-TRA 86 2.657 - 1.097 1.560 6.95 0.009Converting post-TRA 86 vs Converting pre-TRA 86 1.022 - 2.657 -1.635 7.58 0.006Accrual post-TRA 86 vs Accrual pre-TRA 86 0.812 - 1.097 -0.285 2.45 0.118Converting post-TRA 86 vs Accrual post-TRA 86 1.022 - 0.812 0.210 1.71 0.192 Notes: All variables are defined as in Tables 2 and 3. Standard errors are computed using Stata's robust command and specifying each firm as a cluster. This statistic is the Huber-White standard errors and fixing within cluster correlation because we have the same firm in the sample repeated times.
RelevantCoefficient differences between groups Coefficients Difference F statistic p-valueConverting pre-TRA 86 vs Accrual pre-TRA 86 0.656-0.654 0.002 0.00 0.987Converting post-TRA 86 vs Converting pre-TRA 86 0.558-0.656 -0.098 0.48 0.489Accrual post-TRA 86 vs Accrual pre-TRA 86 0.465-0.654 -0.189 6.34 0.012Converting post-TRA 86 vs Accrual post-TRA 86 0.558-0.465 0.093 0.44 0.508
Notes: This table reports tests of persistence in earnings, Et+1 is the dependent variable. All variables are defined as above. Standard errors are computed using Stata's robust command and specifying each firm as a cluster. This statistic is the Huber-White standard errors and fixing within cluster correlation because we have the same firm in the sample repeated times.
RelevantCoefficient differences between groups Coefficients Difference F statistic p-valueConverting pre-TRA 86 vs Accrual pre-TRA 86 2.360-0.711 1.649 9.93 0.002Converting post-TRA 86 vs Converting pre-TRA 86 0.405-2.360 -1.955 14.85 0.000Accrual post-TRA 86 vs Accrual pre-TRA 86 0.716-0.711 0.005 0.00 0.984Converting post-TRA 86 vs Accrual post-TRA 86 0.405-0.716 -0.311 3.04 0.085
Notes: This table uses a matched sample approach in which accrual basis firms were matched with converting firms based on average annual SALES GROWTH in the pre-TRA 86 period. We restrict the sample to converting firms that have a SALES GROWTH match within +/- 10 percent. Thus, our sample of converting firms falls to 46 and we have 46 accrual basis firm matches. Total firm-years in the analysis is 774. All variables are defined as in Tables 2 and 3. Standard errors are computed using Stata's robust command and specifying each firm as a cluster. This statistic is the Huber-White standard errors and fixing within cluster correlation because we have the same firm in the sample repeated times.
RelevantCoefficient differences between groups Coefficients Difference F statistic p-valueConverting pre-TRA 86 vs Small sales firms pre-TRA 86 2.607 - 0.123 2.484 10.65 0.001Converting post-TRA 86 vs Converting pre-TRA 86 0.267 - 2.607 -2.340 9.17 0.003Small sales firms post-TRA 86 vs Small sales firms pre-TRA 86 0.324 - 0.123 0.200 2.40 0.124Converting post-TRA 86 vs Small sales firms post-TRA 86 0.267 - 0.324 -0.056 0.10 0.758 Notes: This table uses an alternative control sample consisting of firms with sales less than $5 million in 1985. Our sample in the analysis is 846 firm-years. All variables are as defined in Tables 2 and 3. Standard errors are computed using Stata's robust command and specifying each firm as a cluster. This statistic is the Huber-White standard errors and fixing within cluster correlation because we have the same firm in the sample repeated times.


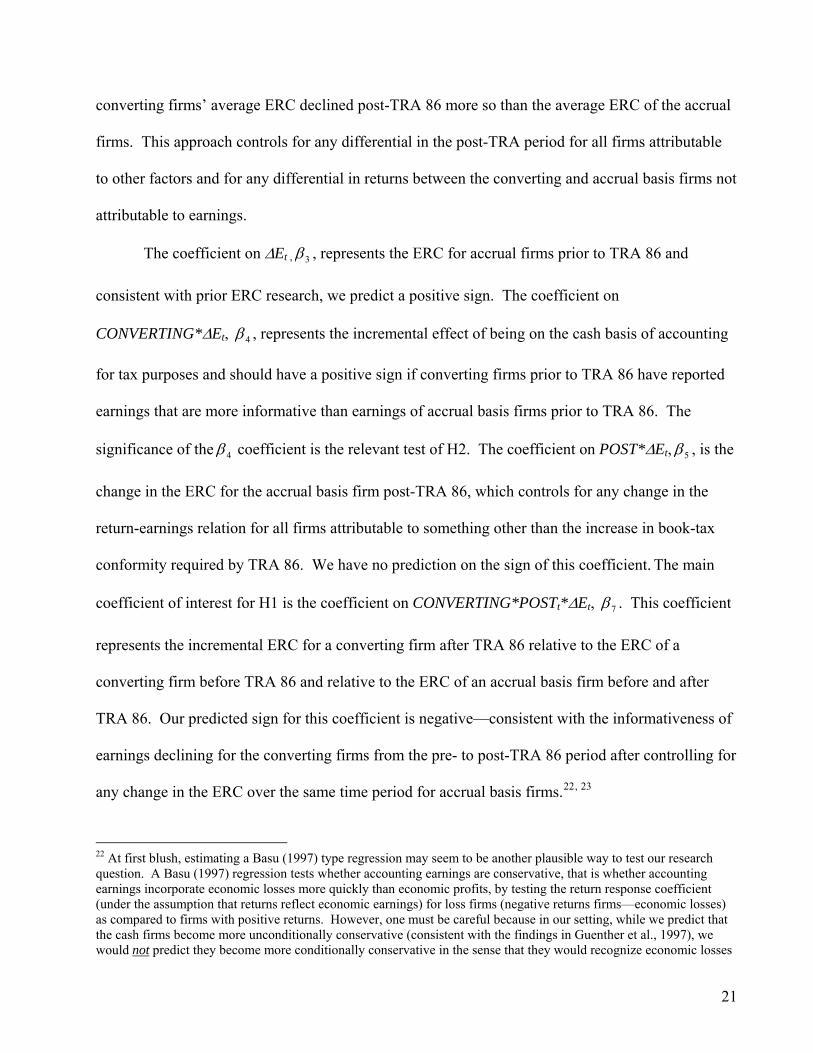

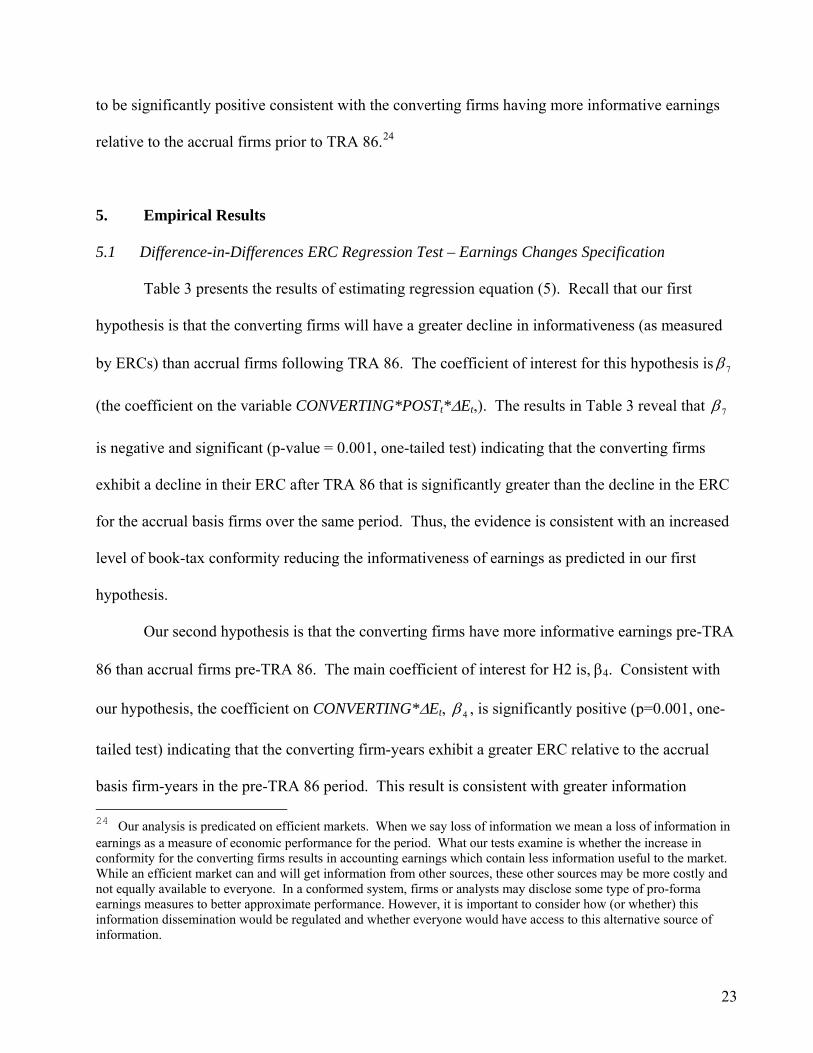


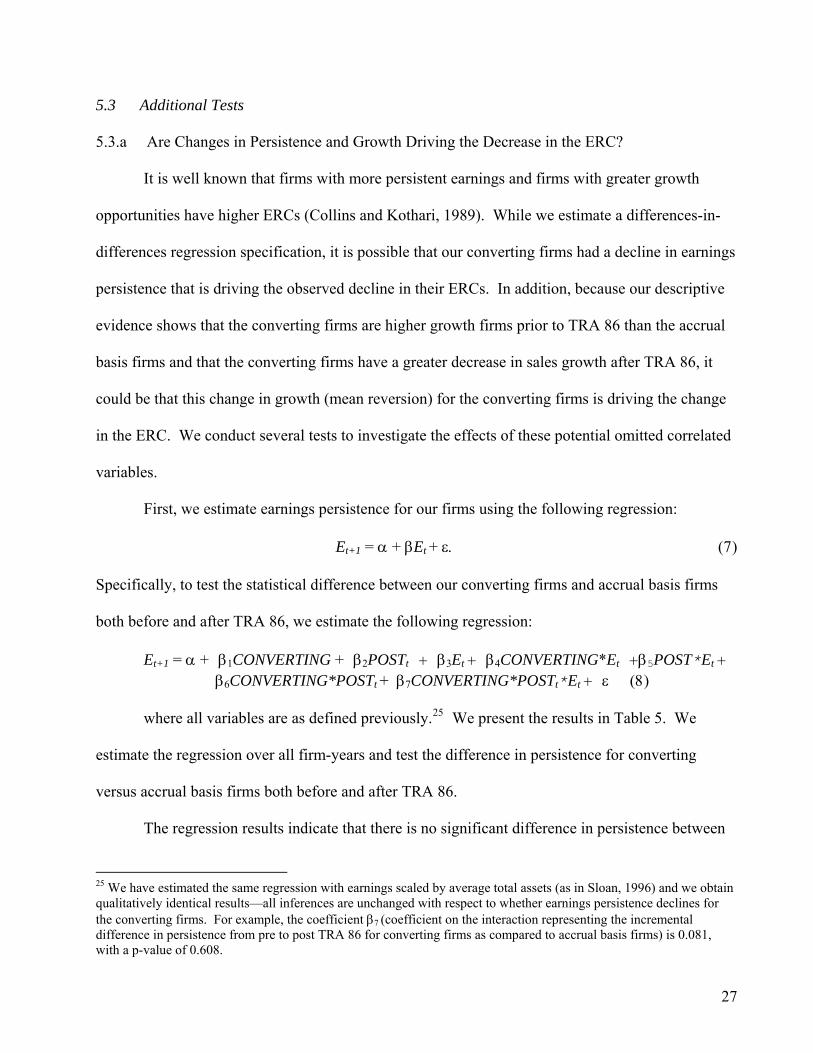
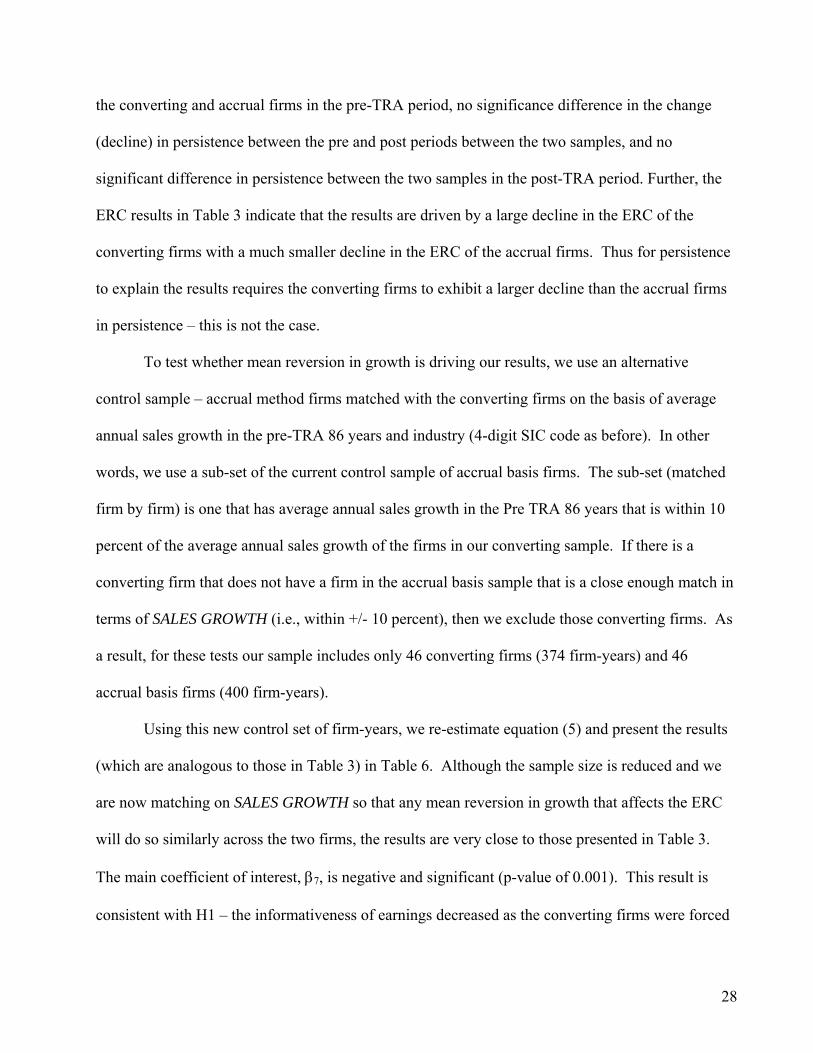


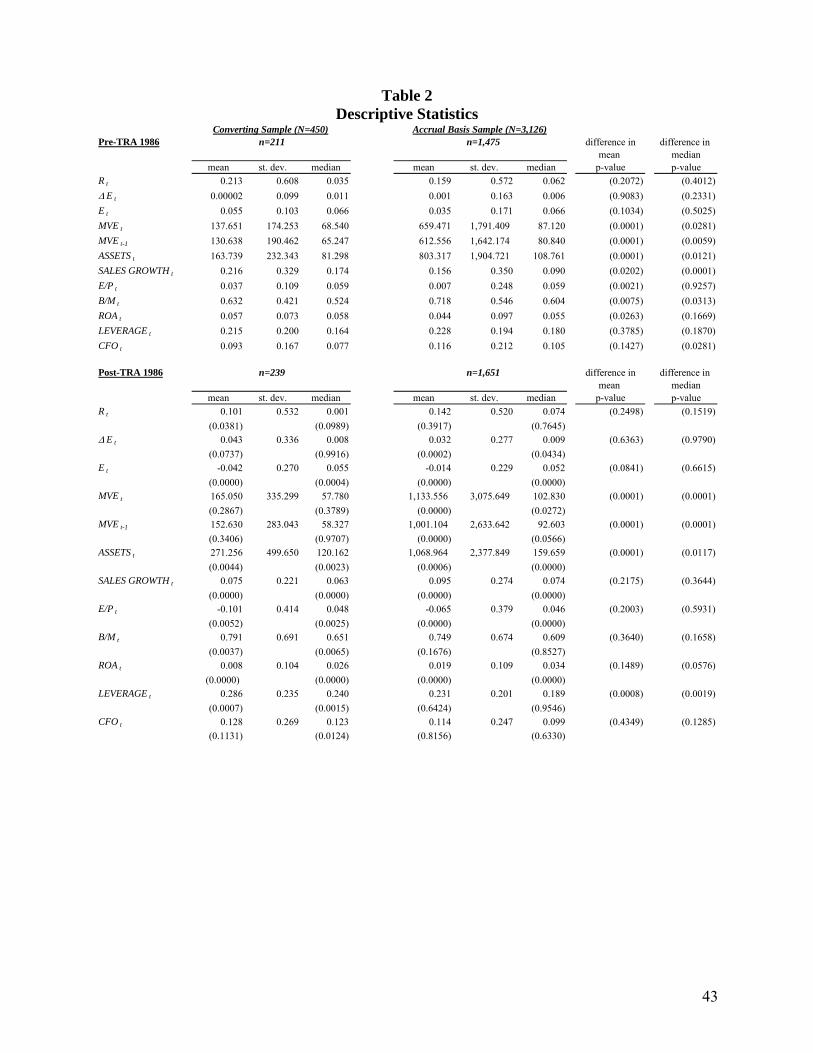


![Fuzzy Logic, Informativeness and Bayesian Decision-Making ... · arXiv:math/0610876v1 [math.GM] 28 Oct 2006 Fuzzy Logic, Informativeness and Bayesian Decision-Making Problems Peter](https://static.documents.pub/doc/80x56/5e3d445f624afc47794ef204/fuzzy-logic-informativeness-and-bayesian-decision-making-arxivmath0610876v1.jpg)
