24
Automotive & Assembly Boost! Transforming the powertrain value chain – a portfolio challenge
Automotive & Assembly
Boost!Transforming the powertrain value chain – a portfolio challenge


3Boost! Transforming the powertrain value chain – a portfolio challenge
Content
Introduction 4
Automotive powertrains will become a different industry – a portfolio game 5
Electric cars on the horizon, but the optimized combustion engine will be 6 key to the portfolio game for decades
Powertrain revenues will more than double by 2030 9
Six major shifts that will change the automotive powertrain industry 12
Technology shifts 12
Regional shifts 13
Value-add shifts 14
Skill shifts 15
Employment shifts 16
Raw materials shifts 17
Implications of powertrain value chain transformation 18
Key contacts 21
4
Introduction
The global market for automotive powertrains will more than double by 2030 to EUR 460 billion, creating 420,000 new jobs worldwide. Globalization and electro-mobility are the key drivers. The internal combustion engine (ICE) will be standard for the fore see able future, but the electric car is on its way. Numerous technologies like op ti mized, low-emission ICE (e.g., 3-cylinder), hybrid, and electric vehicle will coexist. This is turning the automotive powertrain industry into a portfolio game and exposing it to high uncertainty, as major shifts will transform the value chain. Now, the race is on to capture attractive growth opportunities and manage rising challenges in the trans-forming powertrain industry.
Once the stable backbone of the automotive industry, powertrains will become a business area composed of a variety of technologies and business models, trig-gered by forth coming regulations restricting vehicle carbon emissions and changes in customer behavior. Although at least 90 percent of cars will still run on an ICE ten years from now, it is very uncertain which technologies will prevail. At the same time, the automotive industry is gaining momentum: automotive powertrain market revenue – driven by electro-mobility and globalization – will more than double from EUR 190 billion to EUR 460 billion by 2030, and new players will enter the market. This transformation will be accompanied by dramatic shifts in the value chain. Carmakers, suppliers, and potential new entrants need to orient themselves now in order to lever-age their strengths in this portfolio game to create opportunities and manage potential risk and challenges.
To help companies gain perspective in this changing market, McKinsey has developed a detailed value chain model to project the effects that such shifts will have on power-train components and technologies. From these market developments, future com pe-ten ces that will be required of the powertrain industry can be derived, e.g., raw materi-als management and “me-chem-tronic” skills (mechanical, chemical, and elec tronics) for employees.
5Boost! Transforming the powertrain value chain – a portfolio challenge
Automotive powertrains will become a different industry – a portfolio game
The automotive industry is currently dealing with a number of discontinuities, which will turn the powertrain into a portfolio of technologies. One of the major discontinui-ties is stricter CO2 regulation. This results in optimization of current ICE technology with a trend toward smaller, highly-charged engines, turbochargers, compressors, and sophisticated direct injection. The trajectory also points to the electrification of the power train in either pure electric or hybrid vehicles.
Another trend affecting the industry is very strong growth in emerging markets, mostly in BRIC countries (Brazil, Russia, India, and China). Car and powertrain production is shifting to these markets. As cus tomer needs and regulation requirements vary, technology differences across regions are large. Furthermore, local governments try to leverage alternative power trains and prepare their carmakers and suppliers to build up competences. China, for example, is providing well-directed funding to build up an electric powertrain industry – in order to simply leapfrog the era of ICEs. As a result, there is still a per sis tent production undercapacity in these markets, while there is some over capacity in established markets.
Additionally, discontinuity in customer preferences creates ultra-low-price segment outperformance. On the other hand, the premium market is showing above-average growth rates resulting in a mid-market squeeze. This evolution will accelerate tech nol-ogies that massively reduce CO2 emissions for larger premium cars as well as push highly cost-competitive technologies, e.g., 3- or even 2-cylinder engines for small cars.
A final trend affecting the automotive value chain also comes from the consumer per-spective. Cars are losing their importance as status symbols, and eco-friendly, green technologies are gaining importance – especially among young people. New mobility concepts are needed to satisfy their demand for individual, but more flexible mobility, e.g., car sharing. Often these new concepts are embedded in eco-friendly mobility systems that connect different modes of mobility (e.g., trains and cars).
Overall, we will see a variety of powertrain technologies and business models operat-ing in the same space. In addition, significant activities to reduce vehicle weight will be required to ensure electrification success. While ICEs have held the pole position in the powertrain industry for over 125 years, a portfolio of different powertrain concepts needs to be explored now, including
� Internal combustion engine (ICE): normal and optimized engines, like micro hybrids
� Hybrid electric vehicle (HEV; with and without plug-in): optimized combustion engine and electric motor
� Range extended electric vehicle (REEV; with and without plug-in): electric motor only, but combustion engine to generate energy for range extension
� Battery electric vehicle (BEV): electric motor and battery as energy storage
� Fuel cell electric vehicle (FCEV): electric motor and fuel cell as energy storage.
6
Electric cars on the horizon, but the optimized combustion engine will be key to the portfolio game for decades
Depending on the evolution of CO2 regulatory policy, several powertrain mix scenarios are conceivable. If strict CO2 emission targets are achieved by 2050, battery-powered vehicles (for short journeys) and fuel cell vehicles (for long journeys) will dominate the landscape in the long term. If regulation is more moderate, ICEs will be built into nearly half of all vehicles – still in 2050 – especially as secondary, less complex motors in range extended electric vehicles.
Next to CO2 regulation, the electrification trend is advanced by the increasing com-petitive ness of all electric powertrain technologies (“xEVs”: BEV, REEV, FCEV) with ICEs due to a convergence of total ownership costs. This is not only driven by an increase in oil price and the rising supply of renewable energy, but especially by the high speed of cost reduction expected for new technologies. Battery cells for example cost EUR 400 to 600 per kWh today. Advances in chemistry and automation along with a fine-tuning of systems design will massively reduce those costs to EUR 250 to 350 per kWh in the next ten years.
To reflect this uncertainty in regulation, McKinsey’s powertrain study defined three scenarios to assess future development. All scenarios consider CO2 emissions from well to wheel, whereas today often only the emissions from tank to wheel are considered.
� “Below 100”: moderate CO2 emission reduction to 95 g CO2/km in 2050. This would imply that regulation as of 2020 will not get much tighter. Only the tank-to-wheel standard will shift to a well-to-wheel standard
� “Below 40”: strong CO2 emission reduction to 40 g/km in 2050 – a scenario that foresees a continuation of increasingly restrictive emission standards
� “Below 10”: very strict CO2 emission reduction to 10 g/km in 2050, representing the global warming goal of a maximum increase of 2 degrees Celsius transferred to the transportation industry.
Reaching the Below 40 and Below 10 scenario emission reduction targets is not fea-sible with pure ICE; electrification will be needed.

7Boost! Transforming the powertrain value chain – a portfolio challenge
Powertrain future between two extreme scenarios, Below 40 being the basis for further analysis
The Below 40 scenario envisions increas-ingly restrictive standards, favoring a fully electric powertrain world dominated by REEVs. Here, the ICE would be the pre-eminent technology up to 2030. There-after – with tighter regulation – REEV/BEV penetration greatly increases and replaces ICE/HEV technology. In the long run, BEV is the prevailing technology in smaller vehi cles, REEVs become dominant in medium-sized vehicles, and FCEVs are the power train of choice in larger vehicles. The power train portfolio game starts today and peaks in 2030. BEV, REEV, and FCEV dominance by 2050 leads to an electric-powertrain-only scenario.
In the very strict Below 10 scenario, elec-trification is even more prevalent, leading to a BEV and FCEV world. The ICE will dominate until 2025, but then lose mar-ket share to xEVs. In the long run, BEVs become dominant in smaller vehicles and FCEVs in larger ones. HEV/REEV will serve as bridging technology.
And even regulation in the modest Be- low 100 scenario will encourage electrifi-cation and result in a world of hybrids and BEVs. ICE remains dominant until 2030+, but BEV will become economically com-petitive after 2030. In this modest sce-nario no infrastructure for FCEV is going to be built. In the long run, HEV and REEV/BEV existence leads to a dual (electric/mechanical) powertrain scenario.
0
10
20
30
40
50
60
70
80
90
100
Global market shares by powertrain technologyPercent of units produced
REEV
HEV
BEV
FCEV
SOURCE: McKinsey
Note: ICE: Internal combustion engine incl. Micro-Hybrids and optimization; HEV: Hybrid electric vehicle (with e-motor and opt. plug-in); REEV: Range extended electric vehicle (opt. plug-in); BEV: Battery electric vehicle; FCEV: Fuel cell electric vehicle
Powertrain future between 2 extreme scenarios, "below 40" being the most probable
45 20504035302520152010
BELOW 40
ICE (optimized)
BEV
FCEV
REEV
HEV
BELOW 100
0
10
20
30
40
50
60
70
80
90
100
45 20504035302520152010
Global market shares by powertrain technologyPercent of units produced
SOURCE: McKinsey
Note: ICE: Internal combustion engine incl. Micro-Hybrids etc.; HEV: Hybrid electric vehicle (with e-motor and opt. plug-in); REEV: Range extended electric vehicle (opt. plug-in); BEV: Battery electric vehicle; FCEV: Fuel cell electric vehicle
ICE (optimized)
BELOW 10
FCEV
BEV
HEV
REEV
0
10
20
30
40
50
60
70
80
90
100
45 20504035302520152010
Global market shares by powertrain technologyPercent of units produced
SOURCE: McKinsey
Note: ICE: Internal combustion engine incl. Micro-Hybrids etc.; HEV: Hybrid electric vehicle (with e-motor and opt. plug-in); REEV: Range extended electric vehicle (opt. plug-in); BEV: Battery electric vehicle; FCEV: Fuel cell electric vehicle
ICE (optimized)

8
All scenarios show that technologies are about to change radically. While the long-term dominant powertrain technology cannot yet be predicted, some cornerstones can be derived. The first reality is that all technologies have to be engineered today. Research and development of electric powertrains are a significant share of R&D budgets, and the competition for technological leadership and definition of quasi standards is already on. But from a sales perspective, in the next ten years ICEs will be dominant – in 90+ percent of cars. Electrification will become a reality even in the short term – 20 to 35 percent of cars will have an electric motor by 2020. In the medium term, combinations of ICE and electric motors (especially HEVs) will capture market shares of 40 to 60 percent. Finally by 2050, the electric powertrain either as a sole solution or as a hybrid will dominate in all scenarios.
Players in the industry need to prepare to control bundles of technologies over the next several car generations that differ by region. Due to the striking differences in technologies between scenarios, truly robust options can only be found on the com-ponent level.

9Boost! Transforming the powertrain value chain – a portfolio challenge
Powertrain revenues will more than double by 2030
With the changes in technology, a lot of business opportunities will be created. Worldwide, automotive powertrain revenues will more than double from EUR 190 bil-lion to EUR 460 billion by 2030 (Exhibit 1).
While vehicle production will grow 3 percent per year until 2030, powertrain revenues will increase at a rate of 5 percent – 2.5 times the size of today’s market as technolo-gies become more complex.
The overall powertrain market growth of approximately EUR 270 billion will exceed global vehicle growth even though cost improvements are demanded by carmakers for components that are unchanged in performance. As higher performance and more features are needed to meet CO2 regulations, ICE powertrain costs will increase by vehicle (e.g., because of turbocharger), and the cost for electrifying the powertrain will significantly increase due to the high cost of batteries. 80 percent of the growth will result from the gradual shift from ICE to xEV technology in the Below 40 scenario.
With stricter regulations, the growth of the powertrain industry will be even stronger. The market could exceed EUR 550 billion as in the Below 10 scenario. Fully-electric vehicles would penetrate the market by 2030, thus boosting sales for high-priced bat-tery cells and battery systems.
This electro-mobility effect is intensified by a regional shift and the over-proportionate growth of the BRIC markets, which accounts for around 20 percent of the industry growth. The growth will be accompanied by dramatic shifts in the value chain, affect-ing market fundamentals and required competences.
Exhibit 1
Powertrain revenues will grow by EUR 270 billion until 2030
Global vehicle productionMillion units
Global powertrain revenuesEUR billions
459
2010
187
2030
+5%
+272
2020
301
114
93
65
2010 2020
+3%
2030
SOURCE: Global Insight; McKinsey
Below 100
Below 10
187 261 367
187 304 556
BELOW 40CAGR1
1 Compound annual growth rate

10
Technology shifts from ICE to xEV
“xEV market will be twice the size of ICE market”
Regional shifts from industrialized to emerging countries
“China’s and India’s markets will grow three times faster than triad markets”
Value-add shifts between players and business opportunities
“To keep carmakers’ value-add share stable, coverage of 50 percent of elec-tric motor and all battery packaging and integration is required”
Six major value chain shifts until 2030Market shifts
11Boost! Transforming the powertrain value chain – a portfolio challenge
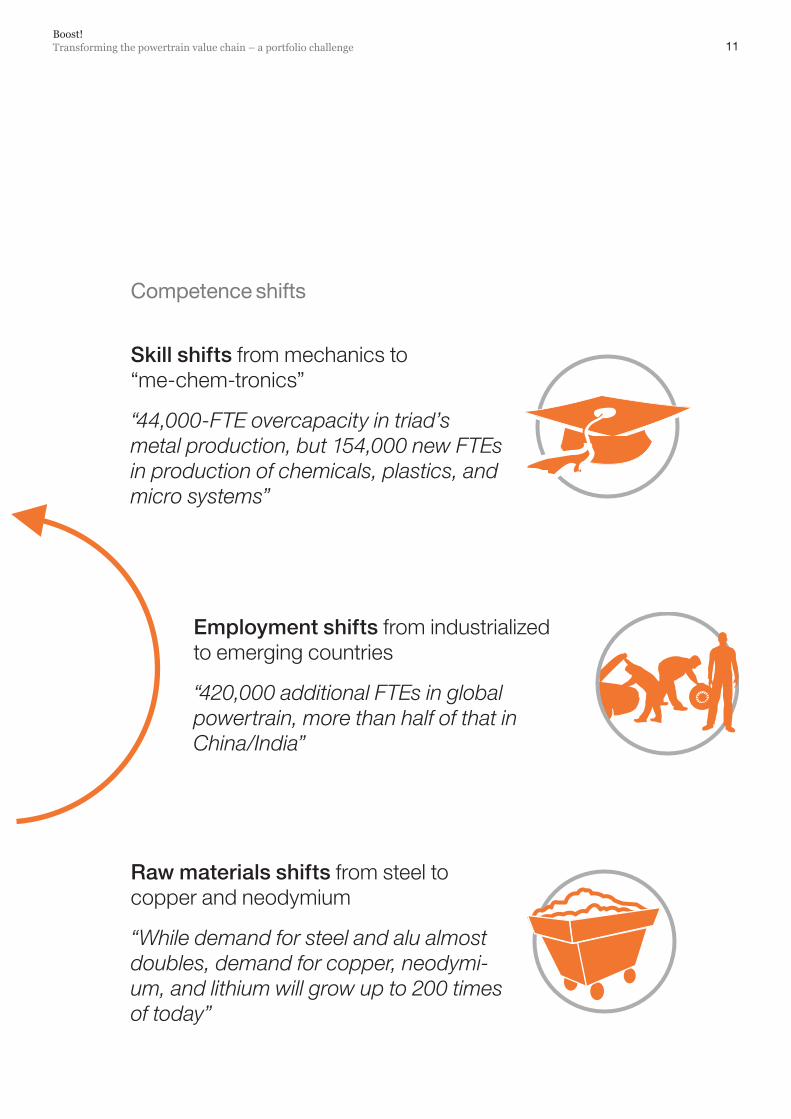
Skill shifts from mechanics to “me-chem-tronics”
“44,000-FTE overcapacity in triad’s metal production, but 154,000 new FTEs in production of chemicals, plastics, and micro systems”
Employment shifts from industrialized to emerging countries
“420,000 additional FTEs in global powertrain, more than half of that in China/India”
Raw materials shifts from steel to copper and neodymium
“While demand for steel and alu almost doubles, demand for copper, neodymi-um, and lithium will grow up to 200 times of today”
Competence shifts

12
Six major shifts that will change the automotive powertrain industry
The tremendous growth in the powertrain industry is fostered by technology and regional shifts, resulting in major changes in the industry value chain, required skills and competences, employment trends, and the demand for raw materials.
Technology shifts
The major shift is primarily induced by the electrification already starting with micro hybrids today. By 2030, the market for xEV components – e.g., battery, electric motor – will be twice the size of the market for ICE components. By 2020, one in three cars (approximately 30 million) will be equipped with an (additional) electric engine. By 2030, two in three cars (approximately 70 million) will have an electric engine, but three in four cars (approximately 100 million) will still have an (additional) ICE.
The portfolio game will be played on the component level. Each component will have its own growth trajectory: electric engines and batteries are undoubtedly booming seg ments. Components that will profit from the increasing complexity (e.g., trans-mission and turbocharger) will continue growing in revenue through 2020. At that point, however, demand will significantly decline (Exhibit 2). The increase in vehicle production will temporarily conceal the decline in pure ICE components, but it will be evident in the medium term. For suppliers this will require an assessment of how their portfolios are exposed to different market growth rates and which strategies are needed to either capture the market growth or to handle a potential market decline. Also, growth oppor tunities outside the traditional product portfolio – leveraging core competence to enter new products – should be considered.
Exhibit 2
Different growth patterns expected for each type of component
Global revenuesEUR billionsComponent
Electric motor
Global vehicle productionMillion units
114
93
65
+3%
203020202010
While car production is expectedto grow by 3% p.a. … … growth of single components varies significantly
+22% 51
211
Crankshafts
3.42.7
+1% -2%2.9
Turbocharger
BELOW 40
+1%
2030
2.3
2020
0%2.62.6
2010
CAGR
SOURCE: Global Insight; McKinsey

13Boost! Transforming the powertrain value chain – a portfolio challenge
Regional shifts
Market growth for all major regions is expected, but while the triad markets of Europe, North America, and Japan will only grow by 2 to 4 percent annually until 2030, China and India will do so three times as fast, growing by 9 percent per year (Exhibit 3). This rate will make China and India the third largest powertrain market by 2030.
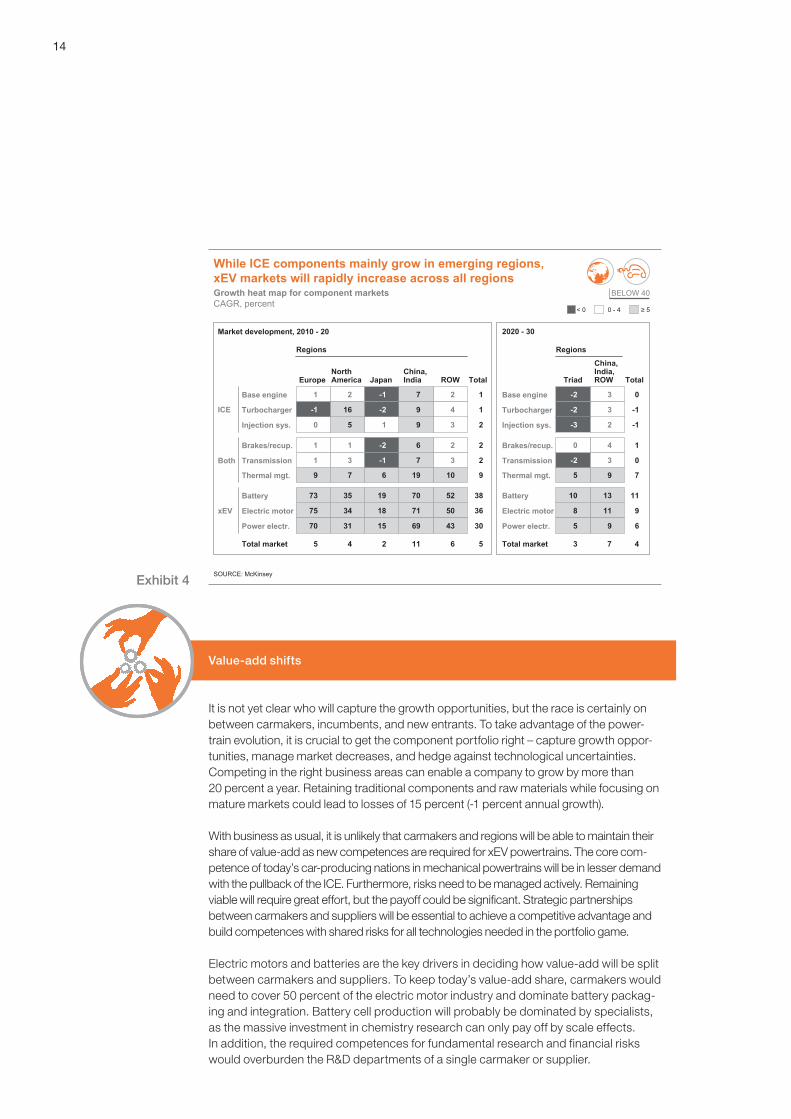
On the component level there will be differences between the regions (Exhibit 4). While ICE components mainly grow in emerging markets, xEV markets will rapidly increase across all regions. Decreases in the ICE component markets will be moderate for the triad markets from 2010 to 2020. After that, the decreases will become more marked. The moderate decrease in the first ten years will be largely driven by a catch-up race toward the optimization of ICEs – mainly in North America, where turbochargers, for example, will show annual growth rates of 16 percent.
In emerging markets, ICE components will grow moderately even up to 2030, but growth rates for the xEV components will be even higher throughout the next 20 years. Thus, emerging markets and especially Chinese suppliers and carmakers could be in a comfortable position to capture the powertrain growth wave. All technologies will be in high demand, so no “break-down” of “old” industry structures for the enablement of new technologies is required. Triad markets in contrast will have to fight against the “stickiness” of the combustion engine world that may slow down the evolution.
Exhibit 3
China and India will grow 9% p.a., becoming the third largest market by 2030
SOURCE: McKinsey
BELOW 40
2010 2020 2030
CAGR2010 - 30Percent
North America +4
Europe +4
Japan +2
China + India +9
ROW1 +6
Total +5
Powertrain market size EUR billions
4234 47
16611472
6544 90
14 8739
694223
459301
187
1 Rest of World
14
Value-add shifts
It is not yet clear who will capture the growth opportunities, but the race is certainly on between carmakers, incumbents, and new entrants. To take advantage of the power-train evolution, it is crucial to get the component portfolio right – capture growth oppor-tunities, manage market decreases, and hedge against technological uncer tain ties. Competing in the right business areas can enable a company to grow by more than 20 percent a year. Retaining traditional components and raw materials while focusing on mature markets could lead to losses of 15 percent (-1 percent annual growth).
With business as usual, it is unlikely that carmakers and regions will be able to maintain their share of value-add as new competences are required for xEV powertrains. The core com-petence of today’s car-producing nations in mechanical powertrains will be in lesser demand with the pullback of the ICE. Furthermore, risks need to be managed actively. Remaining viable will require great effort, but the payoff could be significant. Strategic partner ships between carmakers and suppliers will be essential to achieve a competitive advantage and build competences with shared risks for all technologies needed in the port folio game.
Electric motors and batteries are the key drivers in deciding how value-add will be split between carmakers and suppliers. To keep today’s value-add share, carmakers would need to cover 50 percent of the electric motor industry and dominate battery packag-ing and integration. Battery cell production will probably be dominated by specialists, as the massive investment in chemistry research can only pay off by scale effects. In addition, the required competences for fundamental research and financial risks would overburden the R&D departments of a single carmaker or supplier.
Exhibit 4
While ICE components mainly grow in emerging regions, xEV markets will rapidly increase across all regions
SOURCE: McKinsey
Total market 4 112 6 5
Market development, 2010 - 20 2020 - 30
Total market 3 7 4
Growth heat map for component marketsCAGR, percent
Base engine
Turbocharger
Injection sys.
ICE
Electric motor
Battery
Power electr.
North America Japan
China,India ROW Total
1
1
2
2 2
16 4
5 3
7
9
9
-1
-2
1
36
38
30
35 52
34 50
31 43
70
71
69
19
18
15
xEV
China, India,ROWTriad Total
Base engine
Turbocharger
Injection sys.
Thermal mgt.
Transmission
Brakes/recup.
Electric motor
Battery
Power electr.
0
-1
-1
3
3
2
-2
-2
-3
75
03-2
10 4
9
11
6
13
11
9
10
8
5
Thermal mgt.
Transmission
Brakes/recup.
Both
97 10196
23 37-1
21 6-2 2
BELOW 40
Regions
≥ 50 - 4< 0
9
5
Regions
Europe
1
-1
0
73
75
70
9
1
1

15Boost! Transforming the powertrain value chain – a portfolio challenge
Over time, different profiles of value-add depth will appear: at the beginning, carmak-ers do have a strategic interest to dominate the new xEV components to drive system performance, build up (sourcing) competence, and reduce dependency of very few electric Tier-1 suppliers. In the long run, carmakers might profit from leveraging a sup-plier base, opening growth opportunities especially to today’s Tier-2 supplier.
Next to value-add shifts, the powertrain transformation offers tremendous chances for new business models along the value chain. Integrated mobility concepts allow com-panies to increase their share of the customer’s wallet.
Skill shifts
There will be a demand for 420,000 additional FTEs in the global powertrain industry over the next 20 years.1 But the skills and competences required will change. A shift of skills and competences from mechanics to “me-chem-tronics” will occur. More elec-tronics and chemicals competences will be required across all regions (Exhibit 5).
Overall, the share of chemicals and electronics specialists will double from today’s level of around 20 percent of the powertrain workforce to 40 percent in 2030. This implies that more than 90 percent of the additional jobs created will require electronics and chemicals competences. Qualifying, recruiting, and training employees for these new jobs in electronics and chemicals in the manufacturing, research, and develop-
Exhibit 5
Required skills shift from mechanics to “me-chem-tronics” –420,000 new jobs especially in chemistry and electronics
SOURCE: McKinsey
1 Full-time equivalents2 E.g., from casting, grinding, and milling to mixing, filling, winding, and coating
Employees in powertrain industryThousand FTEs1
+35
+196
+193
From mechanics to “me-chem-tronics”
BELOW 40
ElectronicsChemistry
Mechanics/assembly2
2030
1,515
286
298
931
2010
1,091
93102
896
+424100%
1 Estimation based on typical employment intensities by component and region; without taking significant shifts in imports/exports into account and assuming that all components are produced in the country of car production.

16
ment sectors will prove challenging in the very near future for the industry as a whole and for individual players. Carmakers, suppliers, and governments will have to under-take joint efforts to develop these competences. Nationwide programs need to be launched, and universities and other research institutes have to be granted significant budgets to tackle this skill development challenge. The future of the production and R&D sites is tied to their ability to adapt to these new competence requirements.
Employment shifts
In global production there will be a decrease in demand for the metal and mechanical workforce, a reduction of 47,000 FTEs. At the same time, there will be an increase of 110,000 FTEs in jobs related to plastics and 148,000 FTEs related to micro systems. In global R&D the number of mechanical engineering employees will decline by 8,000, whereas the number of employees skilled in chemistry, materials, electronics, and IT science will increase by 69,000 FTEs (Exhibit 6).
The development of regional competences will be essential as regions compete for these jobs. Most of the new components are very asset intensive. Asian countries might have advantages in labor cost, subsidies, raw materials access, and a strong consumer electronics industry, but triad markets might compete with their automation and engineering power as well as their market size. Batteries for example are difficult to transport due to the risk of overheating when they are not under the control of a management system.
Exhibit 6SOURCE: McKinsey
Traditional technologies losing importance in production and R&D, high demand for chemical and electronics competences
Regions
≥ 150 - 14< 0
NorthAmer-ica Japan
China,IndiaEurope ROW
Metal -11 -23 28 -5-10
18 10 57 2538Micro systems
Total
-21
Chemical 9 4 20 918 60
Plastics 15 10 37 1632 110
Joining 5 -1 19 511 39
Mechanical -11 -20 22 -5-12 -26
Assembly 4 -6 32 713 50
148
29 215-26 5290Total 360
Competences
Regions
≥ 3< 0 0 - 2
NorthAmer-ica Japan
China,IndiaEurope ROW
Chemistry/material science
Software/IT
3 3 6 38
2 2 3 23
Total 6 8 21 818
Electrical engi-neering 5 4 9 410 32
23
Mechanical engineering -4 -1 1 -1-3 -8
Thermodynamics 0 0 2 00 2
12
61
TotalCompetences
BELOW 40Regional shift in employees, 2010 - 30Thousand FTEs
Production R&D
17Boost! Transforming the powertrain value chain – a portfolio challenge
Therefore, which region will import or export components will be key to future job deployment. Under the assumptions that all components of a car are produced in the country where the car production takes place, more than half of the required addition-al 420,000 FTEs in the global powertrain industry will be located in China and India. By 2030, the demand for FTEs in these regions may double from 230,000 to 470,000, accounting then for one-third of the global powertrain workforce. China and India even need to build up their workforce’s classical competences (largely mechanical), whereas workforces in triad countries need to transform and develop in the new “me-chem-tronics” competences. High asset intensity and low labor share will make xEV production attractive even for high-wage countries.
In Europe, approximately 110,000 new jobs will be created both in production and R&D – an increase of more than one-third. The new jobs will be created in chemicals and elec-tronics, as the demand for FTEs in mechanics-dominated industries stagnates.
North America will experience a demand for approximately 35,000 additional FTEs by 2030. This overall increase more than compensates for the decrease in mechanical and assembly jobs by 17,000 FTEs.
Japan is the only region with an actual net decrease in required FTEs – 20,000 FTEs, around 10 percent of the total powertrain workforce. This reduction is mainly driven by the reduced demand for mechanical employees in production (-50,000), which cannot be compensated by the increasing demand for chemical and electrical employees.
The employment evolution will massively be affected by the competitiveness of local suppliers and their export success. Grants, regulations, and incentives are launched to position local engineering and production. These actions need to be closely moni-tored as they may distort competition and hinder cost reductions required for the xEV technologies to compete against traditional combustion technology.
Raw materials shifts
Managing raw materials will be essential. New components that are already facing shortages in raw materials today – such as rare earth elements (for electric motors) and lithium (for batteries) – will be stretched to a much greater extent. Also, carbon fibers and other lightweight solutions are gaining in popularity.
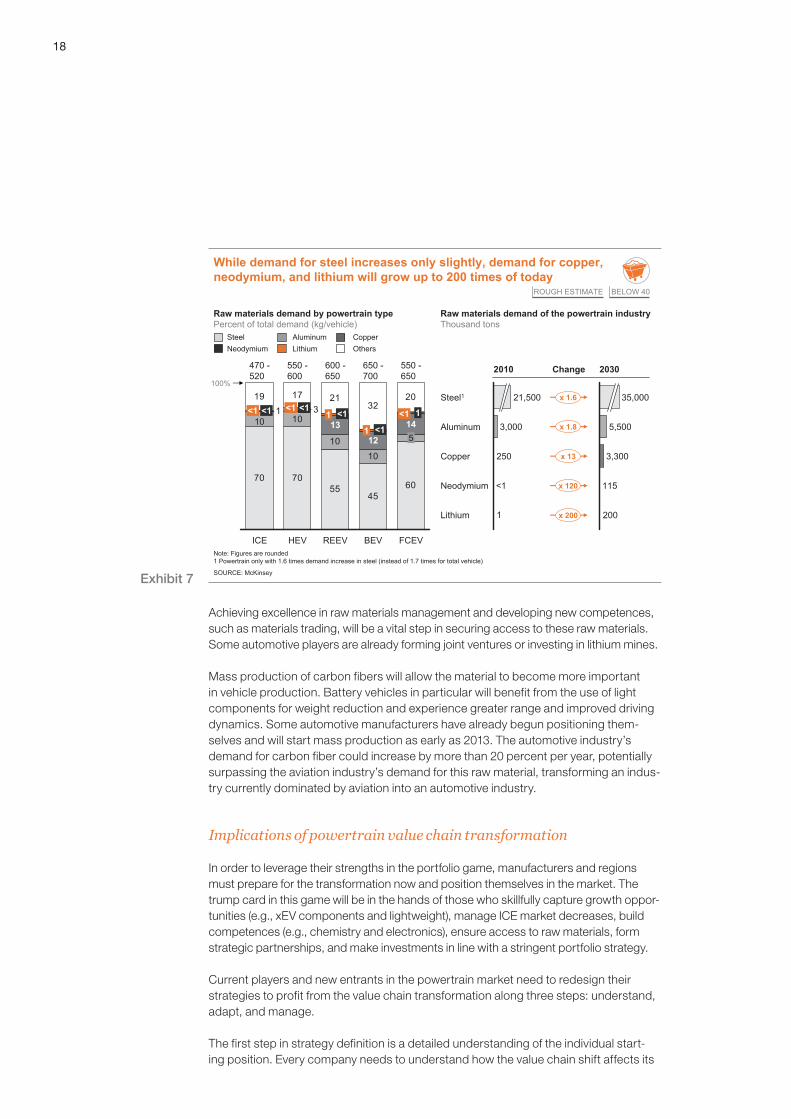
Demand for steel and aluminum for the powertrain will almost double, with change rates of 1.6 and 1.8 respectively (similar including car body2). Compared to the moderate increases predicted for steel and aluminum, the demand for copper will be extreme – 13 times today’s levels by 2030. This spike will be driven by the increasing demand for electric motors. The rise will be even more staggering for neodymium. The demand for this rare earth element is expected to increase 120-fold. Topping the list will be lithium. The need for Li-Ion batteries will drive demand for this element in the industry to 200 times the current level (Exhibit 7).
2 Including car body production, there is a change of 1.7 for steel, growing from approximately 23 million tons today to 40 million tons in 2030 and the same change of 1.7 for alu mi num, growing from almost 5 million tons to 8 million tons.
18
Achieving excellence in raw materials management and developing new competences, such as materials trading, will be a vital step in securing access to these raw materials. Some automotive players are already forming joint ventures or investing in lithium mines.
Mass production of carbon fibers will allow the material to become more important in vehicle production. Battery vehicles in particular will benefit from the use of light components for weight reduction and experience greater range and improved driving dynamics. Some automotive manufacturers have already begun positioning them-selves and will start mass production as early as 2013. The automotive industry’s demand for carbon fiber could increase by more than 20 percent per year, potentially surpassing the aviation industry’s demand for this raw material, transforming an indus-try currently dominated by aviation into an automotive industry.
Implications of powertrain value chain transformation
In order to leverage their strengths in the portfolio game, manufacturers and regions must prepare for the transformation now and position themselves in the market. The trump card in this game will be in the hands of those who skillfully capture growth oppor-tunities (e.g., xEV components and lightweight), manage ICE market decreases, build competences (e.g., chemistry and electronics), ensure access to raw materials, form strategic partnerships, and make investments in line with a stringent portfolio strategy.
Current players and new entrants in the powertrain market need to redesign their strategies to profit from the value chain transformation along three steps: understand, adapt, and manage.
The first step in strategy definition is a detailed understanding of the individual start-ing position. Every company needs to understand how the value chain shift affects its
Exhibit 7SOURCE: McKinsey
Raw materials demand by powertrain typePercent of total demand (kg/vehicle)
Raw materials demand of the powertrain industryThousand tons
1Lithium
Neodymium <1
Copper 250
Aluminum 3,000
Steel1 21,500
200
115
3,300
5,500
35,000
2010 Change 2030
x 1.6
x 1.8
x 13
x 120
x 200
70 7055
4560
10
1010
19 17 2132
2031
100%
FCEV
550 -650
514
<1 1
BEV
650 -700
12
<1
1 <1
REEV
600 -650
131 <1
HEV
550 -600
<1 <1
ICE
470 -520
<1
While demand for steel increases only slightly, demand for copper, neodymium, and lithium will grow up to 200 times of today
Steel Aluminum CopperNeodymium Lithium Others
ROUGH ESTIMATE BELOW 40
Note: Figures are rounded1 Powertrain only with 1.6 times demand increase in steel (instead of 1.7 times for total vehicle)
10

19Boost! Transforming the powertrain value chain – a portfolio challenge
current business on a component level. Carmakers, for example, need to understand how electrification and hybridization affect complexity cost.
The second step for companies is to identify how to profit from the opportunities in the shifting market environments. They have to adapt their portfolio to capture (regional) growth opportunities with current products (e.g., expand footprint in emerging mar-kets), transfer their competences to new products (e.g., battery system management, electric motor), and potentially exit (e.g., ICE-driven) business areas to free up capital and allow investments in new, more value-generating terrains. The powertrain portfo-lio game will be on for several decades, but companies must determine their actions now – waiting is no option. Taking little steps early on with pilot projects, for example, will be key to benefiting from the change as long as xEV volumes are very low.
One of these early actions is the definition of a clear make/buy/cooperate strategy for each powertrain component. Portfolio management on the component level is integral to setting R&D priorities and defining investment/divestment/cooperation options. Component market development and differentiation potential have to be aligned with the competences and capabilities of each company.
Market development and total future market size of components need to be checked for robustness across scenarios. The next important issue in deriving a component strategy is the differentiation potential of each component. What are the opportunities and threats for the future market participants? The market perspective for all compo-nents has to be matched with market participants’ current position and their future plans. Each player should assess its own competences and capacities and decide where to stay active or enter new business areas (e.g., battery, carbon fiber reinforced composites – CFRCs), where to build competence and capacity, and where to reduce involvement (Exhibit 8).
Exhibit 8SOURCE: McKinsey
Low HighToday’s competences/assets
Specific component strategies can be derived from the assessment of companies’ capabilities
SUPPLIER PERSPECTIVE
Low HighLow
High
Differentiation potential
Fuel cell stacks CFRC1 chassis
Powerelectronics
Brakes and recuperation
Power electronics –“push for excellence”
▪ Try to become preferred partner for major carmakers
▪ Invest in R&D and produc-tion process optimization
▪ Build joint venture with carmakers
▪ Invest in R&D and produc-tion in strategic partner-ship with carmakers
Robustness of invest/growth
Brakes and recuperation –“reach scale effects”
Fuel cell stacks –“gain a foothold and manage investment”
▪ Try to reach high volumes to benefit from scale effects
▪ Build up R&D capabilities to absorb outsourcing from carmakers
▪ Look for consortia partners to diversify risk
▪ Amortize R&D through scale and protect by patents
Electric motor –carmakers’ home turf:“try to support”
▪ Develop superior sub-components to become first choice of carmakers
▪ Push selected sub-compo-nents and build up R&D and production capabilities
CFRC1/lightweight chassis –“deep partnership”
EXEMPLARY STRATEGIES
1 Carbon fiber reinforced composites
Electricmotor

20
Beyond component portfolio strategy, xEV players have to ensure that the EV com-ponents meet the automotive industry’s tough requirements regarding quality and logistics. They need to develop market entry strategies and new business models to leverage the unique electrification opportunities and thoughtfully consider preparing options for an exit strategy for ICE-focused components.
The third step of strategy definition is to manage uncertainty. Companies have to establish “scenario thinking” with defined trigger points (e.g., regulation changes, incentive changes, changes in customer preferences) to track market development. To cope with a “moving” market, companies have to develop a flexible transformation path to adjust their trajectory to market needs. Strong raw materials management and a sustainable build-up of “me-chem-tronics” competence are key success factors. Finally, each company needs to define a transformation path to meet new regional, competence, and capacity requirements.
Governments will play an important role in the powertrain evolution, as new eco-friendly technologies need funding, regulation, and incentives to take off and as mas-sive shifts in the value chain will occur. Governments will have to cautiously assess the implications of their actions on costs and investments. It can massively harm the prof-itability and financial stability of the industry if regulations are too tight. If regulations are too loose, things won’t move.
To enable the evolution of a strong local powertrain industry, cooperation between industry and the public sector is needed to define the xEV roadmap based on a sound business case. This roadmap has to incorporate clear guidelines regarding “preferred” powertrain technology, access to raw materials, qualification of employment to pre-pare for the growing need for “me-chem-tronics” (first in R&D and in the long run in production), infrastructure and energy supply implications, regulations, and incentives. Concrete action plans should be jointly developed (e.g., large electro-mobility show-cases to be built in specific regions). In addition to optimizing their own situations, gov-ernments need to secure global alignment and harmonization regarding the electrifi-cation of the powertrain to control complexity for all players in the powertrain market.
Joint efforts of industry and government will prove decisive in the race to secure profit in the powertrain portfolio game. Together, they can master the transformation of the powertrain value chain shifts.
21Boost! Transforming the powertrain value chain – a portfolio challenge
Key contacts
“Boost! Transforming the powertrain value chain – a portfolio challenge” is a global study of McKinsey & Company. For selected technological deep dives, the study was supported by the Laboratory for Machine Tools and Production Engineering (WZL) of the RWTH Aachen University. The content in this publication is only a brief excerpt of the full results. We would be happy to discuss these topics with you in more depth.
Europe
Dr. Andreas E. Zielke is a Director in McKinsey’s Berlin office. [email protected]
Dr.-Ing. Christian Malorny is a Director in McKinsey’s Berlin office. [email protected]
Andreas Tschiesner is a Director in McKinsey’s Munich office. [email protected]
Dr. Wolfgang Pointner is a Principal in McKinsey’s Stuttgart office. [email protected]
Dr. Nicolai Müller is a Principal in McKinsey’s Cologne office. [email protected]
Dr.-Ing. Lutz Frick is an Engagement Manager in McKinsey’s Munich office. [email protected]
North America
Hans-Werner Kaas is a Director in McKinsey’s Detroit office. [email protected]
Russell Hensley is an Expert Principal in McKinsey’s Detroit office. [email protected]
Asia
Dr.-Ing. Philipp Radtke is a Director in McKinsey’s Tokyo office. [email protected]
Sha Sha is a Principal in McKinsey’s Hong Kong office. [email protected]
Sergei Kirov is an Associate Principal in McKinsey’s Tokyo office. [email protected]
22
Prof. Dr.-Ing. Achim Kampker, MBA, Chair of Production Management, RWTH Aachen University [email protected]
Dr.-Ing. Bastian Franzkoch, Chief Engineer, Department of Production Management, RWTH Aachen University [email protected]


Advanced Industries Sector/Automotive & AssemblyJanuary 2011Designed by Visual Media Services GermanyCopyright © McKinsey & Company, Inc. www.mckinsey.com


