Scott D. Camp*, Ph.D. Thomas L. Steiger†, Ph.D. Kevin N. Wright‡, Ph.D. William G. Saylor* Evan Gilman* *Federal Bureau of Prisons Office of Research and Evaluation 320 First Street NW Washington, D.C. 20534 †Indiana State University Department of Sociology Terre Haute, IN 47809 ‡State University of New York at Binghamton School of Education and Human Development Binghamton, NY 13902 May 14, 1997 Affirmative Action and the “Level Playing Field:” Comparing Perceptions of Own and Minority Job Advancement Opportunities The views expressed in this paper represent those of the authors and not necessarily those of either the Federal Bureau of Prisons or the Department of Justice. Appears in The Prison Journal 77: 3: 313-334. Copyright owned by Sage Publications.
Transcript
Scott D. Camp*, Ph.D.Thomas L. Steiger†, Ph.D.
Kevin N. Wright‡, Ph.D.William G. Saylor*
Evan Gilman*
*Federal Bureau of PrisonsOffice of Research and Evaluation
320 First Street NWWashington, D.C. 20534
†Indiana State UniversityDepartment of Sociology
Terre Haute, IN 47809
‡State University of New York at BinghamtonSchool of Education and Human Development
Binghamton, NY 13902
May 14, 1997
Affirmative Action and the “LevelPlaying Field:” ComparingPerceptions of Own and Minority JobAdvancement Opportunities
The views expressed in this paper represent those of the authors and not necessarily those ofeither the Federal Bureau of Prisons or the Department of Justice.
Appears in The Prison Journal 77: 3: 313-334. Copyright owned by Sage Publications.
Affirmative Action and the “Level Playing Field:” Comparing Perceptions of Ownand Minority Job Advancement Opportunities
Abstract
Little research has been done on the effectiveness of affirmative action programs in establishing
perceptions of a “level playing field” for historically disadvantaged groups. Especially lacking is
research on the perceptions of people working for specific affirmative action employers. This
research utilizes both outcome and attitudinal data of correctional officers employed by the
Federal Bureau of Prisons, an affirmative action employer. Black and white correctional officers
provide evaluations of their own opportunities for job advancement that are generally consistent
with objective, aggregate data. Black and white officers, however, exhibit wide disagreement
when surveyed about opportunities available for minorities. This research examines the processes
by which the discrepancies between black and white evaluations of minority opportunities arise. In
particular, we examine the ability of two competing hypotheses to explain the disagreement
between blacks and whites. The first hypothesis, the denial of minority opportunity hypothesis,
holds that minorities underestimate minority opportunities relative to their own opportunities. The
second hypothesis, the denial of majority opportunity hypothesis, maintains that non-minorities
overestimate minority opportunities. Results suggest that white correctional officers tend to
overestimate minority opportunities.
1
Social science research helps us to understand the sources of opposition to as well as
support for proactive remedies to historical discrimination, programs like affirmative action.
Social science research also illuminates the perceptual differences about and support for
affirmative action among women, racial minorities, and white men (Kluegel & Bobo 1993, Taylor
1995, Kluegel & Smith 1986). Social science research, though, has not been particularly
informative regarding people’s attitudes and perceptions about particular affirmative action
programs and/or their experiences with affirmative action programs. In particular, while there is
some research that examines whether people feel personally discriminated against (Crosby 1984,
Crosby et al. 1989), there is little research on how people view their job promotion opportunities
in organizations that practice affirmative action (for an exception see Camp and Steiger 1995).
It is important to understand and track perceptions regarding the effects of affirmative
action and the resulting diversity (Cox 1994). For example, it is useful to know how minority
group members perceive their own opportunities for promotion in comparison to majority group
members, especially when controlling for objective evidence regarding promotion opportunities
for whites and minorities. Likewise, it is helpful to know how majority and minority group
members perceive opportunities for minorities (considered as a group) in organizations, especially
in relation to the respondents evaluation of their own, personal opportunity. This is important
because most existing research on affirmative action asks respondents to compare group
opportunities, black versus white, for example. But do people make the same judgements about
opportunities when they are asked about groups that they make when asked about personal
experiences? As we argue later, there are strong reasons to believe this is not the case, and
existing research has been remiss in not addressing this issue.
2
From a practical viewpoint, there are legal, training, and policy consequences that result
from employee perceptions of promotion opportunities. For example, if an organization has a
positive, objective track record regarding the promotion of minority members and women, yet
minority members perceive there to be a problem, it is not unreasonable to expect problems to
arise for the organization from these perceptions. Minority members would probably be expected
to file job grievances or even bring legal action because of their perceptions. At the very least,
there would probably be suspicions in the work place about job promotion opportunities, even
though the perceptions are incongruent with the actual facts in this hypothetical case. Such
suspicions could lead to lower morale, lower levels of worker cooperation, and a host of other
workplace problems. On the flip side, if research shows that majority members have an
exaggerated view of the opportunities available to minority members, then we would also expect
organizational problems such as those mentioned above. In this case, though, the causes and
appropriate remedies would obviously differ.
In short, we need to understand not only whether affirmative action creates more equitable
outcomes in employment and promotion opportunities, the area where most research has been
conducted to date, we also need to understand how the consequences of affirmative action
policies are perceived by employees. Where racial and gender differences in perceptions continue
to exist in organizations committed to affirmative action, it is important to understand the sources
of those differences if effective policy and training are to be designed and implemented by the
organization to address possible misperceptions about promotion opportunities. At the very least,
we think it is reductionist to assume that perceptions follow in a simple manner from experiences
in organizations.
3
Literature Review
Affirmative action differs from previous legislative attempts to end gender and racial
employment discrimination. Title VII of the Civil Rights Act, passed by Congress in 1964,
established the explicit prohibition of racial, sexual, ethnic or religious discrimination. Shortly
after the passage of the Civil Rights Act, President Lyndon Johnson issued Executive Order
11246, establishing what is now known as affirmative action. Affirmative action and “equal
opportunity,” as the Civil Rights Act came to be known, differ in at least five ways (Crosby
1994:18-21). For our purposes, it is sufficient to note that affirmative action is much more
proactive in rectifying discrimination, whereas equal opportunity is more reactive and serves to
redress documented instances of discrimination.
Support among the public for affirmative action varies. Broad cross-sectional studies of
the United States population, such as the studies done by Kluegel and his colleagues (Kluegel &
Bobo 1993, Kluegel & Smith 1986), suggest that women and racial minorities are more
supportive of affirmative action than white males. Kluegel and Bobo (1993) found that proactive
measures such as race-targeting diminished white support for opportunity-enhancing policies by
about 22 percent on average.
Using data similar to that of Kluegel and Bobo (1993), Taylor (1995) examines the
contextual effects of working in organizations with and without affirmative action programs.
Taylor found no evidence to support the contention that experience with race targeting creates
white resentment or polarization. Indeed, Taylor (1995) suggests that experience with affirmative
action for white men may generate support for the policy as a whole. Of course, Taylor’s study
does not contradict directly the work of Kluegel (Kluegel & Bobo 1993, Kluegel & Smith 1986)
4
since she compares only white workers whose employers do and do not practice affirmative
action. Taylor’s research does show that experience with affirmative action does not necessarily
make white males any more negative about affirmative action and in some cases it may make them
more supportive.
For our purposes, the value of the research by Kluegel is limited because the studies do
not control for the respondents’ experiences with affirmative action. Taylor, on the other hand,
does control for respondents’ experiences with affirmative action, but Taylor does not provide
comparisons between different racial groups. More limiting is that none of the studies examine
how respondents’ perceptions of opportunities for job advancement are affected by affirmative
action, an outcome we feel has been surprisingly overlooked. When outcomes are examined at all,
the outcomes in question are generally objective in nature, as in looking at racial or gender
representativeness within the work force or promotions awarded. Even with objective outcomes,
the number of studies is relatively small, and the results are generally mixed (see Blum 1990,
Hanna 1988, Thomas 1991; or for studies on the effects of affirmative action in the Federal
government see Benokraitis & Gilbert 1989, DiPrete & Soule 1986, Kellough 1989).
The only studies that deal with perceptions of opportunities among respondents are those
by Kluegel and Smith (1986) and Camp and Steiger (1995). As Kluegel and Smith argue, it is
better to ask people about their opportunities than to ask them about discrimination.
Discrimination is a “hot button” issue in American society; one that may evoke excessive
ideological imagery among respondents that is borrowed from the media and other social
institutions. Perceptions of opportunities, on the other hand, are probably more rooted in personal
experience (Kluegel & Smith 1986: 56). We agree. The job advancement opportunities items
5
analyzed here were designed for a similar purpose, to assess differences in staff perceptions about
opportunities with as little ideological contamination as possible (Saylor 1996).
While Americans in general perceive personal opportunity, there are important group
differences. According to Kluegel and Smith (1986: 64), “blacks have a less favorable assessment
of opportunity in general and of their personal opportunity than do whites, and women’s beliefs
about these aspects of opportunity differ from men in the same direction.” Further analysis of
these differences show that the greatest differences lie between people at different levels of
socioeconomic status (p. 68), that blacks perceive that their opportunity is much more limited by
discrimination than do whites (p.200), and that black-white differences are greater on issues
related to Black opportunity while male-female differences are less on issues related to women’s
opportunity (p.240).
Camp and Steiger (1995) also found group differences in perceptions of opportunity in a
case study of workers of one organization, but their results are somewhat different than those of
Kluegel and Smith (1986). Much of the difference between the findings of Camp and Steiger and
Kluegel and Smith is probably due to the implicit control for exposure to affirmative action
programs in the Camp and Steiger study. The respondents studied by Camp and Steiger are all
employed by the same affirmative action employer, the Federal Bureau of Prisons (BOP). We do
not have any information about respondents’ experiences with affirmative action in the Kluegel
and Smith study. Regardless, unlike Kluegel and Smith, Camp and Steiger found no difference
between males and females in their assessments of personal job advancement opportunities either
within the specific prison of employment or within the BOP overall. Similar to Kluegel and Smith,
men rated opportunities for minorities more favorably than did women. But, again, unlike Kluegel
1W demonstrate in this analysis that, objectively, majority and minority group membersand men and women have fairly comparable promotion opportunities at the BOP, at least asmeasured by aggregate promotion data for 1992, 1993, and 1994.
6
and Smith, Camp and Steiger found that blacks more strongly agreed than whites that they
personally have job advancement opportunities. As did Kluegel and Smith, Camp and Steiger
found that whites more strongly agree than blacks that minorities have job advancement
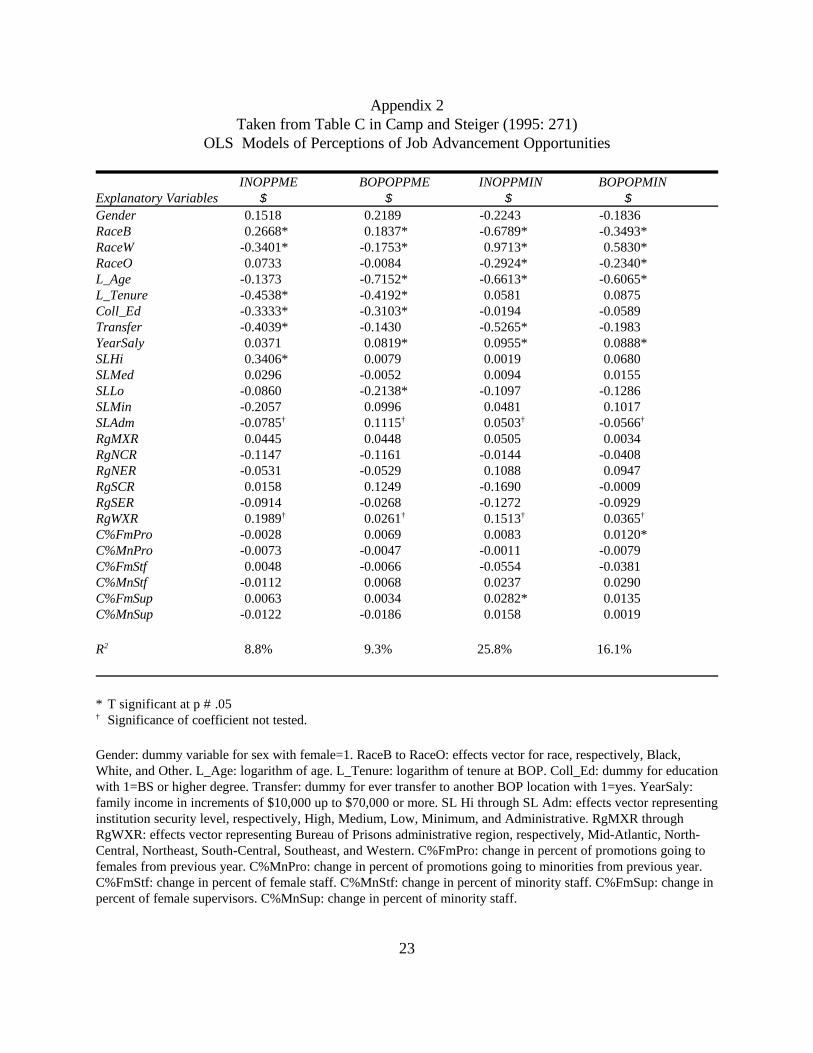
opportunities (see Appendix 2 for the results produced by Camp and Steiger [1995]).
The results presented by Camp and Steiger (1995) are intriguing. When asked about their
own opportunities, there is very little difference between the average ratings provided by blacks
and whites, and no difference between men and women (see Appendix 2). These findings alone
seem to imply that, at the BOP anyway, there is recognition among minority and majority
members of the fairly equal opportunities for job advancement available to minority and majority
group members.1 However, when asked to assess opportunities available to minorities as a group,
there is a large discrepancy between blacks and whites and a similar gap between men and
women. Taken together, these findings imply that majority and minority group members think
about their own opportunities for promotion in a similar fashion, but they do not extend that same
reasoning when thinking about the opportunities available to minorities as a group at the BOP.
Camp and Steiger (1995) did not explore the nature of the difference between black and
white officers in their responses to questions about minority job advancement opportunities. We
believe that such an examination is crucial. In particular, we think it is necessary to examine the
empirical nature of the discrepancies between majority and minority evaluations of own and
minority opportunities. Why do the perceptions of blacks and whites, men and women, regarding
their own opportunities for advancement accurately reflect the objective data on promotions
2Keep in mind that the hypotheses are derived for an agency in which there is anaffirmative action program. As shown below, minorities and women tend to be slightly over-represented at the aggregate level in terms of receiving promotions.
7
presented below, while the perceptions regarding minority opportunity demonstrate wide
disagreement between majority and minority group members? We analyze the same data used in
the study by Camp and Steiger (1995) to address these issues.
Hypotheses and Methods
One possible explanation for the discrepancy in attitudes comes from the work of Crosby
on the denial of personal disadvantage (Crosby 1984, Crosby et al. 1989). In her research, Crosby
found that racial minorities and women are willing to indicate on surveys that the groups they
comprise face discrimination and suffer from disadvantage, but the same respondents are
unwilling to acknowledge that the disadvantage extends to them personally. The reasons given for
this phenomenon are largely psychological. While the data analyzed here and by Camp and Steiger
(1995) pertain to perceptions of opportunity rather than discrimination and disadvantage, we can
still use the logic provided by Crosby to derive a hypothesis that we call the denial of minority
opportunity.2
Hypothesis 1: The lower evaluations of minority opportunities for jobadvancement provided by women and minorities are due to women and minoritiesnot recognizing the opportunities available to minorities and thus providingevaluations of minority opportunity that are lower than their evaluations of theirown opportunity.
Evidence against Hypothesis 1 would come if women and minority members provide comparable
evaluations of their own and minority opportunities.
Another possibility for the reversal in attitudes about job advancement opportunities is
provided by the research on national opinions toward affirmative action. National surveys find
8
that women and minorities more strongly favor affirmative action programs. It seems likely that
items inquiring into minority job advancement opportunities tap into these opinions about
affirmative action, especially among whites and males who typically hold more negative views. As
such, rather than minorities failing to recognize minority opportunities, the discrepancy may be
more due to historically favored groups (whites and males) overestimating the opportunities for
job advancement available to minorities, and, thus, underestimating the opportunities available to
majority members. We call this hypothesis the denial of majority opportunity on the part of
formerly privileged groups.
Hypothesis 2: The lower evaluations of minority opportunities for jobadvancement provided by women and minorities are due to overestimates ofminority opportunity provided by white and male correctional officers. That is,women and minority correctional officers recognize that minorities as a groupshare job opportunities comparable to their own personal opportunities, but whiteand male correctional officers exaggerate the small advantages going to minorities.
Counter evidence to Hypothesis 2 comes primarily in the form of women and minority members
providing lower evaluations of minority opportunities than their own opportunities. We already
know from the work of Camp and Steiger (1995) that minorities assess their own opportunities in
a slightly more favorable fashion than white officers. As will be shown below, there is slight
empirical justification for these assessments. As such, it is expected that white officers should
provide slightly higher evaluations of minority opportunities than their own opportunities.
However, these evaluations should be comparable to the evaluations of minority opportunities
provided by minority members, and we know from Camp and Steiger (1995) that the evaluations
provided by majority members are much higher. If minorities and women provide comparable
evaluations of their own and minority opportunities, then the large discrepancy must arise from
9
majority males providing exaggerated evaluations of minority opportunities and Hypothesis 2 is
supported.
It is also possible that both processes outlined in the first two hypotheses are at work. As
such, we are left with a mixed hypothesis.
Hypothesis 3: The lower evaluations of minority opportunities for jobadvancement provided by women and minorities are due to a combination of thedenial of minority opportunities by women and minority correctional officers andthe denial of majority opportunities by male and white correctional officers.
The data used in this study come from two general sources. First, the major source of data
analyzed, that on perceptions of job opportunities, are taken from the 1994 administration of the
Prison Social Climate Survey (PSCS). The PSCS has been given annually since 1988 to a
stratified proportional probability sample of Bureau of Prisons staff working at field locations (see
Saylor [1984] for a description of the survey design). In 1994, the PSCS was administered to
6,903 staff working in 74 distinct BOP prisons; 6,004 staff responded for a response rate of
86.98%. In this analysis, we select only the 1,242 respondents who self-identified as non-
supervisory correctional officers and who completed the items in the survey about job
opportunities. By focusing on correctional officers, we get a large group of individuals with
similar job responsibilities.
The data on promotions, which make up Table 1 and provide the objective context for job
advancement opportunities at the BOP, are taken from operational data bases used to generate
statistical information reported in the Executive Staff Module (Muth 1995) of the Bureau of
Prison’s Key Indicators/Strategic Support System (KI/SSS). KI/SSS is an interactive management
3We chose this method over computing a simple difference score between the respectivemeasures because it simplifies the assumptions we have to make about the metric of the scales forthe different measures. All we assume with this approach is that the respondents answer therespective questions while taking into account their previous responses. Since the items arelocated together in the survey instrument, this is not an unreasonable assumption.
10
information system that is pressed onto CD-ROM monthly and distributed to BOP managers
(Gilman 1991, Saylor 1988).
In this analysis, we use the same measures analyzed by Camp and Steiger (1995) as
dependent variables, but we utilize them in a different manner. Where Camp and Steiger (1995)
simply look at the four job opportunity measures as dependent measures in isolation from one
another (see Appendix 2), we use the measures in a comparative fashion. We compute our
dependent measures by comparing the Likert category that respondents choose to assess their
own opportunities for job advancement to the Likert category that they select to rate minority
opportunities for job advancement.3 This gives three possibilities; respondents can rate minority
opportunity as higher than their own, lower than their own, or the same as their own.
We compute two dependent measures respectively for the items about job advancement
opportunities at the specific institution where respondents are employed and for job advancement
opportunities within the BOP. We do not expect there to be major differences in the performance
of the two measures. Within the BOP, promotion opportunities have been linked historically with
transfers to other locations. Our concern here is not with whether respondents perceive more
opportunity at one level of the organization than the other, though this historical pattern does
explain why the survey instrument contains questions about opportunities at both the institution
and overall organization level. The institutional comparison score is derived by comparing the
values provided for the two items 1) institution has opportunity for me measure (INOPPME) and 2)
4 See Appendix 1 for an exact wording of the four original survey questions used tocalculate the two difference scores analyzed here.
11
the institution has opportunity for minorities (INOPPMIN).4 Likewise, the difference in perceptions
of opportunity within the overall organization is obtained by comparing the items 1) BOP has
opportunity for me (BOPOPPME) and 2) the BOP has opportunity for minorities (BOPOPMIN) (see
Appendix 1 for the exact wording of the respective items).
We perform multinomial logistic regression analysis on the difference measures described
above to assess Hypotheses 1 through 3. These models allow us to assess in a multivariate sense
whether respondents rate minority opportunities as being lower than their own opportunities,
comparable to their own opportunities, or higher than their own opportunities.
In addition to entering race and sex into models of the difference measures to evaluate
Hypotheses 1 through 3, we control for several other individual level effects that we feel are
related to evaluations of job advancement opportunity. In particular we control for education,
Hispanic ethnicity, age, tenure at the Bureau of Prisons, and whether or not the respondent has
ever accepted a transfer from one BOP facility to another. We are not confident enough about the
effects of these variables to generate formal sub-hypotheses nor are we substantively interested in
the effects in this analysis, but we do generally expect them to behave in specific ways. We expect
higher levels of education to mediate against misperceptions of relative job advancement
opportunities. We expect Hispanic ethnicity to generally behave in a manner similar to race, given
the same general barriers faced by Hispanics and members of racial minorities. We expect higher
values for age and tenure to lead respondents to exaggerate the differences in opportunity
between minorities and non-minorities. And, we expect the greater experience with the BOP
5The promotion rate is defined as the total number of promotions that occur over thecourse of the year for each aggregate category in question divided by the total number ofpromotions for the year. Since Federal regulations generally prohibit an individual from receivingmore than one promotion in a twelve month period, these data are not biased by “star” performerswho receive multiple promotions during one year.
6 The percentage of staff in the category in question is computed by taking an average ofmonthly data on the number of individuals in the aggregate category of question and dividing it byan average of monthly data for the total number of individuals in active staff status.
12
obtained by accepting a transfer from one BOP facility to another to narrow the gap between
perceptions of own and minority job advancement opportunities.
Initially, we included aggregate and organizational measures in the models. In preliminary
ordinary least squares results (not presented here), we did not find any effects for the aggregate
and organizational measures we considered, including factors such as the security level of the
institution. In fact, when modeling the actual magnitude of the difference between own and
minority opportunity, we found little variation in institution means for the difference measures
when the effects of the individual-level variables were controlled. Therefore, we concluded these
contextual effects have little impact on the determination of perceptions and have thus focused on
individual-level variables.
Results
Table 1 shows the promotion rates for all staff, females, males, and the different racial
groups within the BOP for the years 1992 through 1994. It is important to note that these values
are for BOP staff in all types of jobs, and not just for correctional officers alone.5 Table 1 also
reports a simple equity measure for females and males and the different racial groups. The equity
measure is defined as the ratio of the percentage of promotions going to the group in question
divided by the respective percentage of BOP staff in the group in question.6 For example, females
13
received 28% of the promotions in 1994 and comprised, on average, 26% of BOP staff. The ratio
of these two percentages, 1.06, is the equity measure for females in 1994, demonstrating that they
received more of the promotions in 1994 than would be expected simply from their representation
among BOP staff.
As can be seen in the results for the equity measures reported in Table 1, females received
a disproportionate share of promotions in 1992, 1993, and 1994. The equity scores for females in
1992 and 1993 are higher than the equity score in 1994, suggesting a slight drop-off in 1994.
Males, on the other hand, share the converse of the female situation. That is, males receive a
smaller percentage of the promotions as a group in 1992, 1993, and 1994 relative to the their
numbers.
Table 1 also presents findings for promotions aggregated by race. The results show that
blacks have a slightly higher equity rate for 1992, and a clearly higher equity rate for 1994. In
1993, blacks received promotions at a rate lower than what would be expected from their
representation among BOP staff. Other staff, on the other hand, had clearly higher equity scores
for all of the years. The white equity scores are lower than 1 in 1992 and 1994, and the equity
score is effectively 1 in 1993.
Given these results, it seems reasonable to assume that the BOP has been aggressively
pursuing affirmative action during the years leading up to and including the administration of the
1994 Prison Social Climate Survey.
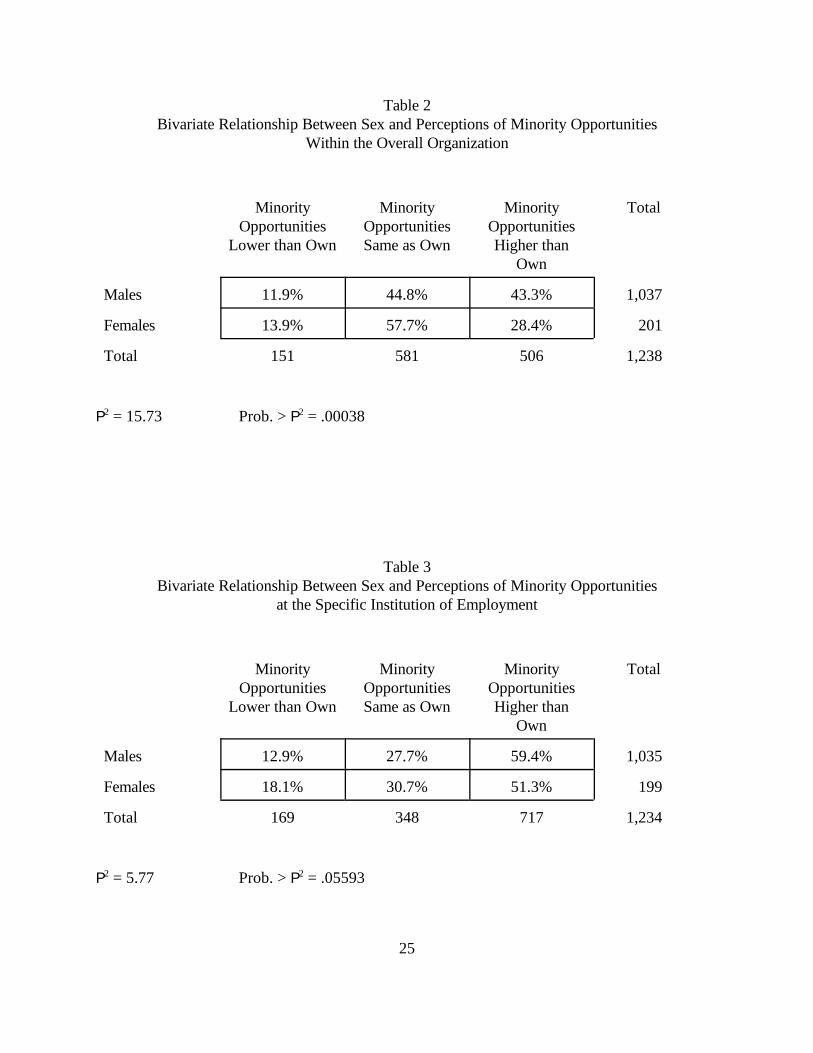
Table 2 presents the bivariate results between sex and minority opportunity within the
BOP, and Table 3 provides results for the relationship between sex and minority opportunity
within the respondents’ institutions. As can be seen, males are more likely than females to rate
14
minority opportunities higher than their own opportunities, both at the levels of the BOP and the
institution, though the difference is not statistically significant for the institution. In evaluations of
opportunities within the BOP, over 43% of males rate minority opportunities within the BOP as
being higher, where only 28.4% of females do. Females are more likely than males to rate
minority opportunities as being the same as their own opportunity level.
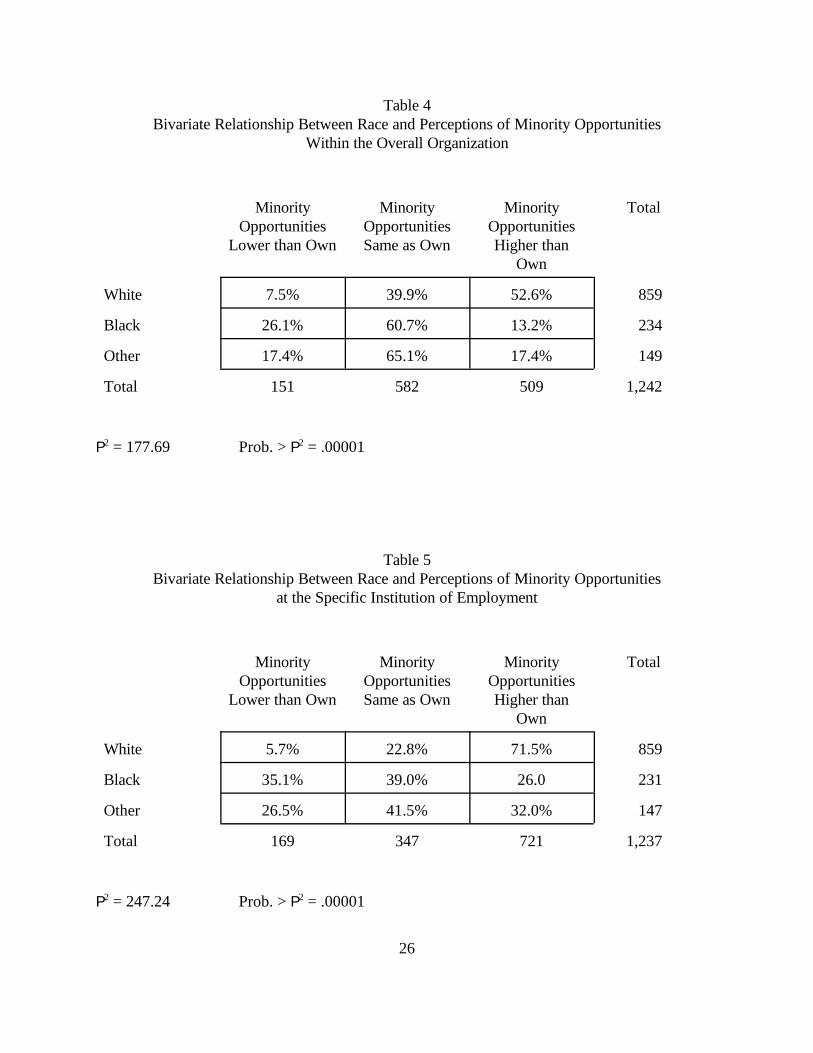
Tables 4 and 5 provide the bivariate results between race and the difference variables at
the BOP and institution levels. As can be seen, the relationship between race and differences in
opportunity are stronger than the relationships between sex and the opportunity variables. Whites
are much more likely than black or other race correctional officers to evaluate the opportunities of
minorities higher than their own opportunity. This is especially true for the difference in
opportunities within the BOP.
The bivariate results presented in Tables 4 and 5, and to a lesser extent Tables 2 and 3,
generally support Hypothesis 2. That is, the difference between minority and non-minority, and
male and female, evaluations of minority opportunities seems to be caused more by males and
especially whites overestimating the opportunities minorities have for job advancement. There is
less of a tendency for minority members and women to report minority opportunities as being less
than their own, although indeed there are some instances of reporting in this direction, especially
for evaluations by black and other race correctional officers of opportunities within the institution
(see Table 5).
The question now, is, does this partial support for Hypothesis 2 hold up in multivariate
analyses?
7 Typical hereafter refers to a correctional officer with a high school education, meanvalues on age and tenure, and no location transfer within the BOP.
15
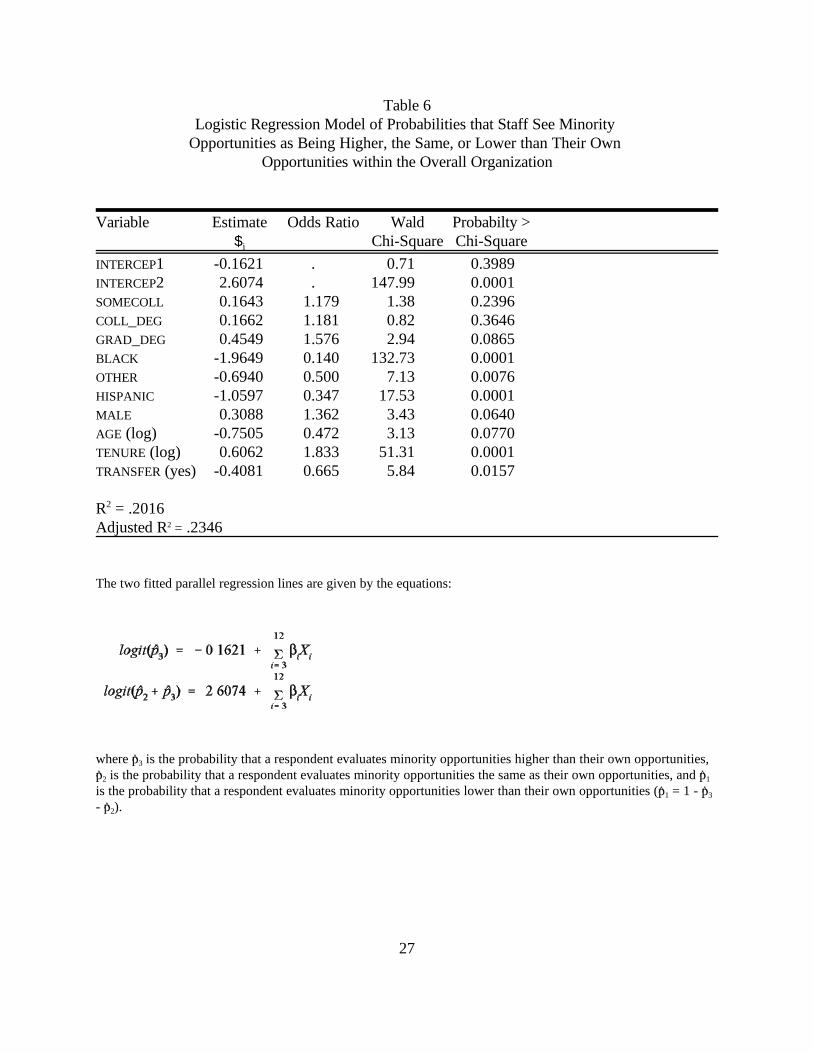
Table 6 presents the results for the baseline logistic model predicting differences in
evaluations of minority and own opportunities in the BOP. The R2 and adjusted R2 measures
(Nagelkerke 1991) suggest a reasonable fit to the data analyzed with this model with values of
.202 and .235 respectively. The effects of the educational comparisons, age, and sex are not
statistically significant at the conventional cutoff of "=.05.
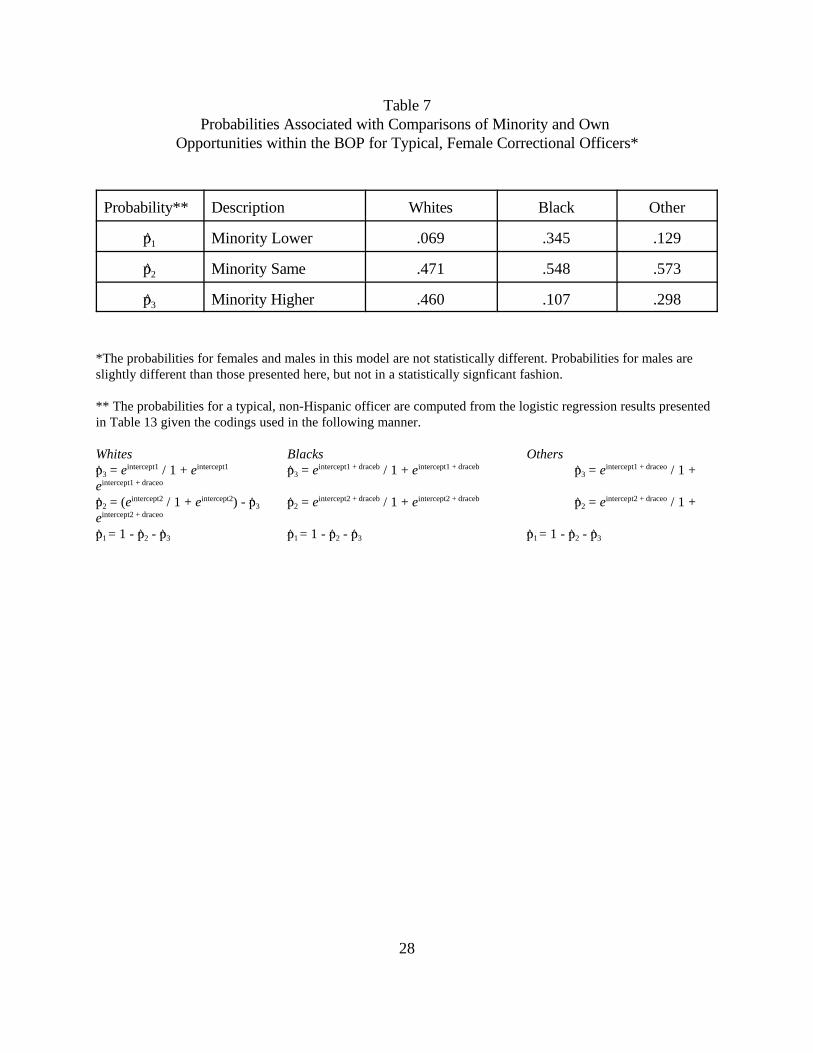
The effects for race presented in Table 6 are generally consistent with Hypothesis 2. That
is, for a typical white, non-Hispanic, female correctional officer, the highest probabilities are that
she indicates that minority officers have greater opportunities for promotion than she has (p̂3 =
.460) or the opportunities are the same (p̂2 = .471) (see Table 7).7 The typical black, non-
Hispanic, female officer, on the other hand, is much less likely (p̂3 = .107) to see the opportunities
of minorities as being greater than their own opportunities. In fact, there is somewhat of a
tendency to see minority opportunities as lower than their own for black, female officers (p̂2 =
.345), although the predominant response is to see the opportunities in the same light (p̂1 = .548).
Other race, non-Hispanic, female officers respond in between the patterns noted for black and
white female officers, though the model predicts that the overwhelming majority see their
opportunities as being the same as minority opportunities (p̂2 = .573).
Table 8 presents the results for the baseline logistic model predicting differences in
evaluations of minority and own opportunities at the institution. The R2 and adjusted R2 measures
suggest a reasonable fit to the data analyzed with this model with values of .237 and .279
respectively. The effects of two of the educational comparisons (officers with some college
16
education and officers with a bachelors degree compared to officers with a high school
education), transfer status, and sex are not statistically significant. The finding for sex is especially
surprising given our theoretical expectations and previous analysis.
The effects for race presented in Table 8 are also generally consistent with Hypothesis 2.
The typical white, female, non-Hispanic correctional officer clearly sees the opportunities for
minorities at the institution as being higher than her own opportunities (p̂3 = .678). The typical
black, female, non-Hispanic officer, on the other hand, sees minority opportunities as being lower
(p̂1 = .430) or the same (p̂2 = .394). The typical other race, female, non-Hispanic officer,
somewhat surprisingly, sees minority opportunities as being either higher (p̂3 = .420) or the same
(p̂2 = .398) (see Table 9).
Discussion
The results of the multinomial logistic regression analysis are most consistent with
Hypothesis 2. Hypothesis 2 states that the differences between minorities and non-minorities, and
women and men, in perceptions of own and minority opportunity are caused by non-minorities
and males exaggerating the opportunities available to minorities. Perhaps whites accurately
perceive the marginal under-representation of whites in the promotion pool. If so, whites should
rate minority opportunities as higher than their own, but those evaluations should be generally
consistent with the evaluations given by minorities. But we know from Camp and Steiger (Camp
& Steiger 1995: 271) that there is great disagreement between black and white officers on
perceptions of minority opportunity. On a 7 point Likert scale from strongly disagree to strongly
agree, Camp and Steiger report that whites are 1.65 units higher on average than blacks for
assessments of opportunities for minorities within the institution and .93 units higher on
17
assessments of opportunities for minorities within the overall BOP when multivariate controls
similar to those used here are introduced (Camp & Steiger 1995: 271). Plus, we know from the
logistic regression analysis reported here that minorities, for the most part, rate minority
opportunities as being consistent with their own (generally equal) opportunity. Therefore, it is not
an underestimation of minority opportunities by black officers that generally causes the
disagreement, it is an overestimation of minority opportunities by white officers.
Support for Hypothesis 2 regarding the group findings for race is not unequivocal. In
particular, there is some evidence for the denial of minority opportunity hypothesis among black
correctional officers, especially when they are evaluating opportunities for job advancement
within their current institution of employment. Even so, the most typical pattern is for minorities
to see the group minority opportunities as being comparable to or higher than their own
opportunity which is consistent with Hypothesis 2. For whites, the general pattern is to see
minority opportunities as being higher than personal opportunities. As such, we tentatively
conclude that Hypothesis 2 is better supported in this analysis than the competing hypotheses,
Hypothesis 1 and Hypothesis 3.
Since we do not find statistically significant sex effects for our difference measures in the
multivariate models, we conclude that Hypotheses 1 through 3 are irrelevant for sex, although
only at the Federal Bureau of Prisons. The statistically significant relationships between sex and
the difference measures reported in Tables 2 and 3 disappear when controls for other
characteristics of the correctional officers are added.
While not the specific focus of this analysis, the results for the other individual level
variables are interesting. Education does not play a role in mediating perceptions of job
18
advancement opportunity. In fact, given the educational comparisons we make, we find only one
educational comparison to be statistically significant. In the model of differences in opportunity
within the respondent’s own institution, respondents with an advanced college degree are more
likely to see minority opportunities as being more favorable than their own. This finding could
very well represent the frustrations of correctional officers with advanced degrees as reported by
Jurik and her colleagues (Jurik et al. 1987). Regarding the comparisons between Hispanic and
non-Hispanic correctional officers, we did indeed find that Hispanic correctional officers provide
more equitable evaluations of the differences between minority opportunities and their own
opportunity. This finding is much as we expected.
Age and tenure did not affect the differences in minority and own evaluations exactly as
we expected. Age obtains a statistically significant effect only in the model of differences in
opportunity within the respondent’s own institution. Even here, the effect is not what we
expected. While we expected older workers to provide less favorable evaluations of the
differences between minority opportunity and their own, we found the opposite. Increasing age
works to lower the difference. Tenure did behave as we expected. Officers with more tenure are
more likely to rate minority opportunities as higher than own.
Finally, whether a correctional officer had ever transferred from one BOP facility to
another was statistically important in only the model of differences in opportunity within the
overall organization. Officers who had transferred within the BOP were less likely to evaluate
minority opportunities as being higher than their own, as expected. Again, we suspect this finding
is due to the broader understanding of the operations of the BOP gained as officers gain
experience at more than one BOP facility.
19
Conclusions
What are the implications of this study for theory and practice? For theory, we see from
the research of Camp and Steiger (1995) that there is a general correspondence between the
perceptions of personal job advancement opportunity and objective conditions, at least for racial
groups. Black workers at the BOP may enjoy a slight advantage in the aggregate promotion rate,
and as Camp and Steiger (1995) note, this is reflected in the perceptions of black and white
workers. It is probably more accurate to say that the playing field has been leveled for all races
rather than to say it favors any particular race given the slight differences between racial groups.
Regardless, the attitudinal results suggest that workers are fairly objective in evaluating their own
opportunities for job advancement and are not influenced, on average, by the racial group to
which they belong. In the case study of correctional officers at the BOP, it appears perceptions of
their own opportunities that black and white correctional officers provide reflect the slight
advantages that minorities enjoy.
The same cannot be said for evaluations of minority opportunities. These results suggest
that black and white correctional officers continue to view their place of employment quite
differently. From the previous research of Camp and Steiger (1995), we were motivated to
investigate why there appears to be such a large amount of disagreement between black and white
workers about minority opportunities for job advancement. While the results do not totally rule
out the notion that black workers deny minority opportunities for job advancement, the results
presented here more strongly suggest that the differences between black and white evaluations of
minority opportunities are due to a failure of white correctional officers to recognize the
20
opportunities that whites have. White officers appear to exaggerate the opportunities for minority
advancement relative to their own opportunities.
What cannot be determined from this study, though, is why white officers exaggerate the
opportunities available to minorities. It could be that the exaggeration is introduced by general
feelings about affirmative action, in line with the trends reported by Kluegel and Smith (1986), or
it could be that the feelings arise from the officers perceptions of their experiences with
affirmative action at the BOP. If forced to choose, we would guess that questions asking
specifically about minority opportunities are “loaded” in the sense that they invoke responses
based upon more than direct experience with affirmative action, but we have no means of
substantiating this point at present. Rather, we base the judgement upon the proper
correspondence between objective conditions and perceptions of advancement opportunity when
the questions are asked about personal opportunities, which probably more directly tap into
respondents’ experiences with affirmative action at the BOP.
From a policy or practice viewpoint, the results presented here suggest that efforts to
address the discrepancies between black and white perceptions of minority opportunities need to
be addressed mostly to white workers, at least in the case of the Federal Bureau of Prisons. What
should be involved in those efforts is a much more difficult proposition to tackle. The difficulty
arises from not knowing whether the exaggerated views of whites are imported into the
organization from outside influences or are generated from experiences with affirmative action
policy at the BOP. Regardless, these results are suggestive that the disconnect between black and
white opportunities for job advancement is predicated on misperceptions by white officers. We
feel this is an important starting point for future research.
21
Clearly, more research is needed to address the theoretical and policy issues raised here. In
particular, research is badly needed on the responses of formerly privileged groups, namely white
males, as employment opportunities approach greater equity. Of course, the diminishing support
for and increasing hostility to affirmative action may undermine proactive efforts at establishing
level playing fields for all. Additionally, we need more information upon which perceptions are
more instrumental in affecting organizational outcomes, perceptions of respondents’ own
opportunities or perceptions of minority opportunities.
In addition, further research is need to insure that promotion opportunities are available to
minorities at the BOP when controls are introduced for factors that influence promotion rates. In
particular, it is necessary to examine the movement of minorities and women into supervisory and
managerial positions in the BOP. Despite the limitations noted, we believe this research begins to
address, in a meaningful manner, the experiences of workers with affirmative action. We need to
see more of this type of research to insure adequate theoretical understanding of the operation of
affirmative action in the workplace and to insure the practical success of affirmative action policy.
22
Appendix 1
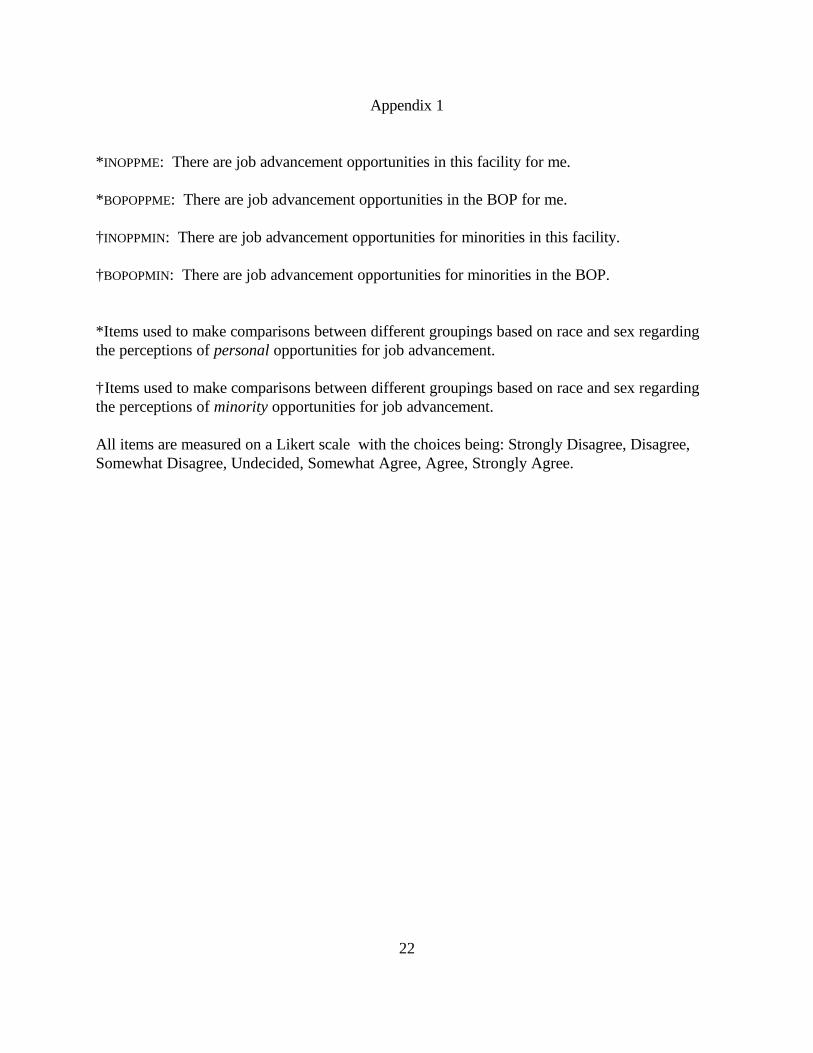
*INOPPME: There are job advancement opportunities in this facility for me.
*BOPOPPME: There are job advancement opportunities in the BOP for me.
†INOPPMIN: There are job advancement opportunities for minorities in this facility.
†BOPOPMIN: There are job advancement opportunities for minorities in the BOP.
*Items used to make comparisons between different groupings based on race and sex regardingthe perceptions of personal opportunities for job advancement.
†Items used to make comparisons between different groupings based on race and sex regardingthe perceptions of minority opportunities for job advancement.
All items are measured on a Likert scale with the choices being: Strongly Disagree, Disagree,Somewhat Disagree, Undecided, Somewhat Agree, Agree, Strongly Agree.
23
Appendix 2Taken from Table C in Camp and Steiger (1995: 271)
OLS Models of Perceptions of Job Advancement Opportunities
* T significant at p # .05† Significance of coefficient not tested.
Gender: dummy variable for sex with female=1. RaceB to RaceO: effects vector for race, respectively, Black,White, and Other. L_Age: logarithm of age. L_Tenure: logarithm of tenure at BOP. Coll_Ed: dummy for educationwith 1=BS or higher degree. Transfer: dummy for ever transfer to another BOP location with 1=yes. YearSaly:family income in increments of $10,000 up to $70,000 or more. SL Hi through SL Adm: effects vector representinginstitution security level, respectively, High, Medium, Low, Minimum, and Administrative. RgMXR throughRgWXR: effects vector representing Bureau of Prisons administrative region, respectively, Mid-Atlantic, North-Central, Northeast, South-Central, Southeast, and Western. C%FmPro: change in percent of promotions going tofemales from previous year. C%MnPro: change in percent of promotions going to minorities from previous year.C%FmStf: change in percent of female staff. C%MnStf: change in percent of minority staff. C%FmSup: change inpercent of female supervisors. C%MnSup: change in percent of minority staff.
24
Table 1Organizational Data on Promotions for 1992, 1993, 1994
Females% of Total Promotions 31% 31% 28%% of Total Staff 27% 27% 26%Equity Ratio* 1.16 1.17 1.06% Females Promoted 35% 23% 17%
Males% of Total Promotions 69% 69% 72%% of Total Staff 73% 73% 74%Equity Ratio 0.94 0.94 0.98% Males Promoted 29% 18% 16%
Blacks% of Total Promotions 19% 16% 21%% of Total Staff 18% 18% 18%Equity Ratio 1.04 0.88 1.13% Blacks Promoted 32% 17% 18%
Whites% of Total Promotions 68% 71% 64%% of Total Staff 71% 71% 70%Equity Ratio 0.96 1.01 0.92% Whites Promoted 29% 20% 15%
Other Race% of Total Promotions 13% 13% 15%% of Total Staff 11% 11% 12%Equity Ratio 1.21 1.14 1.25% Other Promoted 37% 22% 20%
*The Equity Ratio is computed as the ratio of the % of Total Promotions going to staff in a given category to the %of Total Staff in the respective category.
25
Table 2Bivariate Relationship Between Sex and Perceptions of Minority Opportunities
Within the Overall Organization
MinorityOpportunities
Lower than Own
MinorityOpportunitiesSame as Own
MinorityOpportunitiesHigher than
Own
Total
Males 11.9% 44.8% 43.3% 1,037
Females 13.9% 57.7% 28.4% 201
Total 151 581 506 1,238
P2 = 15.73 Prob. > P2 = .00038
Table 3Bivariate Relationship Between Sex and Perceptions of Minority Opportunities
at the Specific Institution of Employment
MinorityOpportunities
Lower than Own
MinorityOpportunitiesSame as Own
MinorityOpportunitiesHigher than
Own
Total
Males 12.9% 27.7% 59.4% 1,035
Females 18.1% 30.7% 51.3% 199
Total 169 348 717 1,234
P2 = 5.77 Prob. > P2 = .05593
26
Table 4Bivariate Relationship Between Race and Perceptions of Minority Opportunities
Within the Overall Organization
MinorityOpportunities
Lower than Own
MinorityOpportunitiesSame as Own
MinorityOpportunitiesHigher than
Own
Total
White 7.5% 39.9% 52.6% 859
Black 26.1% 60.7% 13.2% 234
Other 17.4% 65.1% 17.4% 149
Total 151 582 509 1,242
P2 = 177.69 Prob. > P2 = .00001
Table 5Bivariate Relationship Between Race and Perceptions of Minority Opportunities
at the Specific Institution of Employment
MinorityOpportunities
Lower than Own
MinorityOpportunitiesSame as Own
MinorityOpportunitiesHigher than
Own
Total
White 5.7% 22.8% 71.5% 859
Black 35.1% 39.0% 26.0 231
Other 26.5% 41.5% 32.0% 147
Total 169 347 721 1,237
P2 = 247.24 Prob. > P2 = .00001
27
Table 6Logistic Regression Model of Probabilities that Staff See Minority
Opportunities as Being Higher, the Same, or Lower than Their Own Opportunities within the Overall Organization
Variable Estimate Odds Ratio Wald Probabilty >$i Chi-Square Chi-Square
The two fitted parallel regression lines are given by the equations:
where p̂3 is the probability that a respondent evaluates minority opportunities higher than their own opportunities,p̂2 is the probability that a respondent evaluates minority opportunities the same as their own opportunities, and p̂1
is the probability that a respondent evaluates minority opportunities lower than their own opportunities (p̂1 = 1 - p̂3
- p̂2).
28
Table 7Probabilities Associated with Comparisons of Minority and Own
Opportunities within the BOP for Typical, Female Correctional Officers*
Probability** Description Whites Black Other
p̂1 Minority Lower .069 .345 .129
p̂2 Minority Same .471 .548 .573
p̂3 Minority Higher .460 .107 .298
*The probabilities for females and males in this model are not statistically different. Probabilities for males areslightly different than those presented here, but not in a statistically signficant fashion.
** The probabilities for a typical, non-Hispanic officer are computed from the logistic regression results presentedin Table 13 given the codings used in the following manner.
The two fitted parallel regression lines are given by the equations:
where p̂3 is the probability that a respondent evaluates minority opportunities higher than their own opportunities,p̂2 is the probability that a respondent evaluates minority opportunities the same as their own opportunities, and p̂1
is the probability that a respondent evaluates minority opportunities lower than their own opportunities (p̂1 = 1 - p̂3
- p̂2).
30
Table 9Probabilities Associated with Comparisons of Minority and Own
Opportunities at the Institution for Typical, Female Correctional Officers*
Probability** Description Whites Black Other
p̂1 Minority Lower .071 .430 .182
p̂2 Minority Same .251 .394 .398
p̂3 Minority Higher .678 .176 .420
*The probabilities for females and males in this model are not statistically different. Probabilities for males areslightly different than those presented here, but not in a statistically signficant fashion.
** The probabilities for a typical, non-Hispanic officer are computed from the logistic regression results presentedin Table 13 given the codings used in the following manner.
Benokraitis, N.V., and M.K. Gilbert. (1989). “Women in Federal Government Employment.” Pp.65-80 in Affirmative Action in Perspective, edited by F. A. Blanchard, and F.J. Crosby.Springer-Verlag.
Blum, D.E. (1990). “Ten Years Later, Questions About Minnesota Sex-Bias Settlement.”Chronicle of Higher Education 36(39):A13-A15.
Bryk, Anthony S., and Stephen W. Raudenbush. (1992). Hierarchical Linear Models:Applications and Data Analysis Methods. Sage.
Camp, Scott D., and Thomas L. Steiger. (1995). “Gender and Racial Differences in Perceptions ofCareer Opportunities and the Work Environment in a Traditionally Male Occupation:Correctional Workers in the Federal Bureau of Prisons.” Pp. 258-277 in ContemporaryIssues in Criminal Justice: Shaping Tomorrow's System, edited by Nicky Ali Jackson.McGraw-Hill.
Camp, Scott D., Thomas L. Steiger, and Jennifer A. Batchelder. (1996). “Perceptions of JobAdvancement Opportunities Among Correctional Officers: A Multilevel Investigation ofRace and Gender Effects.” . Federal Bureau of Prisons.
Cox, Taylor, Jr. 1994. Cultural Diversity in Organizations: Theory, Research & Practice. SanFrancisco: Berrett-Koehler.
Crosby, Faye. (1984). “The Denial of Personal Discrimination.” American Behavioral Scientist27(3):371-386.
Crosby, Faye, Ann Pufall, Rebecca Claire Snyder, Marion O'Connell, and Peg Whalen. (1989).“The Denial of Personal Disadvantage Among You, Me, and All the Other Ostriches.” Pp.79-99 in Gender and Thought: Psychological Perspectives, edited by Mary Crawford, andMargaret Gentry. Springer-Verlag.
DiPrete, Thomas, and Whitman T. Soule. (1986). “The Organization of Career Lines: EqualEmployment Opportunity and Status Attainment in a Federal Bureaucracy.” AmericanSociological Review 51(3):295-309.
Ford, David L., Jr. (1988). “Minority and Nonminority MBA Progress in Business.” Pp. 57-69 inEnsuring Minority Success in Corporate Management, edited by Donna E. Thompson,and Nancy DiTomasso. Plenum.
Gilman, Evan. (1991). “Implementing Key Indicators.” Federal Prisons Journal 2(3):48-56.Hanna, C. (1988). “The Organizational Context For Affirmative Action for Women Faculty.”
Journal of Higher Education 59:390-411.Jurik, Nancy C., Gregory J. Halemba, Michael C. Musheno, and Bernard V. Boyle. (1987).
“Educational Attainment, Job Satisfaction, and the Professionalization of CorrectionalOfficers.” Work and Occupations 14(1):106-125.
Kellough, J. E. (1989). Federal Equal Employment Opportunity Policy and Numerical Goals andTimetables: An Impact Assessment. Praeger.
32
Kluegel, James R., and Lawrence Bobo. (1993). “Opposition to Race-Targeting: Self-Interest,Stratification Ideology, or Racial Attitudes?” American Sociological Review 58(4):443-464.
Kluegel, James R., and Eliot R. Smith. (1986). Beliefs About Inequality: American's View ofWhat Is and What Should Be. Aldine de Gruyter.
Muth, William R. (1995). “Implementing a Management Information Tool for Executives in theFederal Prison System.” . Federal Bureau of Prisons.
Nagelkerke, N.J.D. (1991). “A Note on a General Definition of the Coefficient of Determination.”Biometrika 78:691-692.
Saylor, William G. (1984). “Surveying Prison Environments.” . Federal Bureau of Prisons.Saylor, William G. (1988). “Developing a Strategic Support System: Putting Social Science
Research into Practice to Improve Prison Management.” . Federal Bureau of Prisons.Saylor, William G. (1996). “Personal Communication with First Author.” .Taylor, Marylee C. (1995). “White Backlash to Affirmative Action: Peril or Myth?” Social Forces
73(4):1385-1414.Thomas, R. Roosevelt. (1991). Beyond Race and Gender. Amacom.