UNIVERSITI TEKNOLOGI MALAYSIA BORANG PENGESAHAN STATUS TESIS ♦ JUDUL: EVALUATION OF THE COMPACTIVE EFFORT ON STRIPPING CHARACTERISTIC OF HOT MIX ASPHALT (HMA) MIXTURES SESI PENGAJIAN: 2005 / 2006 Saya _______SUTHAGARAN A/L SUBRAMANIAM______________________ (HURUF BESAR) mengaku membenarkan tesis (PSM/Sarjana/Doktor Falsafah)* ini disimpan di Perpustakaan Universiti Teknologi Malaysia dengan syarat-syarat kegunaan seperti berikut: 1. Tesis adalah hakmilik Universiti Teknologi Malaysia. 2. Perpustakaan Universiti Teknologi Malaysia dibenarkan membuat salinan untuk tujuan pengajian sahaja. 3. Perpustakaan dibenarkan membuat salinan tesis ini sebagai bahan pertukaran antara institusi pengajian tinggi. 4. **Sila tandakan () (Mengandungi maklumat yang berdarjah keselamatan atau SULIT kepentingan Malaysia seperti yang termaktub di dalam AKTA RAHSIA RASMI 1972) TIDAK TERHAD Disahkan oleh _________________________________ ______________________________ (TANDATANGAN PENULIS) (TANDATANGAN PENYELIA) Alamat Tetap: No. 7 JALAN LURAH 6, DR. MOHD. ROSLI BIN HAININ _ KEMPAS BARU, Nama Penyelia 81200 JOHOR BAHRU, Tarikh: 11 MEI 2006 Tarikh: 11 MEI 2006 CATATAN: * Potong yang tidak berkenaan. ** Jika tesis ini SULIT atau TERHAD, sila lampirkan surat daripada pihak berkuasa / organisasi berkenaan dengan menyatakan sekali sebab dan tempoh tesis ini perlu dikelaskan sebagai SULIT atau TERHAD. ♦ Tesis dimaksudkan sebagai tesis bagi Ijazah Doktor Falsafah dan Sarjana secara penyelidikan, atau disertasi bagi pengajian secara kerja kursus dan penyelidikan, atau Laporan Projek Sarjana Muda (PSM). PSZ 19:16 (Pind.1/97) TERHAD (Mengandungi maklumat TERHAD yang telah ditentukan oleh organisasi/badan di mana penyelidikan dijalankan)
Transcript
UNIVERSITI TEKNOLOGI MALAYSIA
BORANG PENGESAHAN STATUS TESIS♦♦♦♦
JUDUL: EVALUATION OF THE COMPACTIVE EFFORT ON STRIPPING CHARACTERISTIC OF HOT MIX ASPHALT
mengaku membenarkan tesis (PSM/Sarjana/Doktor Falsafah)* ini disimpan di Perpustakaan Universiti Teknologi Malaysia dengan syarat-syarat kegunaan seperti berikut: 1. Tesis adalah hakmilik Universiti Teknologi Malaysia. 2. Perpustakaan Universiti Teknologi Malaysia dibenarkan membuat salinan untuk tujuan pengajian sahaja. 3. Perpustakaan dibenarkan membuat salinan tesis ini sebagai bahan pertukaran antara institusi pengajian tinggi. 4. **Sila tandakan (����) (Mengandungi maklumat yang berdarjah keselamatan atau SULIT kepentingan Malaysia seperti yang termaktub di dalam AKTA RAHSIA RASMI 1972) TIDAK TERHAD Disahkan oleh _________________________________ ______________________________ (TANDATANGAN PENULIS) (TANDATANGAN PENYELIA)
Alamat Tetap:
No. 7 JALAN LURAH 6, DR. MOHD. ROSLI BIN HAININ_ KEMPAS BARU, Nama Penyelia 81200 JOHOR BAHRU, Tarikh: 11 MEI 2006 Tarikh: 11 MEI 2006 CATATAN: * Potong yang tidak berkenaan.
** Jika tesis ini SULIT atau TERHAD, sila lampirkan surat daripada pihak berkuasa / organisasi berkenaan dengan menyatakan sekali sebab dan tempoh tesis ini perlu dikelaskan sebagai SULIT atau TERHAD.
♦ Tesis dimaksudkan sebagai tesis bagi Ijazah Doktor Falsafah dan Sarjana secara penyelidikan, atau disertasi bagi pengajian secara kerja kursus dan penyelidikan, atau Laporan Projek Sarjana Muda (PSM).
PSZ 19:16 (Pind.1/97)
TERHAD (Mengandungi maklumat TERHAD yang telah ditentukan oleh organisasi/badan di mana penyelidikan dijalankan)
�
“We hereby declare that we have read this project report and in our opinion
this report is sufficient in terms of scope and quality for the award of the degree of
Master of Engineering (Civil-Highway and Transportation)”
Signature : ……………………………….……
Name of Supervisor I : DR.MOHD. ROSLI BIN HAININ
Date : 11 MAY 2006
Signature : ……………………………………..
Name of Supervisor II : TUAN HJ. CHE ROS BIN ISMAIL
Date : 11 MAY 2006
EVALUATION OF THE COMPACTIVE EFFORT ON THE STRIPPING
CHARACTERISTIC OF HOT MIX ASPHALT (HMA) MIXTURES
SUTHAGARAN A/L SUBRAMANIAM
A project report submitted in partial fulfilment of requirements for the award of
degree Master of Engineering (Civil - Highway and Transportation)
Faculty of Civil Engineering
Universiti Teknologi Malaysia
MAY 2006
ii
I declare that this project report entitled “Evaluation of the Compactive Effort on
Stripping Characteristic of Hot Mix Asphalt (HMA) Mixtures” is the result of my
own research except as cited in the references. The project report has not been
accepted for any degree and is not concurrently submitted in candidature of any other
degree.”
Signature : ……………………………………………
Name : SUTHAGARAN A/L SUBRAMANIAM
Date : 11 MAY 2006
iii
This project report is dedicated to my beloved parents,
my wife Shanda A/P Periannan as well as
my two kids Ugashni Naikker and Reshee Alvin Naikkerr
iv
ACKNOWLEDGEMENTS
The author would like to express profound gratitude to his supervisor Dr. Mohd.
Rosli Bin Hainin and co - supervisor Tuan Haji Che Ros Bin Ismail for their direct
supervision, incessant advice, guidance invaluable help and patience during the
course of this research.
Many thanks and appreciations are due to author’s colleagues in
Transportation and Highway Department, who provided assistance, valuable
discussion and cooperation on the experimental work of this research.
Thanks are also due to author’s Principal Ir. Lee Kim Kiew of Messrs
Jurutera Lee Bersekutu who allows author to persist his Master Degree even author is
still working in his organization.
Recognition is also due to all of the laboratory technicians, who patiently
provided assistances on the experimental portion of this study.
Ultimately, the author wishes to express special thanks and appreciation to his
parents for their support and wife Shanda Periannan for her sacrifices, interminable
struggle as well as patient towards the accomplishments of this Master Degree.
v
ABSTRACT
Generally, moisture susceptibility is a HMA mixture’s tendency towards
stripping. To combat moisture susceptibility, proper mix design is essential.
However if a mix is properly designed but not compacted sufficiently it could be also
subjected to stripping. This study is to evaluate the relationship between different
compactive efforts on stripping, as well as to suggest the most appropriate indicative
test to envisage the stripping characteristic in HMA mixtures. Two test methods
were carried out to assess the stripping, which are quantitative strength test for
compacted specimens and qualitative test for loose uncompacted specimens.
Samples compacted with 35, 50 and 75 blows of Marshall hammer were used to
determine the stripping in HMA. For the quantitative test, moisture induce damage
test (AASTHO T 283) is utilized to forecast the stripping while for qualitative test,
Coating and Stripping of Bitumen-Aggregate Mixtures (ASTM D1664-80) and
Effect of Water Bituminous-Coated Aggregate Using Boiling Water (ASTM 3625-
91) were used. The results show that increase in compactive effort would decrease
the optimum asphalt content. In the moisture induce damage test, those 35 blows
and 50 blows have larger TSR value, which the 35 blows is 24% and 50 blows is
14% higher than 75 blows. Similarly, the loose uncompacted specimens indicate that
both of these lower blows have lesser stripping potential. This shows that, the lower
the blow the larger optimum asphalt content thus decreases the stripping potential of
the HMA. Besides that, it was also found that moisture induce damage test is a more
appropriate method to use in evaluating of stripping characteristic of HMA.
vi
ABSTRAK
Amnya, tindakan air dalam sesuatu campuran berasfalt (HMA) akan
mendorongkan kepada penanggalan agregat. Bagi mengelakkan fenomena ini, suatu
campuran yang baik diperlukan. Walaubagaimanapun, sesuatu campuran yang
direkabentuk dengan baik tetapi sekiranya tidak dipadatkan secukupnya akan
menyebabkan penanggalan agregat. Kajian ini dijalankan untuk menilai hubungan
diantara usaha pemadatan keatas penanggalan agregat serta mencadangkan suatu
ujian indikatif yang sesuai untuk meramal penanggalan agregat dalam sesuatu
campuran asphalt. Dalam penentuan penanggalan agregat dua kaedah ujian telah
digunakan, iaitu ujian kuantitatif bagi spesimen yang telah dipadatkan dan ujian
kualitatif untuk spesimen yang tidak dipadatkan. Sampel yang dipadatkan pada 35,
50 dan 75 hentaman dengan menggunakan tukul Marshall digunakan untuk
mengetahui potensi penanggalan agregat. Bagi ujian kuantitatif prosedur “Moisture
induce damage test” (AASTHO T 283) digunakan untuk meramalkan penanggalan
agregat manakala bagi ujian kualitatif, ujian “Coating and stripping of bitumen-
aggregate mixtures” (ASTM D1664-80) dan “ Effect of water bituminous-coated
aggregate using boiling water” (ASTM 3625-91) telah digunakan. Keputusan
menunjukkan bahawa peningkatan bilangan hentaman akan mengurangkan
kandungan optimum asfalt. Dalam ujian “moisture induce damage test” hentaman
35 dan hentaman 50 mempunyai nilai “ Tensile Strength Ratio” (TSR) agak tinggi,
dengan hentaman 35 adalah 25% dan hentaman 50 adalah 14% lebih tinggi daripada
hentaman 75. Begitu juga, dengan spesimen yang tidak dipadatkan, di mana ia
menunjukkan bahawa kedua-dua hentaman yang rendah mempunyai potensi
penanggalan yang kurang. Ini menggambarkan bahawa hentaman yang rendah akan
memperolehi kandungan optimum asfalt yang tinggi dan akan mengurangkan potensi
penanggalan agregat daripada sesuatu campuran HMA. Selain dari itu, dapat
dikenalpasti bahawa ujian “moisture induces damage” adalah ujian yang sesuai
untuk menentukan potensi penanggalan agregat dalam sesuatu campuran HMA.
vii
TABLE OF CONTENTS
CHAPTER TITLE PAGES
DECLARATION THESIS ii
DEDICATION iii
ACKNOWLEDGMENT iv
ABSTRACT v
ABSTRAK vi
TABLE OF CONTENTS vii
LIST OF TABLES x
LIST OF FIGURES xii
LIST OF SYMBOLS xiv
LIST OF APPENDICES xv
1 INTRODUCTION 1
1.1 Introduction 1
1.2 Background 3
1.3 Problem Statement 4
1.4 Objective 5
1.5 Scope of the Study 6
1.6 HMA Mixture Design 6
1.7 Mixture Design Specification 7
2 LITERATURE REVIEW 8
2.1 Introduction 8
2.2 Factor Affecting Compaction 9
viii
2.3 Stripping Phenomenon 10
2.4 Stripping Mechanism 12
2.4.1 Additional Stripping Mechanism 13
2.5 Theory of Stripping 14
2.6 Intergration Theory and Mechanism in
Stripping 16
2.7 Rating of Stripping 21
2.8 Effective Asphalt Thickness 24
2.9 Test Method for Moisture Susceptibility 25
3 METHODOLOGY 28
3.1 Introduction 28
3.2 Preparation of Laboratory Test 30
3.3 Preparation of Aggregates 32
3.4 Marshall Methods of Mix Design 32
3.5 Preparation of Mix Design 33
3.6 Marshall Test Procedures 34
3.6.1 Bulk Specific Gravity and Density
of Compacted Bituminous Mixtures
Using Saturated Surface-Dry
Specimen (ASTM D2726-90) 34
3.6.2 Resistance to Plastic Flow of
Bituminuos Mixtures Using Marshall
Equipment (ASTM D1559-89 ) 37
3.6.3 Test Method for Coating and Stripping
of Bitumen - Aggregate Mixtures
(ASTM D1664-80) 38
3.6.4 Standard Test Method for Effect
of Water Bituminous- Coated
Aggregate Using Boiling Water
(ASTM 3625-91) 39
3.6.5 Resistance of Compacted Asphalt
Mixtures to Moisture Induce Damage
(AASTHO T283) 41
ix
4 RESULTS AND DATA ANALYSIS 44
4.1 Introduction 44
4.2 Aggregate Gradation 44
4.3 Marshall Test 45
4.3.1 Optimum Asphalt Content 46
4.4 Moisture Sensitivity 48
4.4.1 Compacted Specimen Moisture Induce
Test 49
4.4.2 Uncompacted Asphalt-Coated Aggregate
Mixture 50
5 CONCLUSION AND RECOMMENDATIONS 53
5.1 Introduction 53
5.2 Conclusion 53
5.3 Recommendations 56
REFERENCES 57
Appendices A – I2 61-116
x
LIST OF TABLES
TABLE NO. TITLE PAGES
2.1 Definition of stripping in asphalt concrete mixture
( Kiggundu and Roberts, 1988) 11
2.2 Screening the theory- mechanism relationship in HMA
Stripping ( Kiggundu and Roberts, 1988) 17
2.3 Summary of various test result
(Kiggundu and Roberts, 1988) 21
2.4 TSR value for number of freeze-thaw cycles
(Hunter 2001) 27
3.1 Gradation limit for asphaltic concrete (ACW 14) 29
3.2 Design Asphalt Content (JKR/SPJ/1988) 29
3.3 Specification for asphaltic concrete mix
(JKR/SPJ/1988) 30
3.4 Absolute density of water and conversation factor K
for various temperature 36
4.1 Breakdown of parameter of ACW 14 in favour of 35 blows 46
xi
4.2 Breakdown of parameter of ACW14 in favour of 50 blows 46
4.3 Breakdown of parameter of Acw14 in favour of 75 blows 47
4.4 Tensile strength of different blows 49
4.5 Visual data of unconditional and conditional of cracked
subset 50
4.6 Stripping percentage of uncompacted specimen or ASTM
1668-80 51
4.7 Stripping percentage of uncompacted specimen for ASTM
D 3625-91 using boiling distilled water 51
4.8 Stripping percentage of uncompacted specimen for ASTM
D 3625-91 using distilled water (not boil) 51
xii
LIST OF FIGURES
FIGURE NO. TITLE PAGES
1.1 Cross section of a typical flexible road pavement
(IKRAM, 1994) 1
1.2 Pavement durability vs. air void (Asphalt Institute
Manual Series 22, 1983) 2
2.1 Distinction in the compactability of bituminous
(Hunter, 1994) 8
2.2 Representation of stripping process (Wihelmi and
Schultze, 1955) 18
2.3 Bonding of Adhesion agent and bitumen with
presences of water (Dybalski, 1982) 19
2.4 Oversaturated of surface susceptible shear plane
(Dybalski, 1982) 19
2.5 Success vs. Failure Prediction using lottman test
(Kiggundu and Roberts, 1988) 22
2.6 Success vs. failure predictions using tunnicliff-
root test (Kiggundu and Roberts, 1988) 23
xiii
2.7 Success vs. failure predictions using immersion-
compression test (Kiggundu and Roberts 1988) 23
2.8 Success vs. failure predictions using the boil test
(10 Minutes) (Kiggundu and Roberts 1988) 24
2.9 Illustration of VMA in compacted mix specimen
(Asphalt Institute Manual Series No 22, 1983) 25
3.1 Exemplify laboratory test flow chart 31
3.2 Sieve analysis 32
3.3 Compression machine 37
4.1 ACW 14 aggregate gradation chart 45
xiv
LIST OF SYMBOLS
AC - Asphalt concrete
CA - Coarse aggregates
FA - Fine aggregates
S - Percentage of water absorption
SG - Specific gravity
St1 - Average tensile for unconditional subsets
St2 - Average tensile for conditional subset
TMD - Theoretical maximum density
TSR - Tensile strength ratio
Va - Volume of air void
Vsample - Volume of samples
Vw - Volume of water
VTM - Void in total mix
Wagg - Weight of aggregates
Wasp - Weight of asphalt
Wdry - Weight of samples in air
Wwet - Weight of Samples in water
WSSD - Weight of samples surface saturated dry
Wsat - Weight of saturated samples surface saturated dry
xv
LIST OF APPENDICES
APPENDIX TITLE PAGES
A Sieve analysis 61
B Specific gravity calculation 62
C1 Calculation of asphalt content 63
C2 Protocol of mixing and compaction 64
C3 Procedure of bulk specific gravity test 68
D1 Marshall test result spread sheet for 30 blows 70
D2 Marshall test result spread sheet for 50 blows 71
D3 Marshall test results spread sheet for 75 blows 72
D4 Marshall graph of ACW 14 in favours to 35
blows compactive effort 73
D5 Marshall graph of ACW 14 in favours to 50
blows compactive effort 74
D6 Marshall graph of ACW 14 in favours to 75
Blows compactive effort 75
E Procedure stability and flow test 76
F1 Initial calculation for VTM of AASTHO T283 78
F2 Checking of VTM to AASHTO T283 84
G1 Moisture conditioning of samples of AASHTO T283 85
G2 Calculation of volume of absorbed water for condition 88
H1 Procedure prior to obtain conditional stability value
for TSR 97
H2 Tensile strength ratio calculation (TSR) 100
H3 Visual observation of cracked specimen 109
I1 Test method for coating and stripping of bitumen-
xvi
aggregate mixtures (ASTM D1664-80) 110
I2 Standard test method for effect of water bituminous coated
aggregate using boiling water (ASTM 3625-91) 113
1
CHAPTER 1
INTRODUCTION
1.1 Introduction
A flexible pavement constructed with asphaltic cement and aggregate and
consists of several layers as shown in Figure 1.1. The lower layer is most vital layer
in flexible pavement construction. A well compacted subgred will enhance the
strength of the pavement. The principle reason of compaction is to increase the
strength, lowers the compressibility and reduces the permeability of a soil by
rearranging its fabrics. The soil fabrics are forced into a denser configuration by the
mechanical used in compaction.
Figure 1.1: Cross section of a flexible road pavement (IKRAM, 1994)
2
The state of compaction of soil is conveniently measured using the dry
density, the attainable values of which are related to the water content. In the event,
the number of compactive effort is increases the optimum water content will
decrease. This phenomenon happens due to the reduction of air volume in the soils.
Like wise soil, the compactive effort theory can be implemented in the hot mix
asphalt (HMA).
In HMA design compaction is the process of compressing a given volume of
asphalt into smaller volume. It is accomplished by pressing together the asphalt
coated aggregate particles, there by eliminating most of air void (space) in the mix
and increasing the density (weight to volume ratio) of the pavement mixture. Figure
1.2 is a graphical presentation of the effect of air void on pavement durability. The
higher the air void in the HMA the higher will be the stripping potential.
Figure 1.2: Pavement Durability vs. Air Void (Asphalt Institute Manual
Series No.22, 1983)
The mix proportions for a properly compacted asphalt concrete are
determined in laboratory during mix design testing. The ability of a properly
proportioned asphalt concrete mixture is to resist potentially damaging effects of the
asphalt binder stripping from the aggregate particles. To perform properly in the
field, a well designed asphalt concrete mixture must be adequately compacted.
3
However there is, possibility for properly design mix to strip resulting from
poor field compaction that produced high void contents allowing water to enter hot
mix asphalt layer. Therefore, there is a need to assess each mixture to determine, the
suscepblility of asphalt concrete mixture to water damage.
In this project, laboratory tests on the HMA design were carried out to
scrutinize the stripping potential for the three different types of compactive effort.
Based on the laboratory result, the effect of compaction effort on stripping potential
of HMA are analyzed and recommended.
1.2 Background
Stripping is the common distress amongst other distress occurring in hot mix
asphalt (HMA) pavements in the Malaysia. Pavement performance is adversely
affected by stripping and unforeseen increases in maintenance budgets are often
incurred. The causes of stripping remain doubtful and preventability is rather non-
deterministic. For that reason need to make known the understanding of the
stripping mechanisms, and developed simple but reliable test. Moisture damage of
asphalt cement pavement is a problem that Malaysian road network are
experiencing. This damage is commonly known as stripping. The dominant failure
mode is the separation of the asphalt coating from the aggregate. An alternate mode
that is gaining acceptance is the loss of cohesion of the asphalt cement (Parker and
Gharaybeh, 1988).
The most serious consequence of stripping is the loss of strength and
integrity of the pavement. Stripping can take on many surface forms during its
progression. However, stripping in a particular area may be quite severe before any
surface indicators are evident. Surface indicators may include rutting, shoving
and/or cracking. Pavement performance is adversely affected by stripping and
unforeseen increases in maintenance budgets are often incurred.
4
Numerous test methods have been developed and functional in the past to
envisage the moisture propensity of asphalt mixes. The developed tests can be
classified into two categories, qualitative tests and quantitative strength tests. The
Boiling Water Test (ASTM D3625) and Static-Immersion Test (AASHTO T182) are
qualitative tests, while the Lottman Test (NCHRP 246), Tunnicliff and Root
Conditioning (NCHRP 274), Modified Lottman Test (AASHTO T283), and
Immersion-Compression Test (AASHTO T165) are quantitative strength tests
(Roberts et al, 1996).
1.3 Problem Statement
The Malaysia road network has expended rapidly in line with pace of
economic growth. The main mode for movement of nation good (freight) with the
country is through road networks and Jabatan Kerja Raya (JKR) being principal
government department responsible for road work.
The road pavement in this country is constructed based on JKR’s Standard
Specification for Road Works, JKR/SPJ/1988. However these pavements are still
susceptible to deterioration that could be due to vast increased in traffic volume in
short period of time and/or improper mix design. The rate of deterioration will
depend on the severity of the traffic loads, variability of road material and
compaction as well.
In accordance with AASHTO Test Method T245, 75 blow/face compactive
efforts are used to obtain higher density of an asphalt concrete mixture. Density is
very vital in pavement construction. The principal reason to compact sufficiently is
to reduce the air void and increase the mixtures stability, however it become difficult
to obtain desired density when the asphalt cement content in the mixture is low
which causes durability problem in the long term. Even so, Jabatan Kerja Raya
(JKR) are using 75 blow/face compactive efforts in design mix and it is known that,
the higher the compactive effort the lesser optimum bitumen content is required.
5
Less amount of asphalt during compaction effort in laboratory mix design
could contribute to stripping. Thus, there is a need to investigate and determine the
test that can better predict, stripping of HMA. Beside that, there is also a need to
identify what compactive effort should be employed.
Increase in asphalt film thickness can significantly reduced the rate of aging
and effect of high void. However if asphalt cement film is too thin, air which enters
the compacted pavement can more rapidly oxidize the thin film, causing the
pavement become brittle and to fail prematurely by cracking. Additionally if the
aggregates are susceptible to water damage, thin film is more easily penetrated by
water than thicker one.
The load carrying ability of an asphalt pavement is a function of both
thickness of material and its stiffness. Lacking in this will resulted to pavement
distress such as stripping. This phenomenon occurs due to decrease in pavement
durability, which has been stressed to the limit of its fatigue life by repetitive axle
load application.
1.4 Objective
The principal objectives of this study are as stated below:
i) To evaluate the effect of compaction efforts on stripping potential
HMA.
ii) To evaluate the most appropriate indicator test for stripping potential.
6
1.5 Scope of the Study
This scope covers the process needed in carrying out an evaluation on testing
procedures used to determine stripping potential in the Asphalt Wearing Coarse
(ACW 14) mixtures. This involves wide-ranging of laboratory works comprising by
laboratory mix design and performance test. During the mix design the compactive
effort was varied to provide the variability in the results. The entire test were
conducted at Highway and Transportation laboratory of University Teknologi
Malaysia. Data available were analyzed and results are presented in the project
report.
1.6 HMA Mixture Design
HMA is defined as a combination of heated and dried mineral aggregates
that are uniformly mixed and coated with a hot asphalt binder (Lavin, 2003). The
design of HMA and other mixtures mostly involve selecting and proportioning
ingredients to obtain specific construction and pavement performance properties.
The ultimate goal is to find an efficient blend and gradation of aggregates and
asphalt binder that give a mixture that has:
i) Enough asphalt binder to ensure a durable compacted pavement
and bonding the aggregate;
ii) Enough workability to permit mixture placement and compaction
without aggregate isolation;
iii) Enough mixture stability to endure the repeated loading traffic
without distortion or displacement;
iv) Sufficient void or air spaces in the compacted mixture to allow a
slight additional amount of added compaction by the repeated
loading of traffic. The air void will prevent asphalt bleeding or
loss of mixture stability. The volume of air voids should not be so
large to allow excessive oxidation or moisture damage of the
mixture; and
7
v) The pertinent selection of aggregates to endow with skid resistance
in high-speed traffic application.
1.7 Mixture Design Specification
The United Army Corps of Engineers uses Marshall mixture design
specification for airfield construction which originally developed by Bruce Marshall
a employee of Mississippi Highway Department (Goetz, 1989). The Asphalt
Institute and highway group further modified these specifications to meet the road
constructions requirement. The mixture specification considering pavement loading
which grouped by traffic level or ESALs.
The goals of this laboratory compaction process is to stimulate as closely as
possible, the actual compaction effort procedure in the field by roller and traffic. A
standard 50 blows/face compactive effort was used in Marshall laboratory test.
Further research used 75 blows/face compaction efforts to obtain higher stability to
cater greater loadings from traffic. However, the drawback was that the amounts of
optimum asphalt content become less which resulted in thinner asphalt film
thickness. Some studies have shown that the thinner the asphalt film thickness the
higher the stripping potential of the mix.
8
CHAPTER 2
LITERATURE REVIEW
2.1 Introduction
Compaction is most important factor for achieving satisfactory pavement
service life. Research’s has been carried out to determine the performance of asphalt
pavement compactive effort but yet compaction has always been somewhat of a
puzzle. This chapter presents an overview of different compactive effort and test to
the asphalt concrete mixture that endow with better forecast to stripping on hot mix
asphalt (HMA). The variation in the composition of the pavement material can have
a deep effect on the compactability which eventually leads to distress such as
stripping. This variability is summarized graphically in Figure 2.1.
Figure 2.1: Distinction in the compactability of bituminous (Hunter, 1994)
A wide knowledge and understanding on the pavement distresses (stripping)
are required to have a better quality pavement surface. The subsequent sub topic,
9
discuss mainly about effect of compaction effort and stripping result on the pavement
surface.
2.2 Factor Affecting Compaction
To improve the compaction it is imperative to recognize the important factors
establish the level of compaction obtained on the road. There few methods can be
used to investigate these factors. Most frequently use is field work and laboratory.
Laboratory compaction is a process to replicate as closely as possible the actual
compaction process in field. However, considerable difference can exist between
asphalt concrete preparation in the laboratory, as oppose to those compaction in the
field (both initially after compaction and after many millions of load reputation).
Major difference include compaction techniques and procedures, single/aggregate
size, hardening of asphalt cement and moisture condition of the asphalt concrete mix.
Studies has indicated that density attain after 1500 coverage of traffic is about
equal to the laboratory density obtain with 50 blows compactive effort on each side
of asphalt concrete specimen. Additional studies by Corps of Engineers shows,
higher tire pressure produced density under traffic greater than the density obtain
with 50 blows compaction on each side of specimen while the density for 75 blows
on the each side of specimen produced density equal to that obtain in the field.
Based on this mix design criteria, 50 blows per side compactive effort selected for
pavements to be subjected to traffic with tire pressure less than 0.69 MPa (100psi)
and 75 blows per side compactive effort be selected when tire pressure are greater
than 0.69MPa (100psi).
There are also studies conducted by National Association of Australia State
road Authority (NAASAR) 1983 regarding compactive effort using dense graded
mix. In this research, 50 blow compactive effort used for road surface while 75
blows were used for airfield surface. The studies recognizes that if the degree of
compaction is not accomplish the amount of void in an asphalt mixture has effect on
10
the rate of hardening of the asphalt binder in the layer which subjected to inflexible
and prone to stripping.
2.3 Stripping Phenomenon
Striping is a foremost distress taking place in HMA in Malaysia and other
countries. In spite of several test in laboratory, stripping still exist. This is due to the
basic or fundamental causes are not well understood. The number of definitions of
stripping in asphalt concrete mixture is explicitly summarized in Table 2.1.
Many researchers reported that complication is visible by several of
mechanism, such as detachment, displacement, film rupture, pore pressure and
hydraulic scouring which will discuss more clearly in the following sub topic.
Beside that there are also number of theories has put forward to give explanation of
stripping and those are as follows:
i) Mechanical interlocking;
ii) Chemical reaction; and
iii) Molecular orientation.
Majidzadeh (1968) reported that stripping due to displace of asphalt from the
aggregate surface because of interracial energy effect. This shows that asphalt films
are not resistant or impermeable. As such infiltration of asphalt film by water, allow
moisture to get to the asphalt-aggregate interface and contribute chance for
displacement to become lively. Pavement failure recognized to stripping are
probably not a result of a single quantifiable factor. In spite of these variations in
definitions, water is the only widely claimed cause for stripping
11
Table 2.1: Definition of Stripping In Asphalt Concrete Mixture (Kiggundu and
Roberts, 1988)
SOURCE
REFERENCE
DEFINITION
J.C. Petersen
Seminar
Auburn University
Spring 1987
Deterioration or lose of the adhesive bond between the
asphalt and the aggregate from the action of water
T.W Kennedy
et al.
AAPT, Vol, 51
1982 or [1]
The physical separation of the asphalt cement from the
aggregate produced by the loss of adhesion primarily due to
the action of water vapor
D.E Tunnicliff
et al.
AAPT, Vol.51,
1982
The displacement of asphalt cement films from aggregate
surfaces by water caused by conditions under which the
aggregate surface is more easily wetted by water than by
asphalt
Asphalt
Institute
ES -10 (1987)
The breaking of the adhesive bond between the aggregate
surface and the asphalt cement
Khosla et al.
and
Charaybeh, F
TRR 911 (1983)
and
Dissertation 1987
Auburn University
The loss of the bond between the asphalt binder and the
mineral aggregate due to separation of asphalt cement
coating in pressure of water
Kiggundu, et
al.
NCAT 1987
Auburn University
The progressive functional deterioration of a pavement
mixture by loss of the adhesive bond between the asphalt
cement and the aggregate surface and or/loss of the cohesive
resistance within the asphalt cement principally from the
action of water
AAPT = Association of Asphalt Paving Technologists
NCAT = National Center for Asphalt Technology
CTR = Center for Transportation Research
TRR = Transportation Research Institute
ES = Educational Series
12
This is a very basic statement since there are many variables such as design,
material selections, and compatibility considerations which can be considered in
explaining the susceptibility of water action to cause stripping of pavement mixtures.
Fromm (1974) states the foremost problem is to recognize how the water infiltrates
the asphalt film and if it can be hinder, a huge improvement would result. The
development of a good adhesion promoting agent to hinder the detachment of the
films by water would also be an improvement. Mendenhall et al. (1987) reported
survey showing 23 percent indicated that pavement mixtures in their regions
experienced moderate to extensive stripping.
2.4 Stripping Mechanism
Stripping is a major distress occurring in HMA. The state of stripping effects
has been scrutinized ever since the introduction of paving technology. In hot asphalt
mixture, there are several continual stripping distresses.
According to Asphalt Institute (1987) spontaneous emulsification take place
when a reversed emulsion of water droplets in asphalt cement forms rather than the
conflicting. Investigators have noted that this process can be aggravated under traffic
on mixtures overloaded with free water. Fromm (1974) through his experiments has
illustrated that once the emulsion formation penetrated to the substrate, the adhesive
bond was broken. Beside that he also observed the development of a brownish color
on the surface of asphalt films in severely stripped mixtures as well as on asphalt
films submerged in water.
Another researcher by the name of Kiggundu (1986) has conducted a test by
placing film of virgin AC-5 and AC 10 asphalts in the bottom of beakers and
submerged them in distilled water. It was note that both asphalt material beginning
to drop the silky manifestation on top surface. Therefore in summary Fromm
suggested that stripping by emulsion configuration may be a significant mechanism.
13
Film rupture is the other type of mechanism report by Fromm (1974),
commence due to film fracture happens at sharp contact, or point because of dust
particles on the aggregates. These circumstances crop up due to construction loads,
operating traffic during service conditions, or could be environmentally induced by
freeze-thaw cycling. According to Thelen (1958) existence of dust on aggregate
surface do causes film defects that lead to rupture which therefore provide easy
access to the interface by water.
The pore pressure mechanism was proposed by Lottman (1971) is the other
type mechanism which occurs in hot mix asphalt beside the other two (2) which
discuss earlier. This mechanism happens rapidly from the presence of water in the
pore structure of the HMA locations where segregation is established at layer
boundaries when heavy traffic loadings occur and during freeze-thaw cycling. Due
to pore pressure pavement layers are known to strip at the interfaces, pavement
layers have disintegrate usually from bottom disintegration within a layer in been
observed (contact survey findings) upward, and in a few occasion both directions. In
a majority of cases, the binder layers disintegrate first followed by surface layers.
Asphalt Institute (1987) indicates that hydraulic scouring is caused by occurrence of
a capillary tension/compression phenomenon around a moving heavy traffic wheel
on a saturated HMA structure. The asphalt is stripped off the aggregate producing
defects such as surface raveling. In addition, Asphalt Institute also reported that dust
is to mix with rain water and, in the existence of traffic, can develop the abrasion of
asphalt films from the aggregate.
2.4.1 Additional Stripping Mechanism
Many investigators have recognized the complication of the stripping
phenomenon. Defining the mechanisms and basis remains a difficult task. Yet
National Centre for Asphalt Technology (NCAT) with number of contact surveys
stripping mechanism may be considered asphalt-aggregate specific, environmental or
14
climatic specific, load condition specific and possibly other combinations of
variables. On the starting point NCAT has recommended additional mechanisms:
i) pH instability mechanism- Kennedy et al. (1984) , Scott (1978) and Yoon
(1987) has demonstrated that pH of the contact water is strongly influence the
adherence of asphalt to the aggregate. Investigation by Kennedy et al. into
the effects of varying sources of water (tap, distilled, etc.) on the retained
coating by a boil test and showed that significant differences. Yoon carried
out boiling test using asphalt-aggregate mixtures with water of varying pH.
The test result indicates the coating preservation decreased as the pH
increased. From the result it strongly suggested that stabilization of the pH
sensitivity at the asphalt-aggregate interface would minimize the potential for
bond breakage, grant strong durable bonds and consequently reduce stripping.
ii) Studies have demonstrated that changing one component of the aggregate
system can improve or deteriorate the stripping tendency of a mixture.
Stripping of HMA can be affected by the individual sensitivity of asphalt
and/or aggregate to moisture. Research by Phillips and Marek (1986)
illustrated that stripping mechanisms in asphalt-aggregate mixtures made
with granites and gravels can be characterized by a near total loss of adhesion
while carbonaceous mixtures can sustain logical adhesion but weakened
cohesion in the bulk phase of the asphalt. So, material selections should be
made to optimize compatibility or procedures should be developed to make
easy choosing materials (asphalts, aggregates, and/or additives) on the basis
of compatible behavior.
2.5 Theories Of Stripping
Theories have been hypothesized to explicate the water resistance of
bitumen-coated aggregate. There is theory categorized by Rice (1958) which is
15
mechanical interlocking, chemical reaction and molecular orientation or surface
energy theory.
According to Thelen (1958) and Rice (1958) the principal factor effecting
adhesion is the texture of the aggregate. Mechanical interlocking presumes the
shortage of chemical interaction between asphalt and aggregate. The bond strength
is presumed to be resulting from the cohesion in the binder and interlocking
properties of the aggregate particles which include individual crystal faces, aggregate
porosity, absorption, surface coating, and angularity. The deficiency of a sound
interlocking network of the above properties is assumed to provide the system to the
difficult effects of water.
Due to the presence of acidic and basic components in each asphalt-aggregate
system, the statement of chemical reaction theory took place. The presumption is
that this component react forming water-insoluble compounds. Again Rice (1958)
suggests the possibility of selective chemical reaction between the aggregate and
asphalt species. Latest scrutiny by Jeon et al. (1988) has almost to the possibility of
the occurrence of a chemisorption mechanism between some asphalt functionalities
and aggregate surfaces.
This outcome was experimental from selective adsorption-desorptlon studies
between model asphalt functionalities and model silica aggregate surface. Thelen
(1958) suggested in advance that configuration of a chemisorption type bond may be
essential in order to minimize the striping potential in asphalt-aggregate mixture.
However Thelen did not verify this intention.
Molecular orientation or surface energy which is another stripping
mechanism described structuring of asphalt molecules at the asphalt-aggregate
interface. Rice (1958) in the theory assumes that adhesion between asphalt and
aggregate is making possible by a surface energy reduction on the aggregate as the
asphalt is adsorbed on to the surface. Yoon (1987) and Tarrer (1986) in their
experimental work reported that aggregates which convey a reasonably high pH
value to contact water and/or which had a moderately high zeta potential had a high
tendency to strip.
16
Those three theories which is mechanical interlocking, chemical reaction and
molecular orientation or surface energy theory discuss above perhaps operate blend
or one dominates another for each asphalt-aggregate system. Consequently more
work is necessary to differentiate the contributions express by the three theories.
2.6 Integration Theories and Mechanisms in Stripping
In early stage of literature review the relationship between theories and
mechanisms that have been put forward to explain stripping. Table 2.2 shows the
primary and secondary contribution relationship. The ultimate reasons for the
relationship is put forward are to expand theory-mechanism relationship that would
offer the following:
i) Best dealt with improvements in mix design, best served in material
selection techniques using conventional test/properties;
ii) Best understood by utilize special test/properties for example,
compatibility properties/tests/consideration.
Table 2.2 explicates each element, however there are two stripping
mechanism which are detachment and displacement that are described as significant
factors affecting stripping. The process of water diffuse through the binder film
become attached to the surface and displace the film from aggregate is called
detachment. Detachment which is believes to be explained by physical and chemical
aspects of the interracial energy theory as well as the physical aspects of the
mechanical interlock theory.
17
Table 2.2: Screening the theory- mechanism relationship in HMA stripping
(Kiggundu and Roberts, 1988)
Theory
Mechanical
Interlock Chemical Reaction
Interfacial Energy
Proposed Operating Mode P c P-c P c
P-c P c P-c
Detachment s s s w
Displacement s w s Spontaneous Emulsification
File rupture s Hydraulic Scouring s
S
trip
pin
g M
ech
anis
m
pH Instability s s s
P = Physical
C = Chemical
P-C = Physical - Chemical
S = Primary Contributor
W = Secondary Contributor
The physical rationale is apparent only by surface energy considerations
while the chemical rationale is contributed by the effect of polarity of the molecules
present at the common boundary. The physical aspects of the mechanical interlock
theory may be due detachment resulting from presence of a thin layer of dust or other
foreign matter which prevents bonding between the asphalt and the aggregate. It is
also highly likely that the detachment mechanism may lead the displacement
mechanism. However the displacement mechanism is likely to be rationalized by
both the interracial and chemical reaction theories. An aggregate-asphalt interface
thermodynamic stripping model has been discussed by Gzemski, et al. (1968) but
this phenomenon first demonstrated by Wihelmi and Schultze (1955) is shown in
Figure 2.2.
18
Figure 2.2: Representation of stripping process (Wihelmi and Schultze, 1955)
Roberts. et al. (1991) has stated that aggregate mineralogical and the
chemical composition are significant factors in the moisture vulnerability of a
bituminous mixture. Aggregate are normally categorized as being either hydrophilic
(water loving) or hydrophobic (water hating). Selecting of aggregate is fundamental
factor in asphalt concrete mixture. Hydrophilic aggregates, such as quartz and
siliceous gravel, materialize to have a superior affinity for water than for bitumen
cement, and they tend to be acid in nature. Other hand, hydrophobic aggregates,
such as limestone and other carbonate rocks are considered to be chemically basic
and have low silica content. Aggregate surface physical characteristic such as
texture and particle shape are other crucial factor related to stripping in asphalt
concrete pavement. Use of additives has reduced the asphalt concrete pavements
stripping problems. The mineral constituents of aggregates have a net negative
charge at their surface in the occurrence of water and the positively charged end of
the cationic adhesion agent remain well-matched with the bitumen. Anti stripping
additives can converted the aggregate surface to one that is more easily wetted by
asphalt than water. The incorporation of adhesion agent by 0.5 to 3 % and replacing
19
of an equal amount of mineral will improve the stripping problem in asphalt concrete
pavement.
Figure 2.3: Bonding of adhesion agent and bitumen with presences of water
(Dybalski, 1982)
Figure 2.3 illustrating the bonding of monolayer of cationic adhesion agent
molecules and bitumen to a surface which has a net negative charge in the presence
of water. Even so the additives used may reduce the stripping problem but it does
materialize. According to Dybalski (1982) when adhesion agent liquefy in the
bitumen they take a noticeable time to disseminate or diffuse to the aggregate surface
and when used in asphaltic concrete pavement, a huge proportion of the additive by
no means becomes efficient.
Figure 2.4: Oversaturated of surface susceptible shear plane (Dybalski, 1982)
Dybalski also stated due to oversaturated of the aggregate surface by the
adhesion agent to outline double layer with hydrocarbon to hydrocarbon interfacial
orientation. This phenomenon illustrated diagrammatically in Figure 2.4, which
generates automatically weak and water vulnerable shear plane.
20
Numerous investigation actions have been undertaken in laboratories and
field to reduce the stripping potential in HMA. The overall hypothesis in using
moreover additive is to convert hydrophobic (water loving) aggregate surface to
hydrophobic (water hating) condition. Though the remedial action, using anti
stripping agent do not list consistent performance improvement from use of this
product. The adequacies of these additive mixing methods remain puzzle to asphalt
technologists. In synopsis, long term efficiency derivable from apply of anti
stripping agent’s still do not overcome stripping problem in pavement surface. An
immersion wheel tracking test was conducted to assess the resistance to stripping of
open graded plant mix made with 300 pen grade residual bitumen by Mathews and
Colwill (1962). In this test compacted specimen of the mix are tracked under water
with loaded wheel and when stripping occurs there is rapid increase in the rate of
rutting. Yet Plancher et al (1981) correlate nitrogen compound with various
aggregate surfaces using a range of temperatures and the result suggested that
aggregate which strongly interact with nitrogen compound may have less stripping
potential. In additional the following method use to improve overall moisture
susceptibility characteristic of asphalt concrete mixtures by:
i) Attain ample compaction during construction;
ii) Get rid of the use of moisture-susceptible aggregate and asphalt;
iii) Treat the moisture susceptible aggregate and asphalt;
iv) Make available sufficient drainage (both surface and subsurface).
Kiggundu and Roberts (1988) proposed the additional factors to the above list
to overcome moisture inclination:
i) Develop and recognize the controlling mechanism and then build up
the suitable test (s) to review the identified mechanism (s);
ii) Exploit the test technique by which unwanted material can be
screened out in proceed of the fact, and
iii) Optimize material choice for compatibility.
21
2.7 Rating of Stripping
Numerous investigative actions have been undertaken in laboratories and
field to reduce the stripping potential in HMA mixtures. Studies have been carried
which display tests for stripping. These efforts have produced tests which use semi-
subjective and subjective evaluation to gather the stripping potential. The tests
includes Ten (10) Minutes Boiling Test, Immersion Compression Test, Lottman Test,
Tunnicliff/Root Test and Nevada Dynamic strip Test. Data gathered by Kiggundu
and Roberts (1988) is summarized in Table 2.3. While the graphical representation
of the success and failure rating is shown in Figure 2.5 to 2.8. The ratings are
recognized by comparing the laboratory prediction to the field performance ratings.
The Lottman and Tunnicliff test grant identical result. As indicate by Stuart (1986)
summary of the success rate of both Lottman and Tunnicliff-Root test gives about
same results and it offers the best prediction.
Table 2.3: Summary of various test result (Kiggundu and Roberts, 1988)
Test Method
Minimum Test Index
% Success
Lottman
(NCHRP 246)
TSR = 70% TSR = 80%
67 76
Tunniclift - Root
TSR = 70% TSR = 80%
TSR = 70 – 80%
60 67 67
Immersion
Compression (ASTM D1075)
Strength Ratio = 75%
47
10-Minutes Boil Test
Retained Coating = 85 –
90%
58
Nevada Dynamic
Strip Test
Weight Loss
(less than 25%)
36
22
Stripping has been linked to very great number of factors and combination of
factors. As a result the difficulty of this clause remains unsettled. Therefore the
distresses keep on to causes severe troubles with performance of HMA. Fobs, et.al.
(1987) in his report has stated that no general or universally applicable rules of
thumb for identifying or predicting stripping problems. However for given
aggregate, stripping enhance with increasing air void.
Figure 2.5: Success vs. Failure Prediction Using Lottman Test
(Kiggundu and Roberts, 1988)
23
Figure 2.6: Success vs. Failure Predictions Using Tunnicliff-Root Test
(Kiggundu and Roberts, 1988)
Figure 2.7: Success vs. Failure Predictions Using Immersion-Compression Test
(Kiggundu and Roberts, 1988)
24
Figure 2.8: Success vs. Failure Predictions Using the Boil Test (10-Minutes)
(Kiggundu and Roberts, 1988)
2.8 Effective Asphalt Thickness
An asphalt concrete mixture should have an adequate asphalt film thickness
around the aggregate particles to ensure reasonable durability of the mixture.
Campen et al. (1959) presented the relationship between voids surface area, film
thickness and stability for dense graded asphalt mixtures. The author’s recognizes
that thicker asphalt binder films produced mixes which were flexible and durable,
while the thin film produces mixes which were brittle, strip and ravel excessively
hinder pavement performance as well reduce the useful service life. On the other
basis the data analysis by Campen et.al recommended film thickness ranging from 6
to 8 micron were found to have provide most durable pavement mixtures, but lower
film thickness then 6 to 8 micron would lead to insufficient bonding between the
asphalt-aggregate interface that result to stripping.
25
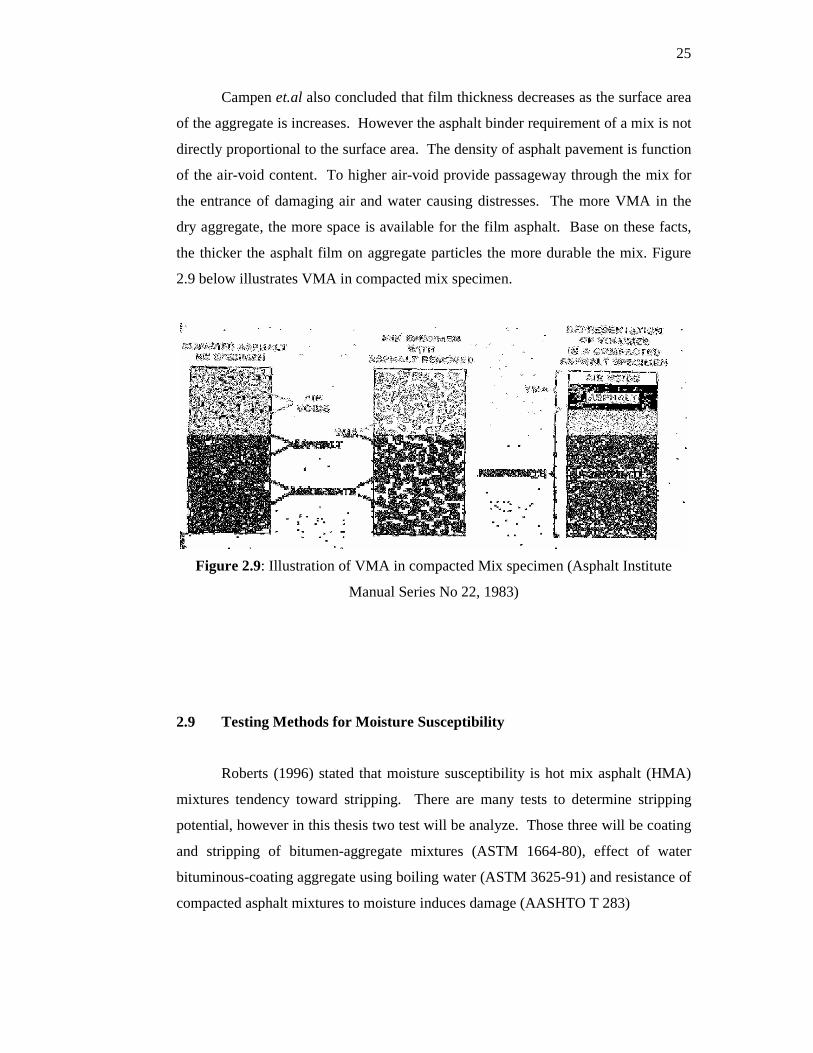
Campen et.al also concluded that film thickness decreases as the surface area
of the aggregate is increases. However the asphalt binder requirement of a mix is not
directly proportional to the surface area. The density of asphalt pavement is function
of the air-void content. To higher air-void provide passageway through the mix for
the entrance of damaging air and water causing distresses. The more VMA in the
dry aggregate, the more space is available for the film asphalt. Base on these facts,
the thicker the asphalt film on aggregate particles the more durable the mix. Figure
2.9 below illustrates VMA in compacted mix specimen.
Figure 2.9: Illustration of VMA in compacted Mix specimen (Asphalt Institute
Manual Series No 22, 1983)
2.9 Testing Methods for Moisture Susceptibility
Roberts (1996) stated that moisture susceptibility is hot mix asphalt (HMA)
mixtures tendency toward stripping. There are many tests to determine stripping
potential, however in this thesis two test will be analyze. Those three will be coating
and stripping of bitumen-aggregate mixtures (ASTM 1664-80), effect of water
bituminous-coating aggregate using boiling water (ASTM 3625-91) and resistance of
compacted asphalt mixtures to moisture induces damage (AASHTO T 283)
26
For the boiling water test loose HMA mix is added to boiling water. The mix
is allowed to stay in the boiling water for 10 minutes. Moisture damage is measured
through monitor the loose HMA in the water. The percentage of the total observable
area of the aggregate that retained its original coating of asphalt cement is rated as
also above or below 95 percent. It is complicated to establish the amount of
stripping that take place of fine aggregate since fine aggregates are difficult to see.
This testing method is liable to work better when using liquid anti-stripping agents
(Roberts et al, 1996).
Yoon and Tarrer (1988) explored the measurable association of aggregate
properties to the stripping susceptibility of a mix of aggregate and asphalt cement.
Yoon and Taffer used the boiling water test in their experimental design. Through
conducting the boiling water test using different pH levels, Yoon and Tarrer
determined that effectiveness of some additives is sensitive to the pH of water that
has been in contact with the aggregate surface. Yoon and Tarrer found that there was
no relationship between physical properties, such as pore volume and surface area, of
an aggregate and the stripping susceptibility of that aggregate. However, chemical
and electrochemical properties affected stripping susceptibility of the aggregate.
A second type of test is the resistance of compacted asphalt mixtures to
moisture induces damage (AASHTO T 283). A HMA mix sample is immersed in a
distilled water bath at 77oF (25oC). The mix is left in the water bath for 2 hours. The
indirect tensile strength test measured the change in the tensile strength resulting
from the effect of saturation and accelerated water connecting to complete HMA in
the laboratory. This result is used to predict long term stripping susceptibility of
bitumen mixtures. The numerical indices of retained indirect tensile properties are
obtained by comparing the retained indirect properties of conditioned laboratory
specimens with similar properties of dry specimen. The indirect tensile test
performed on the compression machine shown in Figure 3.3 of Chapter 3. The index
or the resistance of asphalt mixtures to the detrimental effect of water can be
expressed as the ratio of the original strength that retained after conditioning.
HMA design should be tested in a situation where moisture does infiltrate air
voids of the mixture. For this reason many tests are performed at 7 percent air voids
27
(Roberts et al. 1996). A TSR value of less than 80 percent is considered to be
moisture susceptible. A study by Hunter (2001) indicates that’s, TSR results of each
mixtures decrease as the number of cycle increased. In her studies she use two type
of aggregate which is granite and lime stone.Sixteen samples were produced for each
of the the eight mixtures at 7% air voids and were tested for 15 freeze-thaw cycle
condition. The summary of TSR value is shown in Table 2.4.
Table 2.4: TSR value for Number of Freeze-Thaw Cycles (Hunter, 2001)
CHAPTER 3
METHODOLOGY
3.1 Introduction
The foremost function of this laboratory work is carried out to verify the
stripping potential take place in ACW14 by using three (3) different compactive
efforts in the Marshall Mix design. Beside the specimens are used to determine the
optimum bitumen content that will be used to design the mixes, the specimen also
used to conduct the stripping test. There are two (2) test conducted to determine the
potential of HMA mixture to stripping problem which is as stated below:
i) Test the loose uncompacted mixtures; and
ii) Test compacted specimens.
The entire test will be performed in Highway and Transportation Laboratory
of Universiti Teknologi Malaysia. In order to acquire laboratory work, the samples
are prepared and tested in consistent with JKR/SPJ/1988 whilst the material used for
this laboratory work accomplish the Malaysia Road Work state of affairs. The
applicable envelopes for gradation of aggregates which used in this project are
revealed in Table 3.1.
29
Table 3.1: Gradation Limit for Asphaltic Concrete (ACW 14)
Mix Type Wearing Course
B.S Sieve Size % Passing By Weight
37.5 mm -
28.0 mm -
20.0 mm 100
14.0 mm 80-95
10.mm 68-90
5.0 mm 52-72
3.35 mm 45-62
1.18 mm 30-45
425 µm 17-30
150 µm 7-16
75 µm 4-10
To achieve optimum quality of asphalt concrete mix for a blend or gradation
inside the limit set in Table 3.1, a series of test specimen is prepared for a range of
different asphalt content which shown in Table 3.2, so that the test data curves shows
well-define optimum value. In this project for ACW 14, the author will carry out
Marshall Test for three (3) different blows, which are 35 blows, 50 blows and 75
blows. The test result of ACW14 for this project will be judge against the parameter
of JKR/SPJ/1988 requirement as stated in Table 3.3.
Table 3.2: Design Asphalt Content (JKR/SPJ/1988)
Mixture Bitumen Range
ACW14 5.0%-7.0%
30
Table 3.3: Specification for Asphaltic Concrete Mix (JKR/SPJ/1988)
Parameter Wearing Course Binder Course
Stability S > 500kg >450kg
Flow F > 2.0mm > 2.0mm
Stiffness S/F >250kg/mm >225kg/mm
Air Void in mix 3.0%-5.0% 3.0%-7.0%
Void In aggregates filled with bitumen 75-85% 65-80%
3.2 Preparation of Laboratory Test
The laboratory work involve in this project is categorizes as follows:
i) Select the source of material;
ii) Sieve of aggregate;
iii) Determine the specific gravity of bitumen and aggregate;
iv) Preparation of Marshall samples;
v) Marshall test;
vi) Analyze the test data;
a) Assess the specific gravity of aggregate and bitumen;
b) Percentage of aggregates in design mix;
c) Preparation of graph and analysis;
d) Determination of optimum bitumen content; and
vii) Ultimately interpretation of test information.
In this project for ACW14 mixtures, requires approximately 90 samples (72
compacted samples and 18 uncompacted samples). The samples will be prepared
based on the bitumen content of 80/100 penetration. Figure 3.1 summaries the
overall laboratory test.
31
Figure 3.1: Exemplify Laboratory Test Flow Chart
TEST SAMPLES 1) Test Method for Coating and Stripping of Bitumen-Aggregates Mixtures
(ASTM D 1664-80) 2) Test Method for Effect of Water Bituminous-Coated Aggregate Using Boiling
Water (ASTM 3625-91) 3) Test Method for Moisture Induce Damage Test (AASTHO T283)
MIX DESIGN 4) Preparation of 45 samples to obtain optimum bitumen Content 5) Plotted Graf Showing Test Result Series of Marshall Specimen 6) Bulk Specific Gravity and Density of Compacted Mixtures Using saturated
Bituminous Surface- Dry Specimen (ASTM D 2726-90) 7) Resistance to Plastic Flow of Bituminous Mixtures Using Marshall Equipment
(ASTM D 1559-89)
EVUALATION of MATERIAL 1) Aggregate
-Sieve analysis -Specific Gravity
2) Bitumen -Pen 80/100 -Specific Gravity
PREPARATION OF MIX 1) ACW 14 (35, 50 & 75 blows)
DATA ANALYSIS
SUMMARY of RESULT and CONCLUSION
32
3.3 Preparation of Aggregate
The aggregate gradation is determined by sieve or gradation analysis of
aggregate samples. Figure 3.2 illustrates the sieve analysis involves running the
samples through a series of sieves, each of which has openings of specific sizes. The
percentage of aggregate that will use for this project is shown in Table 31.
Figure 3.2: Sieve Analysis
3.4 Marshall Method of Mix Design
The goal of the laboratory compaction of a specify sample is to determine
optimum asphalt binder content in a mixture. In this project the author will conduct
three (3) different compactive efforts which are 35 blows, 50 blows and 75 blows for
ACW 14 mixture, which is a total of 45 samples
33
Based on the test, graph of asphalt binder content will plot on the x-axis
versus the following on the y-axis:
i) Marshall Stability;
ii) Marshall Flow;
iii) Percent air void in the total mineral;
iv) VTM;
v) VFA; and
vi) Stiffness.
As described by National Asphalt Paving Association (NAPA) the optimum
asphalt content is determine based on the 4% air void in VTM. After obtaining the
optimum asphalt, the parameters encoded in Table 3.4 are checked based on
optimum asphalt content.
3.5 Preparation of Mix Design
i) In preparation mix design the equipment or apparatus that are to be
used namely:
a) Breaking Head;
b) Compaction Hammer;
c) Compaction Pedestal;
d) Mixing Equipment;
e) Mixing Tool;
f) Oven;
g) Specimen mold Assembly;
h) Specimen Mold Holder; and
i) Thermometer.
ii) The test material which will exercise in this project is categorize
below:
34
a) Two (2) different type aggregate mix description that has to be dried
at 105ºC to 110ºC; and
b) Heated asphalt cement.
iii) Mixtures Preparation;
a) Aggregate is weighted base on the amount of each size portion that
needed for compaction;
b) The pan is heated to 28ºC after placed it on hot plate;
c) Change the pan with the heated aggregate and dry mix meticulously;
d) Weigh the preheated bituminous materials needed for the mixture;
e) The temperature should not exceed the acceptable limit to prevent
losing of mix during mixing;
f) Then both aggregate and bitumen is mixed at a fast pace pending
comprehensively coated;
g) In the end, the mixture is confiscate from the pan and set for
compaction course of action;
The procedure of mixing and compaction for ACW 14 for Marshall Test is as per the
above statements.
3.6 Marshall Test Procedures
3.6.1 Bulk Specific Gravity and Density of Compacted Bituminous Mixtures
Using Saturated Surface - Dry Specimen (ASTM D2726-90)
This method covers the determination of bulk specific gravity and density of
specimens of freshly compacted mixtures which have cooled to room temperature.
This test method should be used only with dense-graded or particularly non
absorptive compacted mixtures. This method is useful in calculating percent (%) air
voids, as given in Test Method D3203 and unit weight of compacted dense
bituminous mixtures.
i) Terminology;
35
a) Bulk density determine by this test method, the mass of a meter cubed
of the material at 25ºC; and
b) Bulk density determine test method, the ratio of the mass of given
volume of material at 25ºC to an equal volume of water at the same
temperature.
ii) Equipment;
a) Balance; and
b) Water Bath.
iii) Procedure;
a) Mass of Dry Specimen in Air-Weigh the specimen after it have been
standing in air at room temperature for at least one (1) h. Designate
this mass as A; and
b) Mass of Specimen in Water-Immerse the specimen in a water bath at
25ºC for 3 to 5 minutes then weighs in water. Assign this mass as C.
If the temperature of the specimen differs from the temperature of the
water bath by more than 2ºC, the specimen shall be immersed in the
water bath for 10 to 15 minutes; and
c) Mass of Saturated Surface-Dry Specimen in Air-Surface dries the
specimen by blotting quickly with a damp towel and then weighs in
air. Assign this mass as B.
iv) Calculation;
a) Calculation the bulk specific gravity of the specimen as follows:
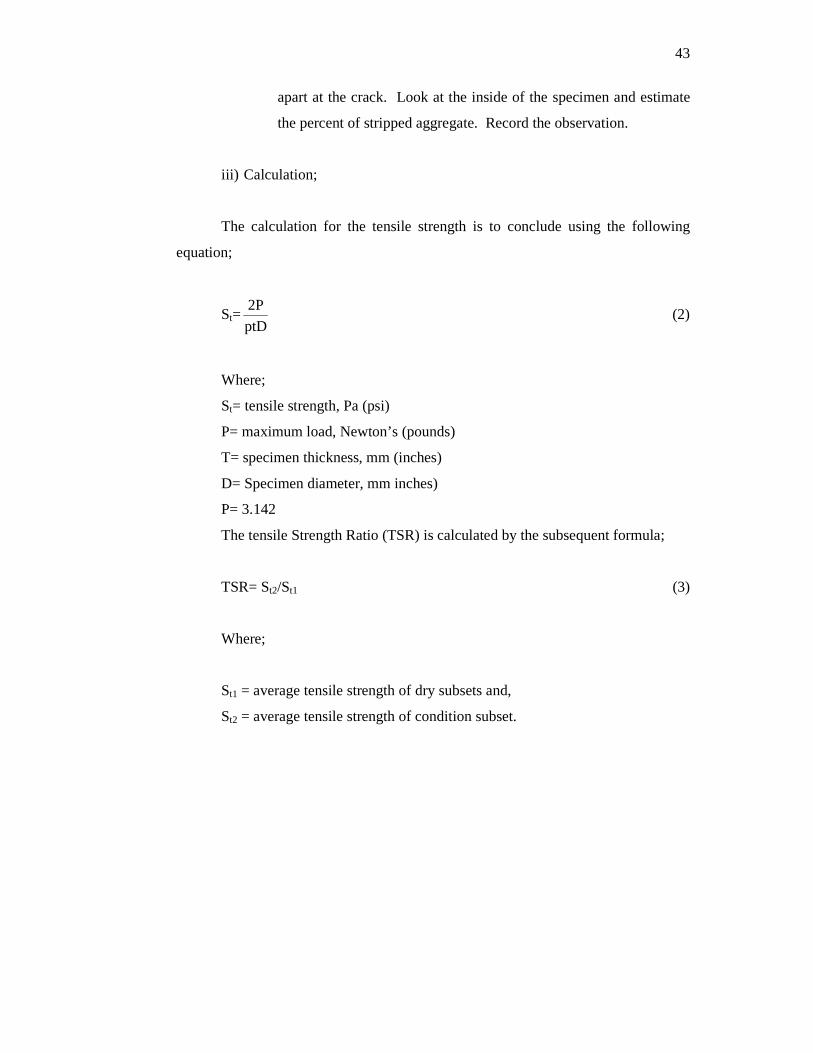
Bulk Specific Gravity = A/B-C (1)
A = mass of the dry specimen in air, g; (B - C) = mass of the volume of water for the volume of the specimen at 25ºC; B = mass of the saturated surface-dry specimen in air, g; and C = mass of the specimen in water, g;
b) The bulk specific gravity of the specimen at 25ºC can be
calculated from bulk specific gravity of specimen measured at any
other temperature as follows:
36
Bulk specific gravity at 25ºC = K x Bulk specific gravity
measured at any temperature
where: K is determine from Table 3.4
c) This calculation is valid for accuracy of the test method if the
temperature of water is differs from 25ºC by below 3ºC. For a
different temperature higher than 3ºC, a alteration to the mass of
water displaced shall be made via following equation:
correction =∆T x Ks x (B-C)
where: ∆T = 25ºC – the temperature of the water bath; and
Ks = 6x 10⁻⁵mL/mL/ºC average coefficient of cubical
thermal expansions of bituminous concrete.
d) Calculate the density of the specimen as follows:
Density = Bulk specific gravity x 997.0
where: 997.0 = density of water in Kg/m3 at 25ºC (99.70g/cm3)
e) This test method has been written using the absolute system for
density (kilograms per meter cubed) in SI units.
Table 3.4: Absolute Density of Water and Conversion
Factor K for various Temperatures
37
3.6.2 Resistance to Plastic Flow of Bituminous Mixtures Using Marshall
Equipment (ASTM D1559-89 )
Figure 3.3: Compression machine
The test procedure is scheduled as below:
i) Specimens prepared with asphalt cement to the specified temperature by
immersing in the water bath 30 to 40 minutes;
ii) Maintain bath temperature at 60 ± 1ºC for asphalt cement;
iii) Methodically clean the guide rods and the in side surfaces of the test
heads prior to making the test;
iv) Lubricate the guide rods so that the upper head slides freely over them,
v) The testing-head temperature maintained between 21.1-37.8ºC;
vi) Removed the specimen from water bath and place the specimen lower
segment of the breaking head;
vii) Place the upper segment of the breaking head on the specimen and place
the complete assembly in position the testing machine. The flowmeter is
placed in position over one of the guide rods, and then adjust the
flowmeter to zero while holding the sleeve firmly against the upper
segment of the breaking head;
viii) Record the reading before the specimen is loaded;
38
ix) Next step is, the load applied to the specimen by constant movement to
50.8 mm minimum until the maximum load is accomplished;
x) Load decline as designate by the dial;
xi) The maximum load begins to drop off is noted or converted from
maximum micrometer dials reading
xii) Record the last reading of the flowmeter and the value of flowmeter is
subtracted to the first value, which this will indicates as a flow value in
mm unit. In additional the total time for the overall test should not go
over 30s.
3.6.3 Test Method for Coating and Stripping of Bitumen-Aggregate Mixtures
(ASTM D1664-80 )
This method illustrates coating and static immersion procedures for
determining the withholding of bituminous film on the aggregate surface in the
occurrence of water.
i) Equipments;
a) Container;
b) Scales;
c) Spatula;
d) Constant Temperature Oven; and
e) Sieves;
ii) Procedures;
a) Prepare aggregates that passes 100% 9.5mm sieve and retained on a
6.3mm sieve.;
b) Wash aggregates in distilled water which has 6.0 to 7.0 pH value to
eliminate the all fines;
c) Dry at 135 to 149 ºC to constant weight and store in air tight