1 Borders, Ethnicity and Trade Jenny C. Aker, Michael W. Klein, Stephen A. O’Connell and Muzhe Yang ∗ May 2012 Abstract Do traders incur additional costs for their cross-border trade in sub-Saharan Africa? This paper uses unique high-frequency data on prices of two agricultural goods to examine the additional costs incurred in cross-border trade between Niger and Nigeria, as well as trade between ethnically distinct markets within Niger. We find a sharp and significant conditional price change of about 20 to 25 percent between markets immediately across the national border. We also find that price change significantly diminished when markets on either side of the border share a common ethnicity. Focusing on markets in Niger only, we find the presence of a within-country ethnic border effect, almost as large as the between-country national border effect. Our results suggest that having a common ethnicity reduces the transaction costs associated with agricultural trade, especially in communications and credit transactions. Key words: Africa, border effects, agriculture, ethnicity. JEL: F1, O1, Q1. ∗ Jenny C. Aker, The Fletcher School and Department of Economics, Tufts University, [email protected]; Michael W. Klein, The Fletcher School, Tufts University, [email protected]; Stephen A. O’Connell, Department of Economics, Swarthmore College, [email protected]; Muzhe Yang, Department of Economics, Lehigh University, [email protected]. This research was partially funded by the National Bureau of Economic Research Africa Project. We would like to thank Jonathon Robinson, as well as seminar participants at Boston College, the Center for Global Development, National Bureau of Economic Research, Northeast Universities Development Conference (NEUDC), Université de Clermont-Ferrand and University of Gottingen for their helpful comments and suggestions. All errors are our own.
Transcript
1
Borders, Ethnicity and Trade
Jenny C. Aker, Michael W. Klein, Stephen A. O’Connell and Muzhe Yang∗
May 2012
Abstract
Do traders incur additional costs for their cross-border trade in sub-Saharan Africa? This paper uses unique high-frequency data on prices of two agricultural goods to examine the additional costs incurred in cross-border trade between Niger and Nigeria, as well as trade between ethnically distinct markets within Niger. We find a sharp and significant conditional price change of about 20 to 25 percent between markets immediately across the national border. We also find that price change significantly diminished when markets on either side of the border share a common ethnicity. Focusing on markets in Niger only, we find the presence of a within-country ethnic border effect, almost as large as the between-country national border effect. Our results suggest that having a common ethnicity reduces the transaction costs associated with agricultural trade, especially in communications and credit transactions.
∗ Jenny C. Aker, The Fletcher School and Department of Economics, Tufts University, [email protected]; Michael W. Klein, The Fletcher School, Tufts University, [email protected]; Stephen A. O’Connell, Department of Economics, Swarthmore College, [email protected]; Muzhe Yang, Department of Economics, Lehigh University, [email protected]. This research was partially funded by the National Bureau of Economic Research Africa Project. We would like to thank Jonathon Robinson, as well as seminar participants at Boston College, the Center for Global Development, National Bureau of Economic Research, Northeast Universities Development Conference (NEUDC), Université de Clermont-Ferrand and University of Gottingen for their helpful comments and suggestions. All errors are our own.
2
1. Introduction
There is general agreement among economists that international trade
promotes an efficient allocation of resources, and that factors increasing trade costs
may therefore impose a deadweight loss in social welfare. There is also evidence
that trade contributes to economic growth (Frankel and Romer 1999, Feyrer 2008).
These benefits from trade are an important motivation for research that examines
the extent to which national borders hinder trade among industrialized countries,
notably by considering the differences in price dispersion between locations on
opposite sides of a national border as compared to locations within the same country
(Engel and Rogers 1996; Parsley and Wei 2001; Gopinath, Gourinchas, Hsieh and Li
2011).1
The allocative and growth effects of international trade may well be greater
for low-income countries than for high-income economies. Yet even with this
greater motivation for estimating the border effects in low-income countries, there
has been limited research on the border effect across and within developing
countries, presumably due to the absence of high-frequency price data on narrowly
defined goods in spatially distinct locations.2 By contrast, we construct monthly
consumer prices for two agricultural goods — millet and cowpeas — from 70
markets in Niger and northern Nigeria between October 1999 and September 2007.
In addition, we have data on a variety of factors that may affect price differences
1 The magnitude of these estimates has been questioned by Gorodnichenko and Tesar (2009) who show that differences in underlying price volatility across countries contribute to the estimated border effect. 2 Research on the border effect in developing countries includes Morshed (2007) and Araujo-Bonjean, Aubert and Egg (2008).
3
across markets, including rainfall, market size, the geographic location of the
market, road distances and fuel prices.
Focusing on agricultural goods that are arguably homogenous, we estimate
the additional transaction costs incurred when markets are located in different
countries, conditional on other factors. In the absence of formal trade barriers or
natural impediments between these two countries, we interpret these additional
costs as border effects, similar to the interpretation given by Gopinath, Gourinchas,
Hsieh and Li (2011, henceforth GGHL).
In line with the macroeconomics literature on border effects in industrialized
countries, we first examine the cross-border price differences of market pairs
between countries, as compared with the same differences within each country
(Engel and Rogers 1996). Controlling for transport costs and local market
conditions, we find that price differences are relatively more responsive within
countries rather than between countries. The regression-based estimate of the
border effect is 2 to 3 percent for both commodities. This is quite modest as
compared to results found for industrialized countries.
Recognizing the omitted variables bias associated with this market-pair
approach, we build upon the single market analysis employed by GGHL to evaluate
the change in the price of a product in one market that is supposedly relocated just
across the border. Using this single market approach, we find a price change at the
border of 17 to 26 percent for millet, and a slightly larger effect for cowpeas.
4
A novel feature of our study is the examination of the role of ethnicity on
trade, both across international borders and across de facto spatial separation of
ethnic groups within Niger. To our knowledge, this is the first study of the effects of
ethnic diversity on domestic and cross-border trade.3 Our study relies on two facts
to measure these effects. First, the Niger-Nigeria border, created in the wake of the
1884–85 Berlin Conference, was drawn to divide an ethnically homogeneous region,
similar to other countries in sub-Saharan Africa (Awiwaju 1985). Second, ethnic
groups within Niger cluster in distinct geographic regions, creating a de facto
separation among ethnic groups — an “ethnic border” — within the country.
We use these facts to analyze the effect of common ethnicity on mitigating
differences in prices across the national border. We also examine whether the
spatial ethnic separation drives price differences between ethnic regions of Niger in
a way similar to the between-country national border. We find that common
ethnicity mitigates the costs of cross-border trade: prices are more closely
arbitraged between the Hausa regions of Niger and Nigeria than between cross-
border markets that do not share a common ethnic composition. We also find that
the cost of trade across the internal ethnic border is 17–20 percent, similar to that of
trade across the international border.
We provide further but somewhat more speculative evidence on the
mechanisms behind the internal border effect by examining traders’ characteristics
3 Studies of cross-border trade in West Africa have typically been restricted to a few locations and time periods (Azam 2007). Araujo-Bonjean et al. (2008) estimate a vector autoregression model using monthly market-level grain price data for markets in Niger, Mali and Burkina Faso and find a statistically significant border effect within the CFA zone.
5
and behavior close to the ethnic border. While markets on either side of the border
engage in cross-border trade and have similar geographic characteristics and
institutions, there are significant differences in language, the gender composition of
traders and borrowing and lending behavior between the two groups. We posit that
these differences have important implications for the role of intra-ethnic social
networks in lowering the transaction costs associated with trade. This is consistent
with a substantial literature on rural institutions in Africa (Fafchamps 2001) as
well as with global evidence documenting the effects of ethno-linguistic
fractionalization on outcomes such as growth (Easterly and Levine 1997),
corruption (Mauro 1995), contributions to local public goods (Alesina, Baqir and
Easterly, 1999) and participation in groups and associations (Alesina and La
Ferrara 2000).
The rest of the paper is organized as follows. Section 2 provides the context
of our empirical study by discussing some relevant characteristics of the regions,
including agricultural trade patterns, the geographic nature of ethnic groupings and
the establishment of the international border. Section 3 describes our data,
followed by Section 4 discussing the empirical strategy. Section 5 presents the
results for the international border effect. Section 6 investigates the role of ethnic
diversity in creating internal barriers and the potential microeconomic mechanisms
behind this border effect. Section 7 concludes.
2. Trade, Markets, and Ethnicity in Niger and Nigeria
6
2.1. Historical Roots of Trade between Niger and Nigeria
Niger is one of the poorest countries in the world and the lowest-ranked
country on the United Nations’ Human Development Index (UNDP 2011). The
majority of the population consists of rural subsistence farmers, who depend upon
rainfed agriculture as their main source of food and income. As a landlocked
country, Niger depends upon trade with its contiguous neighbors, primarily the
coastal countries of Benin and Nigeria, but also the landlocked countries of Burkina
Faso and Mali.
Niger’s trade links with Nigeria have a long and rich history. In the
centuries prior to the arrival of the colonial powers, the Hausa ethnic group in
modern-day northern Nigeria and Niger was linked to the rest of the continent
through a set of long-distance trading routes. One of these was the trans-Saharan
trade route connecting Katsina and Kano (Nigeria) to Tripoli (Libya) via Niger.
Trade along this route was primarily in slaves, textiles, livestock, grains and salt.
A second route was the westward trade in kola nuts between Niger and Nigeria and
what is now Ghana (Hashim and Meager 1999).
The 1,500-km border between the French colony of Niger and the British
colony of Nigeria was established in the wake of the 1884–85 Berlin Conference.
The placement of the border reflected the opposing territorial interests of the
French and British colonial administrations; the French government wanted access
to Chad across southern Niger, thus moving the border from the northern desert
regions to a location within the arable zone further south, while the British
7
government insisted that the Hausa-Fulani kingdoms of northern Nigeria be kept
intact. The border that emerged in 1906 divided the Hausa, Fulani and Kanuri
ethnic groups between the two countries.4 It also created a Niger that included
eight primary ethnic groups (Hausa, Songhai/Zarma, Toureg, Fulani, Kanuri, Arab,
Toubou and Gourmantche) that were, for the most part, situated in geographically
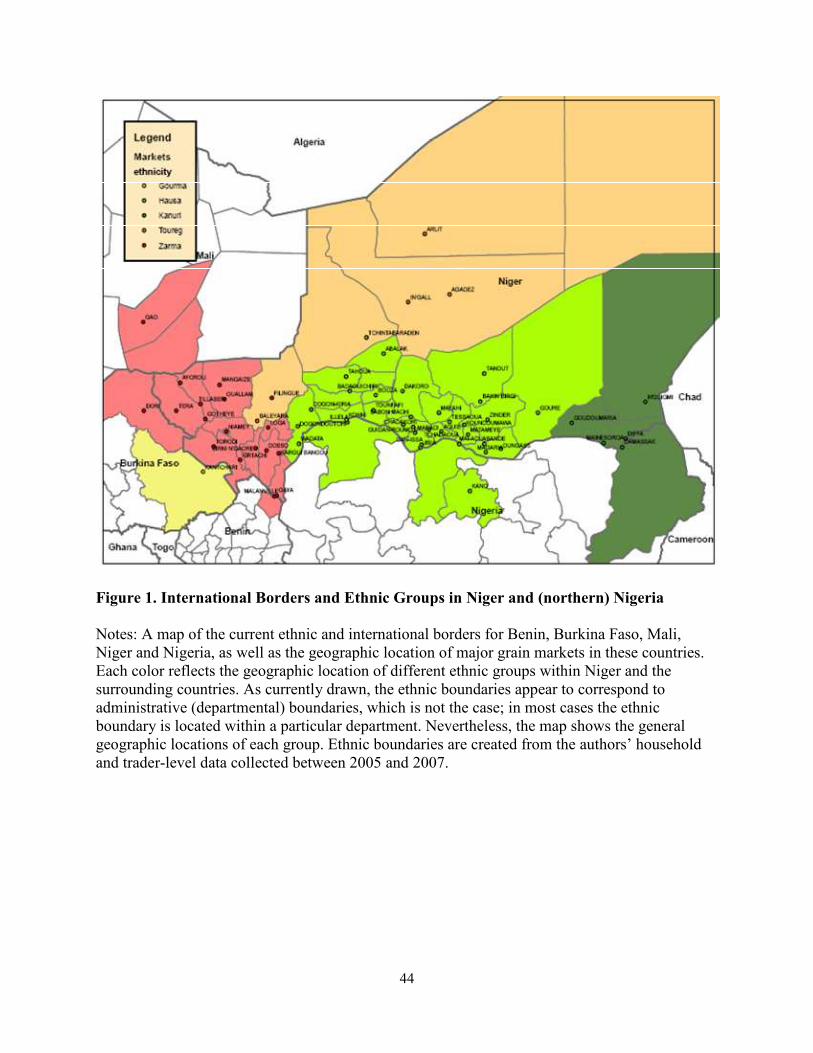
distinct regions (Figure 1).5
Few road networks were developed to link Niger and Nigeria during the
colonial period, and, as a result, there were relatively few official border crossings
by the time of Niger’s and Nigeria’s independence in 1960. As building more
crossing stations was a low priority for the newly independent states, the Niger-
Nigeria border was relatively porous post-independence. Both countries have been
members of the Economic Community of West African States (ECOWAS) since the
mid-1990s. ECOWAS is a regional customs union that allows trade in locally-
produced agricultural products (such as millet, sorghum, maize and cowpeas) to be
largely free of trade restrictions or governmental regulations. In addition, there are
no natural barriers separating the countries.6
2.2. Present-Day Agricultural Trade
4 The Niger-Nigeria border created a “partitioned culture area” among Hausa and Fulani populations (Asiwaju 1985). At the outset of the international demarcation, inhabitants with farmland straddling the boundary had to choose one colonial side or the other, as French subjects were not supposed to farm on British territory, and vice versa (Miles 2005). 5 A map of Nigeria in 1957–58 suggests that the geographic location of ethnic groups is similar to the ethnographic maps for 2008. 6 The Niger River is the principal river of West Africa. The river’s source starts in Guinea and empties into the Niger Delta in southern Nigeria. While the river traverses both Niger and Nigeria, it only forms a border between Niger and Benin, rather than between Niger and Nigeria.
8
Trade in agro-pastoral products within and between Niger and northern
Nigeria is conducted through a system of traditional markets, each of which is held
on a weekly basis. Markets are primarily located in a specific geographic area, such
as a village, town or urban center. The density of grain markets within each
country varies considerably by geographic region, with inter-market distances for
which trade occurs ranging from 10 km to over 1,000 km. The number of traders
operating on each market ranges from 24 to 353, with retailers accounting for over
50 percent of all traders.
In this study we focus on two of the most heavily traded goods in these
markets, millet and cowpea. Millet is a staple grain in both countries and is
produced and consumed in almost all regions, especially those located near the
Niger-Nigeria border. Cowpea is produced in most agro-climatic zones of both
countries and functions as a cash crop for rural households. Both commodities are
heavily traded across the Niger-Nigeria border, although with different trade flows.
While cross-border trade occurs throughout the year, millet is more heavily
imported into Niger from Nigeria during the pre-harvest period, and cowpea is more
heavily exported from Niger to Nigeria immediately after the harvest.
Aker (2010) shows that millet and cowpeas are relatively homogeneous goods
in these markets, and that there do not appear to be systematic price premiums
either within or across markets based upon size or color of the commodity. Despite
attempts to introduce improved varieties over the course of the past decade, the
primary type of millet cultivated and sold in southern Niger and northern Nigeria is
9
pearl millet, Pennisetum glaucum (Ndjeunga and Nelson 2005); the primary cowpea
variety is black-eyed cowpea (Lambot 2000).7 Nevertheless, we attempt to address
potential concerns about the homogeneity of these goods, and the services provided
across markets, in a later section.
Despite the absence of natural or political barriers to trade between the two
countries, there are several potential barriers to trade in agro-pastoral goods at the
international border. One possible source of trade friction arises from currency
exchange costs between the Communauté Financière Africaine (CFA) franc of Niger
and the Nigerian Naira.8 Furthermore, there are often costs due to delays at the
border (waiting for customs papers) or bribes paid to police officers and customs’
officials.9 Finally, linguistic differences (between the official languages of Niger and
Nigeria, French and English, respectively) could also add to transaction costs if
trade is conducted in these languages.
3. Data
This study constructs five primary and secondary datasets. The first includes
monthly market-level consumer price data for millet and cowpea over an eight-year
7 The color of cowpeas in West Africa can be white, black, brown or red (Lambot 2000). In Niger, white and red cowpea varieties are available, but for all of the markets in our sample, only white cowpeas were available. 8 There was a devaluation of the CFA in 1994, and the CFA is currently pegged to the Euro zone. While both of these events could affect the CFA-Naira exchange rate, they predate our sample period. 9 Some authors (e.g., Azam 2007) have noted that banditry can be an important cost in the cross-border of certain goods across the border. Banditry and theft does not appear to be an issue in the trade of agricultural products. According to our transporter survey conducted between 2005 and 2007, fewer than 5% of transporters had items stolen during transport over the two-year period, and none of these transporters cited banditry as a primary constraint to trade.
10
period from October 1999 to September 2007.10 These data were collected from
Niger’s Agricultural Market Information System (AMIS) and include prices from 70
markets in Niger and northern Nigeria. The price data from Nigerian markets
were also collected by Niger’s AMIS, in Naira, and converted into CFA using the
CFA/Naira exchange rate of that day. We do not have access to the original price
data in Naira nor the daily CFA/Naira exchange rate used for the price conversion.
The second dataset includes information on the latitude and longitude of each
market and of the Niger-Nigeria border. These data allow us to calculate the
Euclidean distances for market pairs and to control for the distance from each
market to the international border.
The third dataset includes monthly data on gasoline prices and the
CFA/Naira exchange rate, as well as market-level monthly data on rainfall, the date
of mobile phone coverage and road quality. These data were collected from a
variety of primary and secondary sources, including the Direction de la Meteo, the
mobile phone companies, and the Nigerien oil company (SONIDEP).
The fourth dataset is based on a unique survey of traders, transporters and
market resource persons collected by one of the authors between 2005 and 2007.
These survey data draw on interviews with 400 traders and 205 farmers located in
35 markets and 40 villages across Niger and northern Nigeria. The data contain
information about the ethnic composition of traders on each market, which also
reveals where ethnic groups are geographically located within a country.
10 Price data are the average price in the market on a particular market day for a given weight.
11
The fifth dataset includes information on the ethnic composition of villages
and markets located in the area that divides the Hausa and Zarma ethnic regions of
Niger. The dataset includes the latitude and longitude of each village, the date of
the village’s creation, the current ethnic composition of village residents and the
ethnic composition of the village in 1960, the year of Niger’s independence.
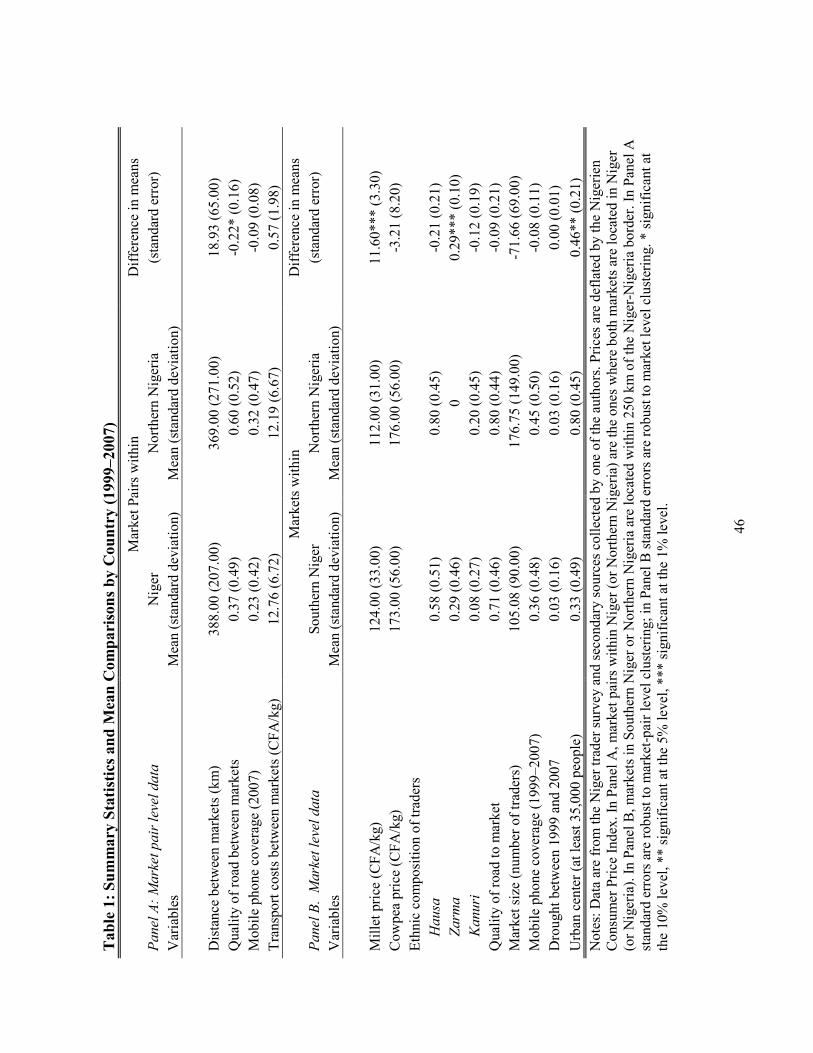
Table 1 presents summary statistics for both countries between October 1999
and September 2007. Panel A includes data for market pairs located within each
country, whereas Panel B includes data for markets located within 250 km of the
international border. The average price (CFA/kg) for millet during this time period
was higher in Niger, with a statistically significant difference between the two
countries (Panel B). This is consistent with the prevailing direction of trade, as
Niger is a net importer of millet from Nigeria. By contrast, average cowpea prices
are lower in Niger (although the difference is not statistically significant), as Niger
exports cowpeas to Nigeria. Markets have slightly more traders in northern Nigeria,
and are more likely to be located in an urban center. However, we do not reject the
equality of means for most observable characteristics of markets located within 250
km of the international border, with the exception of the prevalence of traders from
the Zarma ethnic group.
Figure 1 shows the international border between Niger and northern Nigeria,
as well as the location of ethnic groups along the border.11 As shown in this figure,
11 A map of Nigeria in 1957–58 suggests that the geographic location of ethnic groups is similar to the ethnographic maps for 2008.
12
as well as in Table 1, the Nigerian markets in our sample are only composed of the
Hausa and Kanuri ethnic groups.12
4. Empirical Strategy
We measure the border effect using two empirical strategies. First, we
conduct a market-pair analysis. Similar to analyses conducted in other studies (e.g.,
GGHL), we aim to answer the question whether price gaps are larger when markets
are separated by country than when they are not, conditional on other factors such
as the transport cost between the markets.
Second, we consider one market on either side of the border. Our approach
closely follows the one used by GGHL. Hereafter, we refer to this as the single-
market analysis. In this case we measure the border effect as the change in the
price (in logarithm) of a good from selling it in another market immediately across
the border, focusing on price levels rather than price gaps. We control for the
distance between a market location and the border in order to isolate a change in
price at the border. This change implies an additional transaction cost imposed
solely by the border.
4.1. Market-Pair Analysis
Our regression model for the market-pair analysis is the following:
12 While members of the Zarma ethnic group live within Nigeria, they constitute a small percentage of the population (0.001 percent) and are geographically focused in the northwest region of the country, near the Benin-Niger border.
where "�� and "�� are the prices (in CFA), at time t in market i and market j,
respectively.13 “��������” is a binary variable equal to one if market i and market j
are in different countries (Niger or Nigeria) and zero if both markets are in the
same country; ��� and ��� are vectors of time-varying variables such as drought and
mobile phone coverage for market i and market j, respectively; ��� is a vector of
time-invariant observables shared by market i and market j; �� and �� are fixed effects for market i and market j, respectively; �� denotes the monthly time effect;
and ��� is the mean-zero disturbance term.
In this model, �� represents the average increment in the difference between
log prices — equivalently, the percent change in the magnitude of the price ratio —
exclusively attributable to crossing an international border, conditional on market-
level observables and transport costs between markets. However, for a pair of
markets located in different countries and far away from the border, country-level
unobserved heterogeneities can confound the border effect. For our estimation
sample, we therefore consider market pairs no more than 250 kilometers apart, the
mean distance between markets in our sample. To check the robustness of the
results, we also use alternative measures of inter-market distance, namely, those
markets that are no more than 150 kilometers apart. As differences in underlying
13 Most market-pair analyses regress a measure of price dispersion between two markets on a binary variable that equals one if the two markets are separated by a border (Engel and Rogers 1996, Parsley and Wei 2001, and Ceglowski 2003). GGHL also use a price gap analysis, with the same dependent variable as the one used in our specification.
14
price volatility in two countries can bias the estimate of the border effect upward
(Gorodnichenko and Tesar 2009),14 we also include indicator variables for country-
specific pairs.
4.2. Single-Market Analysis
As suggested above, the effects of unobserved heterogeneity might be
mitigated by restricting the sample to markets within a certain distance of each
other. An alternative approach to controlling for this source of unobserved
heterogeneity is to limit the sample to markets located very close to the border. Our
second approach estimates the effect on a single market price of moving from one
country to another for markets close to the international border. The rationale for
this approach is that markets located close to each other are likely to share, on
average, common observable and unobservable characteristics.15 This is
particularly relevant in our context, as the Niger-Nigeria border is not formed by
natural features such as rivers, lakes or mountains.
Our regression model for the single-market analysis of the international
where "�� denotes the price of a good, measured in CFA, sold in market i at time t;
“$%&���” is a binary variable equal to one if market i is in Niger and zero if market i 14 Gorodnichenko and Tesar (2009) control for country-specific variability by including indicator variables for country-specific market pairs and find vastly different estimates of the US-Canada border effect. 15 We also conduct analyses for markets located far away from the border as a robustness check, in which cases the variation in market conditions would most likely account for most variations in the price. We find zero border effects in those cases.
15
is in Nigeria; (� denotes the algebraic distance16 of market i north of the Niger-
Nigeria border in kilometers (positive for markets in Niger and negative for
markets in Nigeria); ��� is a vector of time-varying variables for market i at time t,
which includes access to mobile phone coverage and experiencing drought; ��
includes the latitude and the longitude of market i;17 +� denotes the monthly time
effect; and �� is the mean zero disturbance term.
In the regression model described by equation (2), the border effect is
represented by #�, which captures the percent change in price implied by relocating
a market just across the border.18 To assess the robustness of our border effect
estimates, we consider markets located within different bandwidths (5 km, 20 km,
30 km and 50 km) of the Niger-Nigeria border, as well as higher-order polynomials
of the distance variable ((�).
In their main analysis, GGHL restrict the sample to markets within 500 km
of the U.S.-Canada border, although they find very similar results for bandwidths of
100 km or 350 km. Following their approach, we aim to isolate a direct effect of the
presence of the border separately from the effect of transaction costs that may vary
with the distance of transporting products across the border, as captured by the
inclusion of the distance variable. This is particularly important in our study since
markets in this area of West Africa have existed for decades, and few of them are
16 Here, we use exactly the same term — algebraic distance — as Gopinath et al. (2011). The algebraic distance can be positive or negative. 17 In this way we attempt to control for location-specific time-invariant unobservable characteristics of market i. 18 This approach is equivalent to using a uniform kernel regression (Imbens and Lemieux 2008) for an RD design.
16
located arbitrarily close to the border. Thus, this limits our ability to employ the
standard graphical analysis associated with the RD design.
5. The Niger-Nigeria Border Effect
In this section we present the estimates from our two methods of analysis,
with the market-pair results presented in Section 5.1 and the single-market results
presented in Section 5.2. While both methods attempt to estimate the price effect of
the international border, the market-pair analysis tends to deliver a smaller
estimate, for reasons we explain in Section 5.3. We also discuss the robustness of
our results in Section 5.4.
5.1. Market-Pair Analysis
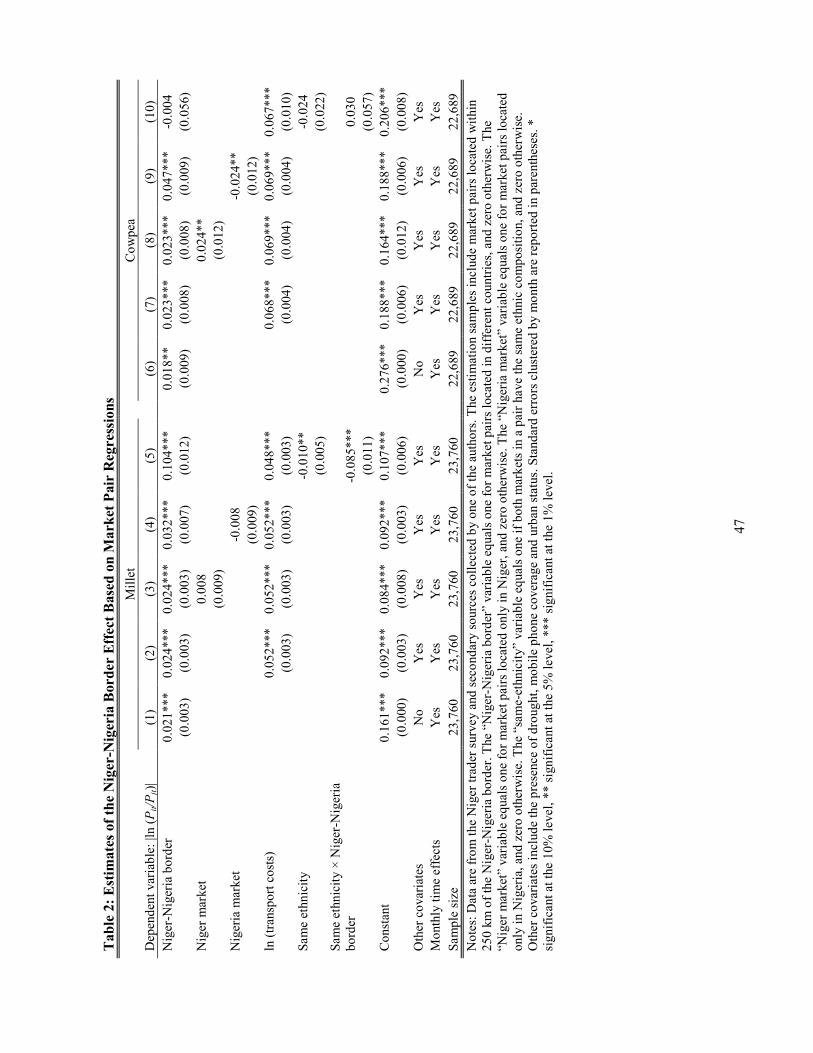
The market-pair analyses of the effects of the Niger-Nigeria border on the
price ratios for millet (columns 1–5) and cowpeas (columns 6–10) are presented in
Table 2. The sample includes market pairs that are within 250 km of each other,
implying that no market in the sample is more than 250 km away from the
international border.19
Columns (1) and (6) present the estimates of the border effect on the price
ratio for millet and cowpea, respectively. For both commodities, the difference in
the logarithm of prices is equal to about 2 percent and is statistically significant at
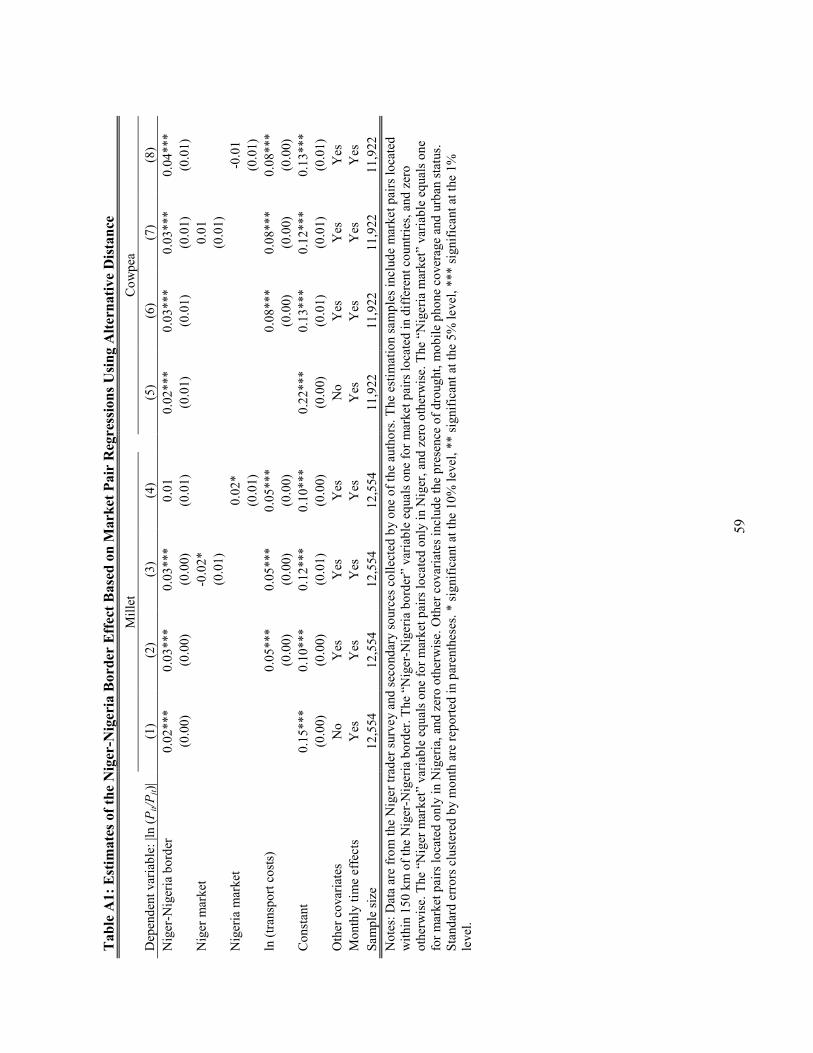
19 The border effect estimates are robust to an analysis in which we only use market pairs located within 150 km of the Niger-Nigeria border, even though this cuts the sample by almost half. The results are reported in Table A1.
17
conventional levels. The estimated border effect increases slightly when other
covariates are included in the regression, such as the log of transport costs, drought,
urban status and mobile phone coverage (columns 2 and 7). We take into account
the possibility that these estimated differences reflect differences in price
variability within countries, rather than a border effect, by including country fixed
effects for market pairs that lie within Niger (columns 3 and 8) or Nigeria (columns
4 and 9). The stability of the border coefficient estimates across these two
alternatives (comparing the results in these columns to those in columns 2 and 7,
respectively) contrasts starkly with the large differences found by Gorodnichenko
and Tesar (2009) in their analysis of price differentials between the United States
and Canada.20
Columns (5) and (10) represent our first examination of the potential role of
ethnicity in inter-market trade. The estimations in these columns augment the
specification of columns (2) and (7) by including two additional binary indicators;
“same ethnicity,” which equals one if a majority of traders located in both markets
of a market pair are from the same ethnic group, and the interaction between the
“same ethnicity” variable and the “Niger-Nigeria border” variable. In this
specification, the effect of the Niger-Nigeria border on the difference (in absolute
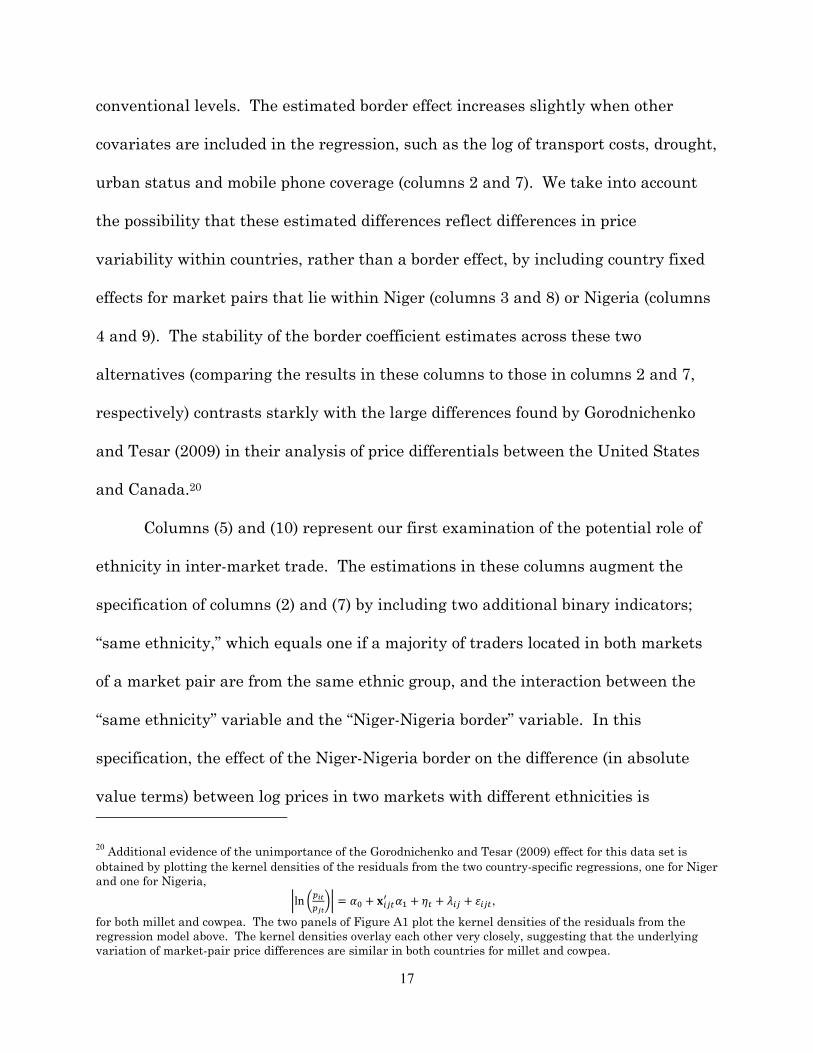
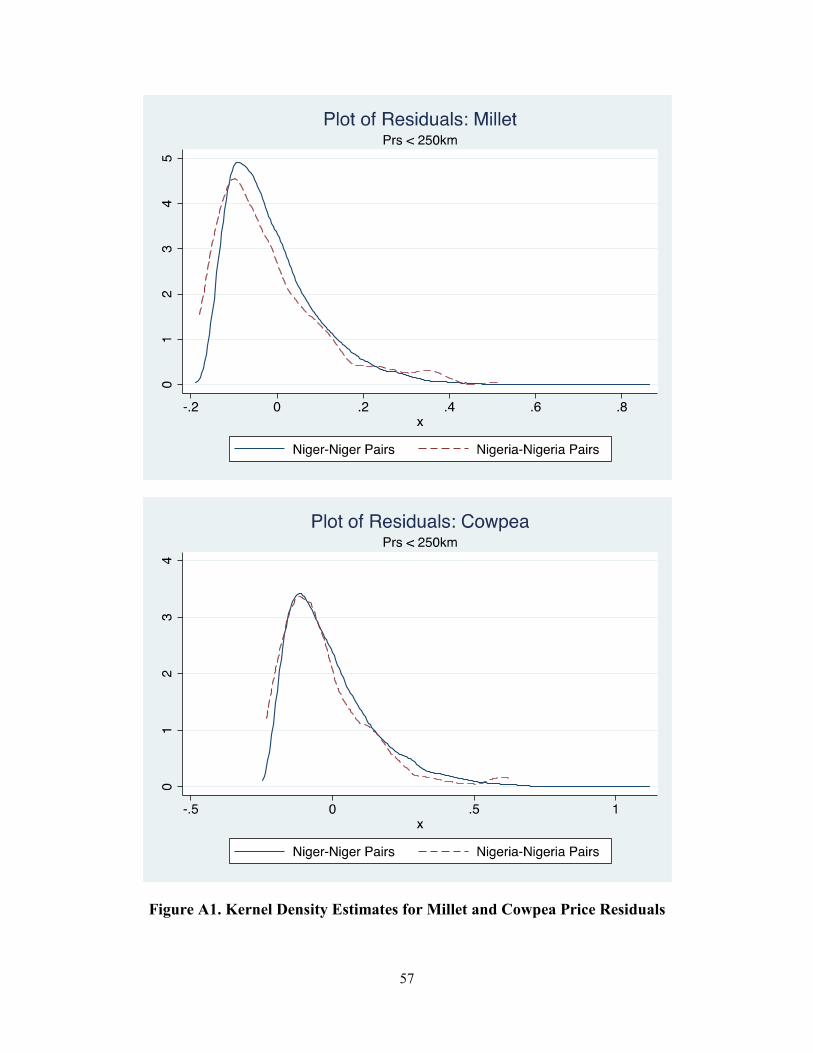
value terms) between log prices in two markets with different ethnicities is 20 Additional evidence of the unimportance of the Gorodnichenko and Tesar (2009) effect for this data set is obtained by plotting the kernel densities of the residuals from the two country-specific regressions, one for Niger and one for Nigeria,
��� �������� �� ����� �� �� ��� ���,
for both millet and cowpea. The two panels of Figure A1 plot the kernel densities of the residuals from the regression model above. The kernel densities overlay each other very closely, suggesting that the underlying variation of market-pair price differences are similar in both countries for millet and cowpea.
18
represented by the coefficient on the “Niger-Nigeria border” variable. The
estimated border effect for two markets with a common ethnicity is the sum of the
coefficient on the border and the coefficient on the interaction term. The estimated
effect of having the same ethnicity on the prices in two markets in the same country
is the coefficient on the “same ethnicity” variable.
The results presented in column (5) shows that the price ratio for millet, for a
within-country market pair with the same ethnicity, is about one percent lower
than the price ratio for a within-country market pair with different ethnicities,
conditional on other covariates. The quantitative effect is similar for cowpeas but
not statistically significant (column 10). For cross-border markets, having a
common ethnicity lowers the price ratio by about 8 percent for millet (column 5),
with a statistically significant effect. There is no effect of common ethnicity on
cross-border price ratios for cowpea (column 10). Overall, these results suggest that
the ethnic composition of a market pair may play a role in determining transaction
costs between the two markets, although primarily for millet. We further explore
the role of ethnicity in Section 6.
5.2. Single-Market Analysis
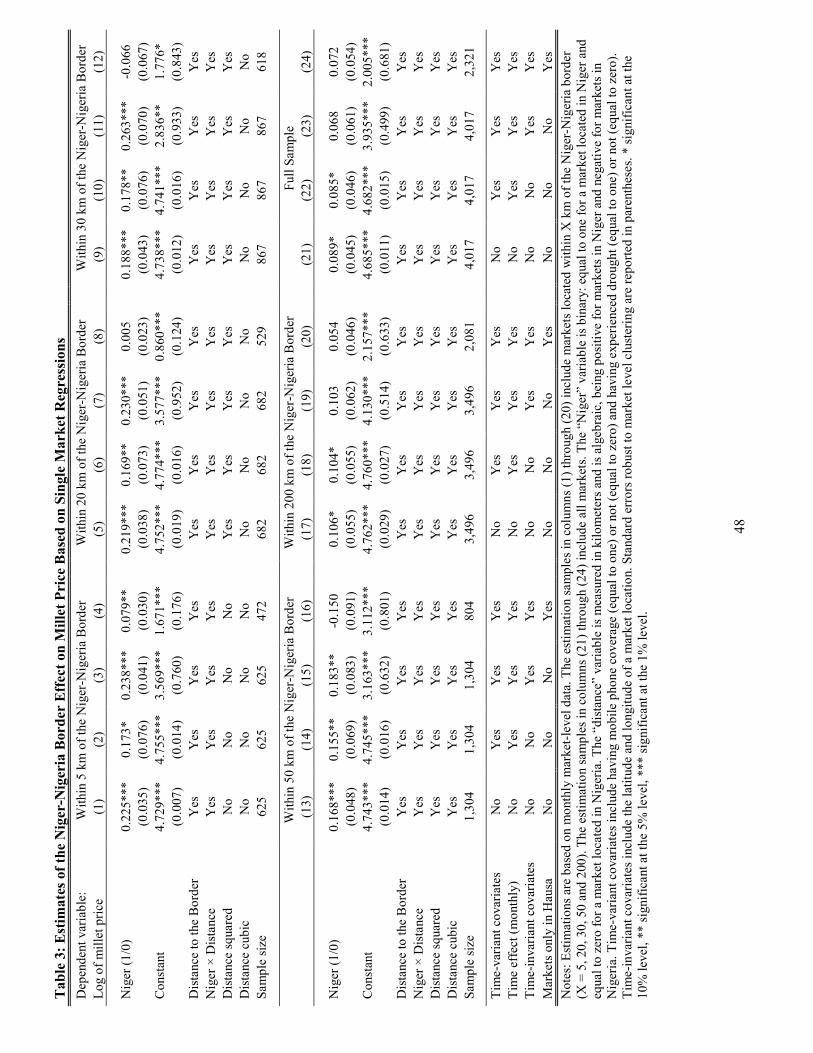
The results of the single-market analysis of the effects of the international
border are reported in Table 3. A statistically significant coefficient on the binary
variable “Niger” indicates a percent change in prices at the border between
19
proximate markets in Niger and Nigeria, conditional on the covariates included in
the regression model.
Based on a bandwidth of 5 km, the estimates in Table 3 show that millet
prices increase by 22.5 percent when crossing from Nigeria to Niger (column 1).
These findings are robust to the inclusion of other covariates that could affect price
changes, including monthly time effects, drought and mobile phone coverage
(column 2). It is also robust to the inclusion of market fixed effects, as captured by
the geographic location of the market (column 3). The results are also robust to
alternative bandwidth specifications (20 km, 30 km, 50 km and 200 km). As
expected, the estimated magnitude of the border effect decreases and becomes less
statistically significant as the bandwidth increases. This is due to the fact that a
greater proportion of the price variation of millet can be explained by the differences
between Niger and Nigeria rather than by the border per se.
The border effect for the price of millet is much smaller between markets of
common ethnicity than between markets with different ethnicities. This is shown
by the estimates in the last column of each panel, which restrict the sample to
markets in the extensive Hausa region that spans the international border. For
example, the results in column (4) suggest that prices increase by 7.9 percent when
crossing the Niger-Nigeria border within the Hausa region, by comparison with 23.8
percent when comparing cross-border markets that do or do not share the same
ethnicity. The impact of ethnicity in mitigating the border effect appears to be even
more marked when we increase the bandwidth.
20
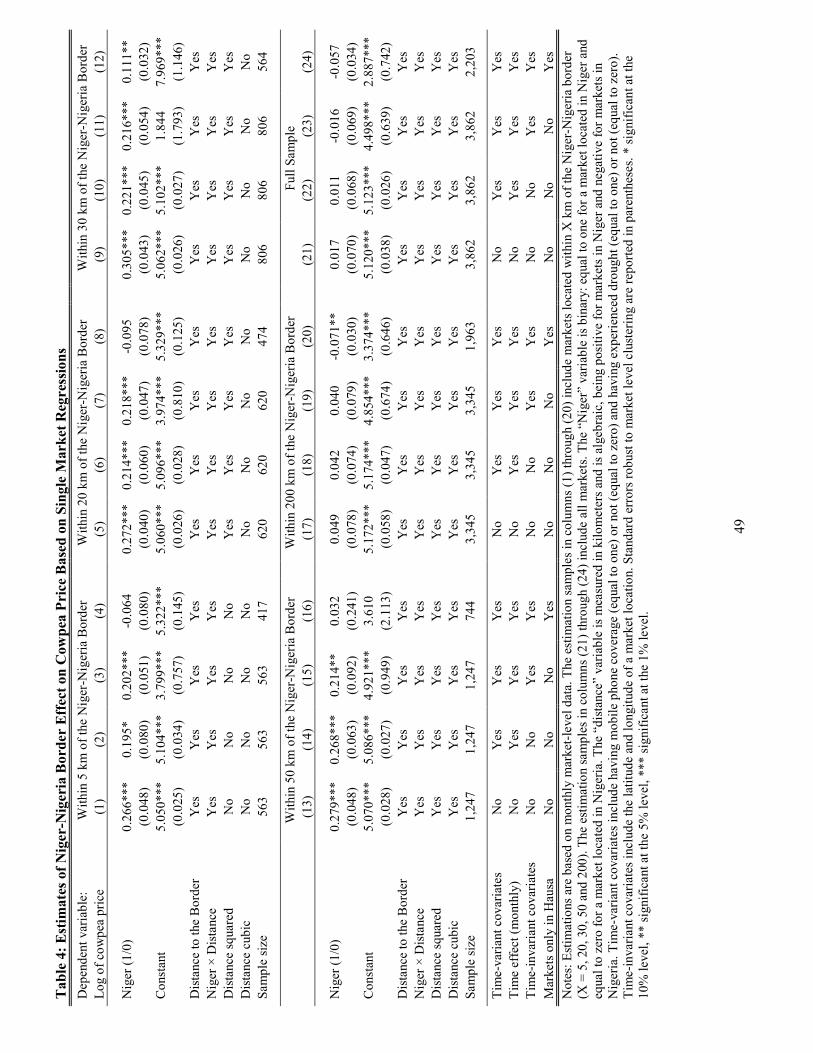
Table 4 repeats this analysis for cowpea prices. The results are consistent
with those for millet. Cowpea prices change by about 27 percent at the border
(column 1). This magnitude decreases once time-variant covariates and monthly
time effects are included (column 2), but remains robust to the inclusion of time-
invariant covariates, such as the geographic location of the market (column 3). As
in the case of millet, common ethnicity mitigates the border effect (column 4): this
effect is estimated at 20.2 percent for cross-border markets, as compared to close to
zero (and not statistically significant) for those sharing a common ethnicity.
5.3. Comparing the Two Sets of Estimates
The magnitude of border effect varies significantly according to the
estimation strategy, with the market-pair estimates significantly smaller than the
single-market analysis. In their study of the U.S.-Canada border effect, GGHL
(2011) find a similar pattern: Using a market-pair analysis, they find that the
median price gap is 14.6 percent for cross-border pairs, as compared to a “median
discontinuous change of 24 percent at the (U.S.-Canada) border” using a single-
market analysis (GGHL 2011). Why are the magnitudes of the border effect so
different?
There are three primary reasons for different magnitudes of the border effect
between the market-pair and single-market analysis. The first relates to the
difference in the definition of the dependent variable. While the single-market
approach focuses on the price gap between two markets immediately next to the
21
border (such that the border dummy variable captures the change in price levels of
markets that are relocated immediately across the border), the market-pair
analyses control for the distance between two markets of a pair, either or both of
which could be far away from the border. In this specification, the “border effect” is
therefore inferred based on the excessive price gap of cross-border pairs relative to
the price gap of within-country pairs. As a result, the border effect obtained from
market-pair analyses is an average effect of markets located both close to and far
away from the border. This average effect could be smaller than the effect for two
markets local to the border, as heterogeneities in the market conditions of a market
pair could explain a larger portion of the price gap between the two markets as they
are situated father away from the border.
Second, while both the market-pair and the single-market analyses estimate
the border effect, the underlying population of markets is different. The market-
pair analysis is aimed at the average border effect for all markets, controlling for
inter-market distances, whereas the single-market analysis is aimed at the local
border effect for those markets located immediately next to the border.
A final difference between the two specifications is the interpretation of the
border effect. While the coefficient in the single-market model reflects the full
unobservable transactions costs associated with crossing the border, the coefficient
in the market-pair model reflects the difference in cross-border trade as compared
to within-country trade. In other words, the single-market analysis captures
absolute cross-border costs, rather than cross-border costs relative to within-country
22
costs. For this reason, the single-market analysis coefficient will be larger unless
the unobservable transactions costs associated with within-country trade are close
to zero.
5.4. Robustness of the Estimates
There are several potential threats to the validity of the above findings. First,
observable or unobservable determinants of the prices might systematically differ
on either side of the border. In particular, the single-market analysis assumes that
location relative to the international border is the only determinant of prices that
changes discontinuously as one moves across the border. While it is impossible to
directly test for such an identification assumption, we can test whether the
observed market-level characteristics are similar within a particular bandwidth.
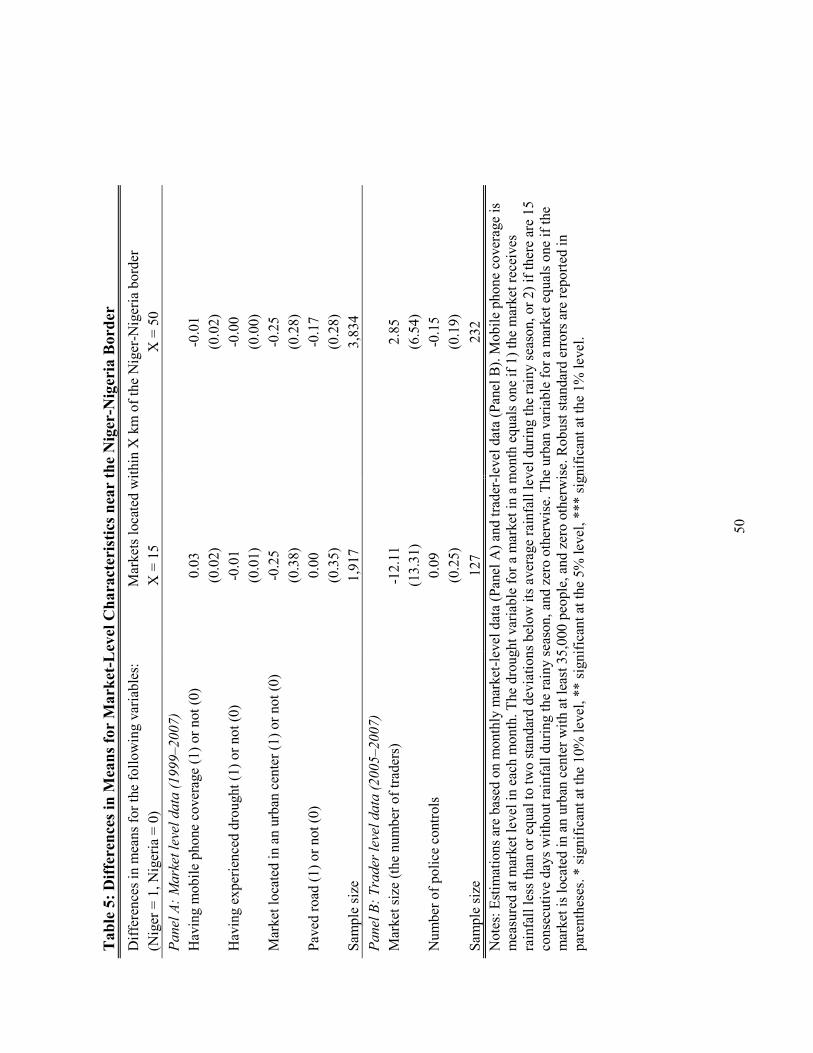
Table 5 tests for this more formally by comparing the equality of means for
characteristics that could affect price levels on either side of the border. Using both
the market panel and trader-level datasets, the observable characteristics are
balanced on either side of the Niger-Nigeria border. These results suggest that the
border effect is not serving as a proxy for cross-border differences in observable
characteristics.
Second, much of the literature in this field has shown that price gaps are
highly correlated with exchange rates, and has used exchange rates as an
exogenous shock to measure the speed and extent of pass-through. Thus, exchange
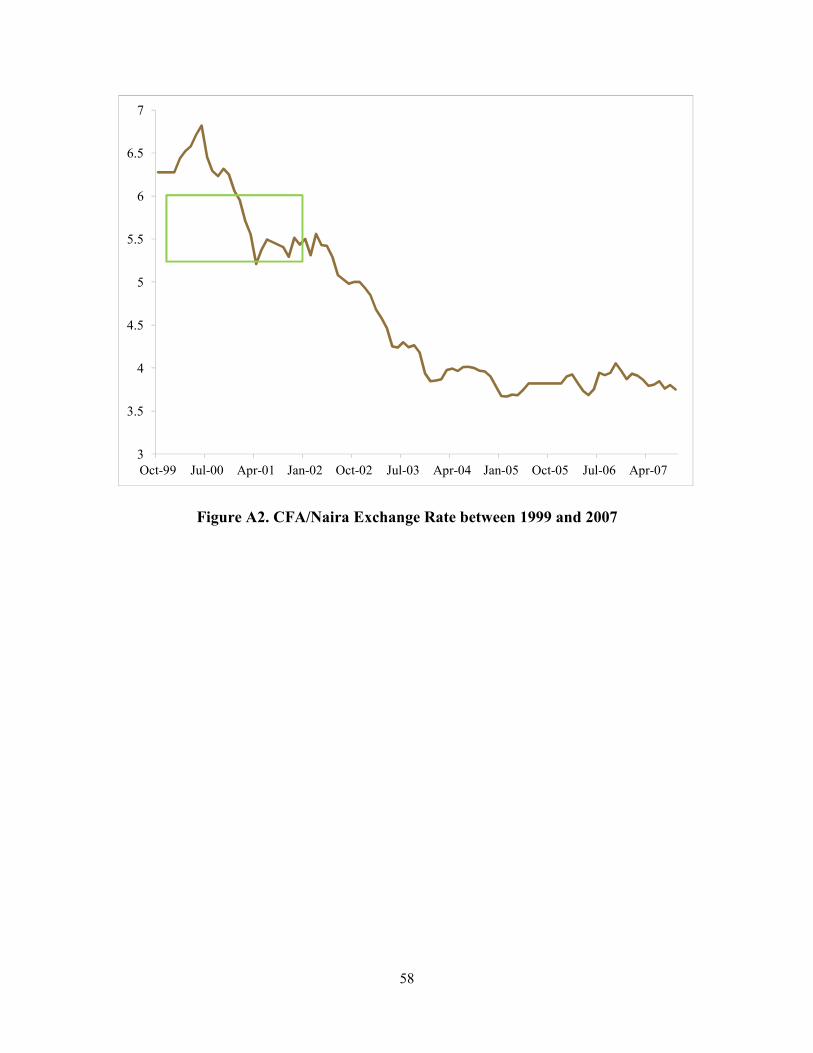
rate fluctuations could be responsible for the observed border effect. Figure A2
23
shows the monthly CFA/Naira exchange rate from October 1999 to September 2007.
There was a significant appreciation of the CFA (relative to the Naira) between
2000 and 2001, and again between 2002 and 2003. As all of the Nigerian price data
were converted into CFA by the AMIS, we do not explicitly control for exchange rate
fluctuations in the regression. Therefore, as a robustness check, we estimate the
border effect using only data from the 2003 to 2007, the period of time during which
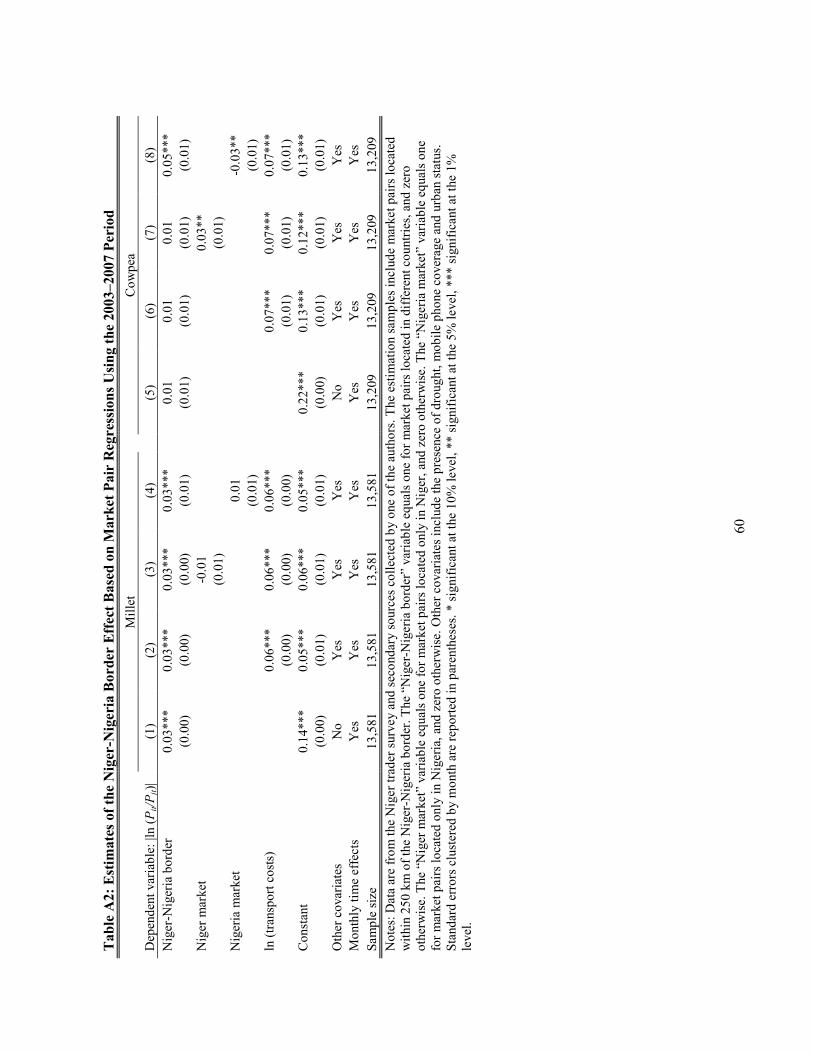
there was less exchange rate volatility.21 The results for the market-pair analyses
are reported in Table A2. Overall, the market-pair estimates for the international
border effect for millet remain very stable at 3 percent, but the Niger-Nigeria border
effect drops to 1 percent for cowpeas, and is no longer statistically significant at
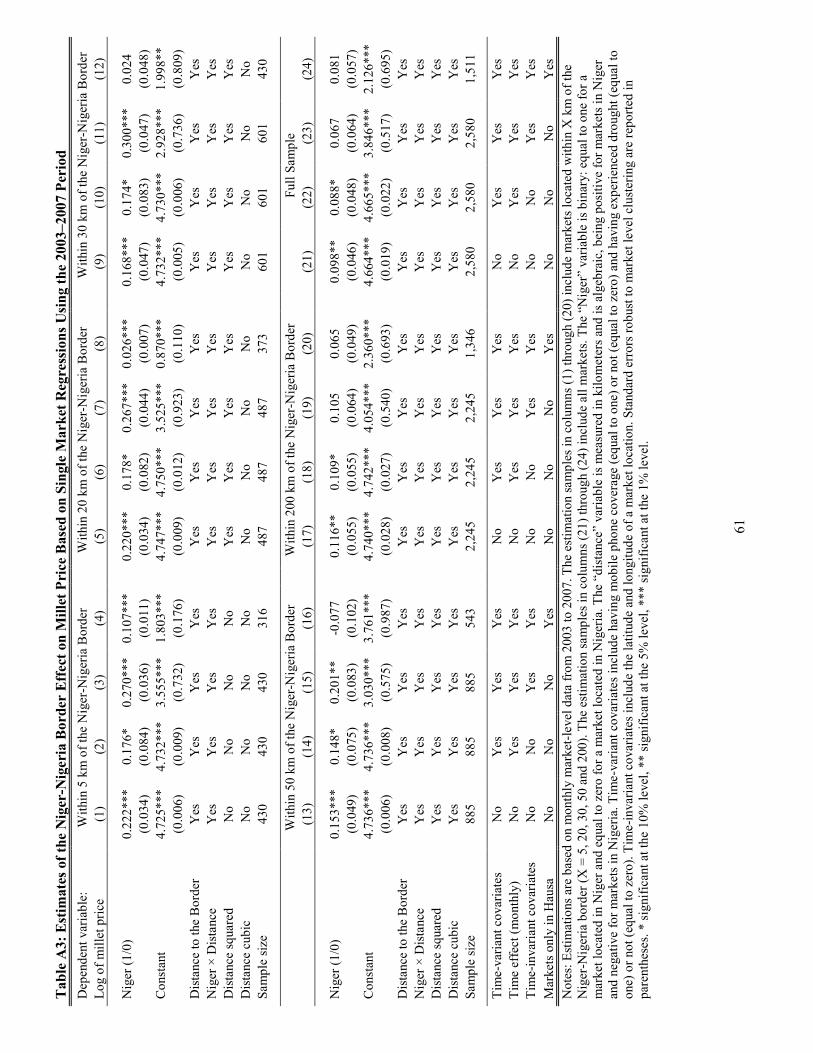
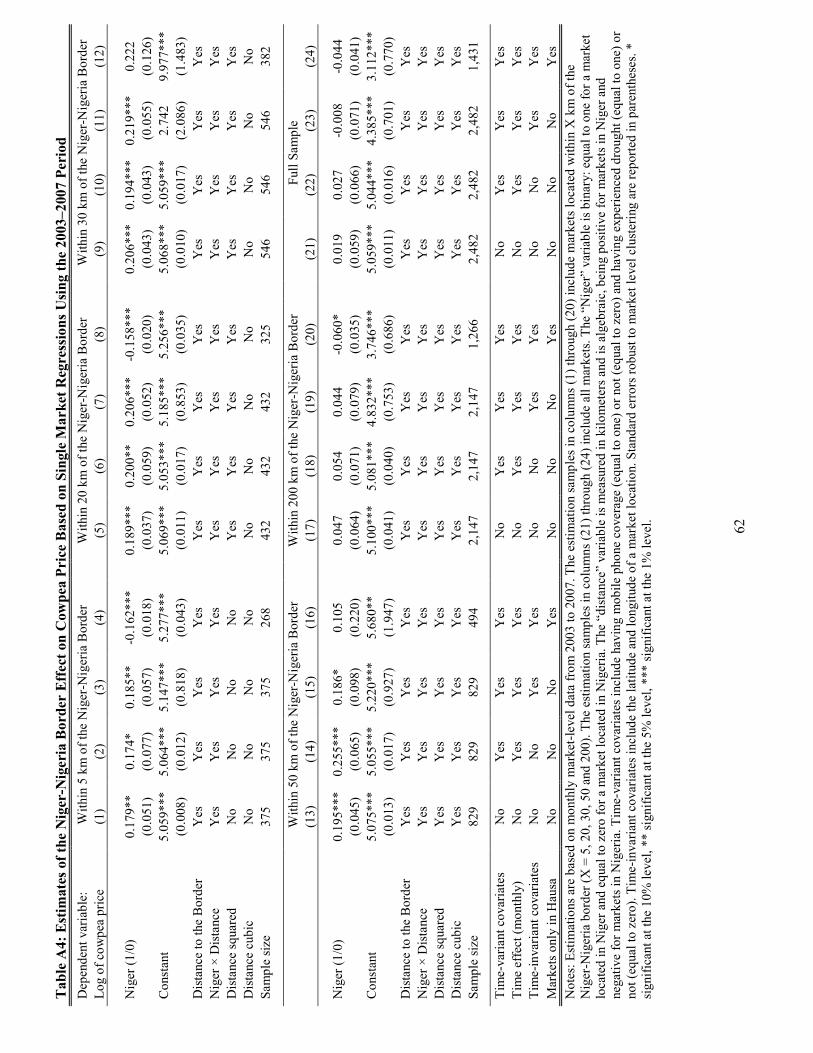
conventional levels. In contrast, results (shown in Tables A3 and A4) from the
single-market analyses using only the 2003–2007 period are very similar to the ones
based on 1999–2007.
An additional threat to the validity of our previous findings is the
heterogeneity of the goods and services across cross-border markets. If millet and
cowpea are not truly homogeneous products, then the border effect could simply be
a proxy for differences in physical attributes. Similarly, traders on either side of the
border could provide different services (such as cleaning, bagging or threshing) that
are included in the price, which would then appear as a border effect.22
21 Results for the market-pair analysis using only the 2003–2007 sample are presented in Table A2, and the results based on this period for the single-market analysis are presented in Tables A3 and A4. 22 For example, Broda, Leibtag and Weinstein (2009) show that prices can vary within cities based upon their location and associated amenities.
24
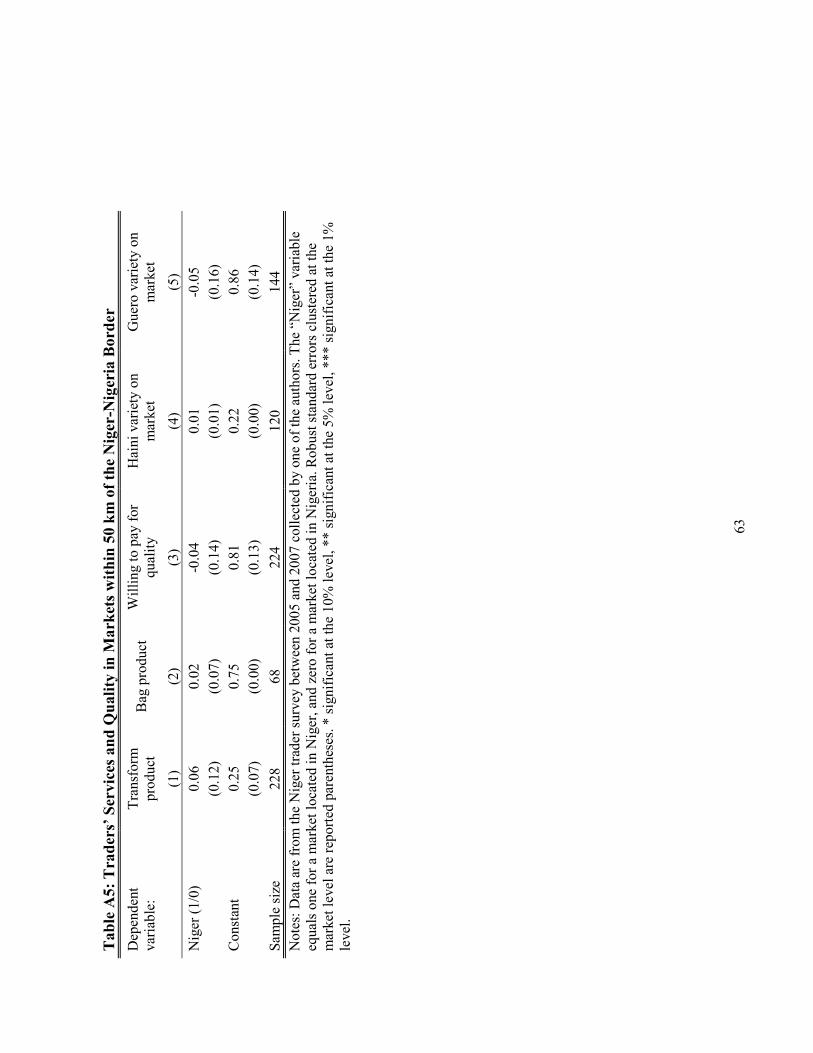
While no agricultural commodity can ever be completely homogeneous in
terms of size, quality, color and smoothness, Table A5 provides some evidence that
the physical attributes of millet, as well as the services provided, are similar on
either sides of the international border. Using observations from markets located
within 50 km of the Niger-Nigeria border, the results suggest that there are not
systematic differences in services, willingness to pay for quality, or the “high-
quality” varieties available on these markets. Overall, only 25 percent of traders
provide any type of service, including bagging, cleaning, threshing or drying
(column 1). Of these, the primary service provided is bagging; there is not a
statistically significant difference in these services provided on either side of the
border (column 2). 81 percent of traders stated that they were willing to pay for
higher quality, with a slightly higher percentage in markets in northern Nigeria as
compared with those in Niger (column 3). While traders in Nigeria stated that they
were more likely to pay for “quality” as compared with traders in Niger, there is not
a statistically significant difference at conventional levels. In addition, the
availability of higher-quality millet varieties (guero and haini) was similar in both
Nigerien and Nigerian border markets. Overall, these results suggest no systematic
differences in trader’s services and product quality across cross-border markets in
our sample.
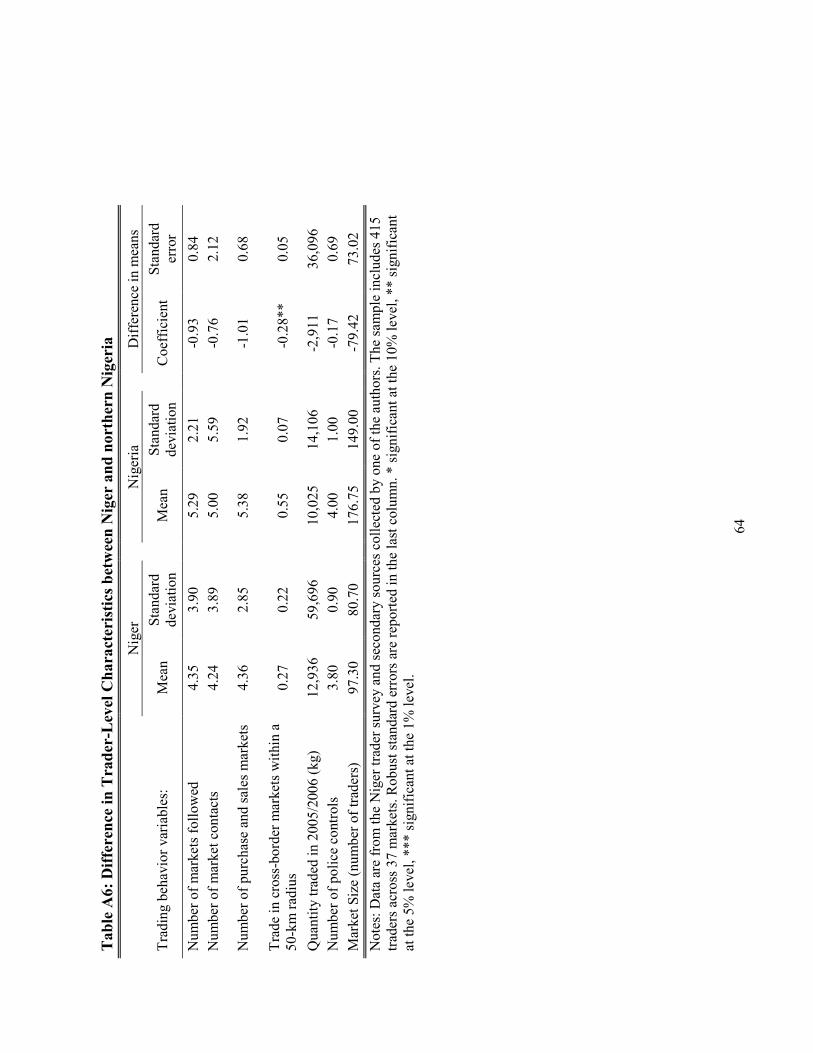
A final threat to the validity of our findings is the absence of trade between
cross-border markets. Although we do not have time series data on trade volumes,
we provide evidence that traders did in fact engage in trade on either side of the
25
border from our trader-level data (Table A6). Between 2005 and 2007, 27 percent of
traders in Nigerien markets located near the border bought and sold millet and
cowpea in northern Nigeria, and 55 percent of Nigerian traders bought and sold
agricultural products from Nigerien markets. There is not a statistically significant
difference in the average volume bought and sold by traders operating in Niger and
northern Nigeria during this time period. This suggests that price effects are not
reflecting an absence of trade across the Niger-Nigeria border.
6. The Internal Border Effect
The market-pair and single-market regression results in Section 5 suggest
that a common ethnicity can diminish the international border effect, primarily for
millet. Yet can different ethnic regions create an internal de facto border within a
country? Niger offers a good setting for addressing this type of question since there
is a strong geographic separation among ethnic groups. While this is a feature of
many countries within sub-Saharan Africa, we know of no other studies on the
effect of spatial ethnic diversity on intra-national trade.23
We begin this section by first defining the ethnic border and its measurement,
before estimating the impact of internal ethnic borders on prices within Niger. We
then offer some potential explanations for the internal ethnic-border effect.
23 Michalopoulos (forthcoming) argues that ethnic diversity within a country is driven by differences in land quality, particularly between herders and farmers, as well as state institutions and history (particularly the colonial period). While these factors might be correlated with overall geographic diversity of certain ethnic groups (for example, Touareg pastoralists in the North of Niger and Mali as compared with Hausa and Zarma agriculturalists in the South), they do not appear to explain the West-East differences in ethnic group composition.
26
6.1. Regression Analysis of the Internal Border
We use both primary and secondary data on the ethnic composition of
villages and markets in Niger to identify different ethnic regions and a de facto
ethnic border. Using the census and trader-level data, we first calculated the ethnic
composition of each market, identifying those markets with both low and high
degrees of ethnic diversity. Based upon these calculations, we collected additional
primary data in October 2011 from villages and markets located in the “high ethnic
diversity” region, but located primarily in the Hausa and Zarma zones of Niger.24
These data include information on the ethnic composition of residents within each
village and market, as well as the ethnic composition in 1960 (the time of Nigerien
independence). Using these three datasets, we were able to identify the ethnic
composition of markets and villages within the geographic area of Niger where the
villages move from exclusively Zarma to exclusively Hausa.
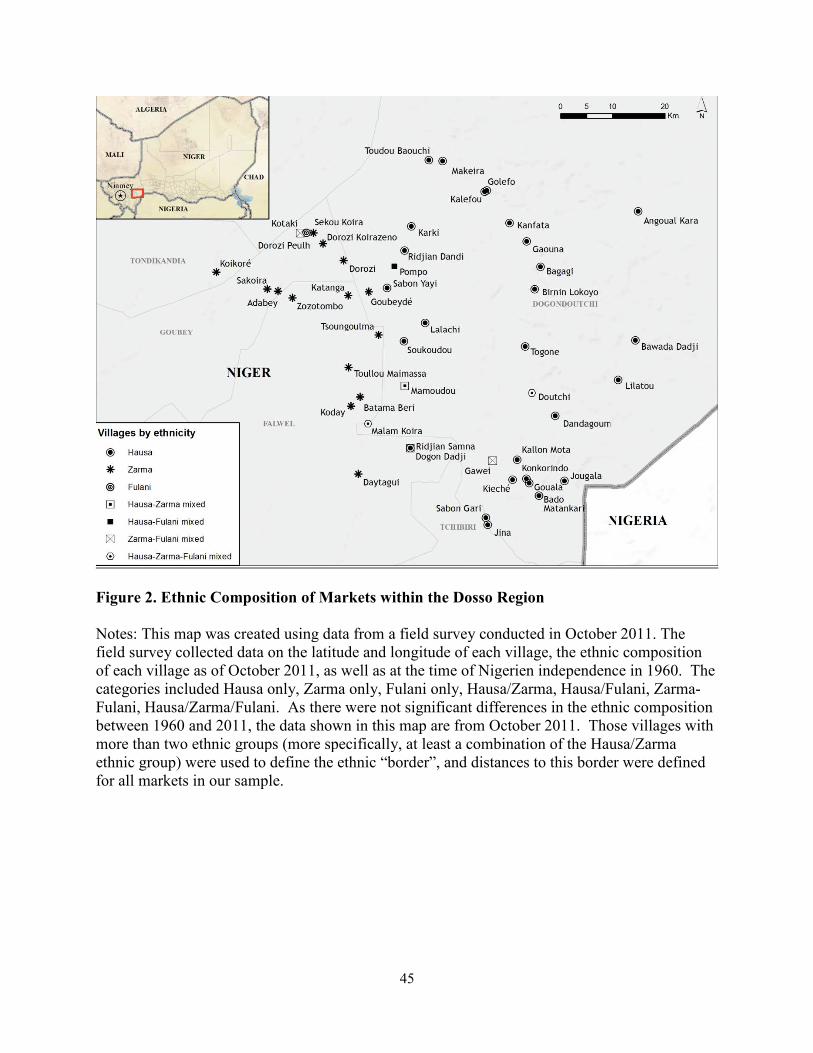
The results from this exercise are presented in Figure 2. All of the
observations are in the Dosso region. The set of villages in the western part of this
region, from the western most village of Koikore to the villages of Goubeydé,
Tsoungoulma, Batama Beri and Daytagui, are all solely Zarma (with the exception
of one mixed village in the north). There is a mixed composition of several villages
directly east of this region, and these villages include either Hausa and Zarma
24 While there are other internal ethnic borders within Niger, primarily North-South and between the Hausa and Kanuri to the far east, the highest density of markets within our sample occurs within the Hausa-Zarma zone.
27
residents or Hausa, Zarma and Fulani residents (the villages of Mamadou, Malam
Koira, Dogon Dadji and Gaweye). Further east one sees a switch to solely Hausa
villages.
Using these data, we were able to identify the internal ethnic border related
to these two groups: namely, a set of markets with a high degree of ethnic diversity
that also separate two geographic regions with a low degree of ethnic diversity.
Defining those markets and villages with diverse ethnic composition as the “ethnic
border,” we calculated the Euclidean distance between the markets in our sample
and this border.25
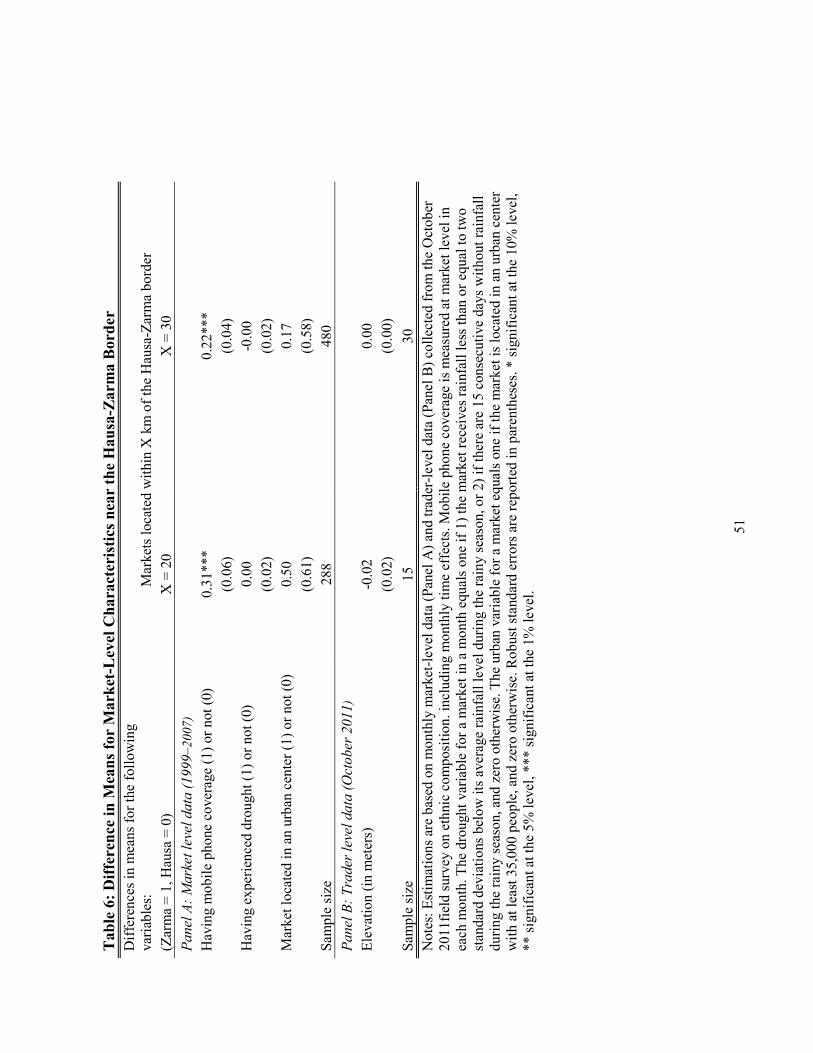
Table 6 tests for the equality of means of observable characteristics between
markets located on either side of the Hausa-Zarma border. We do not find a
statistically significant difference for either urban status or the prevalence of
drought, two of the most important determinants of supply and demand in these
markets. Nor is there a difference in a market’s elevation, a characteristic used by
Michalopoulos (forthcoming) as a determinant of ethnic diversity. However,
markets in the Zarma region were more likely to have had mobile phone coverage
between 1999 and 2007, as mobile phone coverage arrived relatively earlier in the
Zarma markets. We therefore control for mobile phone coverage in our regression
analysis.
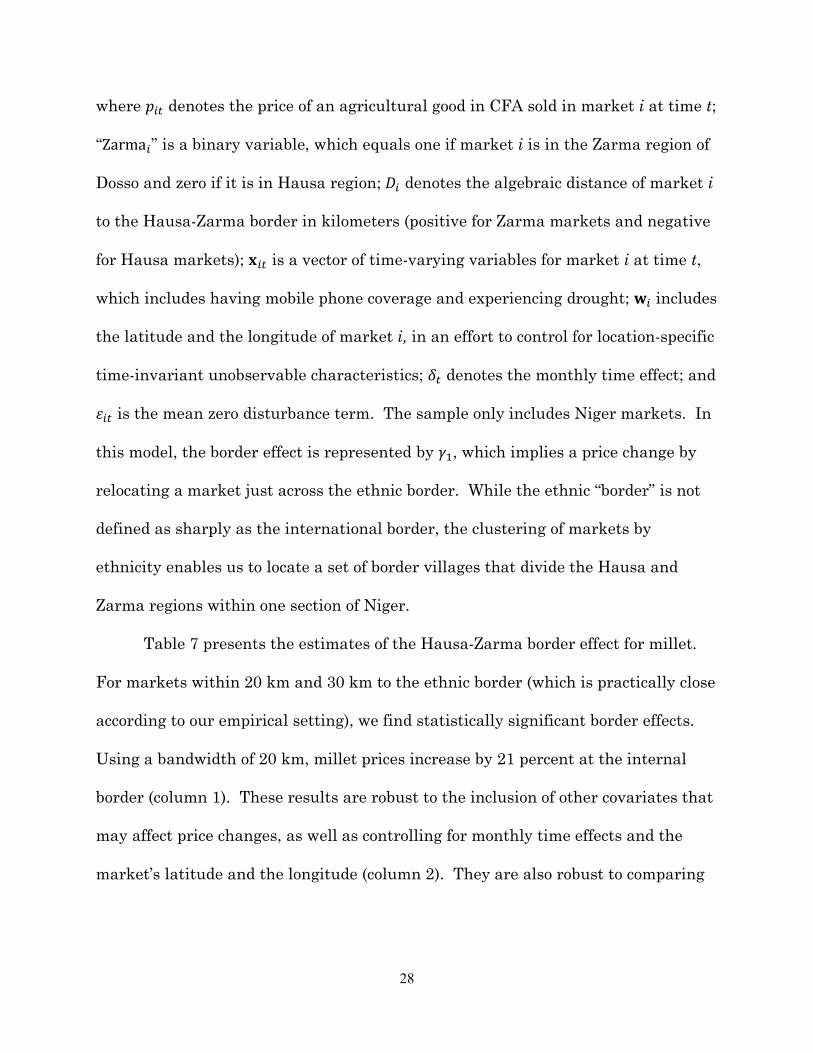
We estimate the ethnic border effect with the single-market regression:
25 While we rely on all of the villages in the sub-region to locate the Hausa-Zarma border, our empirical analysis is restricted to the subset for which we have price data.
28
where "�� denotes the price of an agricultural good in CFA sold in market i at time t;
“,-�.-�” is a binary variable, which equals one if market i is in the Zarma region of
Dosso and zero if it is in Hausa region; (� denotes the algebraic distance of market i
to the Hausa-Zarma border in kilometers (positive for Zarma markets and negative
for Hausa markets); ��� is a vector of time-varying variables for market i at time t,
which includes having mobile phone coverage and experiencing drought; �� includes
the latitude and the longitude of market i, in an effort to control for location-specific
time-invariant unobservable characteristics; �� denotes the monthly time effect; and
�� is the mean zero disturbance term. The sample only includes Niger markets. In
this model, the border effect is represented by +�, which implies a price change by
relocating a market just across the ethnic border. While the ethnic “border” is not
defined as sharply as the international border, the clustering of markets by
ethnicity enables us to locate a set of border villages that divide the Hausa and
Zarma regions within one section of Niger.
Table 7 presents the estimates of the Hausa-Zarma border effect for millet.
For markets within 20 km and 30 km to the ethnic border (which is practically close
according to our empirical setting), we find statistically significant border effects.
Using a bandwidth of 20 km, millet prices increase by 21 percent at the internal
border (column 1). These results are robust to the inclusion of other covariates that
may affect price changes, as well as controlling for monthly time effects and the
market’s latitude and the longitude (column 2). They are also robust to comparing
29
markets located within a 30-km radius on either side of the border, suggesting that
prices change by 26 percent at the internal border.
Because there are few markets located very close to the ethnic border, using
markets located within 20 km or 30 km to the border could potentially bias the
border effect estimation. For markets located father away from the border, the
border indicator can become an indicator variable for ethnicity, representing an
ethnic difference (such as difference in preferences) rather than the difference in
transaction costs incurred at the ethnic border. For example, if millet is preferred
and highly demanded in Zarma markets, but not in Hausa markets, then we would
expect to find a significant price difference between these two regions even with a
very wide bandwidth, thereby representing an ethnic difference. In contrast, if
there is no ethnic difference, but additional transaction costs incurred for cross-
border trade, then we would expect the price difference to be present near the
border, but absent for markets located far away from the border.
To implement this check, we select markets located more than 50 or 100 km
away from the ethnic border and re-estimate equation (3). If we find a statistically
significant border effect with these samples, then our previous results in columns
(1)–(4) could have alternative explanations. Our results in columns (5)–(8) confirm
no border effect. Furthermore, we re-estimate equation (3) using the full sample,
and still find no effect. Overall, our check suggests that the choice of markets near
the ethnic border (that is, the bandwidth) is not a source of bias, and the difference
30
in ethnicity seems to create a substantial transaction cost for millet precisely at the
ethnic border.
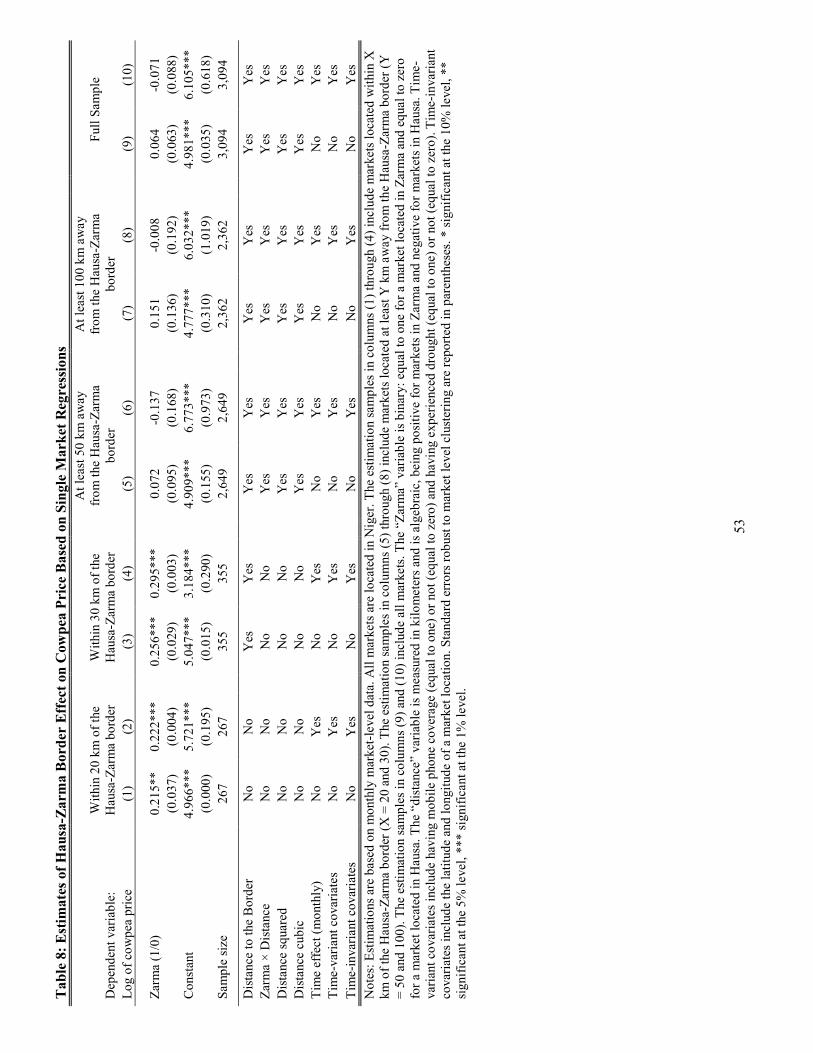
We repeat the same analyses for cowpea and report the results in Table 8.26
The results are similar to the ones for millet. Cowpea prices change by 22 percent
at the internal border (column 1), a result that is robust to the inclusion of both
time-invariant and time-variant covariates and monthly time effects (column 2).
The effect is slightly higher for markets located within 30 km of the internal border
(columns 3 and 4), but there is no effect for markets located at least 50 km or 100
km away from the ethnic border, or for the full sample.
As the ethnic border is not as clearly defined as an international border, this
could lead to measurement errors in our “distance-to-border” variable. Nonetheless,
two characteristics of the estimates presented in Tables 7 and 8 suggest that those
measurement errors could be minor. First, our estimates are similar with and
without controls for the latitude and longitude of each market.27 Second, our
estimates are similar whether we consider markets within 20 km or 30 km of the
border.28
The magnitude of the price effects of the internal ethnic border and the
international border are quite similar. Thus, the border costs between the Hausa
and Zarma regions of Niger appear to be at least as great as those imposed by the
26 In the case of markets within 20 and 30 km in Table 8, we were unable to include the “distance” or its interaction with the “border” variable in the cowpea regressions due to numerical problems incurred in estimation, likely due to rather limited variation in this “distance” variable for cowpea markets. 27 For markets located on the same latitude or longitude, the measurement errors, likely to be common to these markets, would be differenced out with the latitude and longitude fixed effects. 28 The small number of markets that are very close to the border precludes us from presenting a graphical analysis of the discontinuity effect that is typically presented in studies of this type.
31
international border with Nigeria. The deadweight losses in foregone internal trade
may correspondingly be of a similar order of magnitude.
6.2. Potential Mechanisms of the Ethnic Border Effect
Our most striking result is that markets located close to the ethnic border
have large price discontinuities for homogeneous goods. Yet Table 6 suggests that
systematic differences in observed covariates for markets located close to this
border are not driving the price change at the border. What could then account for
the ethnic border effect? This section presents results from the trader-level survey
data collected during a subset of our sample period. The data suggest that ethnicity
is correlated with differences in language, the gender composition of traders, and
lending and borrowing behavior, each of which could create additional transaction
costs to trade across the ethnic border.
Language
If traders are unwilling or unable to communicate with each other, either due
to linguistic or socio-cultural factors, then language differences could potentially
increase the transaction costs associated with inter-ethnic trade. The statistics in
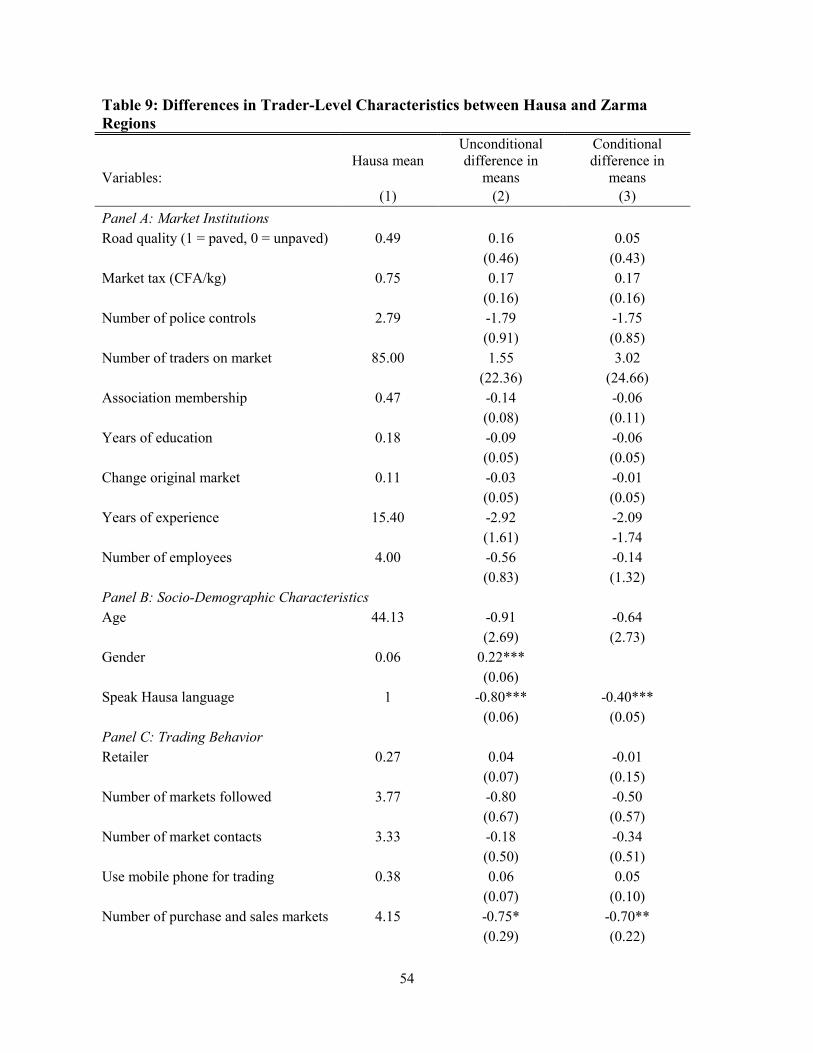
Table 9 (Panel B) show notable linguistic differences across the Hausa and Zarma
markets located close to the internal border; while all traders speak Hausa in
Hausa markets, fewer than 20 percent speak Hausa in Zarma markets (column 2).
These differences are more pronounced for the Zarma language, as fewer than 1
percent of traders in Hausa villages speak Zarma. These effects are partially
correlated with gender; once controlling for gender, the linguistic gap between the
32
two markets decreases. Even though price and quantity negotiations between
Hausa and Zarma traders can be conducted with a very low level of linguistic
proficiency, this still introduces a cost not present in intra-ethnic trade. But
perhaps more importantly, language differences might be correlated with
difficulties in restraining cheating with respect to quantity or quality, partly (but
not solely) because language differences reflect an absence of long-run personal
relationships and a lack of informal community-level enforcement mechanisms.
Language differences may therefore increase transactions costs indirectly, by
weakening these second-best enforcement mechanisms.
Gender
While women represent only 6 percent of traders on Hausa markets, they
comprise over 25 percent of traders in Zarma markets.29 This pattern conforms
with broader socio-cultural differences in the role of women between the two groups.
According to anthropological studies, Zarma women are able to travel outside of
their villages to visit family or engage in trade, a custom that is much less frequent
among Hausa women (Coles and Mack 1991). While we do not have direct evidence
on the degree — if any — of within-village market segmentation by gender, any
barrier to transactions between men and women will generate a difference in
29 This difference in the gender composition of traders becomes more pronounced when moving farther away from the ethnic border. Using the entire sample of Zarma and Hausa markets, only 3 percent of traders are women on Hausa markets, as compared with 31 percent of traders on Zarma markets.
33
average prices across the ethnic border. This restricts the attractiveness of Zarma
markets for these traders and may reduce the intensity of cross-market arbitrage.30
Credit networks
Agricultural trade involves both spatial and temporal arbitrage, as well as a
temporal “dissociation” between delivery and payment (Fafchamps 2000). Both
supplier and client credit play an important role in agricultural markets in Niger.
Since little of this credit is allocated via formal financial institutions, much of this
credit is allocated on the basis of trust (Fafchamps 2000).31 As in other countries
where firms and traders cannot assess the riskiness of suppliers and clients,
ethnically-based social networks in Niger play an important role in circulating
information about credit histories and risk preferences to potential trading
partners.
Traders often require financial services to pre-finance their purchases or to
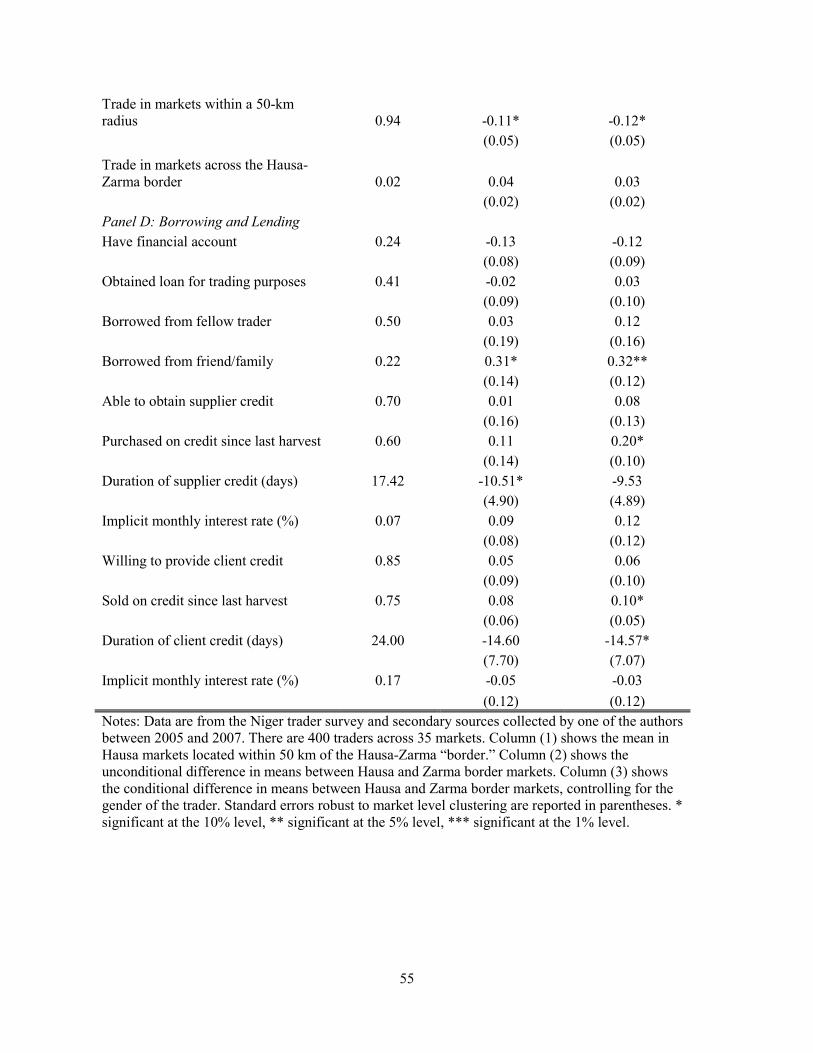
respond to fluctuating supply and demand. Table 9 shows that 40 percent of
traders obtained loans for their business operations, primarily from fellow traders
(50 percent) or friends and family members (22 percent) (Panel D). Whereas 60
percent of traders received supplier credit (with an implicit monthly interest rate of
7 percent), over 75 percent sold on credit (for a longer duration and higher interest
30 Even if Hausa traders are less willing to trade with women in Zarma markets, they could potentially conduct the trade with a male trader on the Zarma market, who could then purchase from the female trader. This scenario is unlikely, as a majority of female traders are retailers (as opposed to wholesalers or intermediaries). Thus, while female retailers might purchase from male wholesalers, it is unlikely that male wholesalers would purchase from female retailers. This system is somewhat different in the far east of the country, whereby wholesalers purchase from intermediaries during certain periods of the year. However, these intermediaries are exclusively male. The intermediated transaction described above would therefore be subject to additional transaction costs. 31 Fafchamps (2000) points out that an ethnic bias in the attribution of credit can be due to both statistical discrimination and network effects.
34
rate). The prevalence of the use of credit was similar in the Zarma and Hausa
markets, but the duration of supplier and client credit differed significantly; traders
in Zarma markets were only able to obtain supplier credit for one week (as
compared with 2.5 weeks in Hausa markets), and were only able to offer client
credit for 1.5 weeks (as compared with 3 weeks in Hausa markets). Most of these
results remain after controlling for gender (column 3). Overall, this suggests that
traders in Zarma markets have a shorter duration of borrowing and lending for
their commercial operations.
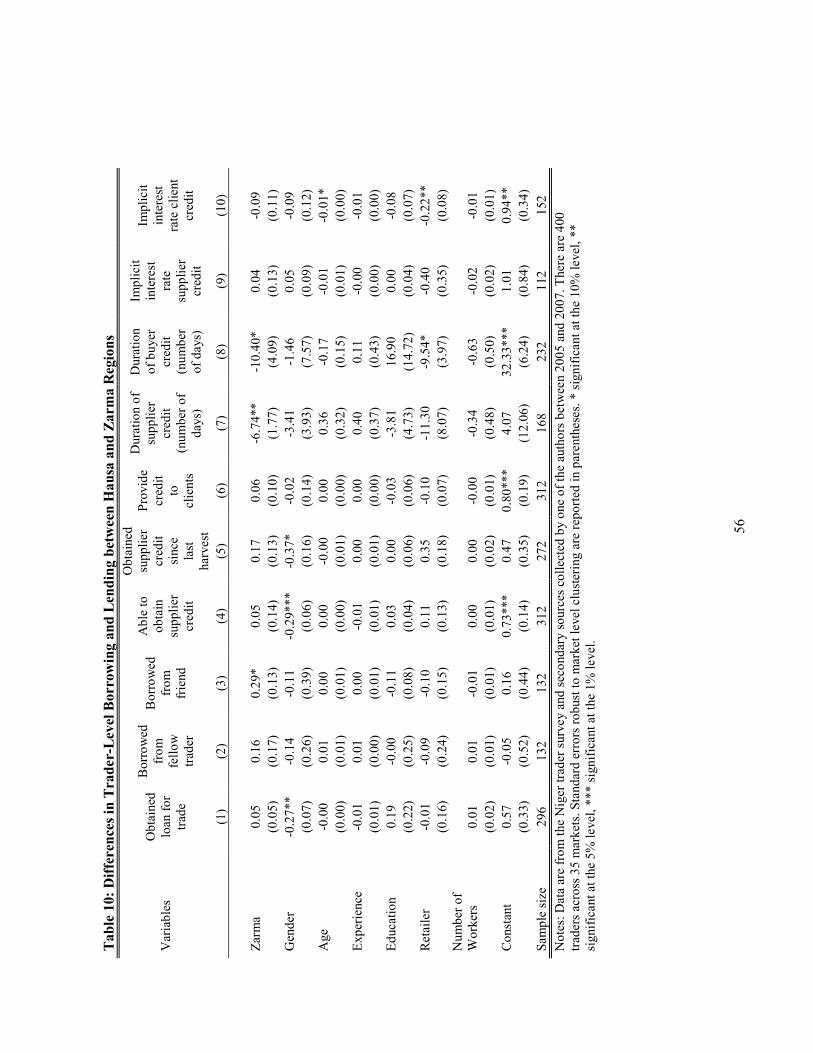
Table 10 analyzes this question in more detail, controlling for factors that
could simultaneously be correlated with living in a Zarma market and borrowing
and lending behavior. Overall, the patterns are consistent with those in Table 9;
once controlling for gender, age, experience and firm size, traders in Zarma markets
have a shorter duration of borrowing and lending for their commercial operations.
The difference in the duration of credit Hausa and Zarma markets suggests
that credit flows predominate within rather than between ethnic groups. The
difference in credit terms, in turn, suggests that this is driven at least in part by
barriers to inter-ethnic trade in credit — that is, to transactions costs that are
addressed more effectively within ethnic networks than between them. These
barriers prevent traders from accessing or granting credit when conducting
35
commodity transactions in cross-border markets, raising the effective transaction
cost of inter-ethnic trade.32
6.3. Alternative Explanations
We also use our trader-level data to address some possible alternative
explanations for our findings. One set of concerns is that colonial policies or
historical political factors could have favored one ethnic group over another, thereby
resulting in different institutions, investments or public services at the village or
market level. Table 9 (Panel A) presents results for market-level institutions
available in Hausa and Zarma markets, as well as potential outcomes correlated
with institutional investment (such as education, experience and firm size). If these
institutions were systematically different on either side of the border, then this
could be a potential explanation for the observed price gap. Half of the Hausa
markets are located near a paved road, and markets impose a market day tax of 75
CFA/kg. There are on average 2.8 police controls in place during the market day,
and an average of 85 agricultural traders (of all types). On average, traders have 15
years of experience and four employees. None of these differences are statistically
significant between the Hausa and Zarma markets, although on average traders on
Zarma markets have less experience (column 2). Controlling for the traders’ gender
(column 3), the coefficients are in general smaller in magnitude. Overall, the 32 Intra-network credit will generally be an imperfect substitute for credit accessed at the point of transaction: a trader encountering a buying opportunity in a cross-border market, for example, must have secured credit from his “home” network in advance, a costly proposition when the precise nature of this buying opportunity was unknown in advance. The ethnic border within Niger may therefore reflect, at least in part, the prevalence of credit market imperfections and the resulting reliance upon borrowing and lending within ethnic groups.
36
results in Panel A suggest that different institutional environments do not seem to
explain the ethnic border effect.
A final threat to the identification of the internal border effect is the absence
of trade between Hausa and Zarma markets. For example, if the absence of long-
run relationships across ethnicities translates into higher transaction costs, then
this could result in autarky.33 Table 9 (Panel C) shows the trading behavior of
traders on Zarma and Hausa markets. Traders operating on the border markets
have similar marketing characteristics: 27 percent of traders are retailers (as
compared with intermediaries or wholesalers), search for price information in four
markets and have three primary members in their social network. Traders
purchase and sell agricultural commodities in 4.15 markets, with relatively fewer
markets in the Zarma region. A majority of traders operate within a 50-km radius,
although Zarma traders are more likely to trade farther afield and in cross-border
markets. These latter differences are statistically significant at the 1 percent level,
and remain significant even after controlling for the gender of the trader. Thus,
while spatial arbitrage (and cross-border trade) occurs, this is primarily in close
proximity and with markets located within the same ethnic region. Overall, these
results that the absence of trade between Hausa and Zarma markets is not driving
the results.
7. Conclusion 33 A more formal model showing the linkages between ethnicity, transaction costs and price gaps is provided in the Appendix.
37
Using unique high-frequency data on prices of two agricultural goods, our
study shows that an international border effect exists between Niger and Nigeria.
Furthermore, we find that the additional costs incurred in cross-border trades could
be mitigated between markets having similar ethnic composition — the mitigated
international border effect suggests that existing regional economic commissions
may have been somewhat successful in promoting cross-border trade, even across
currency areas or, alternatively, that longstanding trade routes — namely the one
that links the Hausa of Northern Nigeria and Niger — continue to influence
current-day trade pattern.34
Our results suggest that ethnicity plays an important role in trade for
agricultural goods: a common ethnicity could facilitate trade between Niger and
Nigeria, while distinct ethnicities could increase transaction costs, especially for
markets located at the junction of different ethnic regions. Focusing on markets in
Niger only, we find that the within-country ethnic border effect could be as large as
the between-country national border effect. One implication of this finding is that
an ethnic divide could play a central role in the spatial configuration of prices in
places where legal enforcement and contracts are lacking, but trust and social
sanctions are binding.
34 A third hypothesis figures prominently in African studies. Herbst (2000) argues that since the colonial period, the powers that have ruled African capital cities have made mutual bargains not to threaten each other’s periphery, and that the international relations regime has acquiesced by conferring de jure status on whomever controls the capital city. Thus, weak states with porous and non-defended borders are a political equilibrium.
38
Appendix
A Model of Ethnicity, Transaction Costs, and Price Gaps
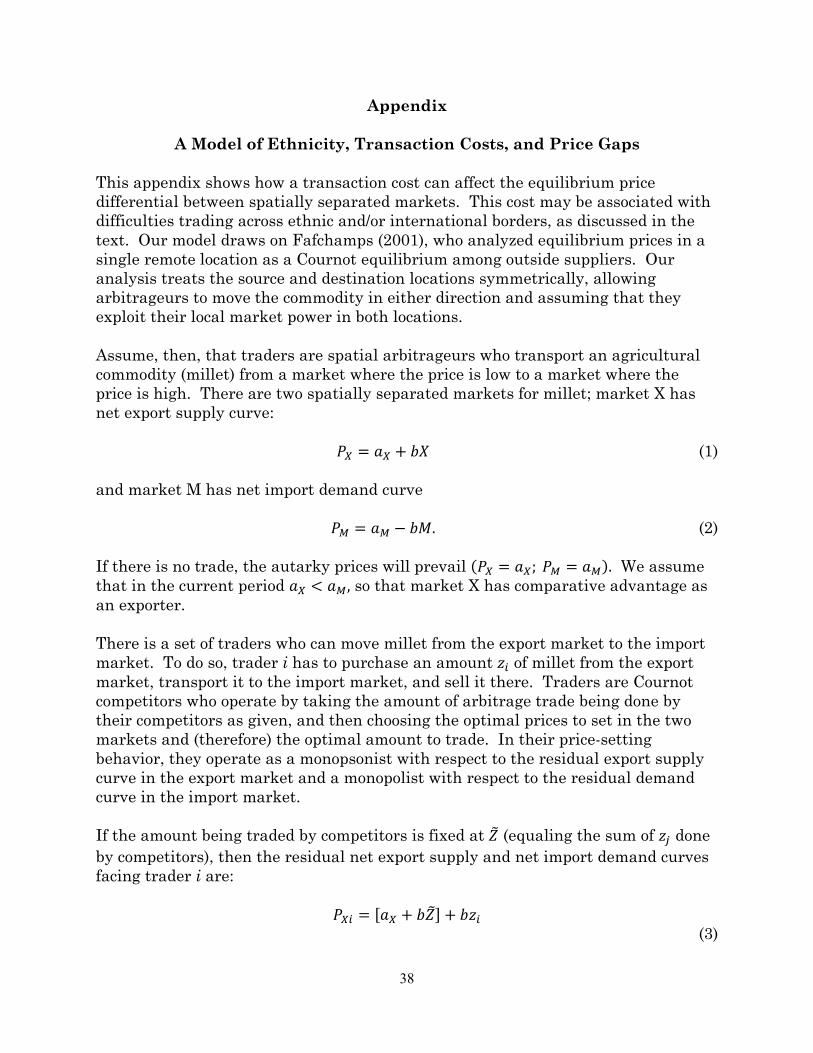
This appendix shows how a transaction cost can affect the equilibrium price differential between spatially separated markets. This cost may be associated with difficulties trading across ethnic and/or international borders, as discussed in the text. Our model draws on Fafchamps (2001), who analyzed equilibrium prices in a single remote location as a Cournot equilibrium among outside suppliers. Our analysis treats the source and destination locations symmetrically, allowing arbitrageurs to move the commodity in either direction and assuming that they exploit their local market power in both locations. Assume, then, that traders are spatial arbitrageurs who transport an agricultural commodity (millet) from a market where the price is low to a market where the price is high. There are two spatially separated markets for millet; market X has net export supply curve: /0 10 23 (1) and market M has net import demand curve /4 14 5 267 (2) If there is no trade, the autarky prices will prevail 8/0 109 '/4 14:7 We assume that in the current period 10 ; 14! so that market X has comparative advantage as an exporter. There is a set of traders who can move millet from the export market to the import market. To do so, trader i has to purchase an amount <� of millet from the export market, transport it to the import market, and sell it there. Traders are Cournot competitors who operate by taking the amount of arbitrage trade being done by their competitors as given, and then choosing the optimal prices to set in the two markets and (therefore) the optimal amount to trade. In their price-setting behavior, they operate as a monopsonist with respect to the residual export supply curve in the export market and a monopolist with respect to the residual demand curve in the import market. If the amount being traded by competitors is fixed at => (equaling the sum of <� done by competitors), then the residual net export supply and net import demand curves facing trader i are: /0� ?10 2=>@ 2<� (3)
39
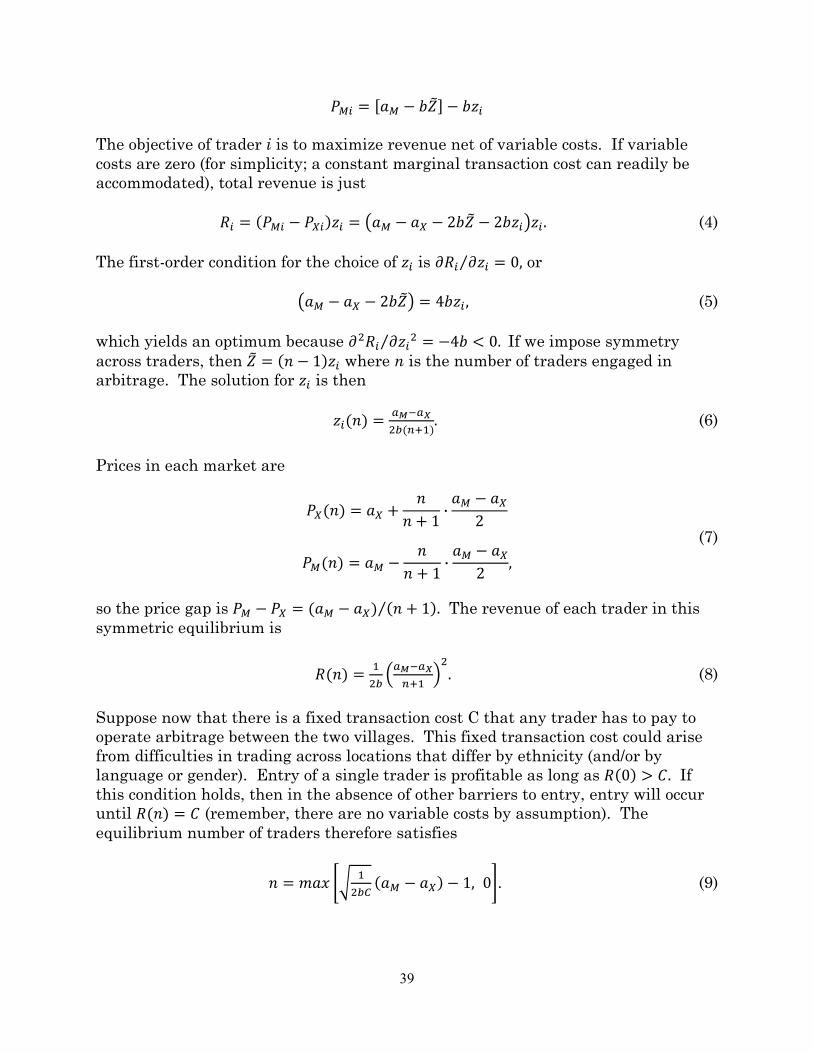
/4� ?14 5 2=>@ 5 2<� The objective of trader i is to maximize revenue net of variable costs. If variable costs are zero (for simplicity; a constant marginal transaction cost can readily be accommodated), total revenue is just A� 8/4� 5 /0�:<� B14 5 10 5 C2=> 5 C2<�D<�7 (4) The first-order condition for the choice of <� is EA� E<�F G! or B14 5 10 5 C2=>D H2<� ! (5) which yields an optimum because E�A� E<�� 5H2 ; G7F ''If we impose symmetry across traders, then => 8I 5 J:<� where n is the number of traders engaged in arbitrage. The solution for <� is then <�8I: KLMKN
�O8PQ�:7 (6)
Prices in each market are
/08I: 10 II J ) 14 5 10C
(7)
/48I: 14 5 II J ) 14 5 10C !
so the price gap is /4 5 /0 814 5 10: 8I J:7F The revenue of each trader in this symmetric equilibrium is
A8I: ��O RKLMKN
PQ� S�7 (8)
Suppose now that there is a fixed transaction cost C that any trader has to pay to operate arbitrage between the two villages. This fixed transaction cost could arise from difficulties in trading across locations that differ by ethnicity (and/or by language or gender). Entry of a single trader is profitable as long as A8G: T U7 If this condition holds, then in the absence of other barriers to entry, entry will occur until A8I: U (remember, there are no variable costs by assumption). The equilibrium number of traders therefore satisfies
I V1W XY ��OZ 814 5 10: 5 J! G[. (9)
40
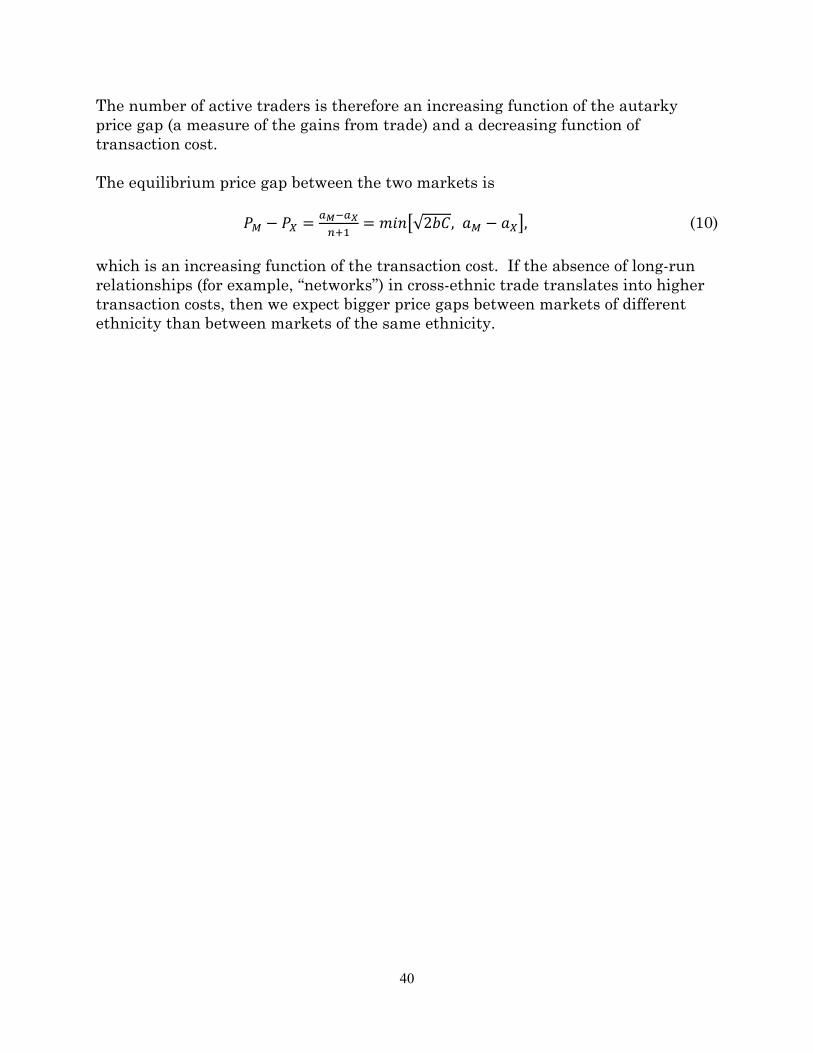
The number of active traders is therefore an increasing function of the autarky price gap (a measure of the gains from trade) and a decreasing function of transaction cost. The equilibrium price gap between the two markets is /4 5 /0 KLMKN
PQ� V\I]^C2U! 14 5 10_! (10)
which is an increasing function of the transaction cost. If the absence of long-run relationships (for example, “networks”) in cross-ethnic trade translates into higher transaction costs, then we expect bigger price gaps between markets of different ethnicity than between markets of the same ethnicity.
41
Bibliography
Aker, Jenny C. 2010. “Information from Markets Near and Far: The Impact of Mobile Phones on Grain Prices in Niger. American Economic Journal: Applied. 2:46-59. Alesina, Alberto, R. Baqir and William Easterly. 1999. “Public Goods and Ethnic Divisions” The Quarterly Journal of Economics, November 1999,Vol. CXIV, Issue 4, pp. 1243-1284. Alesina, Alberto and Eliana La Ferrara, 2000. “Participation In Heterogeneous Communities.” The Quarterly Journal of Economics. 115(3): 847-904. Araujo-Bonjean, Catherine, Magali Aubert, and Jonhy Egg. 2008. “Commerce du Mil en Afrique de l’Ouest: Les Frontières Abolies?” Paper prepared for CERDI Conference on “Intégration des Marchés et Sécurité Alimentaire dans les Pays en Développement, 3-4 November, Université d’Auvergne, Clermont-Ferrand, France. Asiwaju, A. I., ed. 1985. Partitioned Africa : Ethnic Relations Across Africa’s International Boundaries, 1884-1984 (New York : St. Martin’s Press). Azam, Jean-Paul. 2007. Trade, Exchange Rate and Growth in Sub-Saharan Africa Cambridge, UK: Cambridge University Press. Broda, Christian, Ephraim Leibtag and David Weinstein. 2009. “The Role of Prices in Measuring the Poor’s Living Standards,” Journal of Economic Perspectives 23 (2): 77–97. Ceglowski, Janet. 2003. “The Law of One Price: Intranational Evidence for Canada,” Canadian Journal of Economics, vol. 36, no. 2, pp. 373 – 400. Coles, Catherine and Beverly Mack, eds. 1991. Hausa Women in the 20th Century. Madison, WI: University of Wisconsin Press. Engel, Charles and John Rogers, “How Wide is the Border?” American Economic Review, Dec. 1996, vol. 86, no. 5, pp. 1112 – 1125. Easterly, William and Ross Levine. 1997. “Africa’s Growth Tragedy: Policies and Ethnic Divisions.” Quarterly Journal of Economics. v112:4, p1203-50. Fafchamps, Marcel. 2000. “Ethnicity and credit in African manufacturing.” Journal of Development Economics. 61: 205–235
Fafchamps, Marcel. 2001. “Networks, Communities, and Markets in Sub-Saharan Africa: Implications for Firm Growth and Investment,” Journal of African Economies, 10(Supplement 2): 109-142, September 2001. Feyrer, James, “Trade and Growth – Exploiting the Time Series Dimension,” mimeo, Dartmouth College Economics Department, December 2008. Frankel, Jeffrey and David Romer, “Does Trade Cause Growth?” American Economic Review, vol. 89, no. 3, 1999, pp. 379–399. Gopinath, Gita, Pierre-Olivier Gourinchas, Chang-Tai Hsieh, and Nicholas Li. 2011. “International Prices, Costs and Mark-up differences.” American Economic Review, 101 (6): 2450-2486. Gorodnichenko, Yuriy, and Linda Tesar. 2009. “Border Effect or Country Effect? Seattle May Not Be So Far from Vancouver After All,” American Economic Journal: Macroeconomics, Vol. 1, no. 1, January 2009, pp. 219 – 241. Hashim, Yahaya and Kate Meagher. 1999. Cross-Border Trade and the Parallel Currency Market: Trade and Finance in the Context of Structural Adjustment. A Case Study from Kano, Nigeria, Nordiska Afrikainstitutet Research Report No. 113, Sweden. Herbst, Jeffrey. 2000. States and Power in Africa: Comparative Lessons in Power and Control, Princeton University Press, Princeton, NJ.
Imbens, Guido and Thomas Lemieux. 2008. “Regression Discontinuity Designs: A Guide to Practice,” Journal of Econometrics 142(2): 615–35. Lambot, C.. 2000. “Industrial Potential of Cowpea.” Proceedings of the World Cowpea Conference III, International Institute of Tropical Agriculture (IITA), Ibadan, Nigeria, IITA, Ibadan, Nigeria. Mauro, Paolo. 1995. “Corruption and Growth.” The Quarterly Journal of Economics. 110(3); 681-712. Michalopoulos, Stelios. Forthcoming. “The Origins of Ethnolinguistic Diversity.” American Economic Review. Miles, William F. S. 2005. “Development, not Division: Local versus External Perceptions of the Niger-Nigeria.” The Journal of Modern African Studies. 43:2:297-320 Cambridge University Press.
Morshed, AKM M. 2007. “Is There Really A ‘Border Effect’?” Journal of International Money and Finance, 26 (7), 1229–1238. Ndjeunga, Jupiter and Carl Nelson. 2005. “Towards Understanding Household Preference for Pearl Millet in Niger.” Agricultural Economics. 32(1). Parsley, David, and Shang-Jin Wei. 2001. “Explaining the Border Effect: The Role of Exchange Rate Variability, Shipping Costs, and Geography,” Journal of International Economics, vol. 55, pp. 87–105. United Nations Development Program. 2011. Human Development Report 2011: Sustainability and Equity: A Better Future for All. New York, NY: UNDP.
44
Figure 1. International Borders and Ethnic Groups in Niger and (northern) Nigeria Notes: A map of the current ethnic and international borders for Benin, Burkina Faso, Mali, Niger and Nigeria, as well as the geographic location of major grain markets in these countries. Each color reflects the geographic location of different ethnic groups within Niger and the surrounding countries. As currently drawn, the ethnic boundaries appear to correspond to administrative (departmental) boundaries, which is not the case; in most cases the ethnic boundary is located within a particular department. Nevertheless, the map shows the general geographic locations of each group. Ethnic boundaries are created from the authors’ household and trader-level data collected between 2005 and 2007.
Figure 2. Ethnic Composition of Markets with
Notes: This map was created using data from a field survey conducted in October 2011. The field survey collected data on the latitude and longitude of each village, the ethnic composition of each village as of October 2011, as well as at the time of Nigerien independence in 1960. The categories included Hausa only, Zarma only, Fulani only, Hausa/Zarma, Hausa/Fulani, ZFulani, Hausa/Zarma/Fulani. As there were not significant differences inbetween 1960 and 2011, the data shown in this map are from October 2011. Those villages with more than two ethnic groups (more specifically, at least a combination of the Hausa/Zarmaethnic group) were used to define the ethnic “bofor all markets in our sample.
45
. Ethnic Composition of Markets within the Dosso Region
This map was created using data from a field survey conducted in October 2011. The
field survey collected data on the latitude and longitude of each village, the ethnic composition ch village as of October 2011, as well as at the time of Nigerien independence in 1960. The
Hausa only, Zarma only, Fulani only, Hausa/Zarma, Hausa/Fulani, ZFulani, Hausa/Zarma/Fulani. As there were not significant differences in the ethnic composition between 1960 and 2011, the data shown in this map are from October 2011. Those villages with more than two ethnic groups (more specifically, at least a combination of the Hausa/Zarmaethnic group) were used to define the ethnic “border”, and distances to this border were defined
This map was created using data from a field survey conducted in October 2011. The field survey collected data on the latitude and longitude of each village, the ethnic composition
ch village as of October 2011, as well as at the time of Nigerien independence in 1960. The Hausa only, Zarma only, Fulani only, Hausa/Zarma, Hausa/Fulani, Zarma-
the ethnic composition between 1960 and 2011, the data shown in this map are from October 2011. Those villages with more than two ethnic groups (more specifically, at least a combination of the Hausa/Zarma
rder”, and distances to this border were defined
46
Table 1: S
ummary Statistics and
Mean Com
parisons by Country (1999–2007)
Market P
airs with
in
Difference in m
eans
Pan
el A: M
arket p
air level d
ata
Niger
Northern Nigeria
(stand
ard error)
Variables
Mean (standard deviation)
Mean (standard deviation)
Distance betw
een markets (k
m)
388.00
(207
.00)
369.00
(271
.00)
18.93 (65.00
) Quality of ro
ad between markets
0.37
(0.49)
0.60
(0.52)
-0.22*
(0.16)
Mob
ile pho
ne coverage (2007)
0.23
(0.42)
0.32
(0.47)
-0.09 (0.08)
Transport costs between markets (C
FA/kg)
12.76 (6.72)
12.19 (6.67)
0.57
(1.98)
Markets with
in
Difference in m
eans
Pan
el B. Market level data
Southern Niger
Northern Nigeria
(stand
ard error)
Variables
Mean (standard deviation)
Mean (standard deviation)
Millet price (C
FA/kg)
124.00
(33.00)
112.00
(31.00)
11.60*
** (3
.30)
Cow
pea price (C
FA/kg)
173.00
(56.00)
176.00
(56.00)
-3.21 (8.20)
Ethnic compo
sitio
n of traders
Hausa
0.58
(0.51)
0.80
(0.45)
-0.21 (0.21)
Zarm
a 0.29
(0.46)
0 0.29
*** (0.10)
Kan
uri
0.08
(0.27)
0.20
(0.45)
-0.12 (0.19)
Quality of ro
ad to
market
0.71
(0.46)
0.80
(0.44)
-0.09 (0.21)
Market size (num
ber o
f traders)
105.08
(90.00)
176
.75 (149
.00)
-71.66
(69.00
) Mob
ile pho
ne coverage (1999–20
07)
0.36
(0.48)
0.45
(0.50)
-0.08 (0.11)
Drought between 1999
and 200
7 0.03
(0.16)
0.03
(0.16)
0.00
(0.01)
Urban center (at least 3
5,000 people)
0.33
(0.49)
0.80
(0.45)
0.46
** (0
.21)
Notes: D
ata are from
the Niger trader survey and secondary sources collected by on
e of th
e authors. Prices are deflated by the Nigerien
Con
sumer Price In
dex. In
Panel A, m
arket p
airs with
in Niger (o
r Northern Nigeria) a
re th
e on
es where both markets are lo
cated in Niger
(or N
igeria). In Panel B, m
arkets in
Southern Niger or N
orthern Nigeria are lo
cated with
in 250 km of the Niger-N
igeria border. In Panel A
standard errors are robu
st to
market-pair level clustering; in
Panel B standard errors are ro
bust to
market level clustering. * significant at
the 10% level, ** significant at the 5% level, **
* significant at the 1% level.
47
Table 2: E
stimates of the Niger-Nigeria Border Effect B
ased on Market P
air Regressions
Millet
Cow
pea
Dependent variable: |ln (P
it/Pjt)|
(1)
(2)
(3)
(4)
(5)
(6)
(7)
(8)
(9)
(10)
Niger-N
igeria border
0.02
1***
0.02
4***
0.02
4***
0.03
2***
0.10
4***
0.01
8**
0.02
3***
0.02
3***
0.04
7***
-0.004
(0.003
) (0.003
) (0.003
) (0.007
) (0.012
) (0.009
) (0.008
) (0.008
) (0.009
) (0.056
) Niger m
arket
0.00
8 0.02
4**
(0.009
) (0.012
) Nigeria m
arket
-0.008
-0.024
**
(0.009
) (0.012
) ln (transpo
rt costs)
0.05
2***
0.05
2***
0.05
2***
0.04
8***
0.06
8***
0.06
9***
0.06
9***
0.06
7***
(0.003
) (0.003
) (0.003
) (0.003
) (0.004
) (0.004
) (0.004
) (0.010
) Sa
me ethn
icity
-0.010
**
-0.024
(0.005
) (0.022
) Sa
me ethn
icity
× Niger-N
igeria
border
-0.085
***
0.03
0 (0.011
) (0.057
) Con
stant
0.16
1***
0.09
2***
0.08
4***
0.09
2***
0.10
7***
0.27
6***
0.18
8***
0.16
4***
0.18
8***
0.20
6***
(0.000
) (0.003
) (0.008
) (0.003
) (0.006
) (0.000
) (0.006
) (0.012
) (0.006
) (0.008
) Other cov
ariates
No
Yes
Yes
Yes
Yes
No
Yes
Yes
Yes
Yes
Mon
thly time effects
Yes
Yes
Yes
Yes
Yes
Yes
Yes
Yes
Yes
Yes
Sample size
23,760
23,760
23,760
23,760
23,760
22
,689
22,689
22,689
22,689
22,689
Notes: D
ata are from
the Niger trader survey and second
ary sources colle
cted by on
e of th
e authors. The estim
ation samples in
clud
e market p
airs lo
cated with
in
250 km
of the Niger-N
igeria border. The “Niger-N
igeria border” variable equals one fo
r market p
airs lo
cated in different cou
ntries, and
zero otherw
ise. The
“Niger m
arket” variable equals one fo
r market p
airs lo
cated on
ly in
Niger, and
zero otherw
ise. The “Nigeria m
arket” variable equals one fo
r market p
airs lo
cated
only in
Nigeria, and
zero otherw
ise. The “same-ethnicity
” variable equ
als on
e if both markets in
a pair h
ave the same ethn
ic com
positio
n, and
zero otherw
ise.
Other cov
ariates includ
e the presence of d
roug
ht, m
obile
pho
ne cov
erage and urban status. S
tand
ard errors clustered by mon
th are re
ported in
parentheses. *
sign
ificant at the 10%
level, ** significant at the 5% level, *** sign
ificant at the 1% level.
48
Table 3: E
stimates of the Niger-Nigeria Border Effect on Millet Price Based on Single M
arket R
egressions
Dependent variable:
With
in 5 km of the Niger-N
igeria Border
With
in 20 km
of the Niger-N
igeria Border
With
in 30 km
of the Niger-N
igeria Border
Log
of m
illet price
(1)
(2)
(3)
(4)
(5)
(6)
(7)
(8)
(9)
(10)
(11)
(12)
Niger (1
/0)
0.22
5***
0.17
3*
0.23
8***
0.07
9**
0.21
9***
0.16
9**
0.23
0***
0.00
5 0.18
8***
0.17
8**
0.26
3***
-0.066
(0.035
) (0.076
) (0.041
) (0.030
) (0.038
) (0.073
) (0.051
) (0.023
) (0.043
) (0.076
) (0.070
) (0.067
) Con
stant
4.72
9***
4.75
5***
3.56
9***
1.67
1***
4.75
2***
4.77
4***
3.57
7***
0.86
0***
4.73
8***
4.74
1***
2.83
6**
1.77
6*
(0.007
) (0.014
) (0.760
) (0.176
) (0.019
) (0.016
) (0.952
) (0.124
) (0.012
) (0.016
) (0.933
) (0.843
) Distance to th
e Border
Yes
Yes
Yes
Yes
Yes
Yes
Yes
Yes
Yes
Yes
Yes
Yes
Niger × Distance
Yes
Yes
Yes
Yes
Yes
Yes
Yes
Yes
Yes
Yes
Yes
Yes
Distance squared
No
No
No
No
Yes
Yes
Yes
Yes
Yes
Yes
Yes
Yes
Distance cubic
No
No
No
No
No
No
No
No
No
No
No
No
Sample size
625
625
625
472
682
682
682
529
867
867
867
618
With
in 50 km
of the Niger-N
igeria Border
With
in 200
km of the Niger-N
igeria Border
Fu
ll Sa
mple
(13)
(14)
(15)
(16)
(17)
(18)
(19)
(20)
(21)
(22)
(23)
(24)
Niger (1
/0)
0.16
8***
0.15
5**
0.18
3**
-0.150
0.10
6*
0.10
4*
0.10
3 0.05
4 0.08
9*
0.08
5*
0.06
8 0.07
2 (0.048
) (0.069
) (0.083
) (0.091
) (0.055
) (0.055
) (0.062
) (0.046
) (0.045
) (0.046
) (0.061
) (0.054
) Con
stant
4.74
3***
4.74
5***
3.16
3***
3.11
2***
4.76
2***
4.76
0***
4.13
0***
2.15
7***
4.68
5***
4.68
2***
3.93
5***
2.00
5***
(0.014
) (0.016
) (0.632
) (0.801
) (0.029
) (0.027
) (0.514
) (0.633
) (0.011
) (0.015
) (0.499
) (0.681
) Distance to th
e Border
Yes
Yes
Yes
Yes
Yes
Yes
Yes
Yes
Yes
Yes
Yes
Yes
Niger × Distance
Yes
Yes
Yes
Yes
Yes
Yes
Yes
Yes
Yes
Yes
Yes
Yes
Distance squared
Yes
Yes
Yes
Yes
Yes
Yes
Yes
Yes
Yes
Yes
Yes
Yes
Distance cubic
Yes
Yes
Yes
Yes
Yes
Yes
Yes
Yes
Yes
Yes
Yes
Yes
Sample size
1,30
4 1,30
4 1,30
4 80
4 3,49
6 3,49
6 3,49
6 2,08
1 4,01
7 4,01
7 4,01
7 2,32
1
Tim
e-variant cov
ariates
No
Yes
Yes
Yes
No
Yes
Yes
Yes
No
Yes
Yes
Yes
Tim
e effect (mon
thly)
No
Yes
Yes
Yes
No
Yes
Yes
Yes
No
Yes
Yes
Yes
Tim
e-invariant cov
ariates
No
No
Yes
Yes
No
No
Yes
Yes
No
No
Yes
Yes
Markets only in Hausa
No
No
No
Yes
No
No
No
Yes
No
No
No
Yes
Notes: E
stim
ations are based on mon
thly m
arket-level d
ata. The estim
ation samples in
colum
ns (1
) through
(20) in
clud
e markets lo
cated with
in X km of the Niger-N
igeria border
(X = 5, 2
0, 30, 50 and 20
0). T
he estim
ation samples in
colum
ns (2
1) th
roug
h (24) in
clud
e all m
arkets. T
he “Niger” variable is binary: equ
al to
one fo
r a m
arket located in
Niger and
equal to zero fo
r a m
arket located in
Nigeria. T
he “distance” variable is m
easured in kilo
meters and is algebraic, b
eing positive fo
r markets in
Niger and
negative for markets in
Nigeria. T
ime-variant cov
ariates includ
e having m
obile
pho
ne cov
erage (equ
al to
one) o
r not (e
qual to
zero) and
having experienced drou
ght (equal to on
e) or n
ot (e
qual to
zero).
Tim
e-invariant cov
ariates includ
e the latitud
e and long
itude of a
market location. Stand
ard errors ro
bust to
market level clustering are repo
rted in
parentheses. *
significant at the
10% level, ** significant at the 5% level, *** significant at the 1% level.
49
Table 4: E
stimates of N
iger-Nigeria Border Effect on Cow
pea Price Based on Single M
arket R
egressions
Dependent variable:
With
in 5 km of the Niger-N
igeria Border
With
in 20 km
of the Niger-N
igeria Border
With
in 30 km
of the Niger-N
igeria Border
Log
of c
owpea price
(1)
(2)
(3)
(4)
(5)
(6)
(7)
(8)
(9)
(10)
(11)
(12)
Niger (1
/0)
0.26
6***
0.19
5*
0.20
2***
-0.064
0.27
2***
0.21
4***
0.21
8***
-0.095
0.30
5***
0.22
1***
0.21
6***
0.11
1**
(0.048
) (0.080
) (0.051
) (0.080
) (0.040
) (0.060
) (0.047
) (0.078
) (0.043
) (0.045
) (0.054
) (0.032
) Con
stant
5.05
0***
5.10
4***
3.79
9***
5.32
2***
5.06
0***
5.09
6***
3.97
4***
5.32
9***
5.06
2***
5.10
2***
1.84
4 7.96
9***
(0.025
) (0.034
) (0.757
) (0.145
) (0.026
) (0.028
) (0.810
) (0.125
) (0.026
) (0.027
) (1.793
) (1.146
) Distance to th
e Border
Yes
Yes
Yes
Yes
Yes
Yes
Yes
Yes
Yes
Yes
Yes
Yes
Niger × Distance
Yes
Yes
Yes
Yes
Yes
Yes
Yes
Yes
Yes
Yes
Yes
Yes
Distance squared
No
No
No
No
Yes
Yes
Yes
Yes
Yes
Yes
Yes
Yes
Distance cubic
No
No
No
No
No
No
No
No
No
No
No
No
Sample size
563
563
563
417
620
620
620
474
806
806
806
564
With
in 50 km
of the Niger-N
igeria Border
With
in 200
km of the Niger-N
igeria Border
Fu
ll Sa
mple
(13)
(14)
(15)
(16)
(17)
(18)
(19)
(20)
(21)
(22)
(23)
(24)
Niger (1
/0)
0.27
9***
0.26
8***
0.21
4**
0.03
2 0.04
9 0.04
2 0.04
0 -0.071
**
0.01
7 0.01
1 -0.016
-0.057
(0.048
) (0.063
) (0.092
) (0.241
) (0.078
) (0.074
) (0.079
) (0.030
) (0.070
) (0.068
) (0.069
) (0.034
) Con
stant
5.07
0***
5.08
6***
4.92
1***
3.61
0 5.17
2***
5.17
4***
4.85
4***
3.37
4***
5.12
0***
5.12
3***
4.49
8***
2.88
7***
(0.028
) (0.027
) (0.949
) (2.113
) (0.058
) (0.047
) (0.674
) (0.646
) (0.038
) (0.026
) (0.639
) (0.742
) Distance to th
e Border
Yes
Yes
Yes
Yes
Yes
Yes
Yes
Yes
Yes
Yes
Yes
Yes
Niger × Distance
Yes
Yes
Yes
Yes
Yes
Yes
Yes
Yes
Yes
Yes
Yes
Yes
Distance squared
Yes
Yes
Yes
Yes
Yes
Yes
Yes
Yes
Yes
Yes
Yes
Yes
Distance cubic
Yes
Yes
Yes
Yes
Yes
Yes
Yes
Yes
Yes
Yes
Yes
Yes
Sample size
1,24
7 1,24
7 1,24
7 74
4 3,34
5 3,34
5 3,34
5 1,96
3 3,86
2 3,86
2 3,86
2 2,20
3
Tim
e-variant cov
ariates
No
Yes
Yes
Yes
No
Yes
Yes
Yes
No
Yes
Yes
Yes
Tim
e effect (mon
thly)
No
Yes
Yes
Yes
No
Yes
Yes
Yes
No
Yes
Yes
Yes
Tim
e-invariant cov
ariates
No
No
Yes
Yes
No
No
Yes
Yes
No
No
Yes
Yes
Markets only in Hausa
No
No
No
Yes
No
No
No
Yes
No
No
No
Yes
Notes: E
stim
ations are based on mon
thly m
arket-level d
ata. The estim
ation samples in
colum
ns (1
) through
(20) in
clud
e markets lo
cated with
in X km of the Niger-N
igeria border
(X = 5, 2
0, 30, 50 and 20
0). T
he estim
ation samples in
colum
ns (2
1) th
roug
h (24) in
clud
e all m
arkets. T
he “Niger” variable is binary: equ
al to
one fo
r a m
arket located in
Niger and
equal to zero fo
r a m
arket located in
Nigeria. T
he “distance” variable is m
easured in kilo
meters and is algebraic, b
eing positive fo
r markets in
Niger and
negative for markets in
Nigeria. T
ime-variant cov
ariates includ
e having m
obile
pho
ne cov
erage (equ
al to
one) o
r not (e
qual to
zero) and
having experienced drou
ght (equal to on
e) or n
ot (e
qual to
zero).
Tim
e-invariant cov
ariates includ
e the latitud
e and long
itude of a
market location. Stand
ard errors ro
bust to
market level clustering are repo
rted in
parentheses. *
significant at the
10% level, ** significant at the 5% level, *** significant at the 1% level.
50
Table 5: D
ifferences in M
eans for Market-Level Characteristics near the Niger-Nigeria Border
Differences in
means fo
r the fo
llowing variables:
Markets lo
cated with
in X km of the Niger-N
igeria border
(Niger = 1, N
igeria = 0)
X = 15
X = 50
Pan
el A: M
arket level data (199
9–20
07)
Having mob
ile pho
ne coverage (1) o
r not (0
) 0.03
-0.01
(0.02)
(0.02)
Having experienced drou
ght (1) or n
ot (0
) -0.01
-0.00
(0.01)
(0.00)
Market located in
an urban center (1
) or n
ot (0
) -0.25
-0.25
(0.38)
(0.28)
Paved road (1
) or n
ot (0
) 0.00
-0.17
(0.35)
(0.28)
Sample size
1,91
7 3,83
4 Pan
el B: T
rader level d
ata (200
5–20
07)
Market size (the num
ber o
f traders)
-12.11
2.85
(13.31)
(6.54)
Num
ber o
f police controls
0.09
-0.15
(0.25)
(0.19)
Sample size
127
232
Notes: E
stim
ations are based on mon
thly m
arket-level d
ata (Panel A) a
nd trader-level data (Panel B). Mob
ile pho
ne coverage is
measured at m
arket level in
each mon
th. T
he drought variable for a
market in a mon
th equals on
e if 1) the m
arket receives
rainfall less th
an or e
qual to
two standard deviatio
ns below
its average rainfall level d
uring the rainy season
, or 2
) if there are 15
consecutive days with
out rainfall d
uring the rainy season, and
zero otherw
ise. The urban variable for a
market equ
als one if th
e market is located in an urban center with
at least 35,000 people, and
zero otherw
ise. Rob
ust standard errors are re
ported in
parentheses. * significant at the 10%
level, ** significant at the 5% level, **
* significant at the 1% level.
51
Table 6: D
ifference in M
eans for Market-Level Characteristics near the Hausa-Zarma Border
Differences in
means fo
r the fo
llowing
variables:
Markets lo
cated with
in X km of the Hausa-Zarma bo
rder
(Zarma = 1, Hausa = 0)
X = 20
X = 30
Pan
el A: M
arket level data (199
9–20
07)
Having mob
ile pho
ne coverage (1) o
r not (0
) 0.31
***
0.22
***
(0.06)
(0.04)
Having experienced drou
ght (1) or n
ot (0
) 0.00
-0.00
(0.02)
(0.02)
Market located in
an urban center (1
) or n
ot (0
) 0.50
0.17
(0.61)
(0.58)
Sample size
288
480
Pan
el B: T
rader level d
ata (O
ctob
er 2011)
Elevatio
n (in meters)
-0.02
0.00
(0.02)
(0.00)
Sample size
15
30
Notes: E
stim
ations are based on mon
thly m
arket-level d
ata (Panel A) a
nd trader-level data (Panel B) c
ollected from
the Octob
er
2011
field survey on ethnic com
positio
n. in
clud
ing mon
thly time effects. M
obile
pho
ne coverage is m
easured at m
arket level in
each m
onth. T
he drought variable for a
market in a mon
th equals on
e if 1) the m
arket receives rainfall less th
an or e
qual to
two
standard deviatio
ns below
its average rainfall level d
uring the rainy season
, or 2
) if there are 15 consecutive days with
out rainfall
during th
e rainy season
, and zero otherw
ise. The urban variable for a
market equals one if th
e market is located in an urban center
with
at least 35,00
0 peop
le, and
zero otherw
ise. Rob
ust standard errors are re
ported in
parentheses. * significant at the 10%
level,
** significant at the 5% level, **
* significant at the 1% level.
52
Table 7: E
stimates of the Hausa-Zarma Border Effect on Millet Price Based on Single M
arket R
egressions
Dependent variable:
With
in 20 km
of the
Hausa-Zarma bo
rder
With
in 30 km
of the
Hausa-Zarma bo
rder
At least 50 km
away
from
the Hausa-Zarma
border
At least 100
km away
from
the Hausa-Zarma
border
Fu
ll Sa
mple
Log
of m
illet price
(1)
(2)
(3)
(4)
(5)
(6)
(7)
(8)
(9)
(10)
Zarma (1/0)
0.21
2***
0.27
8***
0.17
3***
0.26
4***
-0.058
0.07
3 -0.126
0.07
0 0.03
5 0.05
7 (0.011
) (0.053
) (0.016
) (0.036
) (0.099
) (0.093
) (0.155
) (0.151
) (0.054
) (0.051
) Con
stant
4.79
1***
4.40
1***
4.80
8***
4.35
1***
4.79
4***
4.14
2***
4.97
2***
4.05
8***
4.81
7***
4.33
7***
(0.011
) (0.406
) (0.008
) (0.068
) (0.147
) (0.516
) (0.333
) (0.633
) (0.040
) (0.375
) Sa
mple size
333
333
420
420
2,69
5 2,69
5 2,40
8 2,40
8 3,20
6 3,20
6
Distance to th
e Border
Yes
Yes
Yes
Yes
Yes
Yes
Yes
Yes
Yes
Yes
Zarma × Distance
Yes
Yes
Yes
Yes
Yes
Yes
Yes
Yes
Yes
Yes
Distance squared
No
No
Yes
Yes
Yes
Yes
Yes
Yes
Yes
Yes
Distance cubic
No
No
No
No
Yes
Yes
Yes
Yes
Yes
Yes
Tim
e effect (mon
thly)
No
Yes
No
Yes
No
Yes
No
Yes
No
Yes
Tim
e-variant cov
ariates
No
Yes
No
Yes
No
Yes
No
Yes
No
Yes
Tim
e-invariant cov
ariates
No
Yes
No
Yes
No
Yes
No
Yes
No
Yes
Notes: E
stim
ations are based on mon
thly m
arket-level d
ata. All markets are lo
cated in Niger. T
he estim
ation samples in
colum
ns (1
) throu
gh (4
) include m
arkets lo
cated with
in X
km of the Hausa-Zarma bo
rder (X
= 20 and 30
). The estim
ation samples in
colum
ns (5
) throu
gh (8
) include m
arkets lo
cated at least Y
km away from
the Hausa-Zarma bo
rder (Y
= 50
and
100
). The estim
ation samples in
colum
ns (9
) and
(10) in
clud
e all m
arkets. T
he “Zarma” variable is binary: equ
al to
one fo
r a m
arket located in
Zarma and equal to zero
for a
market located in
Hausa. T
he “distance” variable is m
easured in kilo
meters and is algebraic, b
eing positive fo
r markets in
Zarma and negativ
e for markets in
Hausa. T
ime-
variant cov
ariates includ
e having m
obile
pho
ne cov
erage (equ
al to
one) o
r not (e
qual to
zero) and
having experienced drou
ght (equal to on
e) or n
ot (e
qual to
zero). T
ime-invariant
covariates in
clud
e the latitud
e and longitu
de of a
market location. Stand
ard errors ro
bust to
market level clustering are repo
rted in
parentheses. *
significant at the 10%
level, **
sign
ificant at the 5% level, **
* sign
ificant at the 1% level.
53
Table 8: E
stimates of H
ausa-Zarma Border Effect on Cow
pea Price Based on Single M
arket R
egressions
Dependent variable:
With
in 20 km
of the
Hausa-Zarma bo
rder
With
in 30 km
of the
Hausa-Zarma bo
rder
At least 50 km
away
from
the Hausa-Zarma
border
At least 100
km away
from
the Hausa-Zarma
border
Fu
ll Sa
mple
Log
of c
owpea price
(1)
(2)
(3)
(4)
(5)
(6)
(7)
(8)
(9)
(10)
Zarma (1/0)
0.21
5**
0.22
2***
0.25
6***
0.29
5***
0.07
2 -0.137
0.15
1 -0.008
0.06
4 -0.071
(0.037
) (0.004
) (0.029
) (0.003
) (0.095
) (0.168
) (0.136
) (0.192
) (0.063
) (0.088
) Con
stant
4.96
6***
5.72
1***
5.04
7***
3.18
4***
4.90
9***
6.77
3***
4.77
7***
6.03
2***
4.98
1***
6.10
5***
(0.000
) (0.195
) (0.015
) (0.290
) (0.155
) (0.973
) (0.310
) (1.019
) (0.035
) (0.618
) Sa
mple size
267
267
355
355
2,64
9 2,64
9 2,36
2 2,36
2 3,09
4 3,09
4
Distance to th
e Border
No
No
Yes
Yes
Yes
Yes
Yes
Yes
Yes
Yes
Zarma × Distance
No
No
No
No
Yes
Yes
Yes
Yes
Yes
Yes
Distance squared
No
No
No
No
Yes
Yes
Yes
Yes
Yes
Yes
Distance cubic
No
No
No
No
Yes
Yes
Yes
Yes
Yes
Yes
Tim
e effect (mon
thly)
No
Yes
No
Yes
No
Yes
No
Yes
No
Yes
Tim
e-variant cov
ariates
No
Yes
No
Yes
No
Yes
No
Yes
No
Yes
Tim
e-invariant cov
ariates
No
Yes
No
Yes
No
Yes
No
Yes
No
Yes
Notes: E
stim
ations are based on mon
thly m
arket-level d
ata. All markets are lo
cated in Niger. T
he estim
ation samples in
colum
ns (1
) throu
gh (4
) include m
arkets lo
cated with
in X
km of the Hausa-Zarma bo
rder (X
= 20 and 30
). The estim
ation samples in
colum
ns (5
) throu
gh (8
) include m
arkets lo
cated at least Y
km away from
the Hausa-Zarma bo
rder (Y
= 50
and
100
). The estim
ation samples in
colum
ns (9
) and
(10) in
clud
e all m
arkets. T
he “Zarma” variable is binary: equ
al to
one fo
r a m
arket located in
Zarma and equal to zero
for a
market located in
Hausa. T
he “distance” variable is m
easured in kilo
meters and is algebraic, b
eing positive fo
r markets in
Zarma and negativ
e for markets in
Hausa. T
ime-
variant cov
ariates includ
e having m
obile
pho
ne cov
erage (equ
al to
one) o
r not (e
qual to
zero) and
having experienced drou
ght (equal to on
e) or n
ot (e
qual to
zero). T
ime-invariant
covariates in
clud
e the latitud
e and longitu
de of a
market location. Stand
ard errors ro
bust to
market level clustering are repo
rted in
parentheses. *
significant at the 10%
level, **
sign
ificant at the 5% level, **
* sign
ificant at the 1% level.
54
Table 9: Differences in Trader-Level Characteristics between Hausa and Zarma Regions
(0.08) (0.12) Willing to provide client credit 0.85 0.05 0.06
(0.09) (0.10) Sold on credit since last harvest 0.75 0.08 0.10*
(0.06) (0.05) Duration of client credit (days) 24.00 -14.60 -14.57*
(7.70) (7.07) Implicit monthly interest rate (%) 0.17 -0.05 -0.03 (0.12) (0.12) Notes: Data are from the Niger trader survey and secondary sources collected by one of the authors between 2005 and 2007. There are 400 traders across 35 markets. Column (1) shows the mean in Hausa markets located within 50 km of the Hausa-Zarma “border.” Column (2) shows the unconditional difference in means between Hausa and Zarma border markets. Column (3) shows the conditional difference in means between Hausa and Zarma border markets, controlling for the gender of the trader. Standard errors robust to market level clustering are reported in parentheses. * significant at the 10% level, ** significant at the 5% level, *** significant at the 1% level.
56
Table 10: Differences in Trader-Level Borrowing and Lending between Hausa and Zarma Regions
Variables
Obtained
loan fo
r trade
Borrowed
from
fello
w
trader
Borrowed
from
friend
Able to
obtain
supp
lier
credit
Obtained
supp
lier
credit
since
last
harvest
Prov
ide
credit
to
clients
Duration of
supp
lier
credit
(num
ber o
f days)
Duration
of buyer
credit
(num
ber
of days)
Implicit
interest
rate
supp
lier
credit
Implicit
interest
rate clie
nt
credit
(1)
(2)
(3)
(4)
(5)
(6)
(7)
(8)
(9)
(10)
Zarma
0.05
0.16
0.29
* 0.05
0.17
0.06
-6.74*
* -10.40
* 0.04
-0.09
(0.05)
(0.17)
(0.13)
(0.14)
(0.13)
(0.10)
(1.77)
(4.09)
(0.13)
(0.11)
Gender
-0.27*
* -0.14
-0.11
-0.29*
**
-0.37*
-0.02
-3.41
-1.46
0.05
-0.09
(0.07)
(0.26)
(0.39)
(0.06)
(0.16)
(0.14)
(3.93)
(7.57)
(0.09)
(0.12)
Age
-0.00
0.01
0.00
0.00
-0.00
0.00
0.36
-0.17
-0.01
-0.01*
(0.00)
(0.01)
(0.01)
(0.00)
(0.01)
(0.00)
(0.32)
(0.15)
(0.01)
(0.00)
Exp
erience
-0.01
0.01
0.00
-0.01
0.00
0.00
0.40
0.11
-0.00
-0.01
(0.01)
(0.00)
(0.01)
(0.01)
(0.01)
(0.00)
(0.37)
(0.43)
(0.00)
(0.00)
Edu
catio
n 0.19
-0.00
-0.11
0.03
0.00
-0.03
-3.81
16.90
0.00
-0.08
(0.22)
(0.25)
(0.08)
(0.04)
(0.06)
(0.06)
(4.73)
(14.72
) (0.04)
(0.07)
Retailer
-0.01
-0.09
-0.10
0.11
0.35
-0.10
-11.30
-9.54*
-0.40
-0.22*
* (0.16)
(0.24)
(0.15)
(0.13)
(0.18)
(0.07)
(8.07)
(3.97)
(0.35)
(0.08)
Num
ber o
f Workers
0.01
0.01
-0.01
0.00
0.00
-0.00
-0.34
-0.63
-0.02
-0.01
(0.02)
(0.01)
(0.01)
(0.01)
(0.02)
(0.01)
(0.48)
(0.50)
(0.02)
(0.01)
Con
stant
0.57
-0.05
0.16
0.73
***
0.47
0.80
***
4.07
32
.33*
**
1.01
0.94
**
(0.33)
(0.52)
(0.44)
(0.14)
(0.35)
(0.19)
(12.06
) (6.24)
(0.84)
(0.34)
Sample size
296
132
132
312
272
312
168
232
112
152
Notes: D
ata are from
the Niger trader survey and second
ary sources colle
cted by on
e of th
e authors between 20
05 and
200
7. There are 400
traders across 35 markets. S
tand
ard errors ro
bust to
market level clustering are repo
rted in
parentheses. *
significant at the 10%
level, **
sign
ificant at the 5% level, **
* sign
ificant at the 1% level.
57
Figure A1. Kernel Density Estimates for Millet and Cowpea Price Residuals
58
Figure A2. CFA/Naira Exchange Rate between 1999 and 2007