Borrowing from the Future: 401(k) Plan Loans and Loan Defaults
Abstract
Most active 401(k) participants have the option of borrowing from their retirement accounts, and nearly 40 percent do so over a five-year period. We show that employers’ loan rules have a strong endorsement effect on borrowing patterns; that is, in plans allowing multiple loans, participants are more likely to borrow and take out larger loans. While the liquidity-constrained are most likely to borrow, better-off employees take out larger loans when they do borrow. We also provide a new estimate of loan default “leakage” at $6 billion annually. Our results show that defined contribution retirement plans, while designed mainly to support old-age financial security, include important features for financing current consumption. Timothy (Jun) Lu Peking University – HSBC Business School Room 725, Peking University Campus, University City, Shenzhen 518055 Email: [email protected] Olivia S. Mitchell Wharton School, University of Pennsylvania 3620 Locust Walk, 3000 SH-DH Philadelphia, PA 19104 Email: [email protected] Stephen P. Utkus Principal Vanguard Center for Retirement Research 100 Vanguard Boulevard Malvern, PA 19355 Email: [email protected] Jean A. Young Senior Research Analyst Vanguard Center for Retirement Research 100 Vanguard Boulevard Malvern, PA 19355 Email: [email protected]
1
Borrowing from the Future:
401(k) Plan Loans and Loan Defaults
More than 20 ago, Nobel Prize winner Franco Modigliani patented a method for issuing
401(k) credit cards, with the aim of making it easier for workers to withdraw savings from their
retirement accounts to cover short-term consumption needs (Vise 2004).1 Although the idea of
401(k) credit cards faded under criticism, the proposal highlighted the dual-purpose nature of
U.S. defined contribution (DC) plans. While DC plans are intended for old-age financial security,
they also provide several pre-retirement liquidity features, allowing retirement savings to be used
to finance current consumption needs. 2 The U.S. tax code generally discourages such pre-
retirement access by imposing a tax liability and an additional 10 percent penalty tax on amounts
withdrawn. Yet estimates of aggregate premature withdrawals—so-called account “leakage”—
from all tax-deferred accounts, including both 401(k)s and IRAs, range from 30 to 45 percent of
annual total contributions, depending on the economic environment (Argento, Bryant and
Sabelhaus, 2013). Such sizeable outflows relative to inflows raise the important question of how
these features are presently used and how they may influence future retirement security.
In this paper, we examine aspects of the 401(k) loan feature: who borrows from their
401(k) plans, who defaults on an outstanding loan, and what the implications of 401(k)
borrowing might be for retirement security. Most active DC participants in the U.S. have the
option of borrowing from their retirement accounts. Loan uptake is reasonably common, with
1 We use the terms “DC plan”, “401(k) plan”, “retirement plan” and “pension plan” interchangeably throughout. More than 88 million private sector workers are covered by DC retirement plans holding more than $3.8 trillion in assets (U.S. Department of Labor, 2013). 2 Pre-retirement liquidity mechanisms include hardship withdrawals, allowing the withdrawal of a worker’s own contributions for limited conditions; certain types of non-hardship withdrawals such as the withdrawal of employer profit-sharing contributions; and complete access to savings upon termination of employment with the current employer. Hardship and non-hardship withdrawals and loans are at the prerogative of the plan sponsor. They are generally subject to income tax and a 10 percent penalty tax, but there are various exemptions to the penalty.
2
one-fifth of DC participants having an outstanding loan at any one point in time, and, in our
sample, nearly four in 10 borrowing over a five-year period.3 By law, participants are required
to repay 401(k) loans on a set schedule, usually through payroll deduction, and fully 90 percent
of loans are repaid in a timely way, according to our estimates. Prior research has suggested that
the availability of such a loan feature encourages higher retirement contributions by improving
the liquidity of a tax-deferred retirement account. At the same time, we estimate one in 10 loans
is not repaid—failure to repay typically occurs when the worker leaves his current employer—
and these loan “defaults” represent a permanent reduction or leakage from retirement savings.4
Our findings draw on a rich administrative dataset of 401(k) plans containing information
on plan borrowing and loan default patterns. Employer loan policy has a strong effect on 401(k)
borrowing. If a plan sponsor permits multiple loans rather than only one, each individual loan is
smaller, consistent with workers following a buffer-stock model of protecting against
consumption shocks. Yet the probability of borrowing nearly doubles, and the aggregate amount
borrowed rises 16 percent, suggesting a behavioral endorsement effect from employer plan
design. Also, given that 401(k) borrowing is both a function of lifecycle demand for debt, with
younger households having the largest borrowing needs, and the size of the 401(k) account,
which grows with age, we find a hump-shaped age profile of borrowing, with the propensity to
borrow (and the fraction of wealth borrowed) highest among those age 35-45. Further, we find
that liquidity-constrained participants, those with lower income and lower non-retirement wealth,
are more likely to borrow from their 401(k) accounts. Yet it is the better-off, with higher incomes
and higher non-retirement savings, who borrow the highest fraction of current 401(k) wealth.
3 In total, around 90 percent of plan participants had access to plan loans, and one-fifth of active workers had outstanding loans (in 2011; Vanderhei, Holden, Alonso, and Bass, 2012). 4 It is important to note that, since 401(k) loans are a way to access one’s own savings, there is no technical “default,” as in a traditional loan from a bank or other intermediary.
3
In terms of loan defaults, avoiding default requires the borrower to repay the outstanding
loan balance. In our dataset, about which we say more below, 86 percent of the workers
terminating employee with a loan do default. Low-liquidity households are more likely to default,
although the effects are economically small compared to the mean default rate. Given this
sizeable default level when changing jobs with a loan, it may be that borrowers are surprised by
either an unanticipated job change or by the need to replenish their account.
This paper also provides a revised estimate of $6 billion annually in national 401(k) loan
defaults, which generates just over $1 billion in federal tax revenue per year. This is higher than
previous estimates.5 At the same time, our figure for loan defaults is an order of magnitude lower
than retirement plan leakage due to account cash-outs upon job change, which the GAO (2009)
reported at $74 billion in 2006. The small relative size of loan defaults is relevant to the policy
question about whether and how retirement account leakage might be further restricted by law
(Leonard, 2011). Finally, we consider whether the 2008-09 economic turmoil changed 401(k)
plan borrowing and default patterns. Overall, our answer is no: participants were somewhat less
likely to borrow during the downturn, and default rates remained unchanged. One likely
explanation for no change in default patterns is that, as involuntary job losses rose during the
In what follows, Section I provides an overview of 401(k) loan rules, and Section II
reviews related studies. Section III describes the data and hypotheses. In Section IV we present
empirical results on plan borrowing and results on loan defaults in Section V. Section VI reports
our estimate of the aggregate tax revenue impact of loan defaults, and Section VII concludes.
5 GAO (2009) estimated plan loan defaults at $561 million for the tax year 2006. Yet that estimate relied on data on “deemed distributions” of loans representing a small fraction of actual loan defaults. We say more on this below.
4
I. 401(k) Loan Rules
Participant loans from 401(k) plans are subject to U.S. Treasury tax rules governing
borrowing, repayment, interest rates, and defaults, along with associated tax and penalty
consequences.6 A 401(k) loan is not a credit instrument in the conventional sense, but simply an
arrangement allowing the participant to gain access to his retirement plan accumulations under
certain conditions. First, the participant may only borrow up to half of his account balance with a
maximum loan of $50,000 (fixed in nominal terms). Second, the participant must agree at the
time of the loan to replenish the withdrawn funds plus interest in accordance with a standard flat-
dollar amortizing loan schedule, typically through payroll deduction.
Plan sponsors may also impose their own requirements, including whether 401(k) loans
are permissible at all, although as a practical matter 90 percent of active contributors have access
to a loan feature. Sponsors may also determine the number of individual loans allowed, whether
loans must be for a minimum amount (e.g., $1,000), and what the participant must repay in terms
of an interest rate. Plan and regulatory rules interact as follows. If a 401(k) plan offers a loan
feature with a minimum required loan amount of Lmin, the participant with an account balance
W401k seeking to borrow loan amount L must satisfy two conditions:
and
$50,000.
For a typical Lmin = $1,000, a participant will not be eligible to borrow until such time as his
account reaches or surpasses $2,000; at that point, he may borrow up to half of his account
balance. The 50 percent limit will be binding until the participant’s account balance exceeds
$100,000; above that, the maximum withdrawal amount cannot exceed $50,000. Some plan
6 See GAO (2009) for additional background on regulations and laws for 401(k) loans.
5
sponsors permit participants to take out multiple loans in increments L1, L2, and so on, with
∑ . Because 401(k) “loans” are not conventional borrowing arrangements but rather
represent withdrawals from one’s own savings, they are not subject to credit underwriting and
not reflected on credit reports; moreover, loan “defaults” have no credit reporting consequences.
Tax rules require a series of loan repayments PMT according to a schedule given by
∑ where the loan interest rate is i and n refers to the number of periods over which
the loan must be repaid.7 In exchange for agreeing to these repayment terms, the participant can
spend pre-tax L on consumption with no immediate income tax consequences. In other words,
when the plan loan is exercised, the participant avoids paying current taxes and the early
withdrawal penalty on the amount withdrawn from his pre-tax retirement account. At the time of
the loan (ignoring the penalty), borrowing L in pre-tax dollars and spending it is the equivalent of
earning L/(1-τ) in pre-tax wages, with a tax avoided of τL/(1-τ).
The loan repayment is taken from the participant’s after-tax salary, k(1-τ)ω, where k is a
constant 0 1 and ω is gross salary. A portion of the payment stream represents principal
repayment ∑
, where kprin is the proportion of after-tax salary directed to principal
payments. The present value of the tax liability associated with the income to generate these
principal payments is simply the avoided tax liability on the amount borrowed, τL/(1-τ),
assuming constant salary and no changes in marginal tax rates over the loan period. In other
words, the participant avoids a tax liability upon withdrawal of pre-tax savings, but then pays a
7 Most loans are general purpose, with a maximum loan term of 60 months. Loans for purchase of a principal residence, which require documentary evidence of a home purchase, have a maximum term of 360 months. Interest rates are set according to the terms of the plan.
6
subsequent tax liability through repayment with after-tax wages. The two effects net to zero, at
least with respect to principal repayments.8
The plan borrower also pays interest ∑ , where kint is the proportion
of after-tax earnings devoted to interest. These payments are unlike the traditional cost of credit,
in that the participant is effectively repaying himself; hence a higher interest rate leads to more
rapid replenishment of borrowed funds. The interest payments are deposited to the participant’s
as if they were pre-tax plan accruals. At the time the plan loan is fully repaid, the interest
component is worth INT(1+i)n; in another N years, at the time of withdrawal in retirement, and
assuming an account rate of return r, it will be worth INT(1+i)n(1+r)N(1-τN), where τN is the tax
rate when the retiree receives benefit payouts. In effect, the interest associated with the loan
repayment at the time of future withdrawal will be double-taxed: at tax rate τ when after-tax
salary is contributed in the form of interest repayments, and at τN when the interest payments are
withdrawn in the form of retirement benefits.
In this way, participants who borrow from their 401(k) plans face two costs associated
with the loan interest rate. First, because loan interest payments derive from the employee’s
after-tax salary, the loan interest component is subject to double taxation. Second, the interest
repaid to the participant’s account i may be lower than the rate of return r earned on the account
had the monies remained in other investments.9 This relative opportunity cost, r-i, plus the cost
of double interest taxation, can also be compared to the interest rate the participant would have
paid to a third party financial intermediary, had he borrowed through conventional means. In
8 As a simple example, a participant in the 25% tax bracket borrows $1,000. The equivalent pre-tax income needed to generate $1,000 in after-tax spendable income is $1,000/.75 or $1,333, for a tax avoided at the time of borrowing of $333. In the repayment phase, the participant must provide $1,000 in after-tax wages to the account, requiring $1,333 in gross income, or an associated tax liability of $333. The tax avoided and the tax paid net to zero. 9 Of course the loan interest rate could be higher than investment asset return r in periods of lower investment returns.
7
most circumstances, the opportunity cost and double taxation of interest in a 401(k) loan will be
less than the cost of paying all interest to a financial institution.10
Finally, when the borrower leaves his job, at that time any remaining balance due on a
401(k) loan, Lbal, typically converts to a balloon payment. If a plan borrower leaves his job and
does not repay Lbal within 60-90 days, the participant loan is considered “in default” and is
reported to the IRS as a taxable distribution from the plan at that time, resulting in tax liability
Lbal(τ+.1). In other words, the 10 percent penalty is imposed on the amount borrowed if it is not
returned to the account. It is worth noting that τ 0 for many low- and middle-income households
today, due to a variety of tax credits, so the expected cost of default may be simply 0.1Lbal. 11
II. Prior Studies
Several prior studies have addressed the question of whether pension saving increases
total saving,12 but relatively few authors have examined whether the presence of a loan feature
encourages employees to contribute to their 401(k) plans. One group (GAO, 1997) suggested
that a loan feature can raise both participation and contribution rates, while others have observed
that the loan feature influence savings mainly on the intensive margin, in the form of higher DC
plan contribution rates (Munnell, Sunden, and Taylor, 2001, 2002; Holden and Vanderhei, 2001;
Mitchell, Utkus, and Yang, 2007).
10 While 401(k) borrowers are taxed twice on the interest they pay to their plan account, it should be noted that had the participant borrowed from a commercial lender the equivalent “tax” is 100% of the interest paid. 11 The rules on loan issuance and repayment are somewhat more complex than summarized here. For example, the plan sponsor can also limit borrowing. Also the period for repaying a loan can vary by plan but cannot exceed the end of the calendar quarter following the quarter in which the participant terminates employment. Some employers also allow repayment of loans from participant bank accounts during the loan period or on job termination. Participants usually have the right to repay a loan balance at any time. 12 For instance, both Benjamin (2003) and Gelber (2011) report that people eligible to participate in company 401(k) plans save more inside and outside their retirement plans. Using Danish data, Chetty et al. (forthcoming) found little evidence of crowd-out for the 85% of the population they deemed “passive”, who saved more when their plan provided for automatic contributions.
8
Using data from the Federal Reserve Survey of Consumer Finances, Sunden and Surette
(2000) and Li and Smith (2010) noted that the individuals borrowing from their 401(k) accounts,
while having higher DC account balances, were more likely to have lower total financial assets,
to have higher debt, and to be more credit-constrained. Considering liquidity constraints and
borrowing in a related context, Gross and Souleles (2002a, 2002b) concluded that credit card
borrowers exhibited “buffer stock” behavior—that is, they tended to not borrow to the maximum
amount available, so as to leave a margin in case of emergency. The authors reported credit card
interest rates averaging 16 percent, compared to, for example, an average 401(k) loan interest
rate of just over 7 percent in our dataset (about which we say more below). This large difference
in borrowing rates would seem to imply that employees would do well to substitute lower-cost
401(k) loans for much higher-cost credit card debt. Yet Li and Smith (2010) also found that
many individuals held substantial credit card debt even when a plan loan would have been less
expensive. They suggested that this seemingly illogical behavior might be shaped by financial
advisers’ negative views of 401(k) loans,13 along with a mental accounting perspective, namely
that 401(k) accounts might be thought of as restricted for retirement purposes rather than to be
used for current consumption.14,15
In a study most closely related to ours, Beshears, Choi, Laibson, and Madrian (2011)
used participant-level administrative data. They reported finding a hump-shape age profile for
the incidence of 401(k) borrowing, but that study did not evaluate default behavior nor the role
of plan-level policy on behavior. Our administrative data permits us to model firm-specific loan
13 Suze Orman, host of CNBC’s “The Suze Orman Show” has been quoted at stating “It makes no sense in any circumstance to take a loan from a 401(k)” (Jansing, 2013). 14 Financial literacy may also play a role: using survey data, Utkus and Young (2011) found that workers with lower levels of financial literacy were more likely to borrow from their DC accounts. Lusardi and Mitchell (2007) discuss how financial illiteracy influences retirement savings. 15 In non-pension settings, Ayres and Nablebuff (2008) have argued that it is optimal for young people to buy stocks on margin. Hurst and Willen (2007) found that young households were sufficiently constrained that permitting them to use Social Security wealth to pay off debt could be welfare-enhancing.
9
policy, including minimums and number of loans allowed, and its effect both in terms of
participant loan-taking, such as in a buffer-stock model, and in defaults.16
III. Data and Testable Hypotheses
Data. Our analysis uses a rich administrative dataset for DC plan participants covering the five-
year period of July 2004 through June 2009.17 The dataset includes 882 different 401(k) or
similar-type DC plans. To assess the propensity to borrow, we use a time-varying sample of over
900,000 participants observed monthly, with total observations exceeding 55 million. In this
sample we observe on average over 13,000 new loan-takers per month, for total observations on
new borrowers exceeding 780,000. The data elements include participant demographic and
financial characteristics, along with plan characteristics. The data set is unique in terms of the
extent of information on workers, their plans, and their loan and default behavior.
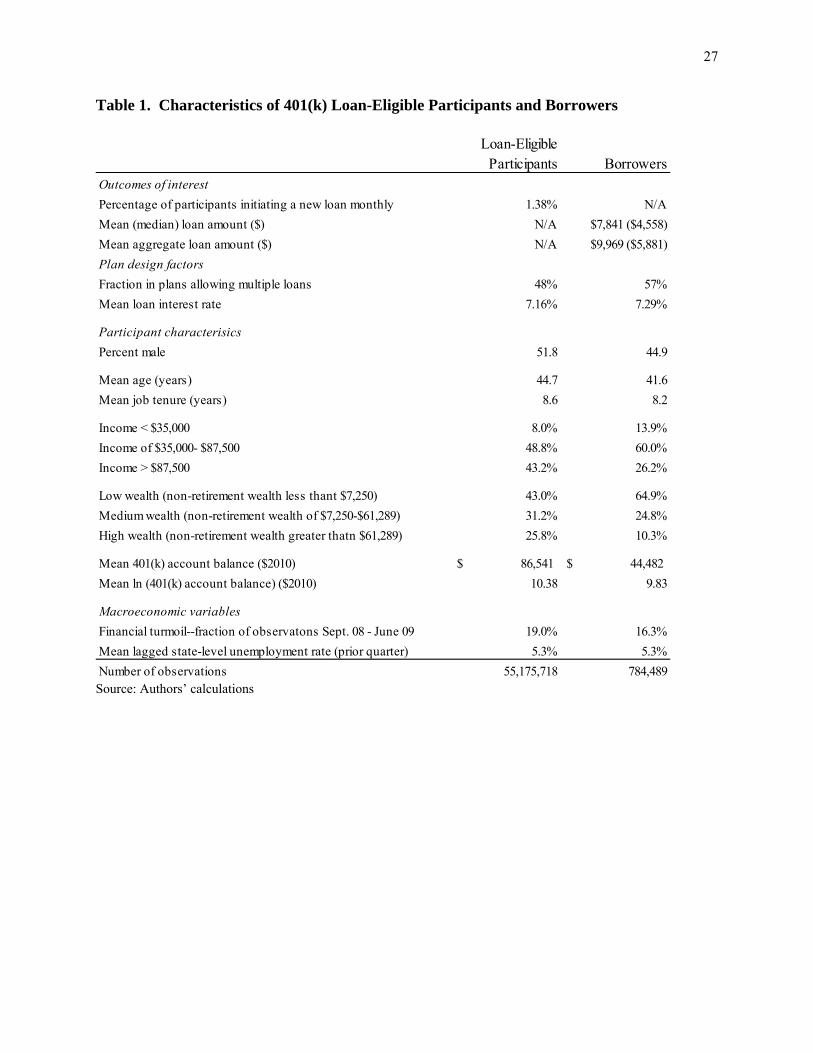
Table 1 shows that in any given month an average of 1.38 percent of eligible participants
took a new loan. The average individual loan amount borrowed is just over $7,800 (in $2010),
with a median of nearly $4,600; the mean total amount borrowed is around $10,000, with a
median of about $5,900. The average age of borrowers is 42, slightly younger than the average
participant; borrowers have about eight years of tenure and somewhat lower income, lower non-
retirement financial wealth, and half the plan account balance compared to all loan-eligible
participants. Borrowers are also more likely to be in plans where multiple loans are allowed.
During the period of the global financial crisis, which we define as September 2008 through June
2009, fewer participants borrowed from their retirement account. Loan interest rates vary by
16A related body of work considers the use of lump-sum distributions from 401(k) plans, whether penalized or not; see Basset, Fleming and Rodrigues (1998), Burman, Coe and Gale (1999), Sabelhaus and Weiner (1999), and Amromin and Smith (2003). 17 The data were provided by recordkeeper Vanguard under restricted access conditions, and the identity of individual firms and plan participants is masked.
10
plan, though many plans peg the interest rate to the prime rate plus 1 percent. Loan interest rates
are only modestly higher for borrowers than for the entire participant sample.
Table 1 here
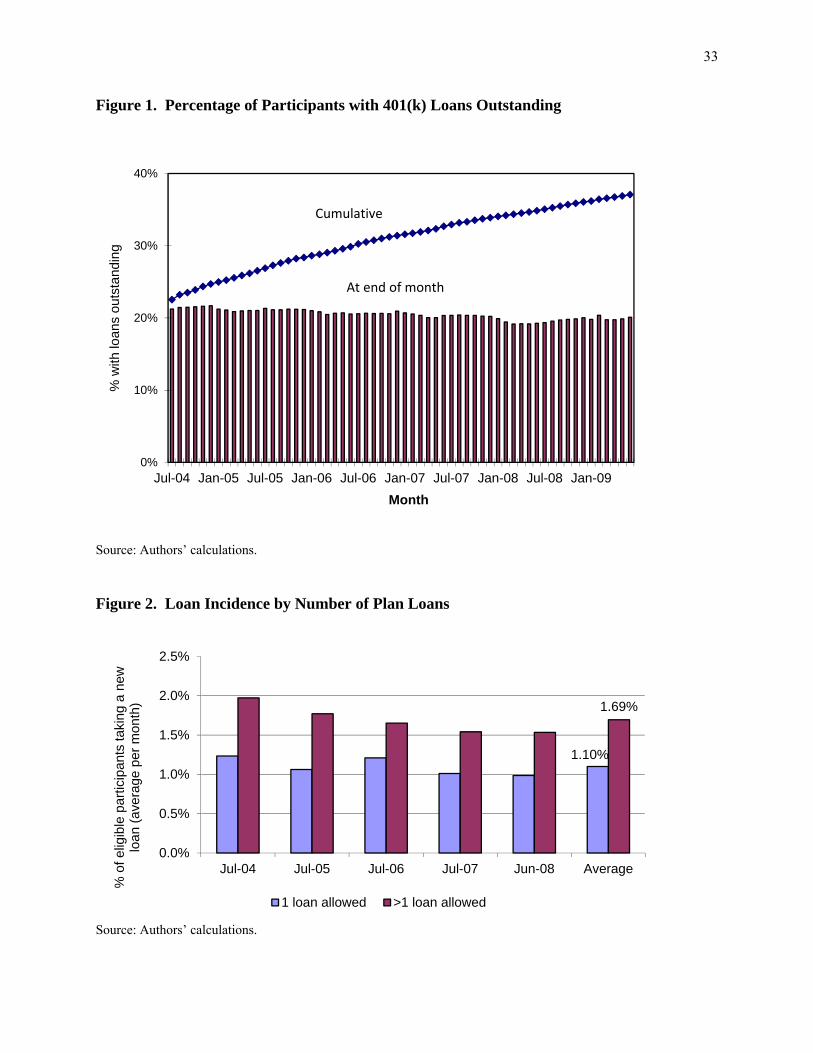
Figure 1 illustrates the current and cumulative percentage of loan-eligible participants
with one or more outstanding loans. Over time, approximately 20 percent of active participants
have loans outstanding. In other words, the rate of loan origination is approximately offset by
the rate of loan repayment or default. Over the five-year period of our study, the cumulative
proportion of participants with any borrowing from their retirement plan rises to nearly 40
percent. This suggests that instead of the same participants taking plan loans repeatedly, over a
longer time horizon a greater fraction of participants eventually borrows from their retirement
accounts.
Figure 1 here
Figure 2 highlights the impact that employer plan design may have on participant
borrowing. Figure 2 presents the mean proportion of new loan-takers over our five-year period,
comparing plans offering a single loan with those allowing multiple loans. When only one loan
is allowed, an average of 1.10 percent of eligible participants take a new loan each month. With
multiple loans, the average rises to 1.69 percent per month.
Figure 2 here
Hypotheses. To elucidate the factors that might affect plan borrowing and default behavior, we
note that a lifecycle model would predict that borrowing is higher early in life, and then it will
decline with age. This is because younger, lower-paid, and lower-wealth households are the most
liquidity-constrained and hence more likely to need to borrow. Nevertheless in the case of 401(k)
plans, borrowing is conditioned on an employee’s account balance which rises with age, salary,
11
and other factors. Ceteris paribus, therefore, we would anticipate a hump-shared age profile for
borrowing since the ability to borrow rises with age, but the demand for plan borrowing falls
with age. Liquidity constraints are also associated with loan borrowing and default behavior.
Liquidity-constrained households would be more likely to rely on 401(k) borrowing, and more
likely to default upon job termination, since the outstanding balance accelerates as a balloon
payment. In the empirical analysis below, therefore, we test the hypothesis that age, salary levels,
account balances, and non-retirement wealth are associated with borrowing and default patterns
in the expected directions.
We also examine whether plan features have an influence on plan loans and defaults. As
noted above, a buffer-stock model implies that borrowers will seek to remain under the
maximum borrowing limit to allow for potential future consumption shocks. In our dataset, 40
percent of plans (covering 52 percent of participants) permit employees to take out two or more
loans simultaneously. Accordingly, the buffer-stock hypothesis predicts that participants in those
plans will be more likely to have loans outstanding, since they may take additional loans if
needed. Yet all else equal, the size of individual loans in plans permitting multiple loans will be
lower, compared to when the plan allows only one loan. The availability of multiple loans may
also be seen as an employer endorsement of plan borrowing (Benartzi, 2001). If this is true, we
would expect that aggregate loan amount will be higher when multiple loans are permitted.
Turning to interest rates charged for 401(k) plan loans, the expected effect is ambiguous.
On the one hand, the higher the interest rate charged, the higher is the loan cost to the worker in
after-tax salary. Yet the interest is paid to the worker’s own account, and so a higher interest rate
improves future savings. Ultimately it is an empirical question, since depending on the
12
borrower’s discount rate, the cost of plan loan borrowing may have little net effect on loan
patterns.
Another issue we explore is whether plan borrowing and loan default rates changed
materially during the financial crisis of 2008-09. With respect to borrowing, the predicted
impact of the crisis is also ambiguous: on the one hand, employees may have become more
cautious and borrowed less, but on the other hand, they might have sought additional loans due
to financial insecurity or household financial shocks. Regarding defaults, there are again two
competing effects: voluntary job changes tend to fall during economic recessions, reducing the
incidence of default, but involuntary job losses rise, raising the risk. Again, empirical analysis is
required to discern the net effect.
IV. An Empirical Analysis of 401(k) Borrowing and Loan Size
We investigate borrowing patterns from 401(k) accounts using a multivariate model of
where BORROWi,j,t refers to a vector of several outcomes including the probability of borrowing,
the size of new loans, and the total amount borrowed by the ith participant in the jth plan in
month t. We examine all loan-eligible participants, defined as those having assets at least twice
the minimum loan amount set by the plan and not otherwise subject to any other IRS or plan
limit (whether in terms of dollar or number of loans allowed). The PARTICIPANTi vector refers
to participant characteristics including age, sex, tenure, income, account balance, and non-
retirement household wealth. The PLANj vector includes includes a flag for whether the plan
permitted multiple loans, the loan interest rate, and plan size (number of plan participants); we
13
also control on the employer’s main industry. The MACROt vector controls for two
macroeconomic factors: the lagged three-month average state-specific unemployment rate, and a
flag indicating the financial crisis period of September 2008-June 2009.18 Finally, we cluster
observations at the plan level for robust standard errors.19
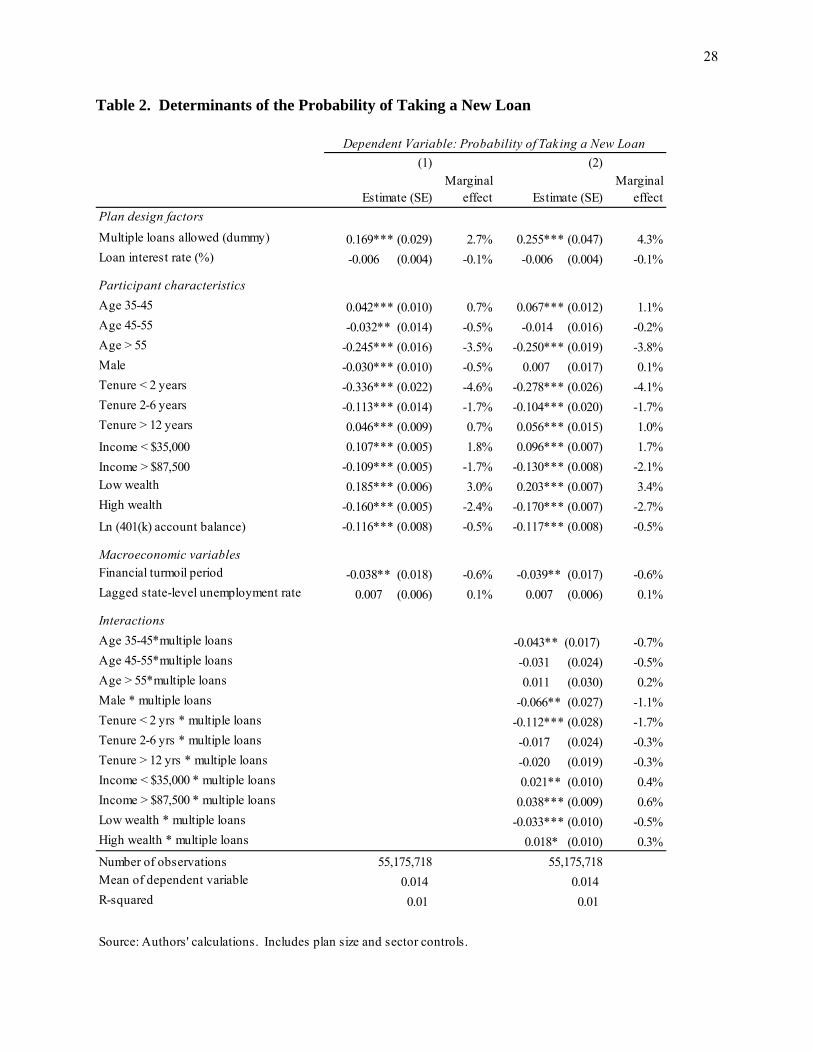
Our first dependent variable evaluated refers to the probability of taking a new loan in
month t, estimated using Probit; as indicated in Table 2, the mean value is 1.4 percent per month.
A streamlined model in Column 1 is supplemented with interactions between multiple loan
availability with participant demographics in Column 2. In both cases, one plan feature is
particularly salient: namely the ability to take more than one plan loan at a time. Specifically,
when a plan sponsor allowed employees to take out multiple loans, the probability that
participants took a new loan rose by 2.7 percentage points. Since the mean probability of taking a
new loan was 1.4 percent, allowing multiple loans boosted the loan take-up rate by nearly twice.
By contrast, loan interest rates had no material effect on borrowing patterns. Since our
dataset included wide variation in interest rates (the low was 1.8 percent and the high was 11.5
percent), the result is quite robust. We therefore conclude that 401(k) loan demand was relatively
unrelated to the cost of the loan as a result of the interplay between the reduction in current take-
home pay from loan repayment, the rate of replenishment of the account through the loan interest
rate, and the borrower’s discount rate. High discounters who may have been more sensitive to
the effects of the loan on take-home pay were apparently offset by low discounters more willing
to borrow because of the benefits of the higher interest rate for future savings.
18When a participant defaults on an outstanding loan, the default is typically recorded at the end of the quarter following the quarter in which the job termination occurs. We therefore use the prior three-month average unemployment rate at the state level as a regressor, lagged by one month. We also experimented with a simple three-month lagged unemployment rate, the one-month lagged rate, and the current month rate as robustness checks, with results similar to those reported below. 19 Computer limitations preclude clustering at the participant level for the entire sample. When we did so for a subset of observations, as a robustness check, results are similar to those reported here.
14
Table 2 here
Other results in Table 2 are also of interest. As hypothesized, participants were more
likely to borrow from their 401(k) plans when they had lower income, fewer non-retirement
financial assets, and a lower plan account balance; these are the most liquidity-constrained
participants. There is also an inverted U-shape age pattern by age, with middle-aged participants
age 35-44 being more likely to borrow compared to their younger and older peers. Short-tenured
workers were also less likely to borrow, suggesting that familiarity with the loan feature grows
with job tenure and time in the plan. We are also interested in whether plan borrowing ramped up
during the financial crisis, but the evidence suggests the opposite: during the turmoil period,
participants were 0.6 percentage points (or 41 percent) less likely to take a new loan.20 One
reason is that plan borrowing tends to be tied to home improvements and purchases (Utkus and
Young, 2011), so the housing bust may help explain why 401(k) borrowing fell.
The interaction terms in Column 2 of Table 2 also confirm some of the hypotheses
described above. First, participants who were younger or held less non-retirement wealth were
more likely to borrow in plans allowing multiple loans. In particular, participants below age 35
(the reference category) were 0.7 percentage points (or 50 percent relative to the mean) more
likely to take a plan loan, when multiple loans were permitted. Furthermore, when the plan
allowed more than one loan, low-wealth participants were 0.5 percentage points (or 38 percent)
more likely to borrow from their own accounts, compared to those with medium wealth, the
reference category. There is also evidence that higher-income households were more likely to
borrow.
20 This result confirms findings reported by Vanderhei et al. (2012) using a different dataset; they observe that loan activity did not change much over the period 1996 to 2011.
15
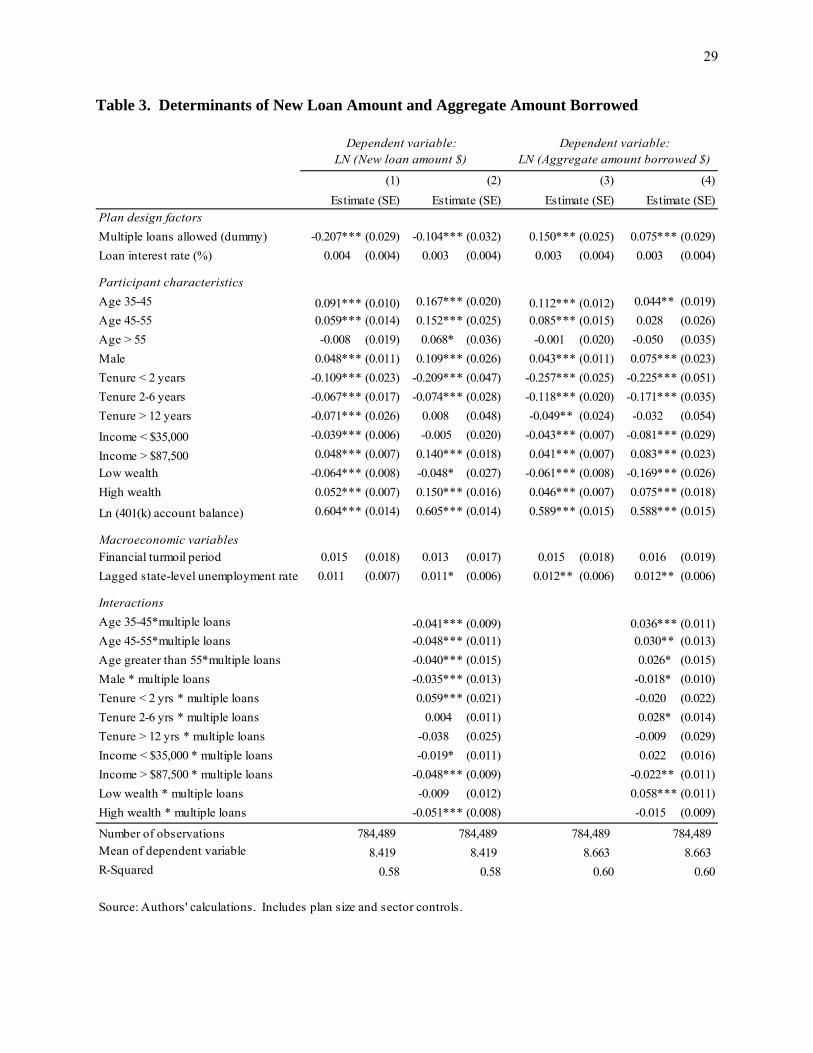
Next we turn to the intensive margin of borrowing, examining both the size of new loans
taken, and also the aggregate of all plan borrowing. Table 3 reports estimation results using
multivariate ordinary least squares (OLS) models. Columns 1-2 examine the size of the new loan
amount (in natural logs), with a mean of 8.419 (or $4,532). Columns 3-4 focus on the total
amount borrowed (in natural logs), with a mean value of 8.663 (or $5,785). Because we control
on participants’ current 401(k) account balances, these results may be interpreted as the relative
proportion borrowed from participants’ total accounts, for new loans or the total amount
borrowed.
Table 3 here
Previously we showed that whether the plan permitted multiple loans strongly influenced
the probability of borrowing, and this again proves significant in our results for the sizes of
amounts borrowed. When a plan allowed multiple loans, Column 1 indicates that each individual
loan was smaller by 19 percent. 21 This result is directly supportive of the buffer stock
hypothesis, where people use the loan as protection against consumption shocks. Once again, the
plan loan interest rate is not statistically significant.
Mirroring the results on the incidence of loans, there is a hump-shaped pattern with age,
with the largest loans (as a fraction of account wealth) taken by participants who were age 35-44.
Although less likely to borrow in the first place, the better-off (those with higher income and
greater non-retirement financial assets) were more likely to take larger loans. One reason may be
that better-off households have greater non-plan resources to repay the loan and so are more
willing to borrow. Another possibility is that better-off households understand that 401(k) loan
interest rates are generally more favorable than commercially available borrowing rates. We also
find that those with little non-retirement wealth were less likely to have higher total 401(k) 21 The log mean of 8.419 declines by -0.207; in linear terms, the mean of $4,532 declines to $3,685 or 19 percent.
16
borrowings. The financial crisis did not affect loan amounts suggesting that, conditional on a
lower level of borrowing during the crisis noted above, proportions borrowed remained the same.
State-specific unemployment rates had negligible effects.
Coefficient estimates on the factors associated with participants’ total amounts borrowed
appear in Columns 3-4 of Table 3. Most strikingly, the availability of multiple loans raised total
borrowing in Column 3 by 16 percent in contrast to our earlier finding that individual loan
amounts were lower under this plan provision.22 An explanation for this difference is that the
availability of multiple loans may serve as an employer endorsement effect (Benartzi, 2001): that
is, employees may perceive an option to take multiple loans as reflective of employer
encouragement to do so. The age pattern of loans also differs in this column, compared to results
in Column 1. Column 4 shows that in multiple loan plans, participants 35 and older were likely
to borrow larger amounts than younger participants, by around 11 percent more. In other words,
when plan sponsors permit multiple loans, younger workers take more in an initial loan (Column
2), but those age 35 and older borrow in total a higher fraction of their retirement account wealth
(Column 4).
V. An Empirical Analysis of Loan Defaults
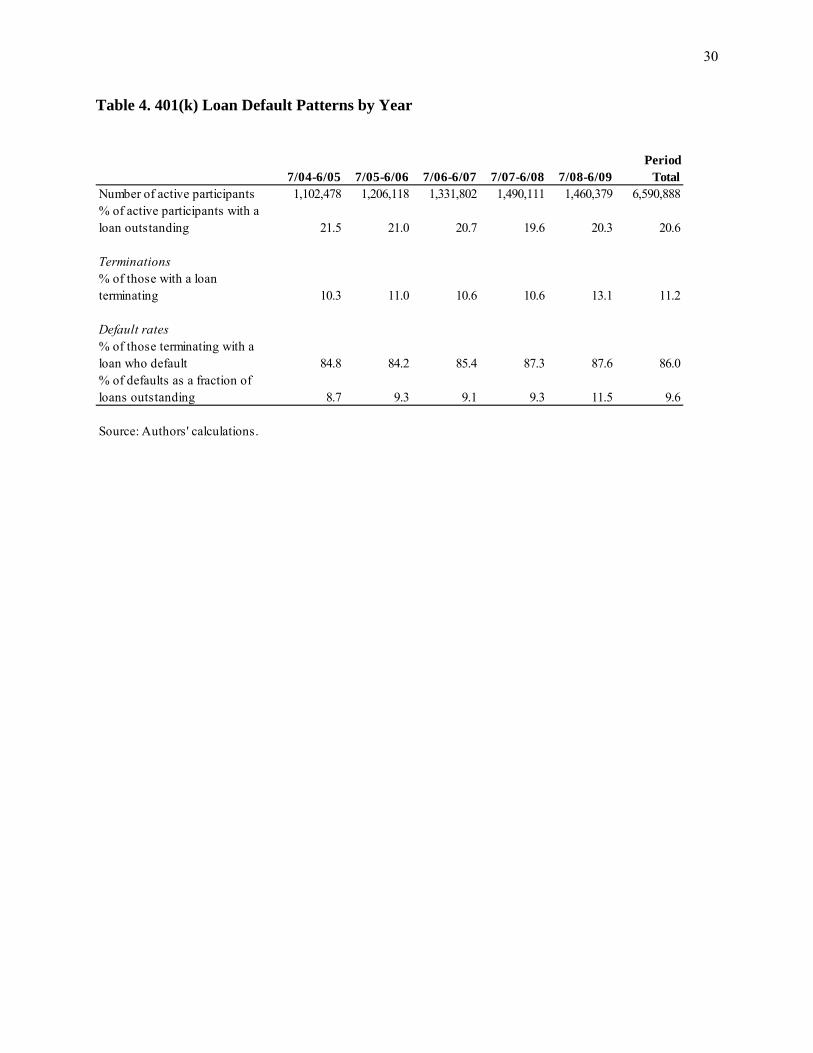
Next we explore the determinants of 401(k) loan defaults. Table 4 provides summary
statistics on default rate patterns. As noted above, around 20 percent of loan-eligible employees
in our sample had one or more loans outstanding. Of the borrowers terminating employment, 86
percent on average failed to repay the outstanding balance due on their loans; the remainder did
pay off their account loans and hence avoided default. Since participants defaulting on their
outstanding loan balance totaled about around 10 percent of all participants with an outstanding 22 The log mean of 8.663 rises by 0.150; in linear terms, the loan value grows from $5,785 to $6,721, or 16 percent.
17
loan, we conclude that about 90 percent of participants repaid their loans over the period we
observe them.23
Table 4 here
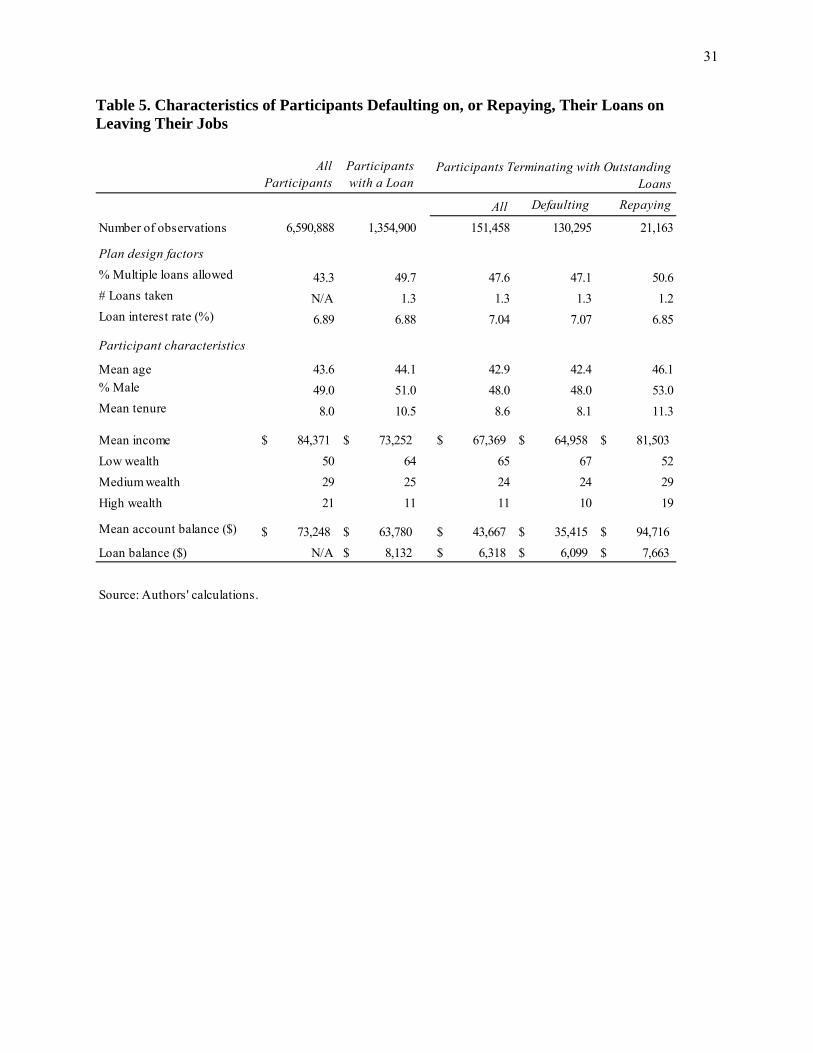
Sample statistics on participants who defaulted versus repaid their loans appears in Table
5, as compared to all borrowers and all loan-eligible participants. The default analysis sample
includes 151,458 401(k) plan participants terminating employment with at least one loan
outstanding. 24 Compared to other plan borrowers, those who terminated employment with a loan
outstanding were somewhat younger, had shorter job tenure, and held lower plan balances. Those
who defaulted on their loans also had lower income, lower 401(k) balances, and less non-
retirement wealth than those who repaid their loans on job termination.
Table 5 here
To analyze loan defaults, we focus only on participants whose jobs terminated while they
held a plan loan.25 The goal is to compare employees who terminated employment and defaulted
on their 401(k) loans, with those terminating employment who repaid their loans in full. We
estimate a multivariate Probit model where the dependent variable, Di,j,t, refers to the probability
23 Ninety-five percent of the loans in our sample are general purpose loans with a maximum term of five years. For this reason our five-year sample period offers a reasonable view of steady state default rates over time, though default rates might vary under different economic conditions. 24 We exclude plans that changed record-keepers during the five-year period and also exclude participants associated with any "divisional transfer outs" during the period (e.g., when a division is sold and participant accounts are moved to another recordkeeper). We model a "divisional transfer-out” rule for each plan by calculating the monthly average number of participants terminating with a loan outstanding. If in a given month, the number of participant terminations exceeds 100, and it exceeds two times the average monthly plan terminations, we code the plan as having a “divisional transfer-out” that month and delete observations for those participants. In addition to IRS loan maximums, some employers impose their own more restrictive rules. Accordingly we eliminated 41 plans where no participant borrowed at the 50 percent limit over the five-year period. Borrowers who terminated employment with multiple loans outstanding are counted as a single observation. Fewer than 2 percent of terminating participants with outstanding loans paid off a portion of the outstanding loans and then defaulted on the remainder. 25 Approximately 10% of plan sponsors permitted terminated plan participants to continue to repay their plan loans. However, among Vanguard participants terminating with a loan in plans offering this feature, only 5 percent took advantage of this feature (authors’ calculation).
18
of the individual defaulting; the mean of the dependent variable is 86 percent. Regressors are
identical to those in our previous examinations of loan probabilities and amounts borrowed.
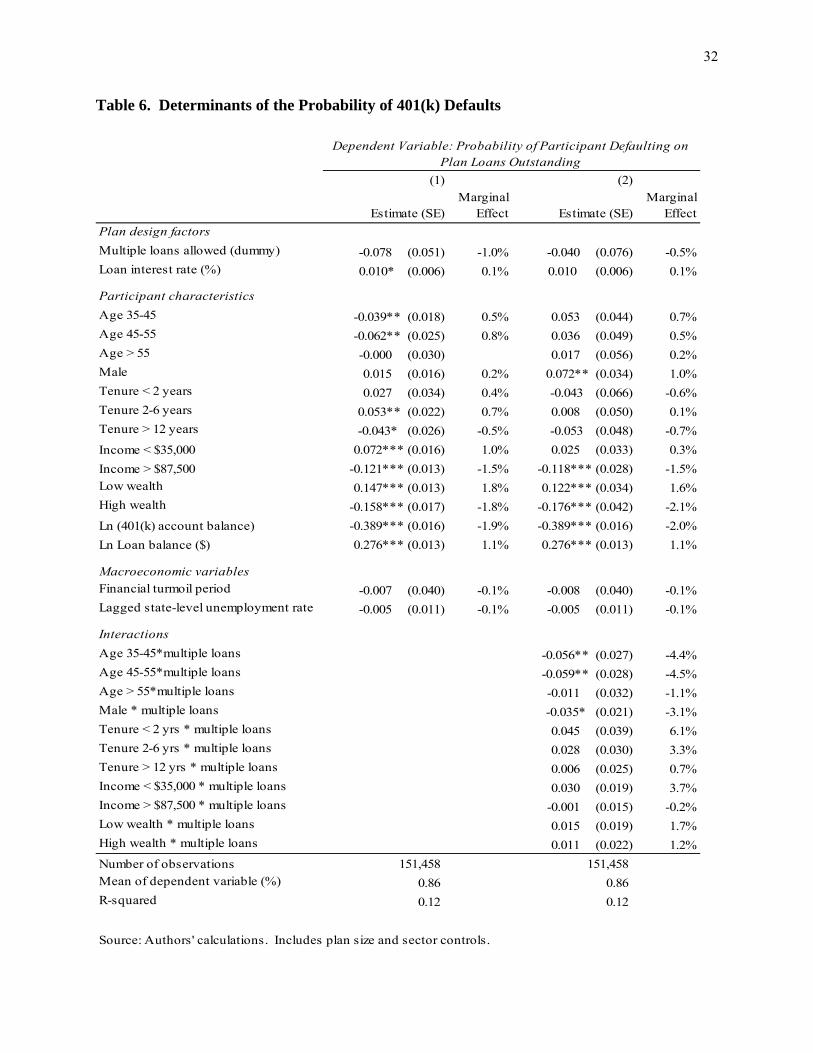
Results for the analysis of loan default patterns appear in Table 6. Unlike before,
allowing participants to take multiple loans had no influence on default rates. There are several
statistically significant effects in Column 1—young, low-income and lower nonretirement wealth
workers were more likely to default—but these are economically small relative to the mean
default rate. Our results are consistent with a model of liquidity-constrained participants unable
to repay the outstanding loan balance upon job change. In Column 2 several interaction effects
are significant, but the main effect on multiple loans is not. Loan interest rates were not
statistically significant, nor were the financial crisis flag or our measure of local labor market
conditions.
Table 6 here
Overall, few of the control variables included in the model have economically
meaningful impacts on the mean default rate of 86 percent for those who leave their jobs with a
401(k) loan outstanding. Since default rates are rather widespread among those who leave their
jobs with a loan outstanding, this could suggest that other unobserved factors, such as financial
illiteracy, discounting, or lack of self-control, could be driving consumer behavior regarding
pension loan defaults.26 In our context, this could mean that many employees who borrow from
their plans are simply unaware of the consequences of job termination for their 401(k) loans.
26 In other contexts, these factors do appear to play a role. For instance the least financially savvy cannot report how much debt they hold (Lusardi and Tufano (2009), and Agarwal and Mazumder (2013) show that financial mistakes are most prevalent among the least cognitively adept. Also present-biased people are more likely to have credit-card debt, as well as higher levels of debt, than those with lower discount rates (Meier and Springer 2010). And Mastrobuoni and Weinberg (2009) find some Social Security beneficiaries suffer from low self-control, resulting in low saving.
19
VI. Aggregate Loan Leakage
In recent years there have been policy recommendations to restrict plan leakage, mostly
in the form of proposed legislation.27 In this light, it is of interest to use our results to estimate
the aggregate amount of loan default leakage flowing from 401(k) plans annually.
The main source of data on this question to date has been the Private Pension Plan
Bulletin, an abstract of the Form 5500 Annual Reports which retirement plans must file with the
Employee Benefits Security Administration of the US Department of Labor (US DOL 2012).
One item reported in this document refers to the “Income Statement of Pension Plans With 100
or More Participants” and it lists the amount of “deemed distribution of participant loans.” Some
analysts have incorrectly interpreted this amount as representing the total amount of loan
defaults. 28 Nevertheless, this number actually measures loan defaults only for active plan
members due to temporary lay-off, long-term disability, maternity leave, or a leave of absence
such as parental leave. Loan defaults due to job termination are instead recorded as “offsets” to
participants’ account balances at the time of default, reported as “direct benefit payments” in the
US DOL’s nomenclature.
In our dataset, only eight percent of the loan defaults observed were “deemed” loan
distributions; the remaining 92 percent resulted from defaults on job termination (the latter being
the focus of the analysis above). Accordingly, data on “deemed distributions” dramatically
understates the total value of loan defaults. Applying our sample fractions to the entire private
401(k) system indicates that aggregate system-wide loan defaults are on the order of $6 billion
27For example, U.S. Senators Kohl and Enzi proposed the 2011 Savings Enhancement by Alleviating Leakage in 401(k) Savings Act (SEAL Act). In their press release the Senators remarked that “[a] 401(k) savings account should not be used as a piggy bank” (Leonard, 2011). 28 This number is reported in the GAO estimate of loan leakages (GAO, 1997).
20
per year, or ten times the $600 million in “deemed” loan distributions.29 Assuming an effective
tax rate of 10 percent and factor in the 10 percent penalty associated with early distributions, we
estimate that the total tax revenue flowing to the U.S. Government associated with defaulted DC
plan loans to be over $1 billion per year, small by comparison to the U.S. Government’s annual
total revenue of $2.7 trillion. Moreover, though loan default amounts have been understated in
prior studies compared to our estimates, they are still much smaller than the leakage from
account cash-outs on job termination of $74 billion (in 2006; GAO 2009).
VII. Conclusion and Implications
DC retirement accounts represent a growing fraction of US households’ retirement assets.
As we have shown, such accounts are dual-purpose, being used both to finance old-age
retirement security and current consumption. A loan feature is one of the prominent pre-
retirement liquidity elements within 401(k) plans used for current spending.
In our rich administrative dataset, we show that a fifth of plan participants borrow at any
given time, while almost 40 percent do so over a five-year period. The effects of plan loan policy
are meaningful. When plans allow participants to take out multiple loans, participants are more
likely to borrow in the first place. This is suggestive of a buffer-stock model also found among
credit card borrowers. In other words, given the ability to borrow multiple times, workers are
more willing to take the first loan, given that they retain slack borrowing capacity for future
spending needs. There is an ever more pronounced behavioral effect from plan loan policy. In
29 During our five year period, we see about 130,000 loan defaults with an aggregate annual defaulted loan balance of around $0.156 billion. In 2006 there were 58.4 million active 401(k) participants (US DOL 2013), and assuming 90 percent had access to plan loans, this implies that about 52.5 million workers were eligible to take 401(k) loans that year. Extrapolating from our 1.3 million person sample provides an estimate of $6.3bn for total 401(k) annual defaults. Alternatively, if we were to use a count of 65.8 million participants for all private DC plans, this would raise the estimate to $7.1bn, although it is unclear whether plan borrowing in non-401(k) plans is as high as in 401(k) plans.
21
multiple-loan plans, participants borrow greater amounts, and so appear to view multiple-loan
option as an employer endorsement of borrowing. Although our paper did not explicitly evaluate
a Modigliani-like proposal for a 401(k) credit card, one concern about enhancing 401(k) access
is that it might boost this endorsement effect.
Participant borrowing from 401(k) accounts follows a hump-shaped age pattern, peaking
at age 35-44, both in terms of incidence and the fraction of account wealth borrowed. We also
find that liquidity-constrained participants (low income, low nonretirement wealth) are more
likely to borrow, though better-off households (high income, high nonretirement wealth) tend to
borrow the largest fractions of their retirement accounts when they do borrow. During the
financial crisis, the tendency to borrow fell, although among those who did borrow, the amount
borrowed did not change.
With our dataset we are uniquely able to assess loan default patterns. We show that nine
of 10 loans are repaid, yet when workers who have an outstanding loan balance terminate
employment, 86 percent of them default on their loans. Although more liquidity-constrained
participants are more likely to default, the size of these effects is small relative to the high default
rate broadly. This result implies that other factors, such as low financial literacy, impatience, or
inattention, may be at work: many borrowers appear surprised by an unanticipated job change or
its effect on an outstanding loan. Using our dataset we also estimate the aggregate effect of loan
defaults on retirement savings at approximately $6 billion per year. This estimate is larger higher
than previous estimates, which relied on incomplete data, yet it is much smaller than retirement
plan leakage due to account cash-outs on job termination.
Our research will be of interest to policymakers and plan sponsors seeking to evaluate the
effectiveness of pre-retirement access features in U.S DC retirement plans. The fact that many
22
workers do borrow from and some default on their plans has led some to argue that 401(k) loans
should be restricted.30 Based on our results, those concerns seem overstated, particularly when
compared to leakage from account cash-outs. We do, however, find that limiting the number of
loans to a single loan would reduce the incidence of borrowing and the fraction of total wealth
borrowed, thereby reducing the impact of future defaults. Another option might be to further
limit the size and scope of loans, for instance allowing participants to borrow only a quarter of
their account balances. These findings underscore the fact that DC retirement accounts are
intended mainly for old-age financial security, although they do offer pre-retirement liquidity to
meet current consumption needs.
30 For instance, see Reeves and Villareal (2008), and Weller and Wenger (2008).
23
References
Agarwal, Sumit and Bhashkar Mazumder. (2013). “Cognitive Abilities and Household Financial Decisions. American Economic Journal: Applied Economics. 5 (1): 193-207.
Argento, Robert, Victoria L. Bryant and John Sabelhaus (2013). “Early Withdrawals from
Retirement Accounts During the Great Recession.” Finance and Economics Discussion Series Paper 2013-22. Board of Governors of the Federal Reserve System (U.S.).
Amromin, Gene and Paul Smith (2003). “What Explains Early Withdrawals from Retirement
Accounts? Evidence from a Panel of Taxpayers.” National Tax Journal. 56 (3):595-612.
Ayres, Ian, and Barry Nalebuff (2013). “Diversification Across Time.” Journal of Portfolio
Management. 39(2): 73-86. Bassett, William F., Michael J. Fleming and Anthony P. Rodrigues (1998). “How Workers Use
401(k) Plans: The Participation, Contribution and Withdrawal Decisions.” National Tax Journal. 51(2): 263-89.
Benjamin, Daniel J. (2003). “Does 401(k) Eligibility Increase Saving? Evidence from Propensity
Score Subclassification.” Journal of Public Economics 87, 1259-1290. Behears, John, James J. Choi, David Laibson, and Brigitte C. Madrian. (2011). “The
Availability and Utilization of 401(k) Loans.” NBER Working Paper No. 17118.
Benartzi, Shlomo (2001). “Excessive Extrapolation and the Allocation of 401(k) Accounts to Company Stock.” Journal of Finance. LVI (5): 1747-1764.
Burman, Leonard E., Norma B. Coe and William G. Gale (1999). “Lump Sum Distributions from Pension Plans: Recent Evidence and Issues for Policy and Research.” National Tax Journal. 52(3): 553-62.
Chetty, Raj, John N. Freidman, Soren Leth-Petersen, Torben Heien Nielsen, and Tore Olsen.
(forthcoming). “Active vs Passive Decisions and Crowd-Out in Retirement Savings Accounts: Evidence from Denmark.” Quarterly Journal of Economics.
http://www.cbo.gov/publication/44172 Fletcher, Michael A. (2013). “401(k) Breaches Undermining Retirement Security for Millions.”
Washington Post. January 14. http://www.washingtonpost.com/business/economy/401k-breaches-undermining-retirement-
security-for-millions/2013/01/14/f54a0e90-5e70-11e2-8acb-ab5cb77e95c8_story.html Frasch, Kristen B. (2009). “Borrowing From 401(k)s.” HR Online.com, June 8.
GAO (1997). 401(k) Pension Plans - Loan Provisions Enhance Participation but May Affect
Income Security for Some. GAO Report. Washington, DC: GAO. GAO (2009). Policy Changes Could Reduce the Long-Term Effects of Leakage on Workers’
Retirement Savings. GAO Report. Washington, DC: GAO. Gelber, A.M. (2011). “How do 401(k) Affect Saving? Evidence from Changes in 401(k) Eligibility.” American Economic Journal: Economic Policy 3(4): 103-122. Gross, David B., and Nicholas S. Souleles (2002a). “An Empirical Analysis of Personal
Bankruptcy and Delinquency.” The Review of Financial Studies. 15(1): 319-347. Gross, David B., and Nicholas S. Souleles (2002b). “Do Liquidity Constraints and Interest Rates
Matter for Consumer Behavior? Evidence from Credit Card Data.” Quarterly Journal of Economics, 117(1): 149-185.
Holden, Sarah, Jack VanDerhei and Luis Alonso (2009). “401(k) Plan Asset Allocation, Account
Balances and Loan Activity in 2008.” ICI Research Perspective, 15(2). Investment Company Institute, Washington, D.C.
Holden, Sarah, and Jack Vanderhei (2001). “Contribution Behavior of 401(k) Plan Participants.”
ICI Perspective. 7(4). Washington, D.C., Investment Company Institute. Hurst, Erik, and Paul Willen, (2007). “Social Security and Unsecured Debt.” Journal of Public
Economics. 91(7-8): 1273-1297. Jansing, Chris (2013). “More Americans Raiding 401(k)s to Pay the Bills.” NBC News,
www.nbcnews.com/business/more-americans-raiding-401-k-s-pay-bills-1B7989986. Leonard, Bill. (2011). “Senate Bill Would Limit Retirement Savings 'Leakage'.” SHRM.org,
5/24. http://www.shrm.org/hrdisciplines/benefits/Articles/Pages/RetirementLeakage.aspx Li, Geng, and Paul A. Smith (2010). “401(k) Loans and Household Balance Sheets.” National
Tax Journal. 63(3): 479-508. Love, David (2006). “Buffer Stock Saving in Retirement Accounts.” Journal of Monetary
Economics. 53(7): 1473-1492. Love, David (2007). “What Can the Life-Cycle Model Tell Us About 401(k) Contributions and
Participation?” Journal of Pension Economics and Finance. 6(2): 147-185. Lu, Timothy (Jun), and Olivia S. Mitchell (2010). “Borrowing from Yourself: The Determinants
of 401(k) Loan Patterns.” MRRC Working Paper No. 2010-221. University of Michigan.
25
Lu, Timothy (Jun), Olivia S. Mitchell, and Stephen P. Utkus (2010). “An Empirical Analysis of 401(k) Loan Defaults.” Pension Research Council Working Paper 2010-40.The Wharton School.
Lusardi, Annamaria and Olivia S. Mitchell. (2007). “Baby Boomer Retirement Security: The
Roles of Planning, Financial Literacy, and Housing Wealth.” Journal of Monetary Economics. 54(1) January: 205-224.
Lusardi, Annamaria, and Peter Tufano. (2009). “Debt Literacy, Financial Experiences, and
Overindebtedness.” NBER Working Paper 14808. Mastrobuoni, Giovanni, and Matthew Weinberg (2009). "Heterogeneity in Intra-monthly
Consumption Patterns, Self-Control, and Savings at Retirement." American Economic Journal: Economic Policy, 1(2): 163-89.
Meier, Stephan and Charles Sprenger. (2010) “Present-Biased Preferences and Credit Card
Borrowing. American Economic Journal: Applied Economics. 2(1):193-210. Mitchell, Olivia S., Stephen P. Utkus, and Tongxuan (Stella) Yang. (2007). “Turning Workers
into Savers? Incentives, Liquidity, and Choice in 401(k) Plan Design.” National Tax Journal. LX(3): 469-489.
Munnell, Alicia H., Annika Sunden, and Catharine Taylor (2001/2002). “What Determines
401(k) Participation and Contributions?” Social Security Bulletin. 64(3): 64-75. Ramstack, Tom . (2008). “401(k) Debit Draws Red Flags.” Washington Times. February 18.
http://washingtontimes.com/apps/pbcs.dll/article?AID=/20080218/BUSINESS/111533484. Reeves, Robert, and Pamela Villarreal (2008). “401(k) Loans = Retirement Insecurity.” National
Center for Policy Analysis Brief. No. 615. Sabelhaus, John and David Weiner (1999). “Disposition of Lump-Sum Pension Distributions:
Evidence from Tax Returns.” National Tax Journal. 52(3):593-614. Sunden, Annika, and Brian Surette (2000). “Household Borrowing from 401(k) Plans.” Just the
Facts on Retirement Issue No. 1. Center for Retirement Research Working Paper, Boston College.
U.S. Department of Labor (USDOL: 2012). Private Pension Plan Bulletin: Abstract of 2010
Utkus, Stephen P., and Jean Young (2011). “Financial Literacy and 401(k) Loans.” In Financial Literacy: Implications for Retirement Security and the Financial Marketplace. Eds. Olivia S. Mitchell and Annamaria Lusardi. Oxford: Oxford University Press.
Vanderhei, Jack, Sarah Holden, Craig Copeland and Luis Alonso (2012). “401(k) Plan Asset
Allocation, Account Balances, and Loan Activity in 2011.” Employee Benefit Research Institute Issue Brief, No.380.
Vise, David A. (2004). “A Card to Borrow Your Future: Can Access to Credit Encourage
Savings?” Washington Post. October 24: F01. http://www.washingtonpost.com/wp-dyn/articles/A56183-2004Oct23.html
Weller, Christian E., and Jeffrey B. Wenger (2008). “Robbing Tomorrow to Pay for Today:
Economically Squeezed Families Are Turning to Their 401(k)s to Make Ends Meet.” Center for American Progress Working Paper. Washington, D.C.
27
Table 1. Characteristics of 401(k) Loan-Eligible Participants and Borrowers
Source: Authors’ calculations
Loan-Eligible Participants Borrowers
Outcomes of interest
Percentage of participants initiating a new loan monthly 1.38% N/A
Mean (median) loan amount ($) N/A $7,841 ($4,558)
Mean aggregate loan amount ($) N/A $9,969 ($5,881)
Plan design factors
Fraction in plans allowing multiple loans 48% 57%
Mean loan interest rate 7.16% 7.29%
Participant characterisics
Percent male 51.8 44.9
Mean age (years) 44.7 41.6
Mean job tenure (years) 8.6 8.2
Income < $35,000 8.0% 13.9%
Income of $35,000- $87,500 48.8% 60.0%
Income > $87,500 43.2% 26.2%
Low wealth (non-retirement wealth less thant $7,250) 43.0% 64.9%
Medium wealth (non-retirement wealth of $7,250-$61,289) 31.2% 24.8%
High wealth (non-retirement wealth greater thatn $61,289) 25.8% 10.3%
Mean 401(k) account balance ($2010) 86,541$ 44,482$
Mean ln (401(k) account balance) ($2010) 10.38 9.83
Macroeconomic variables
Financial turmoil--fraction of observatons Sept. 08 - June 09 19.0% 16.3%
Mean lagged state-level unemployment rate (prior quarter) 5.3% 5.3%
Number of observations 55,175,718 784,489
28
Table 2. Determinants of the Probability of Taking a New Loan
TotalNumber of active participants 1,102,478 1,206,118 1,331,802 1,490,111 1,460,379 6,590,888% of active participants with a loan outstanding 21.5 21.0 20.7 19.6 20.3 20.6
Terminations% of those with a loan terminating 10.3 11.0 10.6 10.6 13.1 11.2
Default rates % of those terminating with a loan who default 84.8 84.2 85.4 87.3 87.6 86.0% of defaults as a fraction of loans outstanding 8.7 9.3 9.1 9.3 11.5 9.6
Source: Authors' calculations.
31
Table 5. Characteristics of Participants Defaulting on, or Repaying, Their Loans on Leaving Their Jobs
All Participants
Participants with a Loan
All Defaulting Repaying
Number of observations 6,590,888 1,354,900 151,458 130,295 21,163
Plan design factors
% Multiple loans allowed 43.3 49.7 47.6 47.1 50.6
# Loans taken N/A 1.3 1.3 1.3 1.2
Loan interest rate (%) 6.89 6.88 7.04 7.07 6.85
Participant characteristics
Mean age 43.6 44.1 42.9 42.4 46.1
% Male 49.0 51.0 48.0 48.0 53.0
Mean tenure 8.0 10.5 8.6 8.1 11.3
Mean income 84,371$ 73,252$ 67,369$ 64,958$ 81,503$
Low wealth 50 64 65 67 52
Medium wealth 29 25 24 24 29
High wealth 21 11 11 10 19
Mean account balance ($) 73,248$ 63,780$ 43,667$ 35,415$ 94,716$
Loan balance ($) N/A 8,132$ 6,318$ 6,099$ 7,663$
Source: Authors' calculations.
Participants Terminating with Outstanding Loans
32
Table 6. Determinants of the Probability of 401(k) Defaults