Boserup versus Malthus: does population pressure drive agricultural intensification? Evidence from Burundi Sam Desiere & Marijke D’Haese Contributed Paper prepared for presentation at the 89th Annual Conference of the Agricultural Economics Society, University of Warwick, England 13 - 15 April 2015 Copyright 2015 by Sam Desiere & Marijke D’Haese. All rights reserved. Readers may make verbatim copies of this document for non-commercial purposes by any means, provided that this copyright notice appears on all such copies.
Transcript
Boserup versus Malthus: does population pressure drive agricultural
intensification? Evidence from Burundi
Sam Desiere & Marijke D’Haese
Contributed Paper prepared for presentation at the 89th Annual Conference of the Agricultural
Economics Society, University of Warwick, England
13 - 15 April 2015
Copyright 2015 by Sam Desiere & Marijke D’Haese. All rights reserved. Readers may make verbatim
copies of this document for non-commercial purposes by any means, provided that this copyright notice
appears on all such copies.
Paper submitted to the 89th Agricultural Economic Society Conference 2015
Boserup versus Malthus: does population pressure drive agricultural
Republic of Burundi, 2011). Finally, Burundi is - to a large extent - isolated from world markets because
it is landlocked and the interregional infrastructure is poor. This makes it very expensive to import
fertilizers and also limits access to external knowledge about best practices for land intensification
(Baghdadli et al., 2008). As a result, if land intensification does occur, it will primarily be the result of
farmers’ efforts using locally availably inputs and knowledge to increase food production.
Given these adverse local conditions, we investigated whether farmers are nevertheless able
to intensify production in response to intense population pressure. More particularly, we examined
the association between population pressure and (i) land holdings (ii) land intensification and
diversification out of agriculture, and (iii) yields, food production and incomes. We attempt to
disentangle the direct and indirect influences that population densities have on yields, production and
incomes. To this end, we draw on a unique cross-sectional dataset from an agricultural survey
conducted in Burundi in 2010-2011 and combine this rich dataset with information on population
density at communal level derived from a national census conducted in 2008.
Our results reveal that both Malthusian and Boserupian processes co-exist in Burundi. Land
intensification occurs with population pressure, but yields stabilize at around 500 persons/km², while
household level food production decreases because of smaller landholdings. This is accompanied by
increases in off and non-farm income, but these additional sources of income are insufficient to reverse
the trend of declining incomes associated with increased pressure on the land. Agricultural and
broader socio-economic policies will be required to halt this trend.
The remainder of the paper is structured as follows. In the next section, we outline our
methodology and briefly discuss various robustness checks that we carried out. We describe our data
and discuss its strengths and weaknesses and then present our results. In the conclusions, we compare
our findings with those in the literature.
2. Methodology
Framework
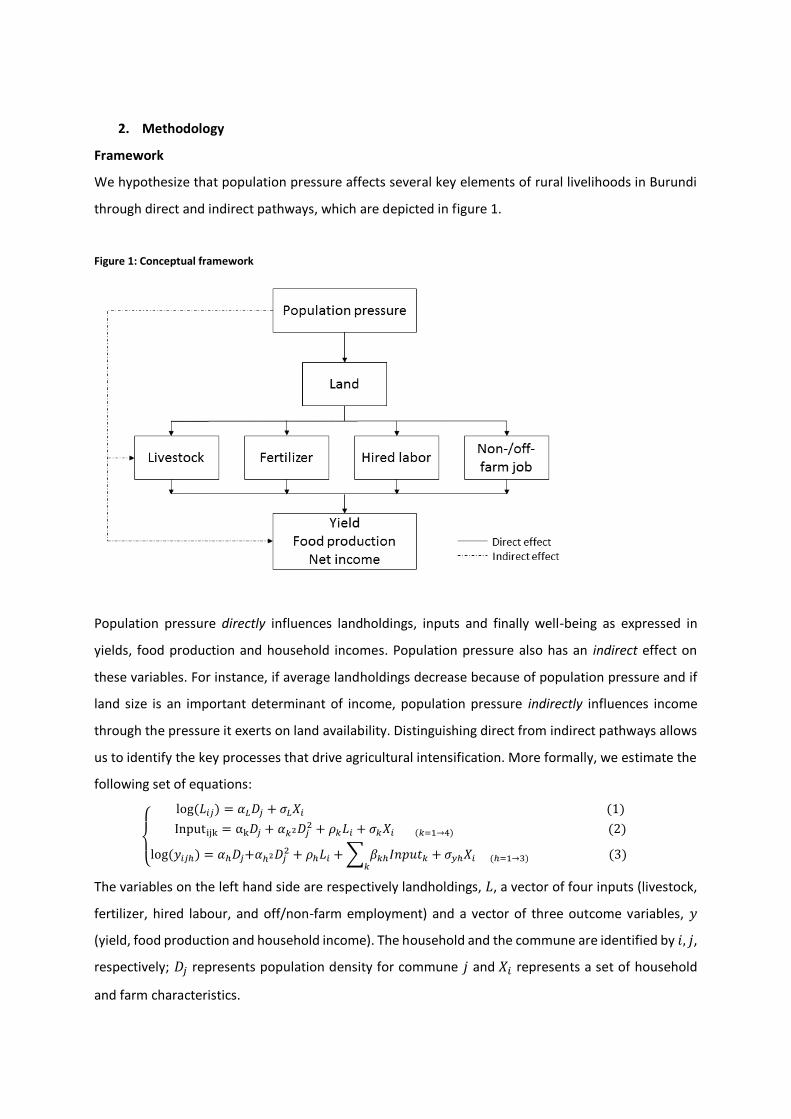
We hypothesize that population pressure affects several key elements of rural livelihoods in Burundi
through direct and indirect pathways, which are depicted in figure 1.
Figure 1: Conceptual framework
Population pressure directly influences landholdings, inputs and finally well-being as expressed in
yields, food production and household incomes. Population pressure also has an indirect effect on
these variables. For instance, if average landholdings decrease because of population pressure and if
land size is an important determinant of income, population pressure indirectly influences income
through the pressure it exerts on land availability. Distinguishing direct from indirect pathways allows
us to identify the key processes that drive agricultural intensification. More formally, we estimate the
following set of equations:
{
log(𝐿𝑖𝑗) = 𝛼𝐿𝐷𝑗 + 𝜎𝐿𝑋𝑖 (1)
Inputijk = αk𝐷𝑗 + 𝛼𝑘2𝐷𝑗2 + 𝜌𝑘𝐿𝑖 + 𝜎𝑘𝑋𝑖(𝑘=1→4)(2)
log(𝑦𝑖𝑗ℎ) = 𝛼ℎ𝐷𝑗+𝛼ℎ2𝐷𝑗2 + 𝜌ℎ𝐿𝑖 +∑ 𝛽𝑘ℎ𝐼𝑛𝑝𝑢𝑡𝑘
𝑘+ 𝜎𝑦ℎ𝑋𝑖(ℎ=1→3)(3)
The variables on the left hand side are respectively landholdings, 𝐿, a vector of four inputs (livestock,
fertilizer, hired labour, and off/non-farm employment) and a vector of three outcome variables, 𝑦
(yield, food production and household income). The household and the commune are identified by 𝑖, 𝑗,
respectively; 𝐷𝑗 represents population density for commune 𝑗 and𝑋𝑖 represents a set of household
and farm characteristics.
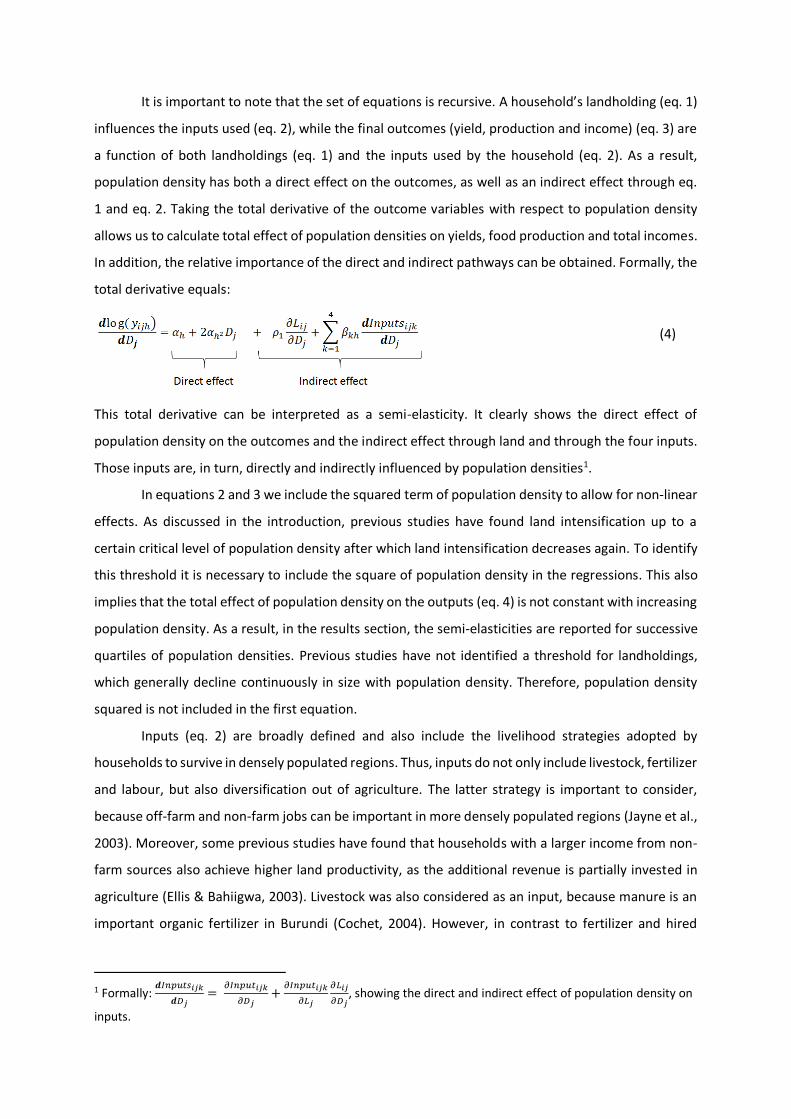
It is important to note that the set of equations is recursive. A household’s landholding (eq. 1)
influences the inputs used (eq. 2), while the final outcomes (yield, production and income) (eq. 3) are
a function of both landholdings (eq. 1) and the inputs used by the household (eq. 2). As a result,
population density has both a direct effect on the outcomes, as well as an indirect effect through eq.
1 and eq. 2. Taking the total derivative of the outcome variables with respect to population density
allows us to calculate total effect of population densities on yields, food production and total incomes.
In addition, the relative importance of the direct and indirect pathways can be obtained. Formally, the
total derivative equals:
(4)
This total derivative can be interpreted as a semi-elasticity. It clearly shows the direct effect of
population density on the outcomes and the indirect effect through land and through the four inputs.
Those inputs are, in turn, directly and indirectly influenced by population densities1.
In equations 2 and 3 we include the squared term of population density to allow for non-linear
effects. As discussed in the introduction, previous studies have found land intensification up to a
certain critical level of population density after which land intensification decreases again. To identify
this threshold it is necessary to include the square of population density in the regressions. This also
implies that the total effect of population density on the outputs (eq. 4) is not constant with increasing
population density. As a result, in the results section, the semi-elasticities are reported for successive
quartiles of population densities. Previous studies have not identified a threshold for landholdings,
which generally decline continuously in size with population density. Therefore, population density
squared is not included in the first equation.
Inputs (eq. 2) are broadly defined and also include the livelihood strategies adopted by
households to survive in densely populated regions. Thus, inputs do not only include livestock, fertilizer
and labour, but also diversification out of agriculture. The latter strategy is important to consider,
because off-farm and non-farm jobs can be important in more densely populated regions (Jayne et al.,
2003). Moreover, some previous studies have found that households with a larger income from non-
farm sources also achieve higher land productivity, as the additional revenue is partially invested in
agriculture (Ellis & Bahiigwa, 2003). Livestock was also considered as an input, because manure is an
important organic fertilizer in Burundi (Cochet, 2004). However, in contrast to fertilizer and hired
1 Formally:
𝒅𝐼𝑛𝑝𝑢𝑡𝑠𝑖𝑗𝑘
𝒅𝐷𝑗=
𝜕𝐼𝑛𝑝𝑢𝑡𝑖𝑗𝑘
𝜕𝐷𝑗+
𝜕𝐼𝑛𝑝𝑢𝑡𝑖𝑗𝑘
𝜕𝐿𝑗
𝜕𝐿𝑖𝑗
𝜕𝐷𝑗, showing the direct and indirect effect of population density on
inputs.
labour, it can also be seen as an output because of its nutritional value and its importance as a store
of wealth.
The set of household characteristics include the age of the household head and age squared -
to take into account lifecycle effects, the number of adult sons, the size of the household, the
educational level of the household head and whether or not the household is female-headed. In
addition, access to markets, measured in terms of the distance to the capital and an accessibility index
for the nearest village2, and two environmental conditions (elevation above sea level, provincial
rainfall) are also included.
Estimation strategy
The set of three equations (eq. 1, 2 and 3) were estimated separately. This provides unbiased estimates
and standard errors given that the set of equations is recursive (Greene, 2003).
Equation 1 was estimated with OLS. Estimating equation 2 posed a practical challenge. Ideally,
all inputs should be considered as continuous variables, because the amount of fertilizer/hired labour
applied determine yields and farm income. However, only 39% of the households in the sample had
applied fertilizer in the past year and only 57% had hired labour. Similarly, many households were not
active in the labour market and did not, therefore, have any non-farm income to report. Only livestock
could be treated as a continuous variable because 76% of the households had livestock. Hence, except
for livestock, the inputs were considered as dichotomous variables and were estimated with probit
models. An additional advantage of probit models is that they reduce the chances of measurement
error in the data. For instance, it is unlikely that households wrongly reported whether they used
fertilizer or hired labour, while the exact cost or levels of use of these inputs are susceptible to
measurement error. Tobit models are another option for estimating these equations3. Tobit models
assume that a zero value is an outcome of a rational choice that takes the truncated nature of the data
into account and provides unbiased estimates, while still allowing the researcher to take into account
the continuous structure of the data. The model was re-estimated with Tobit models and results were
very similar to the base models (available upon request).
Finally, equation 3 was estimated with Seemingly Unrelated Regression (SUR). This improved
the efficiency of the estimation because errors in the equations for yields, food production and income
are likely to be correlated with each other. Because of concerns about measurement error of these
2 This accessibility index equals the sum of the four binary variables: there is a road that crosses the village, the nearest provincial road is less than 5km from the village, the nearest paved road is less than 5km from the village, and the nearest market is less than 5km from the village. 3 Heckman models are a third viable option. However, these require an exclusion restriction, i.e. a variable that explains a zero outcome, but does not appear in the equation itself. We could not identify such a variable in our dataset.
outcome variables, these equations were also re-estimated with robust regressions (Verardi & Croux,
2008). Again, results were very similar and are available upon request.
The endogeneity of population densities is a concern in all our estimations. For instance,
regions with a higher agro-ecological potential may have a higher population density and higher yields.
Omitting the variables for soil fertility could thus introduce reversed causality. In this view, the
endogeneity of population density might have the greatest influence on outcome variables (eq. 3), less
influence on inputs (eq. 2) but can be considered not to influence the distribution of land (eq. 1). To
partially mitigate these concerns about endogeneity, we included regional fixed effects in our
estimations. Burundi has 11 different natural regions with different agricultural potential ranging from
lowland to mountains. Using these as variables we were able to capture how variations in population
pressure within a region influence agricultural intensification. In addition, two proxies for soil fertility
were also included in the regressions: the share of marsh land and the share of land that is double
cropped. Marshlands are low lying areas that retain water and these areas are often used to cultivated
rice. Land that is double cropped , i.e. cultivated during several successive seasons, is likely to be more
fertile than land that is only cultivated during one season and then left fallow to regenerate. We will
provide empirical evidence that double-cropping is not more common in densely populated regions
and is more an indicator of soil fertility rather than a strategy to increase food production in densely
populated regions. Unobserved household characteristics are another concern since we cannot control
for these directly - as we do not have a panel dataset. For instance, households with higher yields and
income may invest their surpluses in additional inputs such as livestock or fertilizers. To test the
importance of this effect, we aggregated the data at communal level and re-estimated the equations.
After doing so, our analysis covered 124 communes. The results are reported in the appendix and
confirm the findings at household level.
Although, our results are robust to several different specifications, the findings should carefully
be interpreted, and as showing associations – and not causations – between population density and
the outcomes of interest. These associations are nonetheless interesting because a positive association
between population density and yields – be it because of population-induced intensification or
because population grows faster in fertile region - would reduce the likelihood of a Malthusian crisis.
Data
We used data from a national representative agricultural survey of 2560 households conducted in
2011/2012 by the Statistical Office of Burundi and the Ministry of Agriculture, which was financially
supported by the Belgian Technical Cooperation and the World Bank. This was the first nationally
representative agricultural survey in Burundi since the 1970s and its main purpose was to update
agricultural statistics and to provide reliable production figures at the provincial level.
A two-stage stratified design was adopted to randomly select households. First, 20 sectors4
were randomly selected within each of the 16 rural provinces5. Within each sector, all the households
were enumerated and 8 households were randomly selected to participate in the survey. Details of
the sampling procedure can be found in a government report on this agricultural survey (Republic of
Burundi, 2013). These households were interviewed several times during the three seasons by trained
enumerators.
The survey contained 14 sections with questions related to agricultural production and the
socio-economic status of the household. Each of the fields used by the households was precisely
measured with GPS. Details of the total annual production of all main food crops were collected. In
Burundi’s mixed-cropping system it is difficult to obtain details of yields of individual crops or to
identify how much land has been devoted to each particular crop. We therefore estimated average
yields as the sum of total annual production of all food crops, weighted by its calorific content, and
divided by total landholdings. This number was then divided by the calorific content of beans, one of
the main staple crops in Burundi, to make it more tangible. Yields are thus expressed in kg/ha. Food
production is defined as total on-farm production expressed in its calorific content per adult
equivalents6 per day, a proxy for food availability within the household. To obtain total income, we
expressed the purchasing power of off-/non-farm income in terms of calories per day and adult
equivalent, subtracted the cost of fertilizers and hired labour and added food production7. The calorific
content of food crops8 was chosen instead of prices, as most food production is for subsistence
purposes and only surpluses are sold on the market. In addition, the survey did not collect prices at
farm or village level and we only had access to average prices for Burundi, which did not reflect regional
differences. However, the correlation between calorific content and these prices was 85%. Hence, our
choice of the weights is unlikely to affect the main results.
The survey excluded cash crops. In some provinces, cash crops, especially coffee, contribute
significantly to total farm income. However, coffee is generally considered to be less profitable than
food crops and is mainly still cultivated for historical reasons (Baghdadli et al., 2008; Oketch & Polzer,
2002; Republic of Burundi, 2014). We are therefore fairly confident that including coffee in the
estimation of average yields would not have increased yields substantially. While farm incomes and
4 The sectors, known as Zones Dénombrements (ZD), represent relatively small administrative units that include several villages. ZDs in predominately urban areas were excluded from the survey. 5 The province of Bujumbura Mairie was excluded because it is dominated by the capital Bujumbura and can be considered an urban region. 6 We followed the suggestion of FAO (2005) and defined adult equivalents as: 𝐴𝐸 = (𝐴𝑑𝑢𝑙𝑡𝑠 + 0.3 ∗𝐶ℎ𝑖𝑙𝑑𝑟𝑒𝑛)0.9 7 Using national price data for staple foods in Burundi, we estimated the price of 1000 calories as 310 FBU ($ 0.21) (Republic of Burundi, 2013) 8 The calorific contents of crops were taken from FAOSTAT .
total income will be underestimated in regions where coffee or tea is cultivated, this effect should be
partially picked up by the regional fixed effects that have been included in all estimations.
Before conducting the analyses, the dataset was thoroughly cleaned to ensure the reliability
of our results. Besides removing observations with missing variables, we excluded 48 farms with
landholdings above 20ha, because these farms are not representative of Burundi. Yields are especially
sensitive to measurement error. Therefore, we discarded the households with the 5% highest and
lowest yields. In the end, 2050 observations remained in our dataset.
We complemented this dataset with secondary sources about population density and rainfall. A
national population census was conducted in 2008 by the Government of Burundi, which enabled us
to calculate population density at the communal level (République du Burundi, 2010). Rainfall data
were collected by IGEBU, the Geographical Institute of Burundi, which collects rainfall data but only at
the provincial level, as Burundi has only a few weather stations.
3. Results
Descriptive results
In this section we show the association between population density and landholdings, land
intensification, diversification out of agriculture, food production per hectare and per adult equivalent
and net-income with non-parametric regressions (figures 2 to 5). In all these figures the x-axis
represents rural population density (persons/km²) and the y-axis shows the selected variable. The
vertical dashed lines indicate the four different quartiles (at 200 persons/km², 330 persons/km², 421
persons/km²) and the 95th percentile (590 persons/km²) of the distribution of population density.
Landholding sizes and cultivated land area gradually decline with increasing population
pressure (figure 2, left panel). Average landholdings are greater than 1ha in regions with a population
density of less than 200 persons/km², but are smaller than 0.5ha in regions with a population density
of more than 450 persons/km². Additional analyses showed that households cultivate on average 6
plots and this figure does not decrease with increasing population density. Thus, the plots are much
smaller in densely populated regions, implying that land fragmentation is even more pronounced in
these regions. This is probably caused by the customary practice of sharing the best plots of land
equally among all male heirs. Land in the marshes is especially valuable and is therefore not passed to
just one heir, but is equally shared among all the adult sons. We found that the share of households
with access to land in the marshes remains constant at roughly 40% with increasing population
pressure, with the average plot size decreasing . Cultivated land area was defined as the total land area
that was cultivated during the agricultural year. Although annual crops such as banana are important
in Burundi, double-cropping, i.e. cultivating the same field during several successive seasons, is a
common practice in many fields (Cochet, 2004). Therefore, the total cultivated area is always
substantially greater than total landholdings (figure 2, left panel, dashed line). The ratio of total
cultivated land area to landholdings seems to remain stable with increasing population pressure. This
indicates that land intensification does not occur through a shortening of fallow periods or increasing
double cropping, perhaps because double-cropping is already a widespread practice in Burundi. This
finding is important because the share of double cropped land and the share of marshland in total
landholdings will be included as independent variables in the econometric analyses. As already argued,
these variables partially control for soil characteristics. If they were correlated with population
pressure, they should have been included as ‘inputs’ (eq. 2) in our empirical framework and could not
be considered to be appropriate proxies for soil fertility. Erosion management is not very common,
with only 26% of the fields protected by any form of soil protection and only 3% of the fields terraced
(Republic of Burundi, 2013). We could not detect any association between population pressure and
soil protection.
Figure 2: Total landholdings/cultivated land area and livestock as a function of population density
Livestock expressed in Tropical Livestock Units (TLU): cattle=0.7; pig=0.2; sheep, goat=0.1; poultry=0.01
We now turn our discussion to the relation between population pressure and the use of inputs.
Livestock numbers decrease steeply with increasing population pressure (figure 2, right panel). This is
in line with qualitative work that related the decrease in livestock to the loss of grazing land in densely
populated regions (Hatungumukama, Hornick, & Detilleux, 2007). Analyzing this relationship in more
detail revealed that the probability of keeping cattle was 20% in the first quartile of the distribution of
population density, but decreases to less than 5% at the 95th percentile. The probability of keeping
sheep, goats and poultry increases with pressure on land. Hence, households in densely populated
regions shift to smaller animals, which are less vulnerable to shocks and poor quality feed. We
examined the probability of applying fertilizer and labour and, when they are used, the actual amount
applied per ha. The probability of hiring labour increases with population density up to 200
persons/km² and remains constant thereafter (figure 3, top left). In these regions, more than 50% of
the households engaged wage labourers. Moreover, the cost of wage labourers also increases steadily
with rising population pressure (figure 3, top right). Hence, there is evidence of land intensification
through more intense, manual cultivation when population pressure mounts. It should be noted that
we may underestimate this association between population density and labour intensity. The survey
did not capture information on the salaries paid to wage labourers, but only measured how much was
spent on hiring additional labour per field and season. If wages are lower in the most densely populated
regions (as predicted by Boserup), the number of employed labourers in these regions will be
underestimated relative to more sparsely populated regions, where wages are higher. This would
reduce the strength of the association between population density and the demand for wage
labourers.
Fertilizer use increases with population density up to 500 persons/km² and decreases
thereafter (figure 3, bottom left). Nonetheless, even at its peak, only slightly more than 50% of the
households apply fertilizers. Access to fertilizers for smallholders is problematic in Burundi. A similar
relationship is found when examining the association between the amount of fertilizer per hectare and
population pressure. The amount of applied fertilizer first increases from a very low level to around
100 kg/ha in areas with a population density of between 300 and 450 persons/km² and then decreases
again (figure 3, bottom right). Cochet (2004) argued that banana is an important organic fertilizer in
Burundi and observed a shift from the use of manure to banana mulch as population pressure
increases. In our sample, the number of household cultivating banana increased from 72% in the first
quartile of the distribution of population density to 82% in the fourth quartile (results not shown).
However, the share of land devoted to banana cropping seems to be uncorrelated with population
density and varied between 30% and 36%. The share of land covered with bananas was therefore not
included as an input in our econometric model.
Diversification out of agriculture is often considered an important livelihood strategy for land
constrained households. Households in densely populated regions are far more likely to have at least
one member engaged in off- or non-farm work (figure 4, left). Income per adult equivalent also
increases with population density. Income from off- or non-farm work is around 200 FBU ($ 0.13) per
day and adult equivalent in regions with a population density between 200 and 400 persons/km², and
then further increases (figure 4, right).
Figure 3: Use of labour and fertilizer as a function of population density
The left panels shows the probability (in log odds) of hiring labour/applying fertilizer during the previous year on at least one plot. The
horizontal line corresponds to a probability of 50%. The right panels show the use of labour and fertilizer per hectare among households that
did use these inputs.
Figure 4: Non- and off-farm income as a function of population density
The left panel shows the probability in log odds of being engaged in off-farm work. The horizontal line corresponds to a probability of 50%.
The right panel shows total income derived from off-farm and non-farm jobs - only considering households that are active on the labour
market.
Finally, we examined the relation between population pressure and yields, food production
and income. Figure 5 shows that, up to 450 persons/km², yields vary between 1400 kg/ha and 1600
kg/ha and then decrease rather steeply to 1000 kg/ha. Food production and total income decrease
continuously with increasing population density (figure 5, middle and right). This negative association
is weaker for total income than for food production, especially in the last quartile of population density,
because many households in densely populated regions complement income from food production
with income from off-farm and non-farm employment. However, it seems that additional income from
non-farm sources is insufficient to reverse or even halt the negative association between income and
population pressure.
Figure 5: Yields, food production and farm income as a function of population density
The overall picture can be summarized as follows: higher population densities are associated
with smaller landholdings and increased land intensification (through a higher demand for labour and
fertilizer) as well as with a decrease in livestock (and thus the availability of manure). In general, food
production per hectare and per adult equivalent is lower in densely populated regions, and off-farm
and non-farm activities make a larger contribution to total income in these areas, suggesting a
diversification out of agriculture. While these descriptive results confirm a scenario in which
Malthusian and Boserupian forces co-exist, a more thorough econometric analysis can be used to shed
light on the direct and indirect pathways through which population density affects agriculture.
Econometric results
In this section, we report the econometric analyses and quantify the direct and indirect pathways
through which population pressure affects the agricultural system in Burundi. The direct and indirect
effects for successive quartiles of population density on the variables of interest are reported in table
4.
The first regression explains landholdings (table 1) as a function of population density and
household characteristics. We find a highly significant negative association between landholdings and
population density: an increase of 100 persons/km² is associated with a 10% decrease in landholdings.
Several household characteristics also correlate significantly with landholdings: they increase with the
age of the household head, suggesting that wealth - in the form of land - is accumulated during a
lifecycle. The strong correlation between adult sons and landholdings suggests that adult sons who
leave the household to start their own family inherit on average 17% of the parental landholdings. The
share of land in the marshes and the share of land that is double cropped is negatively correlated with
landholding size. If these variables are indeed correlated with soil quality, as argued before, this
indicates that households with better soils have less land. This is reasonable as households are likely
to face a trade-off between inheriting or buying a lot of land of poor quality or less land with more
fertile sols. Landholdings are also larger in more remote locations, i.e. further from the capital or close
to less accessible villages.
Table 1: Landholding size decreases with population pressure
Landholdings
OLS
Population pressure: direct effect
Population density (100 persons/km²) -0.096***
Farm and household characteristics
Age household head 0.0250***
Age² -0.000134*
Female headed household -0.0920*
Household size 0.0816***
Adult sons 0.165***
Education household head (0-2) 0.101***
Share land in marshes -0.701***
Share land double cropped -0.930***
Regional characteristics
Distance to capital (km) 0.00596***
Accessibility of nearest village (0-5) -0.0367**
Provincial rainfall (mm³) -0.000182**
Elevation above sea level (m) -0.000247*
R² 30%
***,**,* significant at 0.01, 0.05,0.10 levels, respectively; Regional dummies included, but not reported; n=2050
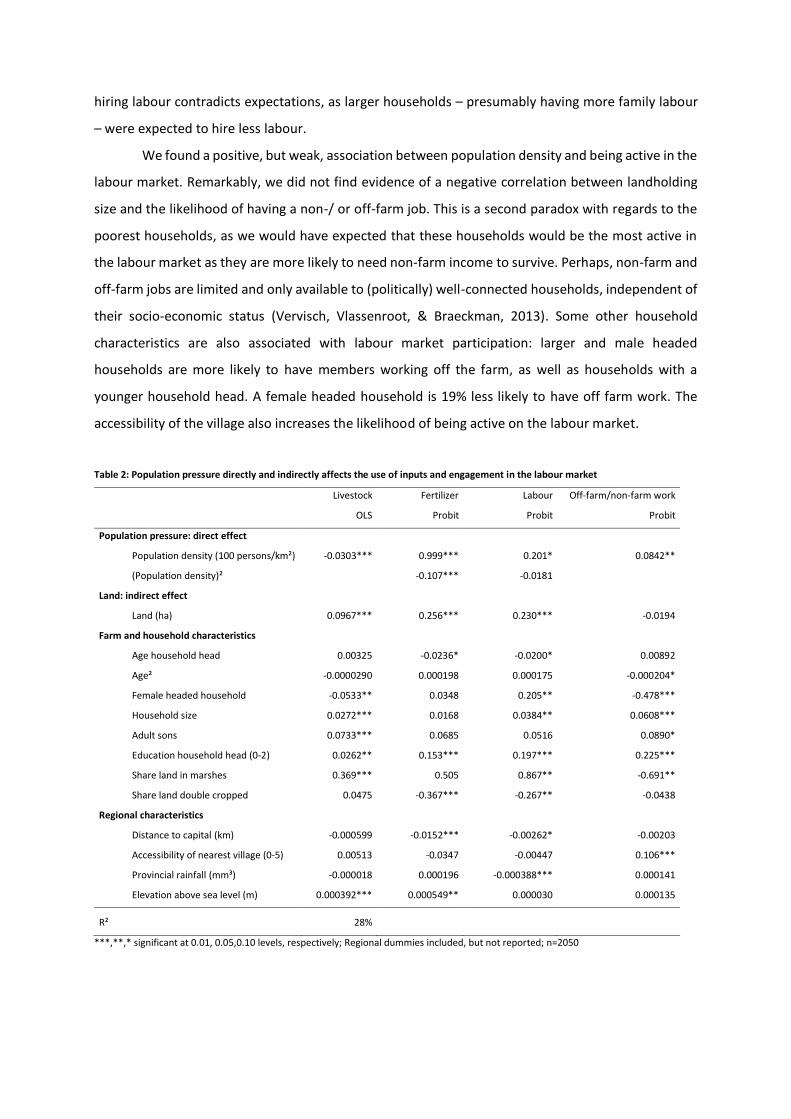
Table 2 shows that livestock keeping, use of fertilizer and labour and diversification out of
agriculture are all significantly correlated with population pressure. The correlation between livestock
and population density is linear, but rather weak (table 2, column 1). An increase of population
pressure of 100 persons/km² corresponds to a decrease of just 2.8% in livestock units. However, the
positive association between landholdings and livestock is much stronger. If landholdings increase by
1ha livestock units increase by 10%. Thus, in densely populated regions, where average landholdings
are small, there is less livestock. Hence, the direct and indirect pathways reinforce each other. The
total effect of population pressure on livestock shows that an increase in population density of 100
persons/km² reduces livestock units by an average 3.5%.
The association between population pressure and fertilizer use is non-linear. All else remaining
equal, the probability of using fertilizer increases up to 463 persons/km² and decreases thereafter
(table 2, column 2). In addition, households with more land are more likely to use fertilizers. This is a
paradox because it implies that the poorest households, i.e. those with little land, who are unlikely to
be able to cover their subsistence needs, do not intensify production as much as wealthier households.
Consequently, the direct and indirect effects (through landholdings) of population pressure on
fertilizer use oppose each other. An increase of population density of 100 persons/km² increases the
probability of using fertilizers by 16% in the first quartile of the distribution of population density, but
the same increase in population density in the fourth quartile only increases the probability by 5%.
This does not mean that there is less demand for fertilizer in densely populated region, even on the
contrary, but just that continued population growth in the most densely populated regions is not
associated with an increased demand for fertilizers. It may be that all the households in these regions
who are sufficiently wealthy and have access to fertilizers, already use them, while in less densely
populated regions there are still households who will invest in fertilizer if the pressure on the land
further increases. Other important predictors of fertilizer use are the education of the household head,
the share of land that is double cropped and the distance to the capital. The latter correlation is
especially strong. For instance, there is a 78% probability that an average household 20km from the
capital will use fertilizers and this probability falls to 57% at 60km from the capital.
There is a direct positive association between population pressure and the use of wage labour,
but the magnitude of the effect is small and only significant at the 8% level. Landholding size is also
positively correlated with hiring additional labour, weakening the total positive effect of population
pressure on the demand for labour. Taking into account both direct and indirect effects, an increase
of population density of 100 persons/km² increases the probability of hiring additional labour by an
average 2 percent points. However, the effect differs with the initial levels of population density: it is
positive in the first quartile (by 4 percent points), but almost zero in the fourth quartile. Some other
covariates also correlate with demand for labour. The positive correlation between household size and
hiring labour contradicts expectations, as larger households – presumably having more family labour
– were expected to hire less labour.
We found a positive, but weak, association between population density and being active in the
labour market. Remarkably, we did not find evidence of a negative correlation between landholding
size and the likelihood of having a non-/ or off-farm job. This is a second paradox with regards to the
poorest households, as we would have expected that these households would be the most active in
the labour market as they are more likely to need non-farm income to survive. Perhaps, non-farm and
off-farm jobs are limited and only available to (politically) well-connected households, independent of
their socio-economic status (Vervisch, Vlassenroot, & Braeckman, 2013). Some other household
characteristics are also associated with labour market participation: larger and male headed
households are more likely to have members working off the farm, as well as households with a
younger household head. A female headed household is 19% less likely to have off farm work. The
accessibility of the village also increases the likelihood of being active on the labour market.
Table 2: Population pressure directly and indirectly affects the use of inputs and engagement in the labour market
Livestock Fertilizer Labour Off-farm/non-farm work
OLS Probit Probit Probit
Population pressure: direct effect
Population density (100 persons/km²) -0.0303*** 0.999*** 0.201* 0.0842**
(Population density)² -0.107*** -0.0181
Land: indirect effect
Land (ha) 0.0967*** 0.256*** 0.230*** -0.0194
Farm and household characteristics
Age household head 0.00325 -0.0236* -0.0200* 0.00892