✬ ✫ ✩ ✪ COLOR OUTLIER DETECTION FOR SEARCH AND RESCUE Travis Marshall and L. Nathan Perkins May 1, 2015 Boston University Department of Electrical and Computer Engineering Technical Report No. ECE-2015-01 BOSTON UNIVERSITY
Transcript
'
&
$
%
COLOR OUTLIER DETECTION FOR SEARCH
AND RESCUE
Travis Marshall and L. Nathan Perkins
May 1, 2015
Boston University
Department of Electrical and Computer Engineering
Technical Report No. ECE-2015-01
BOSTONUNIVERSITY
COLOR OUTLIER DETECTION FOR SEARCH ANDRESCUE
Travis Marshall and L. Nathan Perkins
Boston University
Department of Electrical and Computer Engineering
8 Saint Mary’s Street
Boston, MA 02215
www.bu.edu/ece
May 1, 2015
Technical Report No. ECE-2015-01
Summary
Unmanned aerial vehicles (UAV) are a tremendous resource for search and rescue mis-sions, as they are able to collect high resolution imagery of large swaths of land with-out the cost and manpower of human search parties. With the tremendous amountof imagery that can be collected, a new bottleneck in the process has emerged as thetask of evaluating and identifying objects of interest, including people, clothing orother details in these images is still predominantly a manual task. Automated coloranomaly detection can significantly expedite this process by identifying unexpectedcolors likely associated with synthetic clothing or equipment.
Hyperspectral imaging, used in satellite and geographic exploration, has a strangeset of tools for anomaly detection. In this paper, we evaluate the applicability ofthese hyperspectral techniques to search and rescue, as well as introduce a novelalgorithm that uses gaps in the principal component analysis to identify clusters ofanomalous pixels. In addition, we compare performance of algorithms across multiplecolor spaces and across multiple types of environments to identify potential strengthsand weaknesses.
Existing algorithms offer a clear tradeoff between computational performance andanomaly detection accuracy. Our proposed algorithm strikes a balance between thesetradeoffs, achieving high accuracy with relatively low computational intensity.
As the prevalence of unmanned aerial vehicles (UAV) increases in both search andrescue and military missions, so too does the volume of imagery collected by theonboard cameras. Human analysis of such imagery is both unreliable [1], given theneed to broadly analyze large fields of view, and impractical, given the number ofimages produced. Instead, algorithmic analysis of images is employed to quicklyidentify regions of interest in the imagery.
Given the unknowns regarding the visual appearance of the target (e.g., an in-dividual in a search and rescue mission), the automatic processing must identifyanomalous regions in the image rather than implementing a more directed target de-tection approach. Exploiting color information is especially well suited for identifyingoutlying pixels in a large natural scene, as clothing and man-made objects will oftenhave distinguishing spectral signatures. Identifying such pixels with anomalous colorscan aid in both identifying the target or important information that may lead to thetarget of a search and rescue mission. In this project, we aim to use spatial andspectral data from a photograph to classify anomalies – that is, local pixels in whichthe color patterns deviate from expectations identified in the global scene.
2 Literature review
Most of the research in the area of anomaly detection has focused on hyperspectralimages (used in medical and geological imaging) [2]. The Reed-Xiaoli (RX) detector,which is broadly used and often considered a benchmark [3], compares individualpixels to either a surrounding window or global statistics under the assumption thatthe spectral data are distributed according to a multivariate Gaussian [4]. Thereare many variations and adaptations of the RX detector based on the windowing,allowing better adaptation throughout the image, such as local RX and quasi-localRX [5].
Another approach to anomaly detection is the dual window eigen-separation trans-form (DWEST) [6], which compares spectral projection matrices for an inner andouter window to identify distinctive spectral statistics. Similar to this windowingapproach, the nested spatial window-based target detection (NSWTD) [7] and themultiple-window anomaly detection (MWAD) [8] use multiple windows of comparisonto achieve background suppression or target whitening relative to varying contextualscales, helping identify potential anomalies of variable size within the image.
Alternatively, the cluster-based anomaly detection (CBAD) approach segmentsimages into regions that maximize the conformation of the spectral distribution to aGaussian model [9]. Anomalies can then be identified based on values that deviatefrom the distribution of the surrounding cluster.
In the limited literature that specifically addresses search and rescue, approachesinclude increasing the saturation of rare hues and decreasing the saturation for com-mon hues in order to assist human users in identifying anomalous colors [10]. More
COLOR OUTLIER DETECTION FOR SEARCH AND RESCUE 2
recent work has surveyed adapting some of the hyperspectral techniques, and foundthat many of the detectors described above can be successfully implemented for searchand rescue, but the RX algorithm proved most robust and least dependent on pa-rameter tuning [1].
Finally, in a previous EC520 project, students extended the above techniques,which predominantly identify point anomalies, by incorporating spatial informationvia Markov random fields [11]. Their results show an improvement when comparedto the RX detector approach. Yet their model was limited: it simply focused on color(ignoring luminance) and had a high rate of false positives in photos that includesharp transitions from one environment to another (ocean and shore, for example).
3 Problem statement
Due to the prevalence of UAV photography in search and rescue applications, thereis a need to improve analysis of wide angle aerial perspective high resolution imageryto find clues that can lead to finding missing persons. Improvement in analysis ofthis type of imagery in search and rescue applications will be measured by being ableto successfully identify anomalous objects/pixels within natural aerial perspectivescenes while (a) maximizing the area under the ROC curve for anomaly detection byimplementing algorithms on images with known anomalous pixels and (b) minimizingprocessing time for the image analysis algorithms.
In section 4, we propose our solution to this problem. Subsections 4.1- 4.4 first sur-vey existing anomaly detection algorithms developed for hyperspectral applications.We then then introduce a new solution, PCAG, in subsection 4.5. In subsection 4.7,we describe the color spaces are considered across all algorithms to prevent biasesagainst algorithms in one or more color spaces and to identify a color space mostsuitable to search and rescue. Section 5 discusses further details of implementationand evaluation across algorithms and color spaces. Section 6 presents and explainsthe experimental results across algorithms, color spaces, scene types and algorithmprocessing time performance to determine comparison data for (a) and (b) and eval-uate our solution against existing solutions for (a) and (b). Lastly, conclusions andfuture work recommendations are in section 7.
4 Solution
In order to improve detection of anomalous colors in search and rescue photos, wesurvey a range of the hyperspectral anomaly detection algorithms, including some ofthe most recent developments that achieve high accuracy through nested, overlappingwindows of analysis. In addition to simply implementing and comparing existingalgorithms, we compare algorithm performance for a range of color spaces (includingL*a*b, XYZ, YCbCr) as well as subsets of color spaces (such as the “a” and “b”channels of L*a*b) to identify an analysis space that is most productive to search
COLOR OUTLIER DETECTION FOR SEARCH AND RESCUE 3
and rescue applications.In addition to implementing existing algorithms, we propose a potential algorithm
called “principal component analysis gaps” (PCAG) that looks at gaps between clus-ters along the vector of greatest variability for individual non-overlapping windows.
Each of the considered anomaly detection algorithms is described below.
4.1 RX
The benchmark in hyperspectral anomaly detection is the RX algorithm, developedby Reed and Yu [4]. The detector takes the following form:
δRX(u[x]) = (u[x]− µ)TK−1(u[x]− µ) (1)
Where µ is the global sample mean and K is the global sample covariance matrix(across spectra, or in this case, color components). This equation is equivalent tothe square of the Mahalanobis distance (a measure of distance between a single pointand a distribution). In its application to anomaly detection, it can be thought of asa whitening process that suppresses the background.
We implement two versions of the RX algorithm. Global RX calculates theglobal mean and global covariance for the full image, and applies equation 1 basedon these global measures.
The Local RX evaluates each pixel individually, calculating a local sample meanand sample variance based on an outer window of pixels excluding a guard windowaround the pixel being evaluated. The windows used in calculating the local RXalgorithm are illustrated in figure 1.
4.2 DWEST
The dual window-based eigen separation transform (DWEST) is an adaptive algo-rithm that, like the RX detector, uses covariance to compare material differencesbetween an inner and outer window [6]. Unlike the RX detector, the differentialcovariance matrix is calculated Kdiff = Kinner − Kouter, where Kinner is the covari-ance matrix for the inner window and Kouter is the covariance matrix for the outerwindow. A small subset of the eigenvalues of Kdiff will have positive values, andthe corresponding eigenvectors (Vi). These eigenvectors correspond with distinctive,differential data structures and can be used to project the mean difference betweenthe windows (µdiff = µouter − µinner); this, in effect, achieves adaptive whitening bysuppressing background patterns from the outer window.
As an anomaly detector, this is written:
δDWEST(u[x]) =
∣∣∣∣∣∑i
vTi µdiff [x]
∣∣∣∣∣ (2)
COLOR OUTLIER DETECTION FOR SEARCH AND RESCUE 4
Figure 1: Windowing used for the Local RX algorithm. Sample mean and covarianceare based on the outer window and used to evaluate the center pixel.
Where vi are the eigenvectors corresponding with positive eigenvalues of Kdiff .We specifically implement a multi-window version of the DWEST algorithm [8],
where individual detectors are calculated according to equation 2 for multiple innerwindow sizes. Figure 2 illustrates a range of inner window sizes. The final detectorrepresents the maximum of these individual detectors:
δMW−DWEST = maxi=1,...,N
{δ
(i)DWEST(u[x])
}(3)
Specifically, our implementation uses an outer window of 11×11 and inner windowsof 1× 1, 3× 3, 5× 5 and 7× 7.
4.3 NSWTD
A relatively new hyperspectral algorithm is the nested spatial window-based targetdetection (NSWTD), which builds on ideas inherent in the DWEST detector [7]. Thetechnique employees the orthogonal subspace projection [12]:
P⊥s = I− s(sT s)−1sT (4)
The orthogonal subspace projection matrix allows projecting a vector into a newspace that optimally minimizes the influence of the background signal s. This can beseen by considering the image u[x] as a linear combination of desired signal v[x] (theanomaly) and background s[x].
COLOR OUTLIER DETECTION FOR SEARCH AND RESCUE 5
Figure 2: Windowing used for the DWEST algorithm. The maximum anomaly de-tector is calculated over multiple sets of inner and outer windows.
u[x] = v[x] + s[x] (5)
P⊥s u = P⊥s v + P⊥s s (6)
= P⊥s v + (I− s(sT s)−1sT )s (7)
= P⊥s v + s− s (8)
= P⊥s v (9)
The orthogonal subpsace projections are used in calculating a measure called theorthogonal projection divergence, which measures the distance between two orthogo-nal projections:
OPD(si, sj) =√
sTi P⊥sjsi + sTj P
⊥sisj (10)
COLOR OUTLIER DETECTION FOR SEARCH AND RESCUE 6
The OPD measure can be used to compare spectral differences between two win-dows:
δNSWTD(u[x]) = OPD(µinner[x], µouter[x]) (11)
Again, like the DWEST algorithm, this is specifically implemented via a multi-window approach where individual detectors are calculated according to equation 11for multiple inner window sizes. The aggregate detector is the maximum of theseindividual calculations for a given pixel. The same window sizes from the DWESTalgorithm are used in this implementation.
4.4 MW-NSWTD
A further variation on the NSWTD algorithm is the multiple window nested window-based target detection (MW-NSWTD) algorithm proposed in [8]. Like NSWTD, thisrelies on the orthogonal projection divergence, but rather than simply comparing aninner and outer window, uses three windows. The outer most window is used forwhitening (background suppression), and the algorithm classifies anomalies based onthe divergence in the projected (whitened) versions of the middle and inner windows:
The equation 12 closely resembles the previously defined function for OPD (equa-tion 10), but uses the orthogonal subspace projection from the outer window tomeasure the divergence between the inner and middle window.
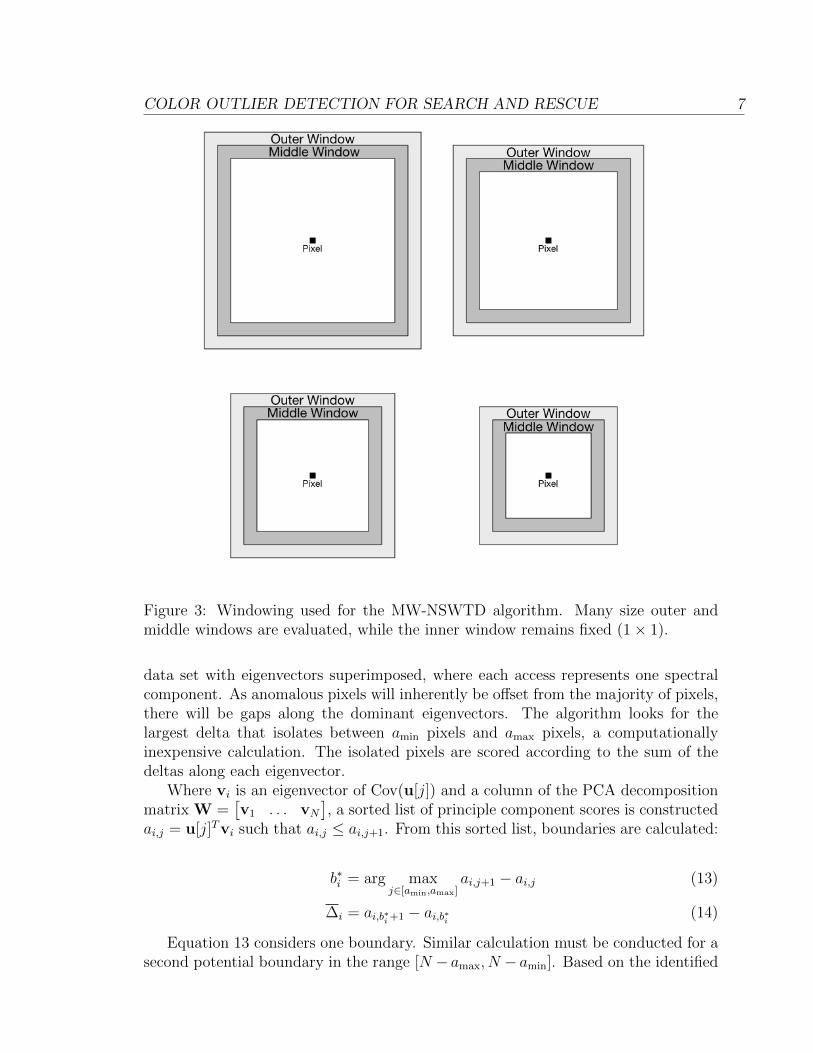
Again, as with the last two algorithms, the detectors are calculated according toequation 12 for multiple middle and outer window sizes (the inner window remainsfixed at one pixel). The aggregate detector is the maximum of these individualdetectors. Figure 3 illustrates the multiple versions of the windowing configurationused for the detector.
4.5 PCAG
We introduce and evaluate a new algorithm that we call “principal component analysisgaps” (PCAG). The anomaly detector looks at gaps between clusters along the vectorof greatest variability for individual non-overlapping windows. The algorithm worksby performing a principle component analysis across spectral components – a widelyused step in many anomaly detection algorithms [13] – on block of 15 × 15 pixels(treated as a 1D vector, u[j]). The PCA yields eigenvectors – basis vectors describingthe direction of variability across the components or spectra. The algorithm identifiesthe largest delta (hence the PCA “Gap” name) along each eigenvector that isolatesa potential set of anomalous pixels. Figure 4 shows a hypothetical, two-dimensional
COLOR OUTLIER DETECTION FOR SEARCH AND RESCUE 7
Figure 3: Windowing used for the MW-NSWTD algorithm. Many size outer andmiddle windows are evaluated, while the inner window remains fixed (1× 1).
data set with eigenvectors superimposed, where each access represents one spectralcomponent. As anomalous pixels will inherently be offset from the majority of pixels,there will be gaps along the dominant eigenvectors. The algorithm looks for thelargest delta that isolates between amin pixels and amax pixels, a computationallyinexpensive calculation. The isolated pixels are scored according to the sum of thedeltas along each eigenvector.
Where vi is an eigenvector of Cov(u[j]) and a column of the PCA decompositionmatrix W =
[v1 . . . vN
], a sorted list of principle component scores is constructed
ai,j = u[j]Tvi such that ai,j ≤ ai,j+1. From this sorted list, boundaries are calculated:
b∗i = arg maxj∈[amin,amax]
ai,j+1 − ai,j (13)
∆i = ai,b∗i +1 − ai,b∗i (14)
Equation 13 considers one boundary. Similar calculation must be conducted for asecond potential boundary in the range [N − amax, N − amin]. Based on the identified
COLOR OUTLIER DETECTION FOR SEARCH AND RESCUE 8
Figure 4: Example of gap identification in a hypothetical two dimensional data set(representing two spectral components). Gaps are identified along each vector.
boundary, pixels on the other side of the boundary will receive an anomaly scorerepresented as the sum of the deltas:
δPCAG(u[x]) =
{∑i ∆i if x /∈ Wb∗i
0 otherwise(15)
Where Wb∗irepresents those pixels within the boundaries identified by the gap
maximization process.In essence, this detector scores a small subset of pixels based on the gap that
separates them from the block background (that is, the majority of the pixels in theblock) based on an orthogonal projection achieved through PCA. The two parametersin this algorithm are simply the minimum (amin) and maximum (amax) anomaly sizesin number of pixels. Note that the block must be larger than two times the biggestanomaly.
In comparison with the existing algorithms, this approach is both fast and lessdependent on having roughly square anomalies (most hyperspectral algorithms de-pend on a surrounding background window for comparison), but is less able to handleanomalies in noisy regions (where there is a less clear gap along the vectors of vari-ability).
We also implement a multi-window version of the PCAG algorithm (MW-PCAG) that uses multiple iterations with varying window sizes to identify anomalies
COLOR OUTLIER DETECTION FOR SEARCH AND RESCUE 9
of different size. That is, the traditional PCAG algorithm is performed with 11× 11windows to identify anomalies up to 50, 15 × 15 windows to identify anomalies upto 100 pixels, etc. This allows smaller anomalies to be better identified relative tolocal context. The maximum score for each pixel is then used as the overall detectoroutput.
4.6 PCAD
In addition to the above algorithm, we propose a variation that we call the “princi-pal component analysis distance” (PCAD). Like the previous algorithm, it relies onprojecting blocks – again, 15× 15 pixels – into a new space determined by the PCAof the spectral components. Rather than looking at gaps along the principal compo-nents, this approach is built on the intuition that the likelihood a pixel is anomalousis proportional to the distance to the kth nearest pixel along each PCA vector; thatis, a pixel is much more likely to be anomalous if there is a large distance betweenit and the kth nearest pixel. Previous anomaly detectors have been built aroundthis approach by measuring the distance to the kth nearest pixel in multidimensional,spectral space using a k-nearest neighbors algorithm [11]. By first projecting the spec-tral components via PCA, this problem can be simplified and each dimension can betreated independently, eliminating the need for the more computationally intensivek-nearest neighbors computation.
Where vi is an eigenvector of Cov(u[j]) (the spectral covariance) and a columnof the PCA decomposition matrix W =
[v1 . . . vN
], a sorted list of principle
component scores is constructed ai,j = u[j]Tvi such that ai,j ≤ ai,j+1. From thissorted list, the distances to the kth nearest neighbor along each vector of variabilityis calculated:
δPCAD(u[j]) =
√√√√ N∑i=1
max(ai,j − ai,(j−k), ai,j − ai,(j+k))2 (16)
The calculation above is the Euclidian distance between pixel j and either nearestpixel, either j + k or j − k, along each PCA vector of variability. The one parameterof this detector is k, which must be selected such that it is greater than the largestexpected anomaly size (k > amax).
Much like PCAG, this algorithm will identify pixels that are substantially sep-arated from the majority of the pixels in the block (and hence, less likely to comefrom the same underlying distribution). But unlike PCAG, this approach is morerobust to noise as it is not dependent on having substantial gaps along the vectors ofvariability.
COLOR OUTLIER DETECTION FOR SEARCH AND RESCUE 10
4.7 Color spaces
In addition to considering multiple hyperspectral algorithms, as well as our novelalgorithm, to perform anomaly detection in search and rescue photos, we also evaluatealgorithm performance across multiple color spaces. Existing literature on search andrescue image processing has focused on color space manipulation to make anomalouscolors more identifiable [10]. Based on this idea, we evaluate algorithm performanceon a number of color spaces that may better emphasize color anomalies. Color spacesconsidered include RGB, L*a*b, YCbCr, XYZ and uvL, as well as slight perceptualvariations on these color spaces such as xyY and u’v’L. In addition, we considersmaller color spaces where luminance information is discarded, including the *a*bchannels from L*a*b, X and Z from XYZ, x and y from xyY, u and v from uvL andu’ and v’ from u’v’L.
5 Implementation
Because there is no publicly available library of search and rescue scenes, we au-tomated the generation of novel scenes by randomly superimposing color anomalies(clothing) into natural scenes. Using a range of natural scenes (such as beach, desert,mountain and forest photos), the process provides a large collection of suitable inputsfor comparing and contrasting algorithm performance. The set of scenes specificallyinclude photos with clear boundaries between regions of distinct texture. These sceneswere selected based on previous reports that some anomaly detectors struggle in suchan environment with sharp boundaries [11]. All anomalies are photos of clothingmanually edited to remove any pixels besides the article of clothing. Each anomalyis resized to a total area of 45-90 pixels and rotated randomly. Anomalies are lumi-nance adjusted to match the surrounding region of the scene more realistically. Theboundaries of anomalies are blended with the surrounding scene to more realisticallyreflect likely search and rescue images. An example output of the anomaly generatoris excerpted in figure 5.
The considered algorithms and color spaces were evaluated over a range of gener-ated scenes. The performance of each algorithm is visualized via a receiver operatingcharacteristic (ROC) curve. The area under the ROC curve (AUC) is used as a metricto compare across algorithms and color spaces. Each algorithm was applied acrossdifferent natural scenes and different color spaces to assess relative advantages anddisadvantages. In this way, we hope to bring current hyperspectral anomaly detectionalgorithms to bear in search and rescue.
In addition to evaluating the tradeoffs in accuracy for each algorithm, there wassubstantial range in the complexity and, as a result, relative performance of eachalgorithm. Many of the newer hyperspectral algorithms evaluate each pixel individ-ually by running five ore more comparisons with the surrounding nested windows.Alternatively, algorithms like global RX, PCAG and PCAD are able to run on largeblock or full scenes, and hence run much more quickly. Our implementations of the
COLOR OUTLIER DETECTION FOR SEARCH AND RESCUE 11
Figure 5: Excerpt from larger scene showing two anomalies superimposed on a beachphoto. The full image used in the algorithm is approximately four times larger.
each algorithms have a run time range of between 15 seconds and 8 minutes. Giventhe large range in performance, we also evaluate and compare relative tradeoffs ofalgorithm detection in terms of computational complexity.
6 Experimental results
In the subsequent sections, we discuss the results, compare the seven consideredalgorithms as well as evaluate relative performance across different color spaces andenvironments.
6.1 Algorithms
Table 1 and figure 6 compare the AUC metric for the seven algorithms across a threerepresentative color spaces that achieved high performance based on twelve naturalscenes with randomly superimposed anomalies. These AUC values are calculatedacross all twelve scenes by evaluating different global anomaly thresholds for eachalgorithm and color scheme instead of averaging AUC values for individual scenes.As a result, these results represent the expected performance on a range of back-grounds, but results could potentially be improved by tuning thresholds to the sceneor environment.
The results show strong performance for many of the considered algorithms.Global RX, which is often used as a benchmark for evaluating anomaly detection
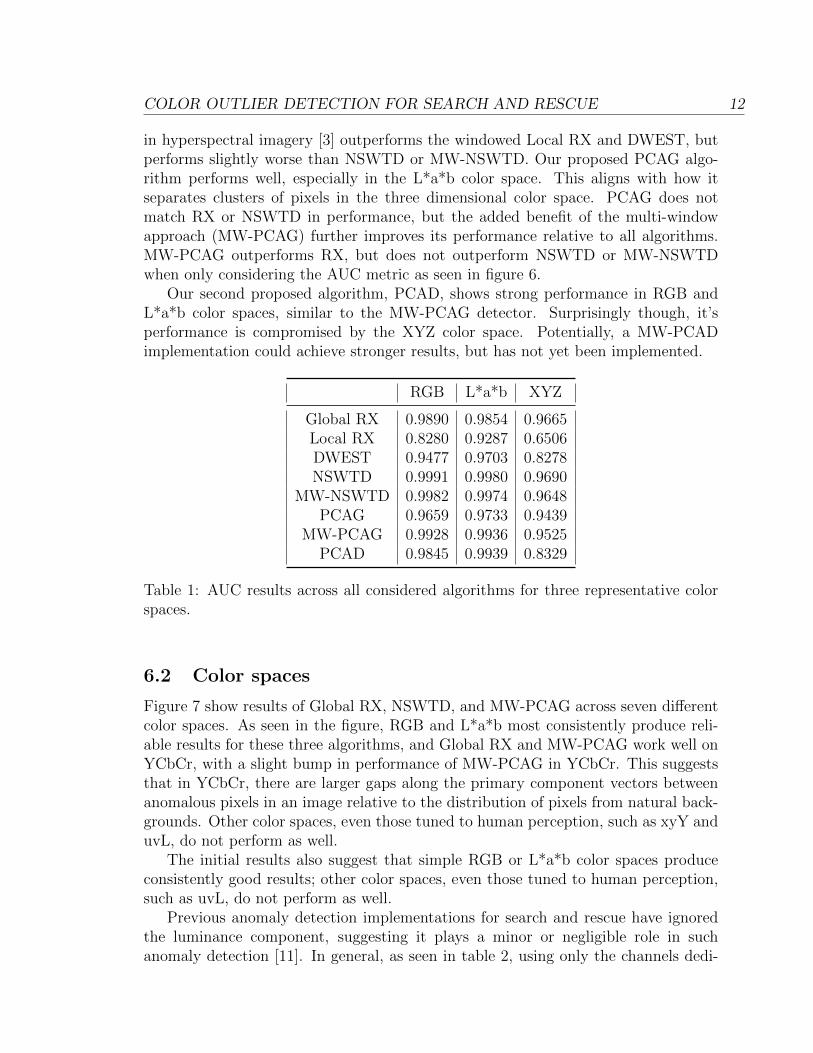
COLOR OUTLIER DETECTION FOR SEARCH AND RESCUE 12
in hyperspectral imagery [3] outperforms the windowed Local RX and DWEST, butperforms slightly worse than NSWTD or MW-NSWTD. Our proposed PCAG algo-rithm performs well, especially in the L*a*b color space. This aligns with how itseparates clusters of pixels in the three dimensional color space. PCAG does notmatch RX or NSWTD in performance, but the added benefit of the multi-windowapproach (MW-PCAG) further improves its performance relative to all algorithms.MW-PCAG outperforms RX, but does not outperform NSWTD or MW-NSWTDwhen only considering the AUC metric as seen in figure 6.
Our second proposed algorithm, PCAD, shows strong performance in RGB andL*a*b color spaces, similar to the MW-PCAG detector. Surprisingly though, it’sperformance is compromised by the XYZ color space. Potentially, a MW-PCADimplementation could achieve stronger results, but has not yet been implemented.
Table 1: AUC results across all considered algorithms for three representative colorspaces.
6.2 Color spaces
Figure 7 show results of Global RX, NSWTD, and MW-PCAG across seven differentcolor spaces. As seen in the figure, RGB and L*a*b most consistently produce reli-able results for these three algorithms, and Global RX and MW-PCAG work well onYCbCr, with a slight bump in performance of MW-PCAG in YCbCr. This suggeststhat in YCbCr, there are larger gaps along the primary component vectors betweenanomalous pixels in an image relative to the distribution of pixels from natural back-grounds. Other color spaces, even those tuned to human perception, such as xyY anduvL, do not perform as well.
The initial results also suggest that simple RGB or L*a*b color spaces produceconsistently good results; other color spaces, even those tuned to human perception,such as uvL, do not perform as well.
Previous anomaly detection implementations for search and rescue have ignoredthe luminance component, suggesting it plays a minor or negligible role in suchanomaly detection [11]. In general, as seen in table 2, using only the channels dedi-
COLOR OUTLIER DETECTION FOR SEARCH AND RESCUE 13
Figure 6: AUC results across all considered algorithms for three representative colorspaces.
Table 2: AUC results across all considered color spaces for three representative algo-rithms.
cated to color in color spaces that separate luminance and color into separate channelsis not inherently beneficial to anomaly detection for search and rescue applications.The Global RX algorithm benefits from having luminance information included inthe covariance matrix calculations in all color spaces. NSWTD performs poorly incolor spaces tuned to the sensitivities of the human visual system (and YCbCr) andbenefits from discarding luminance and only using color channels in these spaces. The
COLOR OUTLIER DETECTION FOR SEARCH AND RESCUE 14
Figure 7: AUC results across color spaces for three representative algorithms.
performance of NSWTD in RGB or L*a*b space achieves the best results, suggestingthat preprocessing the image or transforming the color space is unnecessary.
The higher performance of modern hyperspectral techniques in the RGB spaceis indicative that the algorithms benefit from images where each channel containsdistinct, but statistically similar information that is equally relevant to the determi-nation of anomaly versus non-anomaly.
MW-PCAG benefits from using only color data in uvL and u’v’L spaces, but notin any other similar color spaces. In table 2, this benefit is shown to be a 0.0024increase in AUC from RGB and a 0.0002 increase in AUC from YCbCr for using onlythe uv channels of uvL color space. For such a minimal benefit, this only makes senseto pursue if the image is given in uvL or u’v’L color space.
6.3 Scene types
Table 1 shows the general performance of each algorithm for an average search andrescue image. In contrast, figure 8 breaks out the AUC performance in L*a*b spacefor different types of images (examples are shown in figure 10 in the appendix). Ascan be seen by the Global RX performance on the beach scenes, the global detectordoes not perform as well on images with multiple regions with distinct backgroundstatistics, but does perform very well on images with consistent backgrounds, suchas the ocean image. The NSWTD and MW-PCAG both perform consistently acrossall of the images, with the NSWTD outperforming the PCAG in the AUC metric, asdiscussed in subsection 6.1.
COLOR OUTLIER DETECTION FOR SEARCH AND RESCUE 15
Figure 8: AUC results across different scene types for three representative algorithmsusing L*a*b color space.
6.4 Computation time
Figure 9 shows the average run time of all seven algorithms considered for a fixedimage size. The global RX detector, the PCAG algorithm and the PCAD algorithm allhave fast processing times. The desire for many applications will be to analyze manyimages from an aerial sweep of an area to determine whether or not a person or clues toa person’s whereabouts are in an image, which can be very time sensitive information.This makes the time and performance considerations an important tradeoff for somealgorithms. The NSWTD outperforms the RX, PCAG and PCAD detectors in theAUC metric, as does the MW-NSWTD, which performs slightly worse (-0.0009 inAUC metric) than NSWTD, but 1.5 times faster. MW-PCAG performs 7.6 timesfaster for a drop of only 0.0041 in the AUC metric from NSWTD. It can also be seenwhy global RX is seen as a benchmark for comparison here as it achieves performanceextremely close to NSWTD (a difference in AUC of 0.0088 in their respective bestcolor spaces), yet the RX algorithm performs the calculation 162 times faster onaverage.
Note that there are opportunities to optimize these algorithms further. We didnot do an in-depth investigation of the fastest implementations, although we did tryto streamline calculations. The differences in computation time accurately reflectthe relative complexity, given that DWEST, NSWTD and MW-NSWTD all involvea number of calculations for each pixel based on several surrounding windows ofcomparison for which eigenvalues or covariance matrices need to be calculated. Per-formance improvements may be gained by implementation of integral images, but the
COLOR OUTLIER DETECTION FOR SEARCH AND RESCUE 16
initial calculations and memory requirements of integral images would likely minimizethe benefits of such an implementation.
Other potential avenues for improving performance include preprocessing the im-ages. Research in the hyperspectral field has identified potential benefits in perfor-mance by first using wavelet transforms prior to implementing anomaly detectionalgorithms such as NWSTD [14].
Figure 9: Average algorithm execution time on a single CPU for images of size 1536×1152.
7 Conclusions
Although results show that the NSWTD algorithm performs incredibly well in theAUC metric, there is a clear tradeoff between processing speed and accuracy. Asmentioned before, the implementation of the NSWTD and MW-NSWTD here couldbenefit from further optimization, but inherently these algorithms require a lot moreperformance for individual pixel classification. Our analysis suggest that the PCADand MW-PCAG approaches strike a very good balance between RX and NWSTD inAUC performance while maintaining an algorithm speed that approaches that of theRX detector. Future work can be done in evaluating more optimized versions of theNSWTD and MW-NSWTD algorithms as well as looking into clustering algorithmssuch as k-means or EM clustering for anomaly detection.
COLOR OUTLIER DETECTION FOR SEARCH AND RESCUE 17
References
[1] B. S. Morse, D. Thornton, and M. A. Goodrich, Color anomaly detection andsuggestion for wilderness search and rescue. New York, New York, USA: ACM,Mar. 2012.
[2] D. Manolakis and D. Marden, “Hyperspectral image processing for automatictarget detection applications,” Lincoln Laboratory . . . , 2003.
[3] T. E. Smetek and K. W. Bauer, “Finding hyperspectral anomalies using multi-variate outlier detection,” Aerospace Conference, 2007.
[4] I. S. Reed and X. Yu, “Adaptive multiple-band CFAR detection of an opticalpattern with unknown spectral distribution,” Acoustics, Speech and Signal Pro-cessing, IEEE Transactions on, vol. 38, pp. 1760–1770, Oct. 1990.
[5] D. C. Borghys, V. Achard, S. R. Rotman, N. Gorelik, C. Perneel, Scwheicher,and Emile, “Hyperspectral anomaly detection: a comparative evaluation of meth-ods,” General Assembly and Scientific Symposium, XXXth URSI, pp. 1–4, Feb.2011.
[6] H. Kwon, “Adaptive anomaly detection using subspace separation for hyperspec-tral imagery,” Optical Engineering, vol. 42, pp. 3342–10, Nov. 2003.
[7] W. Liu and C.-I. Chang, A nested spatial window-based approach to target de-tection for hyperspectral imagery, vol. 1. IEEE, 2004.
[8] W.-M. Liu and C.-I. Chang, “Multiple-Window Anomaly Detection for Hyper-spectral Imagery,” IEEE Journal of Selected Topics in Applied Earth Observa-tions and Remote Sensing, vol. 6, pp. 644–658, May 2013.
[9] M. J. Carlotto, “A cluster-based approach for detecting man-made objects andchanges in imagery,” IEEE Transactions on Geoscience and Remote Sensing,vol. 43, pp. 374–387, Jan. 2005.
[10] N. D. Rasmussen, D. R. Thornton, and B. S. Morse, “Enhancement of unusualcolor in aerial video sequences for assisting wilderness search and rescue,” 200815th IEEE International Conference on Image Processing, pp. 1356–1359, 2008.
[11] T. Bolukbasi and P. Tran, “Outlier color identification for search and rescue,” BUDepartment of Electrical and Computer Engineering Technical Reports, pp. 1–25,Dec. 2012.
[12] C.-I. Chang, “Orthogonal subspace projection (OSP) revisited: a comprehensivestudy and analysis,” IEEE Transactions on Geoscience and Remote Sensing,vol. 43, pp. 502–518, Feb. 2005.
COLOR OUTLIER DETECTION FOR SEARCH AND RESCUE 18
[13] M.-L. Shyu, S.-C. Chen, K. Sarinnapakorn, and L. Chang, “A Novel AnomalyDetection Scheme Based on Principal Component Classifier,” pp. 353–365, 2003.
[14] M. Z. Baghbidi, K. Jamshidi, and A. Nilchi, “Improvement of Anomoly Detec-tion Algorithms in Hyperspectral Images using Discrete Wavelet Transform,”arXiv.org, 2012.
COLOR OUTLIER DETECTION FOR SEARCH AND RESCUE 19
A Example scenes
The following image shows example natural scenes used in the training process as wellas the rough “classification” used in comparison of algorithms across environments.
(a) Arid (b) Beach
(c) Desert (d) Forest
(e) Mountain (f) Ocean
Figure 10: Representative images from each class of scene.