40
INVESTMENT REPORT TENNESSEE CONSOLIDATED RETIREMENT SYSTEM Third Quarter Fiscal Year 2009 - 2010 January 1, 2010 – March 31, 2010 Prepared for: Board of Trustees Meeting June 25, 2010

INVESTMENT REPORT
TENNESSEE CONSOLIDATED
RETIREMENT SYSTEM
Third Quarter Fiscal Year 2009 - 2010
January 1, 2010 – March 31, 2010
Prepared for: Board of Trustees Meeting
June 25, 2010

Investment Advisory Council
Pursuant to T.C.A. Section 8-37-108, the State Treasurer shall nominate, with the advice and consent of the Board of Trustees, the Investment Advisory Council, compromised of five senior investment professionals in the Tennessee investment community, who shall have at least five years professional experience as a portfolio manager, economist or an investment advisor in any field of which investments of TCRS funds are authorized. The term of appointment is for five years. Also, the treasurer may nominate two (2) additional members for three year terms.
The TCRS investment staff consults quarterly with the Advisory Council on a formal basis for strategy and guidance, and on an informal basis as needed.
The current members are as followed:
Council Members Expiration of Term Appointed Term
Frederick S. Crown, Jr., CFA June 30, 2012 5 year 124 Longwood Place Nashville, TN 37215 Phone: 615-385-3753 E-mail: [email protected]
Henry J. Delicata June 30, 2014 5 year Park Street Capital One Federal Street, 24th Floor Boston, MA 02109 Phone: 617-897-9252 / Fax: 617-897-9253 E-mail: [email protected]
Susan Logan Huffman, CFA June 30, 2011 5 year Managing Director Reliant Investment Management, LLC 6077 Primacy Parkway, Suite 130 Memphis, TN 38119 Phone: 901-843-0600 / Fax: 901-843-0325 E-mail: [email protected]
George B. Stadler, CFA June 30, 2010 5 year 1109 Belle Meade Blvd Nashville, TN 37205 Phone: 615-416-3455 cell E-mail: [email protected]
Chuck Webb, CFA June 30, 2013 5 year Chief Investment Officer Weaver C. Barksdale & Associates One Burton Hills Boulevard, Suite 100 Nashville, TN 37215 Phone: 615-665-1088 E-mail: [email protected]

TENNESSEE CONSOLIDATED RETIREMENT SYSTEM Board of Trustees Meeting
Third Quarter Fiscal Year 2009-2010
January 1, 2010 – March 31, 2010
TABLE OF CONTENTS Page Minutes of June 3, 2010 IAC Meeting ....................................................................1 Portfolio Overview...................................................................................................5 Equity Portfolio........................................................................................................8 Fixed Income Portfolio ..........................................................................................17 Real Estate Portfolio ..............................................................................................27 Private Equity Portfolio .........................................................................................29 Derivative and Currency Activity..........................................................................31 Operations Report ..................................................................................................35 Appendix....................................................................................................................

Minutes from the Investment Advisory Council Meeting June 3, 2010
Mr. Michael Brakebill, Chief Investment Officer, convened the meeting at 10:00 a.m. in the 11th Floor conference room of the Andrew Jackson State Office Building. Investment Advisory Council (IAC) members present were Mr. George Stadler, Mr. Chuck Webb, Ms. Susan Huffman and Mr. Fred Crown. Mr. Henry Delicata participated via conference call. Investment staff members present were Michael Brakebill, Ed Hennessee, Andy Palmer, Peter Katseff, Lamar Villere, Tim McClure, Mike Keeler, Jim Robinson, Carrie Green, Derrick Dagnan, Matthew Haitas, Chris Weis and Rhonda Myers. Mr. Brakebill opened the discussion by reviewing investment performance in the quarterly IAC Report and in the quarterly Strategic Investment Solutions (SIS) report. The one-year absolute return of 24.46% is well in excess of the fund’s actuarial requirements; however the ten-year return of 3.2% illustrates the difficulties investors have faced over an extended period. Mr. Brakebill reiterated how the fund tends to under-perform peers in rising markets due to conservative asset allocation. The discussion moved to a presentation on key initiatives where Mr. Brakebill highlighted the work staff has done in conjunction with SIS in modifying the current asset allocation to raise the overall return of the fund. Mr. Brakebill reviewed the specific changes with council members who received the potential changes positively. These potential changes will be reviewed with the Investment Committee and Board of Trustees of TCRS. After review and discussion, policy language will be presented for approval. Mr. Brakebill moved the discussion to focus on recent market and portfolio trends. He reviewed how the fund had decreased the equity weighting of the portfolio in late April 2009. As equity market values fell throughout May, the under-weighting grew to a point where staff was beginning to re-allocate back into stocks and Mr. Brakebill pointed out recent purchases in international equities as an example. Mr. Brakebill then relayed the details of the trading error in CF Industries stock which occurred during the index sales in late April. Mr. Brakebill discussed how the order management system could have helped avoid this error and that staff was working to improve its processes to mitigate potentials for further errors. Mr. Mike Keeler moved the discussion to domestic equities. During the quarter, staff narrowed the under-weight to small capitalization stocks by adding to the Russell 2000 futures position. Currently staff is comfortable with a slight under-weight given extended valuations and rather high growth expectations for the small and mid cap stocks relative to larger cap names. However, staff anticipates narrowing the under-weight during the upcoming quarters. In addition, during the period staff launched the Canadian TSE 60 replication fund with an initial commitment of $100 million. Finally, staff is preparing for the onset of Bloomberg trade order management. Mr. Jim Robinson reviewed the Quant Fund. In the March quarter, quantitative factors moved to a more neutral standing, especially compared to the drubbing taken in 2009. Value and growth
1

factors are expected to increase in their efficacy for picking stocks over the next several years. These factors are just now coming out of a period of historically perverse performance, even if that period has been about average in length. As real interest rates rise from depressed levels, lower quality companies will lose the tailwind of depressed capital costs. High quality, higher growth, and lower valuation stocks should benefit from these trends at the expense of lower quality, higher beta, and smaller cap stocks. Offsetting this to some extent is the European exposure of many larger cap stocks and the step down in growth expected from that region. The Sector Fund under-performed during the quarter mostly due to poor stock selection. Factors that hurt performance include worries over Chinese fiscal tightening, Greek debt woes affecting the value of the euro and Federal support for weak companies while restraining profitable ones. The international equity managers added 128 basis points over the benchmark EAFE IMI Index. Seven of nine managers beat their benchmarks this quarter as a result of generally good stock selection but also with country allocation decisions by Putnam, Baring and Walter Scott. After the market selloff post quarter's end, TCRS added $250 million to its international allocation by buying iShares MSCI EAFE Index Fund (EFA) exchange traded funds (etfs). Mr. Mike Keeler reviewed the Mid Cap Fund. The broader, smaller indices generally performed better than the S & P 500 during the period as risk investors began to actively seek risk. Outside of capitalization, value factors did well, as did low quality, low and negative return on equity (ROE) and high debt to equity names. The Mid Cap Fund under-performed the S & P Mid Cap 400 due to an under-weight to the strongly performing Financial Services sector as well as poor stock selection within the sector. The fund missed huge rebound moves in the distressed banks and low quality insurance companies. Poor stock selection in the Health, Technology and Consumer Staples sectors offset good results in the Industrial and Materials sectors. Mr. Andy Palmer reviewed the performance of the fixed income portfolios for the quarter. He noted that the performance of all of the portfolios exceeded their benchmarks. For the domestic portfolio, a continuation of spread tightening, particularly in CMBS, Non-agency MBS and Corporate Bonds provided the bulk of the performance. Within the credit portfolios, an emphasis on BBB rated securities and financial companies was rewarded during the quarter. In the MBS market, an underweight to FHLMC pass through securities helped in the quarter. In March, FHLMC implemented its program to transfer non-performing mortgages from pools to their balance sheet. Most of these redemptions occurred to bonds with premium valuations creating a mark to market loss for the month. FNMA will implement its transfer program in the second quarter and the performance impact should reverse. Other than monthly rebalancing among sectors to offset relative performance differences, the domestic portfolio remained stable in its exposures. During the second quarter to date, risk positions have been reduced through the sale of ABS, CMBS and Non Agency MBS with proceeds redeployed into government backed sectors. The Inflation Hedged portfolio added performance relative to its benchmark. The portfolio was positioned for an increase in rates by owning more short-intermediate maturity securities and fewer intermediate maturity securities than the index. Rates moved to reward that positioning. In addition, duration was extended intra-period in response to higher real rates.
2
The International Fixed portfolio benefited from diversification away from Yen and a small currency hedge back to Dollars from Yen. The fixed income portfolio employed Treasury futures during the quarter to hedge out the interest rate risk of a corporate bond position and to replicate the exposure of owning five-year Treasury notes. In the coming quarter, it is expected that futures could be used to reduce the duration of the portfolio and options on futures could be used to protect the portfolio from a crisis event that would drive interest rates down sharply. Mr. Katseff provided an overview of the real estate data in the IAC report. He stated that the appraised values on real estate have been impacted by the appraisers using conservative assumptions and using high discount rates. Mr. Brakebill further stated that he believes there will be future write-ups for many of the TCRS properties due to overly conservative valuations. Mr. Katseff emphasized that TCRS owns quality properties in strong locations that should perform well over the long-term; however, he indicated that he favors apartments to other classes in the short-term, because apartment occupancy can always be increased by decreasing rents. Further, he stated that the performance of industrial properties remains highly dependent on location. He concluded his remarks by stating that the pricing of properties remains the key aspect of any acquisition. Mr. Lamar Villere provided an update on the private equity portfolio. He noted that early performance appears strong, but is not meaningful as very little capital has actually been called by the funds. Mr. Villere also provided an update on the private equity RFP process, which is expected to conclude in July. Fifteen firms have notified TCRS of their intention to submit proposals. Mr. Villere discussed recent commitments of $40 million each to Oaktree Opportunities VIII and VIIIb. He also discussed the pipeline, which includes a venture capital fund and a buyout fund. Mr. Tim McClure gave an update of the status of the Bloomberg OMS project. The kickoff meeting took place on February 23, 2010. Since then, many of the basic system components have been developed and system testing has taken place. User training has been delayed due to a procurement issue concerning the required communications server. This issue has been resolved and user training is scheduled to begin June 16 and full implementation is scheduled for July 31, 2010. Mr. McClure also discussed changes in personnel. Josh Stites has accepted the position of Staff Assistant to the Treasurer and there is a search underway for his replacement. When the position is filled, the topic of securities lending will be addressed. The meeting adjourned at 12:00 p.m.
3

Page is intended to be blank
4

Performance Review March 2010
Absolute comparison
1 quarter return of 2.46% 1 year return of 24.46%
10 year return of 3.20%
Benchmark (relative) comparison
Qtr return of 2.46% trailed allocation index of 2.73% (0.27%) 1 year return of 24.46% trailed allocation index of 27.91% (3.45%)
o TAA down 19 bps in quarter. o DFI up 119 bps in quarter. Up 882 bps for year
o DE down 26 bps in quarter. Down 344 bps for year
o IE up by 128 bps in quarter. Down 114 bps for year
o Currency overlay in IE was part of risk reduction trade
o RE down 101 bps for year
Peer comparison
1 quarter return ranked at 95% (0% = best)
1 year return ranked at 92% 3 year return ranked at 39% (beat 61% of peers)
5

Key Initiatives
March 2010
Asset allocation and implementation review
Securities lending Private Equity Consulting Search
General Consulting Search
Improve Investment Operations Support
Bloomberg OMS
6

TCRS Asset Allocation
$ = millions Source: Strategic Investment Solutions, Inc.
March 2010
26.3% 27.8%
32.3%34.6% 35.1%
10.5%
11.8%
14.4%
14.5% 14.4%
37.4%
36.5%
36.0%33.4% 33.2%
3.0%2.9%
2.9% 3.6% 3.4%
8.2%7.8%
7.1%7.9% 7.8%
5.0%4.6%
4.1%3.3% 3.2%9.7% 8.6%
3.2% 2.7% 2.8%
0%
10%
20%
30%
40%
50%
60%
70%
80%
90%
100%03/31/09 06/30/09 09/30/09 12/31/09 03/31/10
Per
cen
t o
f T
ota
l Fu
nd
US Equity Int'l Equity US Fixed Income Int'l Fixed IncomeInflation Hedged Bond Real Estate Short Term Private Equity (Column Top)
$6,405 $7,307
$9,225$10,055 $10,459
$2,549
$3,110
$4,114
$4,197 $4,305
$9,107
$9,589
$10,286$9,698 $9,906
$740$771
$818 $1,033 $1,010
$1,989$2,062
$2,040$2,294 $2,336
$1,212$1,198
$1,177$972 $968$2,372 $2,263
$905 $773 $833$- $- $5 $5 $11
$24,374 $26,301 $28,571 $29,028 $29,828TCRS Total
U.S. Equity
Int'l Equity
U.S. Fixed Income
7

TCRS Domestic Equity
Domestic Equity Portfolio OverviewMichael Keeler, CFA
TCRS DOMESTIC EQUITY FUNDS
INDEX (incl SP500 fut) 17%
SECTOR32%
SMALL CAP 3% Mid Cap
8%
QUANT 40%
$3,370 m
$787 m
$ 1,815 m
$293 m
TCRS Cap Weights vs. S & P 1500 Composite
1.36%
-0.61%
-0.76%
-1.00%
-0.50%
0.00%
0.50%
1.00%
1.50%
Large Cap vs 500 Mid Cap vs. 400 Small Cap vs. 600
$4,194 m
8

TCRS Domestic Equity March 2010Large Cap Quant Fund
Jim Robinson, CFA
0.46
0.23 0.22 0.25 0.27 0.260.20
0.46
0.14
0.56
0.27
(0.25)
0.53
(0.16)
(0.58)
0.87
0.38
(0.35)
(0.17)
(0.25)
(0.02)
0.00
Con
sum
erD
iscr
etio
nary
Con
sum
er S
tapl
es
Ene
rgy
Fin
anci
als
Hea
lth C
are
Indu
stria
ls
Info
rmat
ion
Tec
hnol
ogy
Mat
eria
ls
Tel
ecom
mS
ervi
ces
Util
ities
Tot
al P
ortf
olio
Active Percent ExposureSector Weighting Difference
2.1
0.7
(0.6)
(1.3)
0.7
(1.8)
(0.2)(0.1)
0.7
(0.8)
(0.1)
1 2 3 4 5 6 7 8 9 10 11
Relative Return %
Forecast Tracking Error: 1.15%
Of the four multi-factor models influencing the Quant Fund’s returns in the March quarter, only Price Momentum contributed positively. Overall, the fund experienced slightly negative relative performance.
March 2010 Qtr Value +
Momentum Earnings
Momentum Price
Momentum Relative Value
Information Coefficient
0.00 0.03 0.03 -0.02
Long–Short Spread %ROR -2.30 -2.12 4.19 -1.91
After coming through a sustained period where most broadly based multi-factor quantitative models have not worked well, price momentum’s effectiveness may wane as more fundamentally oriented factors assume leadership. Companies with top and bottom line growth and continued upside surprises are likely candidates to replace more technically oriented variables. If the economy can continue to plug along after recent massive cost cutting and years of under investing in plant and equipment, revenue growth plus higher job creation and capital spending should unfold over the next several quarters. The high correlation of factor returns in 2003 and 2009 lends credence to 2010, like 2004 and 2005,
being a good time for both value and growth (more so than price momentum) strategies. High beta strategies did not work well in 2004-05 and seem to have run their course for this market cycle. Versus lower quality stocks, higher quality stocks are now selling at a discount on P/E, price to book, and price to sales as they have for most of the past 11+ years. If real interest rates rise and reverse an atypically low cost of capital, the premium paid for riskier companies’ stocks should dissipate. As seems to be happening currently, a peak in earnings estimate revisions is also usually associated with outper-formance by higher quality stocks.
9

TCRS Domestic Equity March 2010
Largest Over Weights by Stock in Fund Largest Under Weights by Stock in Fund
Ticker Description Ticker DescriptionCMCSK Comcast Corp. (Cl A Special) 51 CMCSA Comcast Corp. (Cl A) -51WMT Wal-Mart Stores Inc. 43 EMC EMC Corp. -35NWSA News Corp. (Cl A) 42 LOW Lowe's Cos. -34WLP WellPoint Inc. 36 MCD McDonald's Corp. -34MDT Medtronic Inc. 35 BAX Baxter International Inc. -33MSFT Microsoft Corp. 34 C Citigroup Inc. -31IBM International Business Machines Co 32 GD General Dynamics Corp. -28TRV Travelers Cos. Inc. 31 NKE Nike Inc. (Cl B) -27CEG Constellation Energy Group Inc. 31 CELG Celgene Corp. -27EMR Emerson Electric Co. 31 SO Southern Co. -26UTX United Technologies Corp. 30 MS Morgan Stanley -25TJX TJX Cos. 30 NEM Newmont Mining Corp. -24TGT Target Corp. 29 D Dominion Resources Inc. (Virginia) -23CNI Canadian National Railway Co. 28 EOG EOG Resources Inc. -22APA Apache Corp. 28 MON Monsanto Co. -22PM Philip Morris International Inc. 28 BBT BB&T Corp. -21NOV National Oilwell Varco Inc. 27 DUK Duke Energy Corp. -20CI CIGNA Corp. 26 TMO Thermo Fisher Scientific Inc. -20DLTR Dollar Tree Inc. 26 NSC Norfolk Southern Corp. -20DD E.I. DuPont de Nemours & Co. 26 AGN Allergan Inc. -19
Large Cap Quant FundJim Robinson, CFA
Bps Over Index Wt
Bps Under
Active Bets in Fund vs. S&P500, Grouped by Bet Sizes
0.0% 0.0% 0.0% 0.0% 0.0%0.5%
0.0%
1.7%
2.7%
10.0%
12.6%
7.3%
9.2%
7.0%
2.6%
0.8% 0.5%0.0% 0.0% 0.0% 0.0% 0.0%
0.0%
2.0%
4.0%
6.0%
8.0%
10.0%
12.0%
14.0%
< ─
100
bps
─10
0bps
to─
90bp
s
─90
bps
to─
80bp
s
─80
bps
to─
70bp
s
─70
bps
to─
60bp
s
─60
bps
to─
50bp
s
─50
bps
to─
40bp
s
─40
bps
to─
30bp
s
─30
bps
to─
20bp
s
─20
bps
to─
10bp
s
─10
bps
to 0
bps
0bps
to +
10bp
s
+10
bps
to+
20bp
s
+20
bps
to+
30bp
s
+30
bps
to+
40bp
s
+40
bps
to+
50bp
s
+50
bps
to+
60bp
s
+60
bps
to+
70bp
s
+70
bps
to+
80bp
s
+80
bps
to+
90bp
s
+90
bps
to+
100b
ps
> +
100b
ps
Pe
rce
nt
of
Fu
nd
Number of Individual Stocks in Bet Size Bins
0 0 0 0 0 1 0 5 11
73
159
72
29
8 2 1 0 0 0 0 00
25
50
75
100
125
150
175
< ─
100
bps
─10
0bps
to─
90bp
s
─90
bps
to─
80bp
s
─80
bps
to─
70bp
s
─70
bps
to─
60bp
s
─60
bps
to─
50bp
s
─50
bps
to─
40bp
s
─40
bps
to─
30bp
s
─30
bps
to─
20bp
s
─20
bps
to─
10bp
s
─10
bps
to 0
bps
0bps
to +
10bp
s
+10
bps
to+
20bp
s
+20
bps
to+
30bp
s
+30
bps
to+
40bp
s
+40
bps
to+
50bp
s
+50
bps
to+
60bp
s
+60
bps
to+
70bp
s
+70
bps
to+
80bp
s
+80
bps
to+
90bp
s
+90
bps
to+
100b
ps
> +
100b
ps
Nu
mb
er
of
Be
ts
265
10

TCRS Domestic Equity
Comments:
March 2010Large Cap Sector FundRoy Wellington, CFA
0.370.19
0.28 0.36 0.290.42
0.26
0.85
0.22
0.450.33
(0.82)
0.44
(0.56)
(1.86)
(0.06)
1.17
2.03
0.39
(0.25)
(0.48)
0.00
Co
nsu
me
rD
iscr
etio
na
ry
Co
nsu
me
r S
tap
les
En
erg
y
Fin
an
cia
ls
He
alth
Ca
re
Ind
ust
ria
ls
Info
rma
tion
Te
chn
olo
gy
Ma
teri
als
Te
leco
mm
Se
rvic
es
Util
itie
s
To
tal P
ort
folio
Active Percent ExposureSector Weighting Difference
Forecast Tracking Error: 2.06%
0.9
(0.1)
(0.4)
(1.9)
0.9
(1.5)
(0.2)
(1.3)
1.5
(0.8)
(0.4)
1 2 3 4 5 6 7 8 9 10 11
Relative Return %
Forecast Tracking Error: 2.06%
The Sector Fund had its β (sector exposure) meeting on May 18. The portfolio maintained its positioning for an expected economic recovery emphasizing Technology and Industrials but some bearishness was evident as analysts were looking to lower weighting in Technology and Financials. The team reviewed comments made by analysts and companies about concerns over growth in China and exposure to a weaker euro. It was reported that analyst commentary was at an early stage while companies are seeing no impacts as yet.
The overall bearish tone was certainly not expessed by WR for Industrials where a strong finish in the first quarter of 2010 seems to be continuing into the second on the strength and breadth of global recovery. Primarily domestic or European operations are not seeing quite the same strength.
The Sector Fund had its α (education seminar) meeting on April 23 with reviewing portfolio valuation and contstruction tactics along the lines of the documents that were developed in the earlier quarter.
It was a tough quarter for perfomance. The better companies are calulating the fiscal pressures of the new health care bill and other pending regulations. Less profitable companies are getting Federal support, turning normal security analysis upside down. The discovery that Greece cannot repay its debt has put pressure on the euro and so the portfolio is expressing new euro sensitivity that was never much of a factor before. Even apparently obvious moves like lending restraint in China are impacting markets out of proportion to any "surprise" element.
11

TCRS Domestic Equity March 2010
Largest Over Weights by Stock in Fund Largest Under Weights by Stock in Fund
Ticker Description Ticker Description
ORCL Oracle Corp. 81 BRK.B Berkshire Hathaway Inc. (Cl B) -127GS Goldman Sachs Group Inc. 71 C Citigroup Inc. -75INTC Intel Corp. 65 BA Boeing Co. -52IBM International Business Machines Cor 56 BAC Bank of America Corp. -43HPQ Hewlett-Packard Co. 55 T AT&T Inc. -41X United States Steel Corp. 48 MON Monsanto Co. -37TD Toronto-Dominion Bank 45 BK Bank of New York Mellon Corp. -35AAPL Apple Inc. 43 UNP Union Pacific Corp. -35BLK Blackrock Inc. 42 LLY Eli Lilly & Co. -35RIG Transocean Ltd. 40 MET MetLife Inc. -34JPM JPMorgan Chase & Co. 40 DOW Dow Chemical Co. -32BUCY Bucyrus International Inc. 38 DD E.I. DuPont de Nemours & Co. -32NE Noble Corp. 38 KO Coca-Cola Co. -31ASH Ashland Inc. 38 F Ford Motor Co. -31ESRX Express Scripts Inc. 36 EBAY eBay Inc. -29BEN Franklin Resources Inc. 36 JNJ Johnson & Johnson -28PDE Pride International Inc. 36 WFC Wells Fargo & Co. -28JOYG Joy Global Inc. 35 MHS Medco Health Solutions Inc. -28MMM 3M Co. 34 GD General Dynamics Corp. -28AMED Amedisys Inc. 33 COP ConocoPhillips -28
Large Cap Sector FundRoy Wellington, CFA
Bps Over Index Wt
Bps Under
Active Bets in Fund vs. S&P500, Grouped by Bet Sizes
1.3%
0.0% 0.0%0.8%
0.0%0.5% 0.8%
3.0%
4.7%
9.7%
12.1%
5.3%
8.9%
7.7%
5.9%
1.8%1.1%
0.7% 0.7% 0.8%0.0% 0.0%
0.0%
2.0%
4.0%
6.0%
8.0%
10.0%
12.0%
14.0%
< ─
10
0 b
ps
─1
00
bp
s to
─9
0b
ps
─9
0b
ps
to─
80
bp
s
─8
0b
ps
to─
70
bp
s
─7
0b
ps
to─
60
bp
s
─6
0b
ps
to─
50
bp
s
─5
0b
ps
to─
40
bp
s
─4
0b
ps
to─
30
bp
s
─3
0b
ps
to─
20
bp
s
─2
0b
ps
to─
10
bp
s
─1
0b
ps
to 0
bp
s
0b
ps
to +
10
bp
s
+1
0b
ps
to+
20
bp
s
+2
0b
ps
to+
30
bp
s
+3
0b
ps
to+
40
bp
s
+4
0b
ps
to+
50
bp
s
+5
0b
ps
to+
60
bp
s
+6
0b
ps
to+
70
bp
s
+7
0b
ps
to+
80
bp
s
+8
0b
ps
to+
90
bp
s
+9
0b
ps
to+
10
0b
ps
> +
10
0b
ps
Pe
rce
nt
of
Fu
nd
Number of Individual Stocks in Bet Size Bins
1 0 0 1 0 1 29
19
72
106
63
3117
4 2 1 1 1 0 00
25
50
75
100
125
150
175
< ─
10
0 b
ps
─1
00
bp
s to
─9
0b
ps
─9
0b
ps
to─
80
bp
s
─8
0b
ps
to─
70
bp
s
─7
0b
ps
to─
60
bp
s
─6
0b
ps
to─
50
bp
s
─5
0b
ps
to─
40
bp
s
─4
0b
ps
to─
30
bp
s
─3
0b
ps
to─
20
bp
s
─2
0b
ps
to─
10
bp
s
─1
0b
ps
to 0
bp
s
0b
ps
to +
10
bp
s
+1
0b
ps
to+
20
bp
s
+2
0b
ps
to+
30
bp
s
+3
0b
ps
to+
40
bp
s
+4
0b
ps
to+
50
bp
s
+5
0b
ps
to+
60
bp
s
+6
0b
ps
to+
70
bp
s
+7
0b
ps
to+
80
bp
s
+8
0b
ps
to+
90
bp
s
+9
0b
ps
to+
10
0b
ps
> +
10
0b
ps
Nu
mb
er
of
Be
ts
236
12
TCRS Domestic Equity March 2010Mid–Cap FundMike Keeler, CFA
0.41
0.29 0.30
0.37 0.36
0.47 0.45 0.460.42
0.370.40
(0.21)
0.19
(0.14)
(0.78)
0.380.31
(0.05)
0.33
(0.03) (0.01)
0.00
Co
nsu
me
rD
iscr
etio
nary
Co
nsu
me
r S
tap
les
En
erg
y
Fin
anci
als
Hea
lth C
are
Indu
stria
ls
Info
rma
tion
Te
chn
olo
gy
Ma
teria
ls
Te
leco
mm
Se
rvic
es
Util
ities
To
tal P
ort
folio
Active Percent ExposureSector Weighting Difference
0.7
(2.8)
(2.1)(2.2)
(3.0)
1.5
(2.4)
3.5
(0.5)
0.2
(1.0)
1 2 3 4 5 6 7 8 9 10 11
Relative Return %
Forecast Tracking Error: 1.41%
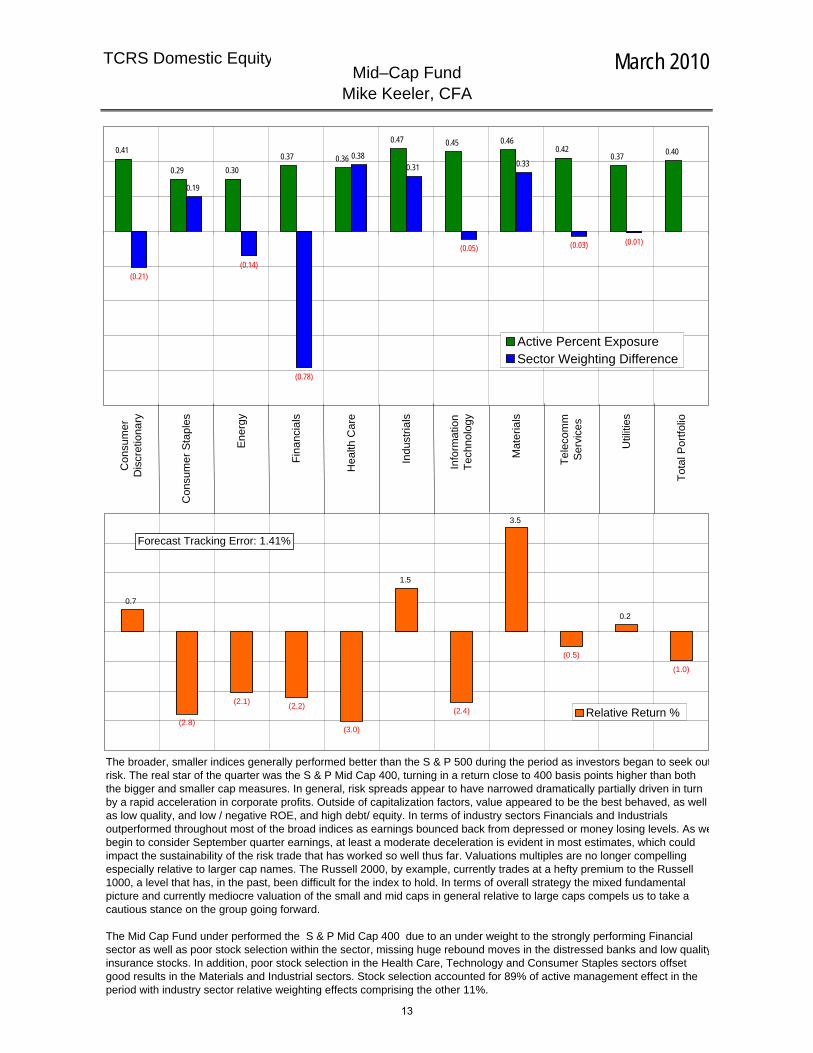
The broader, smaller indices generally performed better than the S & P 500 during the period as investors began to seek outrisk. The real star of the quarter was the S & P Mid Cap 400, turning in a return close to 400 basis points higher than both the bigger and smaller cap measures. In general, risk spreads appear to have narrowed dramatically partially driven in turn by a rapid acceleration in corporate profits. Outside of capitalization factors, value appeared to be the best behaved, as well as low quality, and low / negative ROE, and high debt/ equity. In terms of industry sectors Financials and Industrials outperformed throughout most of the broad indices as earnings bounced back from depressed or money losing levels. As webegin to consider September quarter earnings, at least a moderate deceleration is evident in most estimates, which could impact the sustainability of the risk trade that has worked so well thus far. Valuations multiples are no longer compelling especially relative to larger cap names. The Russell 2000, by example, currently trades at a hefty premium to the Russell 1000, a level that has, in the past, been difficult for the index to hold. In terms of overall strategy the mixed fundamental picture and currently mediocre valuation of the small and mid caps in general relative to large caps compels us to take a cautious stance on the group going forward.
The Mid Cap Fund under performed the S & P Mid Cap 400 due to an under weight to the strongly performing Financial sector as well as poor stock selection within the sector, missing huge rebound moves in the distressed banks and low qualityinsurance stocks. In addition, poor stock selection in the Health Care, Technology and Consumer Staples sectors offset good results in the Materials and Industrial sectors. Stock selection accounted for 89% of active management effect in the period with industry sector relative weighting effects comprising the other 11%.
13

TCRS Domestic Equity March 2010
Largest Over Weights by Stock in Fund Largest Under Weights by Stock in Fund
Ticker Description Ticker DescriptionROP Roper Industries Inc. 81 TRA Terra Industries Inc. -47ASH Ashland Inc. 65 ROVI Rovi Corp -40CYH Community Health Systems Inc. 59 MXB MSCI Inc. (Cl A) -39FOSL Fossil Inc. 58 OSIP OSI Pharmaceuticals Inc. -36SIVB SVB Financial Group 57 TRMB Trimble Navigation Ltd. -35RYN Rayonier Inc. REIT 55 FNF Fidelity National Financial Inc. -35ADS Alliance Data Systems Corp. 55 TRH TransAtlantic Holdings Inc. -35AFAM Almost Family Inc. 53 GMCR Green Mountain Coffee Roasters Inc -35DPL DPL Inc. 53 HEW Hewitt Associates Inc. (Cl A) -34FFIV F5 Networks Inc. 52 AGCO AGCO Corp. -34BEAV BE Aerospace Inc. 49 SPW SPX Corp. -34NVR NVR Inc. 47 ACM AECOM Technology Corp. -33BOH Bank of Hawaii Corp. 47 CREE Cree Inc. -32OKE ONEOK Inc. 46 JLL Jones Lang LaSalle Inc. -31AMG Affiliated Managers Group Inc. 46 MHK Mohawk Industries Inc. -31DLTR Dollar Tree Inc. 45 COMS 3Com Corp -31TKR Timken Co. 44 CBSH Commerce Bancshares Inc. -31ARW Arrow Electronics Inc. 44 AGL AGL Resources Inc. -31RE Everest Re Group Ltd. 44 PVH Phillips-Van Heusen Corp. -30ANSS Ansys Inc. 43 HPT Hospitality Properties Trust -30
Mid – Cap FundMike Keeler, CFA
Bps Over Index Wt
Bps Under
Active Bets in Fund vs. S&P400, Grouped by Bet Sizes
0.0% 0.0% 0.0% 0.0% 0.0% 0.0% 0.5%
6.7%
15.3%
13.8%
4.0%
1.8%
6.8%
11.2%
6.7%7.8%
4.4%
0.7%0.0%
0.8%0.0% 0.0%
0.0%
3.0%
6.0%
9.0%
12.0%
15.0%
18.0%
< ─
100
bps
─10
0bps
to─
90bp
s
─90
bps
to─
80bp
s
─80
bps
to─
70bp
s
─70
bps
to─
60bp
s
─60
bps
to─
50bp
s
─50
bps
to─
40bp
s
─40
bps
to─
30bp
s
─30
bps
to─
20bp
s
─20
bps
to─
10bp
s
─10
bps
to 0
bps
0bps
to +
10bp
s
+10
bps
to+
20bp
s
+20
bps
to+
30bp
s
+30
bps
to+
40bp
s
+40
bps
to+
50bp
s
+50
bps
to+
60bp
s
+60
bps
to+
70bp
s
+70
bps
to+
80bp
s
+80
bps
to+
90bp
s
+90
bps
to+
100b
ps
> +
100b
ps
Pe
rce
nt
of
Fu
nd
Number of Individual Stocks in Bet Size Bins
0 0 0 0 0 0 1
20
62
92
80
45 45
20 188
1 0 1 0 0
61
0
25
50
75
100
125
< ─
100
bps
─10
0bps
to─
90bp
s
─90
bps
to─
80bp
s
─80
bps
to─
70bp
s
─70
bps
to─
60bp
s
─60
bps
to─
50bp
s
─50
bps
to─
40bp
s
─40
bps
to─
30bp
s
─30
bps
to─
20bp
s
─20
bps
to─
10bp
s
─10
bps
to 0
bps
0bps
to +
10bp
s
+10
bps
to+
20bp
s
+20
bps
to+
30bp
s
+30
bps
to+
40bp
s
+40
bps
to+
50bp
s
+50
bps
to+
60bp
s
+60
bps
to+
70bp
s
+70
bps
to+
80bp
s
+80
bps
to+
90bp
s
+90
bps
to+
100b
ps
> +
100b
ps
Nu
mb
er
of
Be
ts
14

TCRS Domestic Equity Mar 2010
Portfolio S&P 500 Portfolio S&P 500Ticker Name Weight Weight Difference Ticker Name Weight Weight DifferenceXOM Exxon Mobil Corp. 3.03 2.99 0.03 BRK.B Berkshire Hathaway Inc. (Cl B) 1.05 1.27 (0.22)MSFT Microsoft Corp. 2.15 2.12 0.04 DISCA Discovery Communications Inc. (Series A 0.00 0.09 (0.09)AAPL Apple Inc. 2.02 2.02 (0.00) KFT Kraft Foods Inc. 0.43 0.50 (0.07)GE General Electric Co. 1.84 1.84 0.01 NRG NRG Energy Inc. 0.00 0.05 (0.05)PG Procter & Gamble Co. 1.76 1.74 0.02 URBN Urban Outfitters Inc. 0.00 0.05 (0.05)JNJ Johnson & Johnson 1.71 1.70 0.01 OKE ONEOK Inc. 0.00 0.05 (0.05)BAC Bank of America Corp. 1.69 1.70 (0.01) HP Helmerich & Payne Inc. 0.00 0.04 (0.04)JPM JPMorgan Chase & Co. 1.68 1.68 (0.01) MSFT Microsoft Corp. 2.15 2.12 0.04IBM International Business Machines Corp. 1.60 1.58 0.03 XOM Exxon Mobil Corp. 3.03 2.99 0.03WFC Wells Fargo & Co. 1.51 1.53 (0.01) PNC PNC Financial Services Group Inc. 0.26 0.29 (0.03)
Forecasted Tracking Error 0.10%Historical Tracking Error 0.16%Value at Risk $3,098,983
Top Ten Holdings as of March 31, 2010 Ten Largest Overweights and Underweights as of Mar. 31, 2010
Tracking Error
S&P 500 Index FundDaniel Crews, CFA
TCRS Index Fund Monthly Returns Versus S&P 500
-0.10%
-0.05%
0.00%
0.05%
0.10%
0.15%
0.20%
0.25%
0.30%
Oct-0
6
Dec-0
6
Feb-0
7
Apr-0
7
Jun-
07
Aug-0
7
Oct-0
7
Dec-0
7
Feb-0
8
Apr-0
8
Jun-
08
Aug-0
8
Oct-0
8
Dec-0
8
Feb-0
9
Apr-0
9
Jun-
09
Aug-0
9
Oct-0
9
Dec-0
9
Feb-1
0
Rel
ativ
e R
etu
rns
Comments:
• Due to trading error in the issue CF Industries (Ticker: CF), Index Fund tracking error will be significantly negative for May 2010. The error is being unwound opportunistically but results in active deviation from the benchmark.
• Successful active trading in April will cause April 2010 tracking error to be significantly positive.
• Index Fund liquidated $200 million in assets on 4/29/10• Index Fund liquidated $250 million in assets on 4/16/10• Index Fund received an additional $100 million inflow on 9/24/09• Index Fund received an additional $100 million inflow on 7/29/09• April 2009 witnessed relatively large negative deviation from the index (-7 bps) due to a double corporate action by Time Warner, large banks raising substantial amounts of equity following the release of the infamous "stress test" results, the exit of Noble (which did not behave according to the empirically normative pattern for S&P 500 exclusions), and the tactical holding of Citi preferred shares rather than Citi common. • Extraordinary positive tracking error was evident in the fund during March 2009 (25 bps). The deviation from benchmark returns in March primarily relates to good timing on a trade conducted March 2 and to class action litigation income posted to the fund. • Index Fund received an additional $200 million during January 2009 and sold a combined $400 million in February and March.
15
Manager returns for the quarter ending March 31, 2010 Manager returns for five years ending March 31, 2010
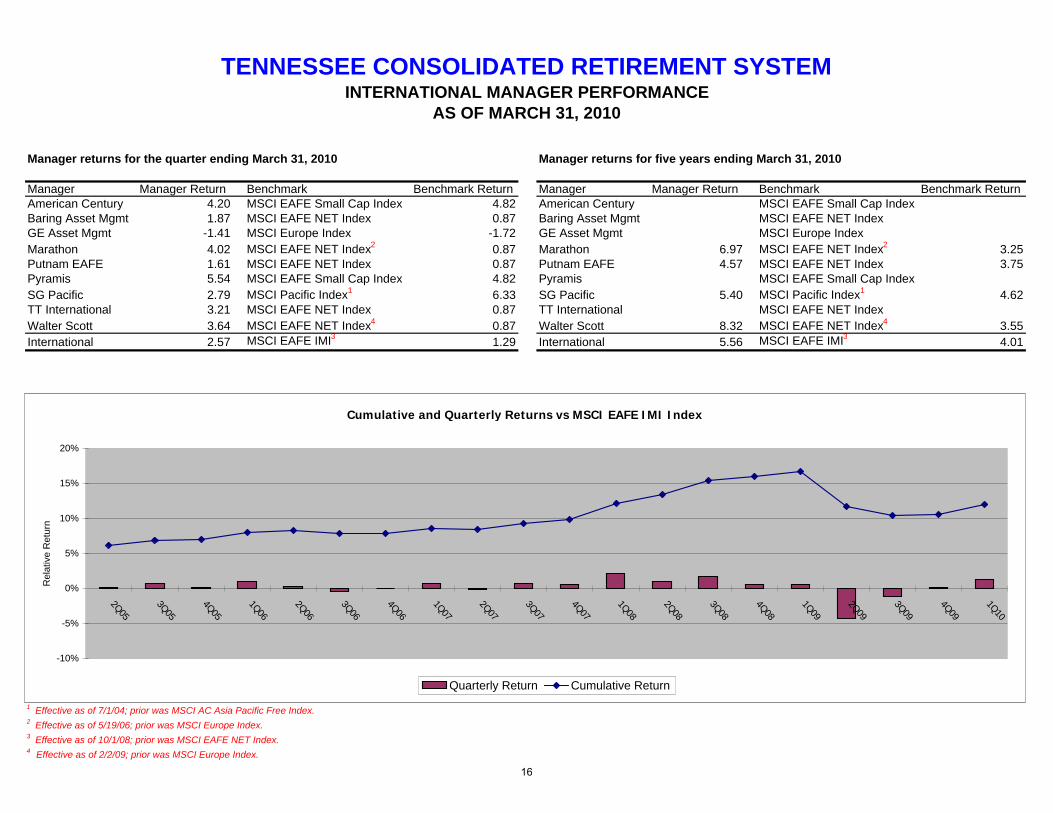
Manager Manager Return Benchmark Benchmark Return Manager Manager Return Benchmark Benchmark ReturnAmerican Century 4.20 MSCI EAFE Small Cap Index 4.82 American Century MSCI EAFE Small Cap IndexBaring Asset Mgmt 1.87 MSCI EAFE NET Index 0.87 Baring Asset Mgmt MSCI EAFE NET IndexGE Asset Mgmt -1.41 MSCI Europe Index -1.72 GE Asset Mgmt MSCI Europe IndexMarathon 4.02 MSCI EAFE NET Index2 0.87 Marathon 6.97 MSCI EAFE NET Index2 3.25Putnam EAFE 1.61 MSCI EAFE NET Index 0.87 Putnam EAFE 4.57 MSCI EAFE NET Index 3.75Pyramis 5.54 MSCI EAFE Small Cap Index 4.82 Pyramis MSCI EAFE Small Cap IndexSG Pacific 2.79 MSCI Pacific Index1 6.33 SG Pacific 5.40 MSCI Pacific Index1 4.62TT International 3.21 MSCI EAFE NET Index 0.87 TT International MSCI EAFE NET IndexWalter Scott 3.64 MSCI EAFE NET Index4 0.87 Walter Scott 8.32 MSCI EAFE NET Index4 3.55International 2.57 MSCI EAFE IMI3 1.29 International 5.56 MSCI EAFE IMI3 4.01
1 Effective as of 7/1/04; prior was MSCI AC Asia Pacific Free Index.2 Effective as of 5/19/06; prior was MSCI Europe Index.3 Effective as of 10/1/08; prior was MSCI EAFE NET Index.4 Effective as of 2/2/09; prior was MSCI Europe Index.
TENNESSEE CONSOLIDATED RETIREMENT SYSTEMINTERNATIONAL MANAGER PERFORMANCE
AS OF MARCH 31, 2010
Cumulative and Quarterly Returns vs MSCI EAFE IMI Index
-10%
-5%
0%
5%
10%
15%
20%
2Q05
3Q05
4Q05
1Q06
2Q06
3Q06
4Q06
1Q07
2Q07
3Q07
4Q07
1Q08
2Q08
3Q08
4Q08
1Q09
2Q09
3Q09
4Q09
1Q10R
elat
ive
Ret
urn
Quarterly Return Cumulative Return
16
TCRS Fixed Income March 2010
Value (Yield Book) Portfolio Benchmark ActivePortfolio ($MMs) Return Q1 Return Q1 Return Q1
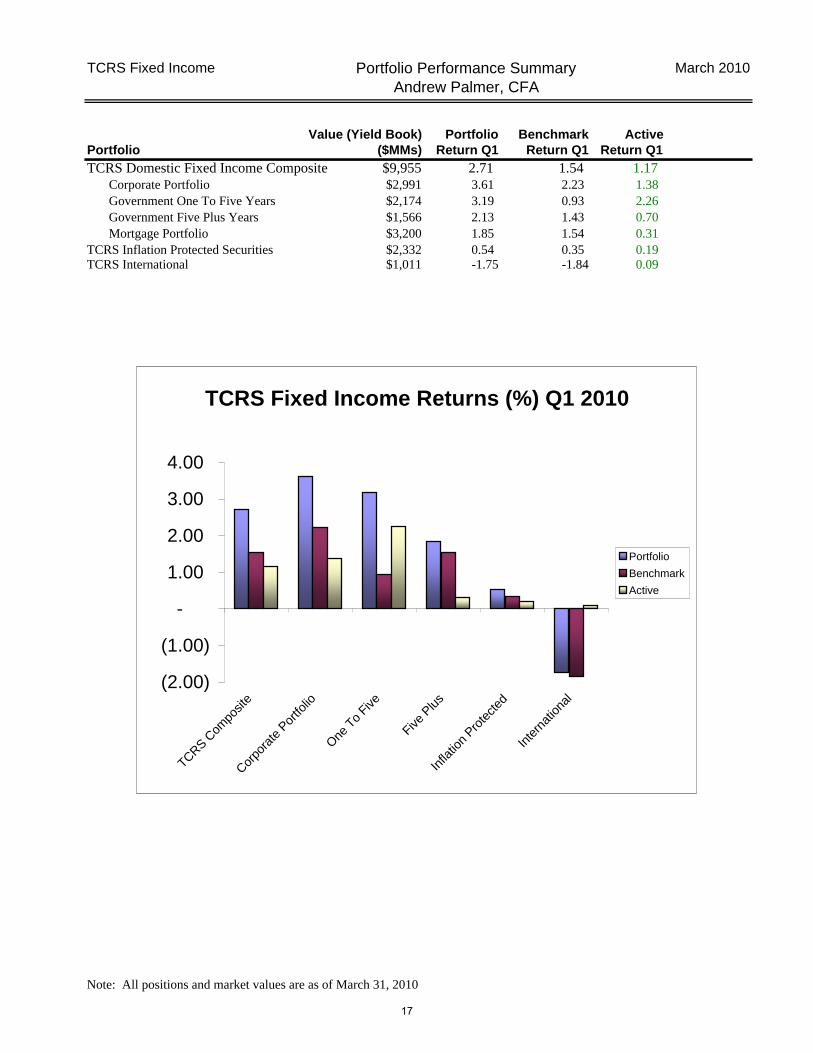
TCRS Domestic Fixed Income Composite $9,955 2.71 1.54 1.17 Corporate Portfolio $2,991 3.61 2.23 1.38 Government One To Five Years $2,174 3.19 0.93 2.26 Government Five Plus Years $1,566 2.13 1.43 0.70 Mortgage Portfolio $3,200 1.85 1.54 0.31
TCRS Inflation Protected Securities $2,332 0.54 0.35 0.19 TCRS International $1,011 -1.75 -1.84 0.09
Note: All positions and market values are as of March 31, 2010
Portfolio Performance SummaryAndrew Palmer, CFA
TCRS Fixed Income Returns (%) Q1 2010
(2.00)
(1.00)
-
1.00
2.00
3.00
4.00
TCRS Com
posit
e
Corpo
rate
Por
tfolio
One T
o Five
Five P
lus
Infla
tion
Prote
cted
Inte
rnat
ional
Portfolio
Benchmark
Active
17

TCRS Fixed Income March 2010
Domestic Fixed Income
Portfolio CharacteristicsAndrew Palmer, CFA
Portfolio Characteristics
7.69
6.29
4.60
3.44
5.06 5.274.62
4.934.49
7.90
5.36
4.69 4.64
6.30
4.775.23
4.52
5.12
4.28
3.27
0.001.002.003.004.005.006.007.008.009.00
Wtd. Avg.Life TCRS
Wtd. Avg.Life INDEX
Yield toMaturityTCRS
Yield toMaturityINDEX
AvgCouponTCRS
AvgCouponINDEX
Mod. Dur.TCRS
Mod. Dur.INDEX
Eff. Dur.TCRS
Eff. Dur.INDEX
Previous Quarter Current Quarter
TCRS Quality: AAAINDEX Quality: AAA
18
TCRS Fixed Income March 2010
Domestic Fixed Income
source: Bloomberg
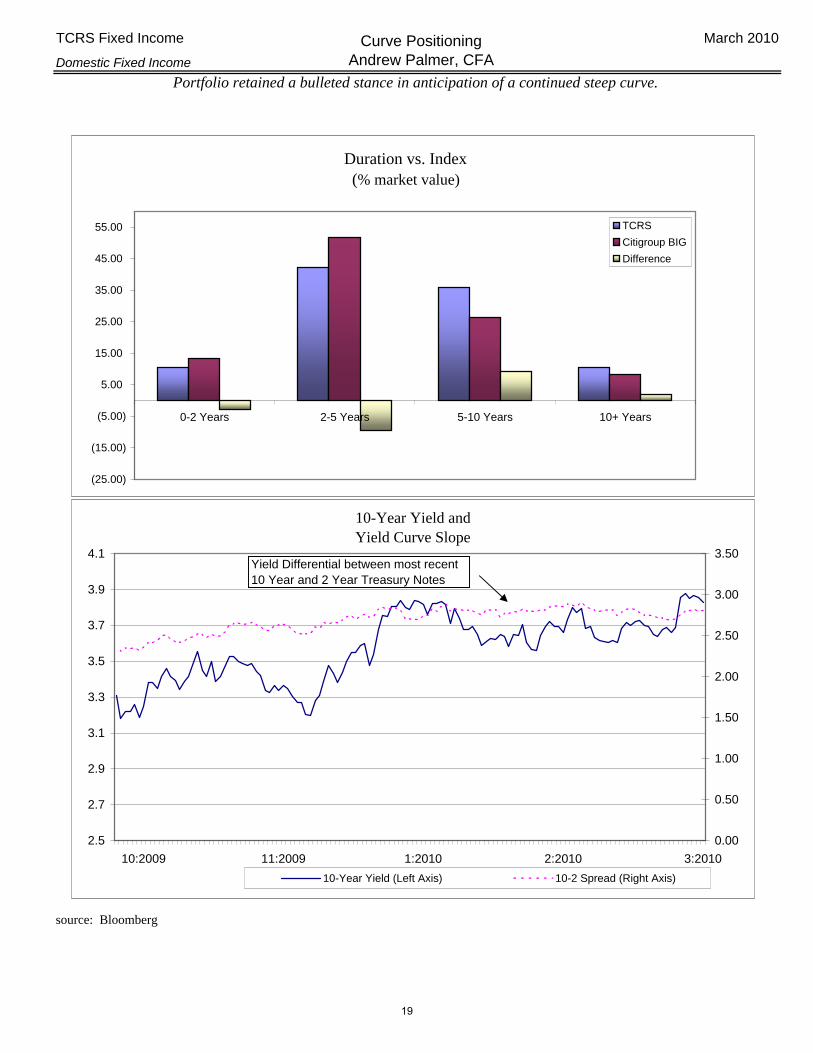
Portfolio retained a bulleted stance in anticipation of a continued steep curve.
Curve PositioningAndrew Palmer, CFA
Duration vs. Index(% market value)
(25.00)
(15.00)
(5.00)
5.00
15.00
25.00
35.00
45.00
55.00
0-2 Years 2-5 Years 5-10 Years 10+ Years
TCRS
Citigroup BIG
Difference
10-Year Yield and Yield Curve Slope
2.5
2.7
2.9
3.1
3.3
3.5
3.7
3.9
4.1
3:20102:20101:201011:200910:2009
0.00
0.50
1.00
1.50
2.00
2.50
3.00
3.50
10-Year Yield (Left Axis) 10-2 Spread (Right Axis)
Yield Differential between most recent 10 Year and 2 Year Treasury Notes
19
TCRS Fixed Income March 2010
Domestic Fixed Income
_____
source: Yield Book
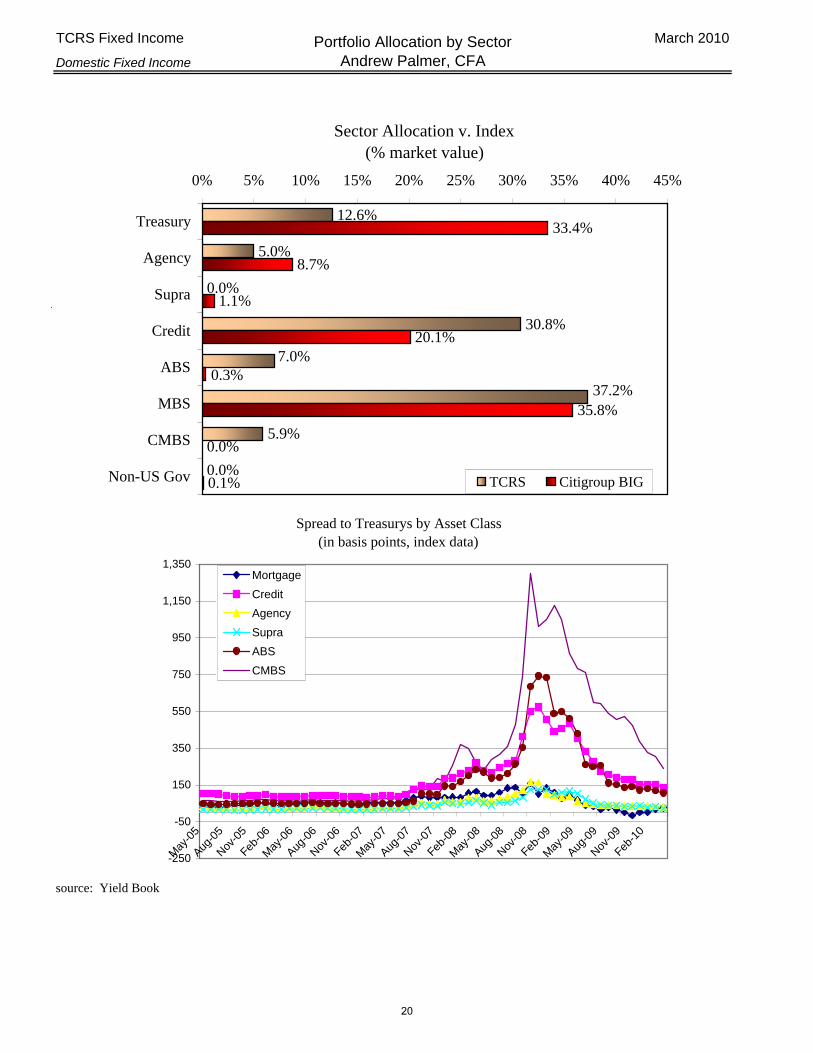
Portfolio Allocation by SectorAndrew Palmer, CFA
Sector Allocation v. Index(% market value)
12.6%
5.0%
0.0%
30.8%
5.9%
0.0%
33.4%
8.7%
1.1%
20.1%
35.8%
0.0%
0.1%
7.0%
37.2%0.3%
0% 5% 10% 15% 20% 25% 30% 35% 40% 45%
Treasury
Agency
Supra
Credit
ABS
MBS
CMBS
Non-US Gov TCRS Citigroup BIG
Spread to Treasurys by Asset Class(in basis points, index data)
-250
-50
150
350
550
750
950
1,150
1,350
May
-05
Aug-0
5
Nov-0
5
Feb-0
6
May
-06
Aug-0
6
Nov-0
6
Feb-0
7
May
-07
Aug-0
7
Nov-0
7
Feb-0
8
May
-08
Aug-0
8
Nov-0
8
Feb-0
9
May
-09
Aug-0
9
Nov-0
9
Feb-1
0
Mortgage
Credit
Agency
Supra
ABS
CMBS
20

TCRS Fixed Income March 2010
Domestic Fixed Income
source: Yield Book
Spreads continued to tighten during the quarter. TCRS spreads vs. index increase with quality.
Allocation by Credit QualityAndrew Palmer, CFA
Credit Allocation v. Index(% market value as of March 31)
13%
6%5%
32%
42%
4%4%
8%
0%
13%
37%
15%
11%9%
0%
10%
20%
30%
40%
GVTAGNAAAAAABBBBB
TCRS Citigroup BIG
Spread to Treasury by Credit Rating(in basis points, index data)
0
100
200
300
400
500
600
700
800
May
-05
Aug-0
5
Nov-0
5
Feb-0
6
May
-06
Aug-0
6
Nov-0
6
Feb-0
7
May
-07
Aug-0
7
Nov-0
7
Feb-0
8
May
-08
Aug-0
8
Nov-0
8
Feb-0
9
May
-09
Aug-0
9
Nov-0
9
Feb-1
0
Agency
AAA
AA
A
BBB
OAS by Credit Allocation(as of March 31)
139173
199
2629
91
136
217
614
28
179
297
0
250
500
AGNAAAAAABBBBB
21

TCRS Fixed Income March 2010
Domestic Fixed Income
Top 5 Credit Holdings (by Market Value) MktVal % MktVal BANK OF AMERICA 136,000 1.4 GENERAL ELECTRIC 111,000 1.1
JP MORGAN CHASE & C O 107,000 1.1VERIZON COMMUNICATIONS 76,531 0.8
CITIGROUP INC 74,349 0.8 Top 5 Credit Holdings (by Dollar Duration) $ Duration % $ Duration GENERAL ELECTRIC 80.49 1.6
BANK OF AMERICA 76.07 1.5JP MORGAN CHASE & C O 69.54 1.4AT&T INC 62.63 1.2
METLIFE INC 41.69 0.8
Allocation by Credit SectorAndrew Palmer, CFA
Sector Allocation v. Index(% market value)
51%
8%
3%
17%
14%
35%
15%
11%
19%
2%
12%
3%
4%7%
0% 5% 10% 15% 20% 25% 30% 35% 40% 45% 50% 55% 60%
Finance
Manufacturing
Service
Energy & Utilities
Consumer
Transportation
Telecom
TCRS CORPORATE CITI BIG CREDIT
22

TCRS Fixed Income March 2010
Domestic Fixed Income
CITIMarket Value
($MM - Yield Book) DifferenceAgency Mortgage Backed Securities $2,963,091 30.4 35.8 -5.5
GNMA15-Yr $2,272 0.0 0.1 -0.130-Yr $545,820 5.6 5.7 -0.1FNMA10-, 15- & 20-Yr $340,636 3.5 2.6 0.930-Yr $1,402,679 14.4 15.3 -0.9FHLM15-Yr $79,407 0.8 1.9 -1.130-Yr $522,086 5.4 10.3 -5.0
Agency Hybrid $70,191 0.7 0.0 0.7
Commercial Mortgage Backed Securities $571,430 5.9 0.0 5.9
CMO and Non Agency Passthroughs $632,416 6.5 0.0 6.5
Asset Backed Securities $685,876 7.0 0.3 6.7
$4,852,813 49.7 36.1 *13.6Total Securitized Product
TCRS
% of portfolio
Securitized Product BreakdownAndrew Palmer, CFA
Percent of Securitized Product
MBS
CMBS
CMO
ABS
23

TCRS Fixed Income March 2010
International Fixed Income
Portfolio Return: -1.75%Citigroup Non-US G5 Index: -1.84%
Active Return: 0.09%
TCRS Percent Percent
Mkt ($) Yield M. Dur of Value of $Dur
Australia ###### 5.56 3.00 1.5% 0.7%Norway ###### 1.06 2.28 1.3% 0.5%Britain ###### 3.26 7.51 10.5% 12.4%Euro ###### 2.19 5.56 31.9% 27.9%Japan ###### 0.91 6.75 54.9% 58.5%
###### 1.64 6.34 100.0% 100.0%
Citigroup G5 Sovereign Index (ex-US)Percent Percent
Mkt ($) Yield Dur of Value of $Dur
Britain ###### 3.32 8.74 10.4% 13.2%Euro ###### 2.33 6.23 30.1% 27.3%Japan ###### 0.89 6.88 59.5% 59.6%
###### 1.58 6.88 100.0% 100%
DifferenceValue M. Dur $ Dur
Differ Differ Differ
Australia 1.5% 3.0 0.7%Norway 1.3% 2.3 0.5%Britain 0.1% -1.2 -0.8%Euro 1.8% -0.7 0.7%Japan -4.6% -0.1 -1.1%
0.0% -0.5 0.0%
International Fixed IncomeAndrew Palmer, CFA
Exposure vs. Index
1.5%0.7%
-1.1%
1.3%
0.1%
1.8%
-4.6%
0.5%
-0.8%
0.7%
-6%
-4%
-3%
-1%
1%
2%
Australia Norway Britain Euro Japan
Mkt Difference
$Dur Difference
24

TCRS Fixed Income March 2010
Inflation Protected Fixed Income
Portfolio Value (Yield Book): $2,332,163Portfolio Return: 0.54%
Citigroup ILSI Index: 0.35%Active Return: 0.19%
% Market Value by DurationTCRS CITI Difference
0-2 28.95 21.46 7.492-4 30.29 33.30 -3.014-6 7.47 13.17 -5.706-8 15.66 9.86 5.818-10 16.34 20.80 -4.4610+ 1.28 1.41 -0.13
* The "breakeven" rate is the expected rate of inflation at which investment in TIPS yield the same return as investment in Treasuries
Source: Bloomberg
Inflation Hedged PortfolioAndrew Palmer, CFA
TIPS Breakevens* vs. Nominal Treasury Yields
-0.5
0.0
0.5
1.0
1.5
2.0
2.5
3.0
3.5
3/26
/201
0
1/1/
2010
10/9
/200
9
7/17
/200
9
4/24
/200
9
1/30
/200
9
11/7
/200
8
8/15
/200
8
5/23
/200
8
10-Yr 5-Yr
TIPS Real Yields
-0.5
0.0
0.5
1.0
1.5
2.0
2.5
3.0
3.5
3/26
/201
0
1/1/
2010
10/9
/200
9
7/17
/200
9
4/24
/200
9
1/30
/200
9
11/7
/200
8
8/15
/200
8
5/23
/200
8
10-Yr 5-Yr
25

Page is intended to be blank
26

TCRS Real Estate Real Estate Diversification March 2010
Peter Katseff
TCRS By Property Type
Industrial12%
Retail25%
Apts.31%
Office32%
NPI By Property Type
Office40%
Apts.24%
Retail21%
Industrial15%
Market Value
$969$972
$1,177$1,198
$800
$900
$1,000
$1,100
$1,200
$1,300
6/30/09 9/30/09 12/31/2009 3/31/2010
Millions
National Property Index of the National Council of Real Estate Investment Fiduciaries (the index used for US core properties).
Occupancy
78.2%
92.9% 93.0%90.9%
85.2%
92.5%89.4% 88.7%
70.0%
75.0%
80.0%
85.0%
90.0%
95.0%
Office Apartments Retail Industrial
TCRS Occupancy NPI Occupancy
QtrReport.xls 5/20/201027

TCRS Real Estate Real Estate Portfolio Returns March 2010
Budgeted Annual Income Return for calendar year 2010 (12 months) 6.61%
Peter Katseff
1.53% 1.36% 1.48% 1.41%
-2.05% -1.41% -1.81%
-18.54%
-20.00%
-15.00%
-10.00%
-5.00%
0.00%
5.00%
6/30/09 9/30/09 12/31/2009 3/31/2010
Income Appr/(Depr)
-.05% -0.33% -17.13%-.52%
5.90% 6.17% 5.53% 5.62% 5.88% 5.97%
-22.76% -21.98%
-10.61%-8.67%
-2.76%-1.16%
-25.00%
-20.00%
-15.00%
-10.00%
-5.00%
0.00%
5.00%
10.00%
TCRS 1 Yr. NCREIF 1 Yr. TCRS 3 Yr. NCREIF 3 Yr. TCRS 5 Yr. NCREIF 5 Yr.
Income Appr/(Depr)
3.00% 4.75%-17.88% -16.85% -5.51% -3.41%
QtrReport.xls 5/20/201028

Tennessee Consolidated Retirement System Private Equity Program Fiscal Q3 2010 Update
Lamar Villere, CFA Consultant RFP The private equity consultant RFP process was delayed somewhat in the approval process, but the RFP was posted on May 17, 2010. We expect to complete the selection process this summer, and begin working with selected consultant shortly thereafter. Given (a) our staffing constraints and (b) the involvement of the consultant in our process (as stipulated by TCRS investment policy), this is a critical hire for the private equity program. Performance
We have finalized our fiscal Q2:2010 results (12/31/09), and are pleased (if not shocked) to report that the program has a positive IRR of 12.3% net of fees due to portfolio valuation increases in the Khosla Ventures III portfolio. Due to the expected impact of the j-curve, we do not expect the overall program’s IRR to remain positive for long, but are pleased with these results nonetheless. New Commitments On March 5, we finally closed on a $50 million commitment to Oaktree PPIP Private Fund. Subsequent to the end of the quarter, we closed on two additional funds from Oaktree: Oaktree Opportunities VIII and VIIIb, both at $40 million. While we continue to be impressed with Oaktree, we expect this level of manager concentration to be the exception rather than the rule. Fund Pipeline
A brief update on the pipeline discussed at the last meeting: the distressed fund mentioned was Oaktree Opportunities VIII/VIIIb, which closed; the mezzanine fund was not approved by SIS; the small buyout fund was oversubscribed and TCRS was not able to secure a commitment; the venture capital fund is still in process and has been approved by the Investment Committee. An additional potential commitment is in due diligence.
29
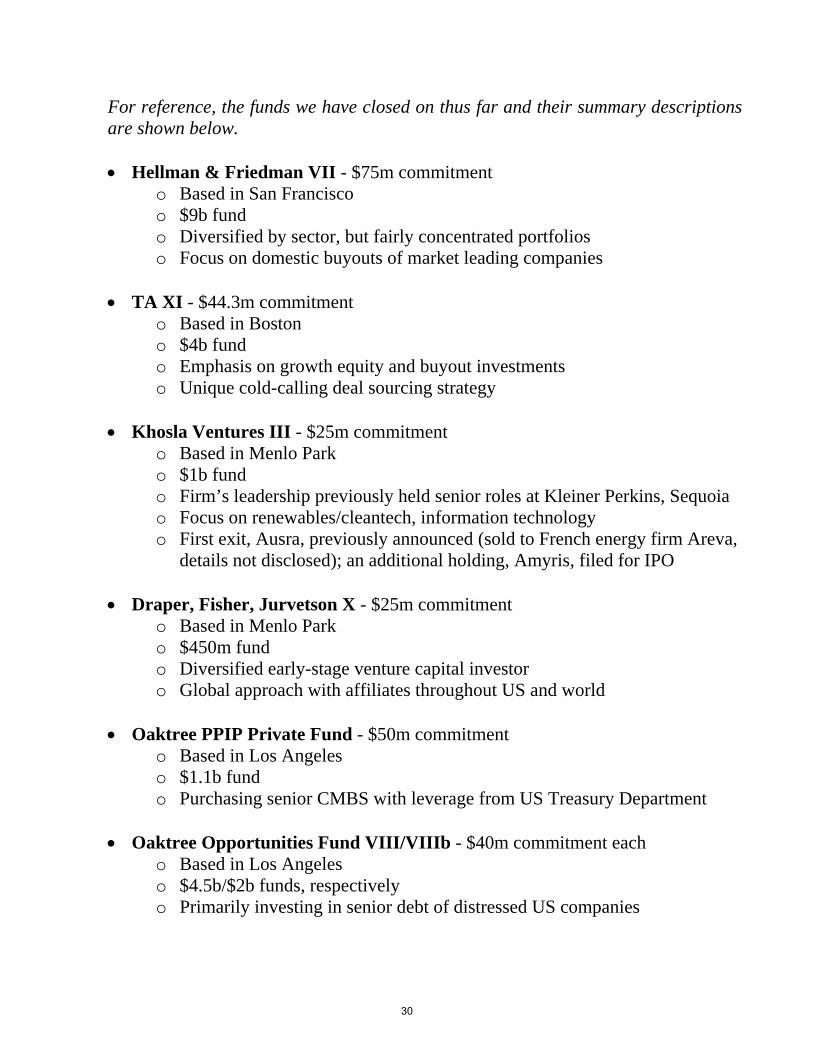
For reference, the funds we have closed on thus far and their summary descriptions are shown below. Hellman & Friedman VII - $75m commitment
o Based in San Francisco o $9b fund o Diversified by sector, but fairly concentrated portfolios o Focus on domestic buyouts of market leading companies
TA XI - $44.3m commitment o Based in Boston o $4b fund o Emphasis on growth equity and buyout investments o Unique cold-calling deal sourcing strategy
Khosla Ventures III - $25m commitment o Based in Menlo Park o $1b fund o Firm’s leadership previously held senior roles at Kleiner Perkins, Sequoia o Focus on renewables/cleantech, information technology o First exit, Ausra, previously announced (sold to French energy firm Areva,
details not disclosed); an additional holding, Amyris, filed for IPO
Draper, Fisher, Jurvetson X - $25m commitment o Based in Menlo Park o $450m fund o Diversified early-stage venture capital investor o Global approach with affiliates throughout US and world
Oaktree PPIP Private Fund - $50m commitment
o Based in Los Angeles o $1.1b fund o Purchasing senior CMBS with leverage from US Treasury Department
Oaktree Opportunities Fund VIII/VIIIb - $40m commitment each
o Based in Los Angeles o $4.5b/$2b funds, respectively o Primarily investing in senior debt of distressed US companies
30

TCRS Equity Derivative Report
Date B/S Broker Price Total Reason
Begin B 3,515 Russell 2000 Mar 2010 Citigroup 623.9000 219,300,850
Trades
1/29/2010 B 825 Russell 2000 Mar 2010 Citigroup 606.4079 50,028,650 13/16/2010 B 4,069 Russell 2000 Jun 2010 Citigroup 674.5000 274,454,050 2b3/16/2010 S 4,069 Russell 2000 Mar 2010 Citigroup 676.1681 (275,132,800) 2a3/18/2010 B 271 Russell 2000 Jun 2010 Citigroup 677.0000 18,346,700 2b3/18/2010 S 271 Russell 2000 Mar 2010 Citigroup 679.5000 (18,414,450) 2a
Contracts Outstanding on Dec 31, 2009
End B 4,340 Russell 2000 Jun 2010 Citigroup 677.1000 293,861,400
Total 2Q FY2010 25,278,400$
18,939,324 200,000,000 74,922,076
Contracts
Domestic Stock Index FuturesRoy Wellington, CFA
Domestic Stock Index Futures Transaction Log
1 Move equity allocation towards allocation target.2a Swap to next contract.2b Swap from earlier contract.
Strategy: Replicate a Small company stock portfolio using Russell 2000 index futures. The Russell 2000 future plus cash should produce a return equal to the Russell 2000 Index. TCRS utilizes index futures to its advantage to make timely investments and to gain small cap exposure as desired. Our exposure to small cap remains below the policy target.
TCRS designated certain assets that in combination with the futures represents an equity allocation. These other assets were:
Collateral: US Treasury Notes $18,939,324Short Duration Fixed Income: 200,000,000TCRS Cash: 74,922,076 Review: TCRS continued to make small steps to increase small cap equity exposure. There was one purchase of Russell 2000 index futures in the fiscal third quarter.
Affiliations: TCRS has used Citigroup exclusively in the quarter to trade index futures. We have a clearing agreement with JPMorgan plus an execution only agreement with MF Global.
31
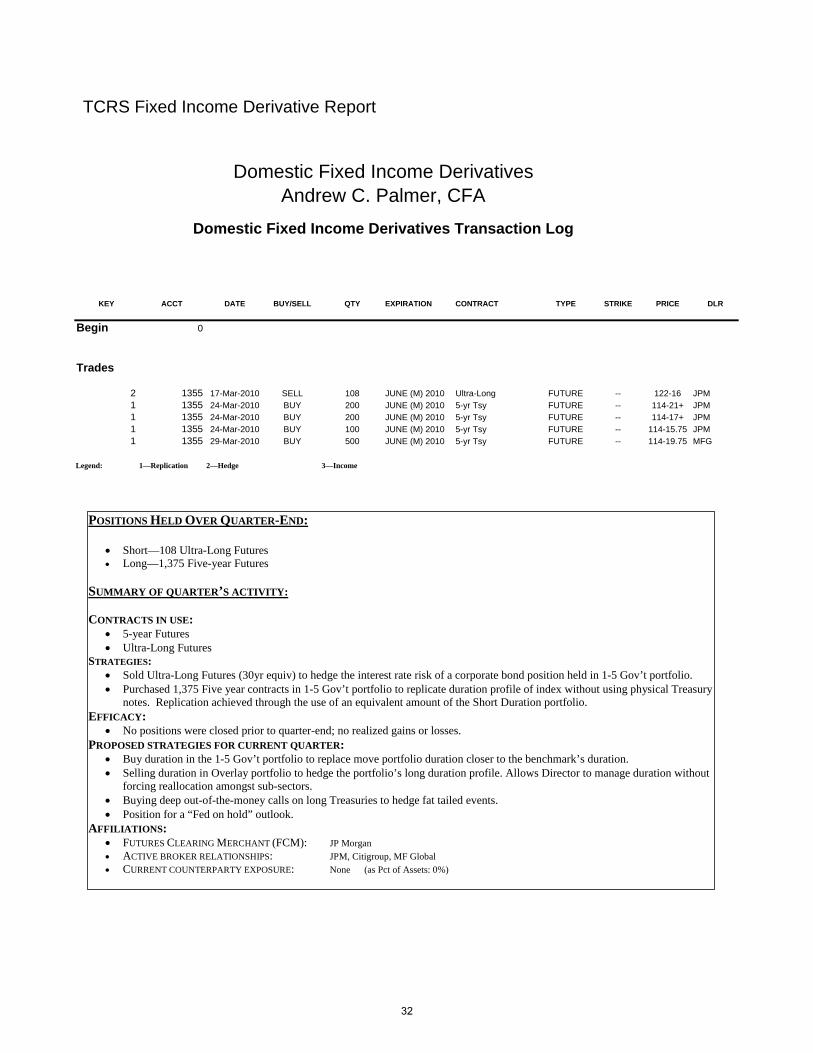
TCRS Fixed Income Derivative Report
KEY ACCT DATE BUY/SELL QTY EXPIRATION CONTRACT TYPE STRIKE PRICE DLR
Begin 0
Trades
2 1355 17-Mar-2010 SELL 108 JUNE (M) 2010 Ultra-Long FUTURE -- 122-16 JPM1 1355 24-Mar-2010 BUY 200 JUNE (M) 2010 5-yr Tsy FUTURE -- 114-21+ JPM1 1355 24-Mar-2010 BUY 200 JUNE (M) 2010 5-yr Tsy FUTURE -- 114-17+ JPM1 1355 24-Mar-2010 BUY 100 JUNE (M) 2010 5-yr Tsy FUTURE -- 114-15.75 JPM1 1355 29-Mar-2010 BUY 500 JUNE (M) 2010 5-yr Tsy FUTURE -- 114-19.75 MFG
Legend: 1—Replication 2—Hedge 3—Income
Domestic Fixed Income DerivativesAndrew C. Palmer, CFA
Domestic Fixed Income Derivatives Transaction Log
POSITIONS HELD OVER QUARTER-END:
Short—108 Ultra-Long Futures Long—1,375 Five-year Futures
SUMMARY OF QUARTER’S ACTIVITY: CONTRACTS IN USE:
5-year Futures Ultra-Long Futures
STRATEGIES: Sold Ultra-Long Futures (30yr equiv) to hedge the interest rate risk of a corporate bond position held in 1-5 Gov’t portfolio. Purchased 1,375 Five year contracts in 1-5 Gov’t portfolio to replicate duration profile of index without using physical Treasury
notes. Replication achieved through the use of an equivalent amount of the Short Duration portfolio. EFFICACY:
No positions were closed prior to quarter-end; no realized gains or losses. PROPOSED STRATEGIES FOR CURRENT QUARTER:
Buy duration in the 1-5 Gov’t portfolio to replace move portfolio duration closer to the benchmark’s duration. Selling duration in Overlay portfolio to hedge the portfolio’s long duration profile. Allows Director to manage duration without
forcing reallocation amongst sub-sectors. Buying deep out-of-the-money calls on long Treasuries to hedge fat tailed events. Position for a “Fed on hold” outlook.
AFFILIATIONS: FUTURES CLEARING MERCHANT (FCM): JP Morgan ACTIVE BROKER RELATIONSHIPS: JPM, Citigroup, MF Global
CURRENT COUNTERPARTY EXPOSURE: None (as Pct of Assets: 0%)
32

March 2009
INTERNATIONAL FIXED INCOME (1333)Date B/S Currency Broker Price Proceeds USD
FORWARDS
Begin - - - -
Trades Delivery12/10/2010 3/10/2010 S 1,500,000,000 JPY HSBC 88.2830 16,990,814
1/21/2010 3/10/2010 S 1,500,000,000 JPY HSBC 90.4450 16,584,665 3/8/2010 3/10/2010 B 3,000,000,000 JPY HSBC 90.3000 (33,222,591) 3/8/2010 6/30/2010 S 3,000,000,000 JPY HSBC 90.2500 33,240,997
3/25/2010 6/30/2010 B 1,500,000,000 JPY HSBC 92.7350 (16,175,123) 4/2/2010 6/30/2010 B 1,500,000,000 JPY HSBC 94.3150 (15,904,151)
EndHEDGING G/L 1,514,611
Notional
Jesse Picunko, CFA
Currency Forwards Activity
TCRS Currency Derivative Report
33

Page is intended to be blank
34
TCRS Investment Operations March 2010
OPERATIONS UPDATE Tim McClure, CTP
TCRS continues to move forward with changes to the Operations area. As TCRS looks for ways to add value to the Fund, this is an area that offers some opportunity for efficiencies and technology upgrades. Trade Order Management System (OMS) – The kickoff meeting for implementation of the Bloomberg Trade Order Management System took place on Tuesday, February 23. User training is scheduled to begin mid June and go live is estimated to be July 31. Trading – The equity traders continue to review commissions and the structure that is being used by other trading desks. The equity traders are looking at issues that have been a challenge for buy side managers such as soft-dollar versus hard-dollar payment methods. They are also researching commission schedules that generate sufficient revenue for research and analysis while offering some control over trading costs, such as CSA. TCRS entered into a CSA with Barclays Capital on April 1 and plans on paying for a portion of the research with the program on a trial basis. The CSA program may be expanded after management has had some time to review the effectiveness of the program. Trading Cost Execution Analysis – The equity traders are getting more comfortable with data that is being produced by Abel Noser, a well known analytics and trading firm that specializes in trading cost execution analysis. Although the current data is not as useful as would be preferred because it is performed on custodial data, it will improve when time-stamped data is generated from the proposed OMS. Personnel Changes – Josh Stites has accepted an offer to serve as an assistant to the Treasurer. His current position of Assistant Cash Manager is being upgraded to Cash Manager and TCRS is actively seeking a candidate to assume those duties.
35
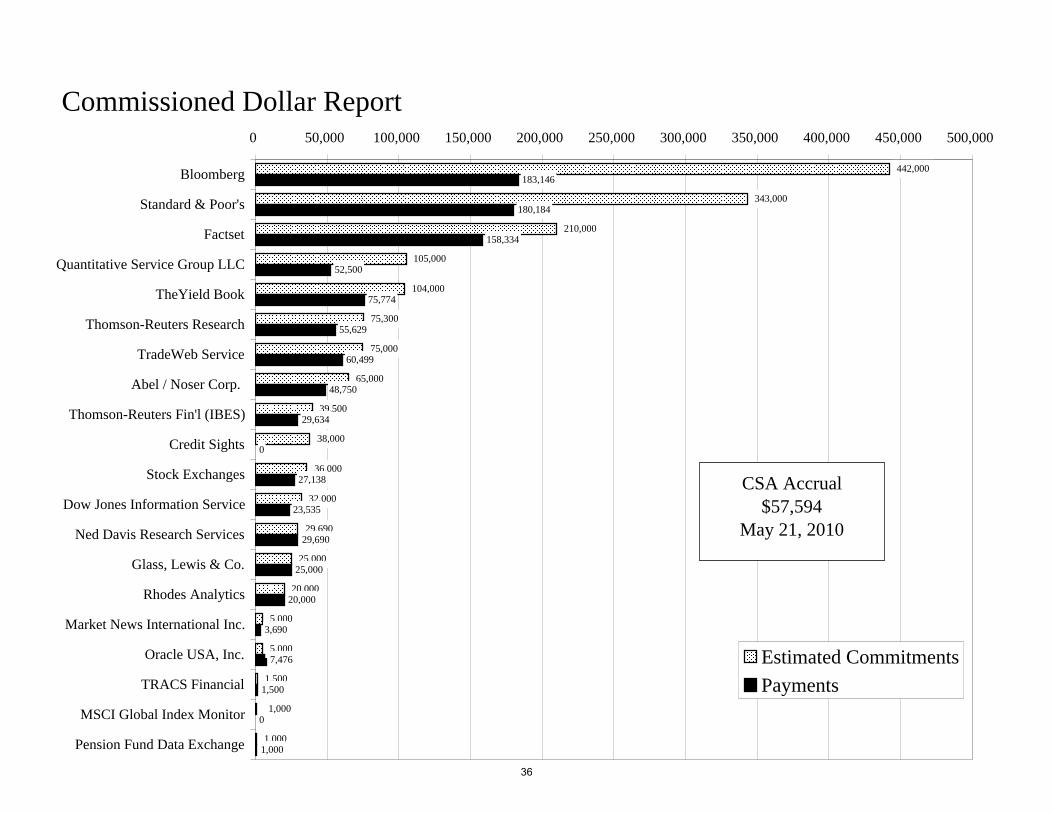
Commissioned Dollar Report
343,000
210,000
105,000
104,000
75,300
75,000
65,000
39,500
38,000
36,000
32,000
29,690
25,000
20,000
5,000
5,000
1,500
1,000
183,146
180,184
158,334
52,500
75,774
55,629
60,499
48,750
29,634
0
27,138
23,535
29,690
25,000
20,000
3,690
7,476
1,500
0
1,000
1,000
442,000
0 50,000 100,000 150,000 200,000 250,000 300,000 350,000 400,000 450,000 500,000
Bloomberg
Standard & Poor's
Factset
Quantitative Service Group LLC
TheYield Book
Thomson-Reuters Research
TradeWeb Service
Abel / Noser Corp.
Thomson-Reuters Fin'l (IBES)
Credit Sights
Stock Exchanges
Dow Jones Information Service
Ned Davis Research Services
Glass, Lewis & Co.
Rhodes Analytics
Market News International Inc.
Oracle USA, Inc.
TRACS Financial
MSCI Global Index Monitor
Pension Fund Data Exchange
Estimated Commitments
Payments
CSA Accrual$57,594
May 21, 2010
36

Page is intended to be blank


