Bottom-Up Federalism: The Diffusion of Antismoking Policies from U.S. Cities to States Charles R. Shipan University of Michigan Craig Volden The Ohio State University Studies of policy diffusion often focus on the horizontal spread of enactments from one state to another, paying little or no attention to the effects of local laws on state-level adoptions. For example, scholars have not tested whether local policy adoptions make state action more likely (through a snowball effect) or less likely (through a pressure valve effect). This study conducts the first comprehensive analysis of vertical policy diffusion from city governments to state governments, while simultaneously examining the influence of state-to-state and national-to-state diffusion. Focusing on three different types of antismoking laws, we find evidence that policies do bubble up from city governments to state governments. State politics are crucial to this relationship, however, as local-to-state diffusion is contingent on the level of legislative professionalism and the strength of health advocates in the state. P olicy ideas enter the political process in a vari- ety of ways. Citizens, advocates, and intellectu- als may advance solutions when public problems arise. Politicians, bureaucrats, and entrepreneurs may link problems with solutions in order to formulate new poli- cies (Kingdon 1984). National policymakers may observe what other countries are doing and emulate their ac- tions (Gilardi 2005). Within federal systems, there are additional sources of policy ideas, as local and regional experiences may inform national and subnational policy- makers. Indeed, varied policy adoptions and experiments are among the reasons cited for devolution of policy con- trol to subnational governments. And yet the question arises: Do policies diffuse vertically , from one level of government up to another? For example, do local laws influence statewide policy adoptions, in a process we call bottom-up federalism? Political scientists have long studied horizontal, state-to-state diffusion processes using various statistical Charles R. Shipan is professor of political science, University of Michigan, 505 S. State St., Ann Arbor, MI 48109-1045 ([email protected]). Craig Volden is associate professor of political science, The Ohio State University, 2147 Derby, 154 N. Oval Mall, Columbus, OH 43210 ([email protected]). The authors would like to thank editors and anonymous reviewers, as well as Fred Boehmke, Brian Crisp, Martha Derthick, Laura Evans, Matt Golder, Sona Golder, Keith Hamm, Greg Huber, Gary Moncrief, Chris Mooney, Kira Sanbonmatsu, Joe Soss, Pev Squire, and seminar and conference participants at Florida State University, Indiana University, the University of Iowa, the University of Michigan, The Ohio State University, Washington University, Yale University, the Midwest Political Science Association meetings, and the State Politics and Policy meetings for helpful comments. We are also indebted to Angela Enciso, Tracy Finlayson, Ken Moffett, and Jacob Nelson for valuable research assistance, to The Robert Wood Johnson Foundation for financial support, and to Jamie Chriqui for providing us with the updated version of the National Cancer Institute’s State Cancer Legislative Database. In addition, local tobacco control ordinance data was provided by the American Nonsmokers’ Rights Foundation Local Tobacco Control Ordinance Database C . techniques (Berry and Berry 1990; Gray 1973; Walker 1969) and have found evidence of policies spreading from neighbor to neighbor or across similar states (Case, Hines, and Rosen 1993) in many different areas of public pol- icy (e.g., Mooney and Lee 1995, among numerous oth- ers). Political entrepreneurs and advocacy organizations have been shown to facilitate policy adoptions (Balla 2001; Mintrom 1997a; Skocpol et al. 1993), as have various insti- tutional structures of government (Boehmke 2005). Poli- cies tend to evolve and be reinvented as they spread (Glick and Hays 1991). And successes are more likely to be em- ulated than are failures (Volden 2006). Yet surprisingly, despite this accumulation of knowl- edge about state-to-state diffusion, almost nothing is known about the bottom-up diffusion of policies from local governments to states. Because studies of the interac- tion between state and local policies so far have been lim- ited to a handful of case studies (e.g., Mintrom 1997b), we currently have no systematic understanding of whether, American Journal of Political Science, Vol. 50, No. 4, October 2006, Pp. 825–843 C 2006, Midwest Political Science Association ISSN 0092-5853 825
Transcript
Bottom-Up Federalism: The Diffusionof Antismoking Policies from U.S. Cities to States
Charles R. Shipan University of MichiganCraig Volden The Ohio State University
Studies of policy diffusion often focus on the horizontal spread of enactments from one state to another, paying little or
no attention to the effects of local laws on state-level adoptions. For example, scholars have not tested whether local policy
adoptions make state action more likely (through a snowball effect) or less likely (through a pressure valve effect). This
study conducts the first comprehensive analysis of vertical policy diffusion from city governments to state governments, while
simultaneously examining the influence of state-to-state and national-to-state diffusion. Focusing on three different types
of antismoking laws, we find evidence that policies do bubble up from city governments to state governments. State politics
are crucial to this relationship, however, as local-to-state diffusion is contingent on the level of legislative professionalism
and the strength of health advocates in the state.
Policy ideas enter the political process in a vari-
ety of ways. Citizens, advocates, and intellectu-
als may advance solutions when public problems
arise. Politicians, bureaucrats, and entrepreneurs may link
problems with solutions in order to formulate new poli-
cies (Kingdon 1984). National policymakers may observe
what other countries are doing and emulate their ac-
tions (Gilardi 2005). Within federal systems, there are
additional sources of policy ideas, as local and regional
experiences may inform national and subnational policy-
makers. Indeed, varied policy adoptions and experiments
are among the reasons cited for devolution of policy con-
trol to subnational governments. And yet the question
arises: Do policies diffuse vertically, from one level of
government up to another? For example, do local laws
influence statewide policy adoptions, in a process we call
bottom-up federalism?
Political scientists have long studied horizontal,
state-to-state diffusion processes using various statistical
Charles R. Shipan is professor of political science, University of Michigan, 505 S. State St., Ann Arbor, MI 48109-1045 ([email protected]).Craig Volden is associate professor of political science, The Ohio State University, 2147 Derby, 154 N. Oval Mall, Columbus, OH 43210([email protected]).
when, and how local actions might influence state politics
and policy adoptions. Even basic issues, such as whether
the passage of local laws increases or decreases the likeli-
hood of state-level legislation, remain unexamined.1 On
the one hand, evidence of the political viability and po-
tential success of local policies may make adoption more
attractive to state-level policymakers, thereby increasing
the odds of state-level adoption. On the other hand, local
laws may decrease the demand for state policies by reliev-
ing the pressure on state legislators. Whether focused on
innovations in education, welfare, or a host of other policy
issues, uncovering the politics of local-to-state diffusion
is a crucial step in understanding the workings of federal
systems.
In this article we investigate the influence of city-level
policies on state-level adoptions. We argue that because
local laws in most policy areas can simultaneously in-
crease and decrease pressure on the state to adopt a law,
evidence of local-to-state policy diffusion will be difficult
to uncover. Rather than being nonexistent, however, such
diffusion is robust; but it is contingent on political con-
ditions. Hence, we identify the political conditions that
determine whether local laws will increase or decrease
the likelihood of state-level adoptions. In particular, we
hypothesize (and find) that professional legislatures are
better positioned to learn from local policy experiments
and also that strong interest groups may utilize local ex-
amples to build their case for statewide change. Where
these factors are present, local regulations are more likely
to snowball into state laws. Absent such motivated politi-
cians and interest groups, however, policy movements are
more likely to halt after local adoptions.
Our arguments about bottom-up diffusion are gen-
eral, but we test them in a specific policy context, one
that is particularly appropriate for such tests. We examine
antismoking laws passed between 1975 and 2000, explor-
ing these laws across all 50 states and all cities with more
than 50,000 residents. This policy area provides an excel-
lent forum for testing local-to-state diffusion hypotheses
since all states and many cities have been active in this area
and, just as importantly, comparable data on these laws is
available at both levels of government.
Our primary goal is to assess the influence of lo-
cal laws on state laws. At the same time, we embed this
1There have been a few studies of diffusion among localities (e.g.,Crain 1966; Godwin and Schroedel 2000; Knoke 1982) and ofpolicies bubbling up from the states to the federal government(Boeckelman 1992; Mossberger 1999). Further evidence of verticaldiffusion has focused on the downward pressures from the federalgovernment to states, such as through the effects of intergovern-mental grant conditions and other actions (e.g., Allen, Pettus, andHaider-Markel 2004; Walker 1973).
analysis in a framework that also tests for both state-to-
state and national-to-state diffusion. In other words, while
our primary concern is with one specific type of vertical
diffusion—from cities to states—we also test for vertical
diffusion from the national government to the states as
well as horizontal diffusion from one state to another. We
thus conduct the first large-N quantitative study that si-
multaneously examines bottom-up, horizontal, and top-
down policy diffusion.
In the following section, we discuss the political
motivations that underpin policy diffusion, in order to
formulate testable hypotheses. We next describe the an-
tismoking policy context, with an emphasis on previous
work within public health and how this policy area can
be used to test arguments about diffusion. We then turn
to event history analyses of our hypotheses. We conclude
with the implications of our work and ideas for future
research.
Theory and Hypotheses
Previous studies of policy diffusion have noted that pol-
icymakers are motivated by such considerations as re-
election or reappointment, the adoption of good public
policy, and the attainment of political influence. Based on
these motivations, policymakers may pay attention to the
actions of other governments either due to direct effects,
such as economic and budgetary spillovers, or because
they produce indirect effects, such as the potential for
learning from one another’s policy experiments.2 These
considerations have served as the cornerstones for schol-
arship focused on policy learning (Brandeis 1932), race-
to-the-bottom issues (Bailey and Rom 2004; Peterson and
Rom 1990), and state-to-state diffusion more generally.
The study of local-to-state policy diffusion is theo-
retically quite similar, at least with respect to politicians’
motivations. In terms of economic spillovers, adoption
of a policy in one locality may lead affected citizens in
that community or nearby cities to seek state govern-
ment action to combat negative externalities of the newly
adopted policy. With respect to policy-oriented learning,
state-level policymakers may view localities to be labo-
ratories of democracy in a similar way to how state and
national officials view the policies in various states. State
politicians look to localities for policy ideas that they can
advance at the state level and for which they might claim
credit. Local adoptions may signal political viability, and
2Disentangling these effects is a challenge addressed by Boehmkeand Witmer (2004).
BOTTOM-UP FEDERALISM 827
their stability over time may signal effectiveness. In a form
of yardstick competition, citizens and interest groups may
demand that local and state politicians adopt laws giving
them the same benefits found in surrounding cities and
towns. Thus, for the same reasons underlying state-to-
state policy diffusion, scholars may expect to find a posi-
tive local-to-state diffusion effect. We call such diffusion
a “snowball effect,” where each additional law at the local
level contributes to an increased chance that the state will
adopt such a law.
Snowball Effect Hypothesis: Adoption of local laws
increases the likelihood of statewide adoption.
Strikingly, however, similar actions at the local level
may result in the opposite effect at the state level. Com-
munities benefiting from policy externalities at the local
level may resist statewide adoption. Moreover, the pol-
icy problem to be addressed may become less acute if it
is already addressed within the communities that most
demanded policy change. State policymakers who are re-
sponsive to public demands and pressures from interest
groups and policy advocates thus might feel less pressure
following local adoptions. Indeed, voters and groups with
the greatest demand for action are precisely those who are
most likely to facilitate local adoptions. Once they have
achieved victory at the local level, in the communities in
which they live and work, their incentives to pursue fur-
ther action at the state level decline and they turn their
attention to other matters. Where this occurs, a “pressure
valve effect” dominates, with passage at the local level re-
lieving the pressure on state politicians to adopt a new
law.
Pressure Valve Effect Hypothesis: Adoption of
local laws decreases the likelihood of statewide
adoption.
Despite similar motivations of policymakers, local-
to-state diffusion therefore may differ significantly from
the more commonly studied state-to-state diffusion. The
adoption of policies in other states does not, and cannot,
serve as a pressure valve, with passage in one state re-
lieving pressure on another state. Rather, whether based
on learning, competition, or economic spillover, state-to-
state diffusion exhibits a snowball effect. Scholars explore
conditions under which neighbor or similar-state adop-
tions increase the likelihood of diffusion, without having
to consider an opposing effect. Local laws, however, can
have either effect. Therefore, evidence of local-to-state
diffusion may be difficult to find, with these two effects
canceling one another out.
When might we expect to see a snowball effect rather
than a pressure valve effect, or vice versa? Are there specific
conditions that might lead to one type of effect rather
than the other? We focus here on two considerations that
are particularly relevant to state politics: legislative pro-
fessionalism (e.g., Fiorina 1994; King 2000; Squire 1992)
and interest group pressures (e.g., Gray and Lowery 1996;
Thomas and Hrebenar 1999).3
First, we argue that more professional state legisla-
tures are more likely to exhibit a snowball effect, while
less professional legislatures are more likely to exhibit
a pressure valve effect. There are a number of reasons
for this prediction. For example, scholars have estab-
lished that more professional legislatures exhibit greater
icy diffusion in both of these realms. For example, in
adopting a local restriction on smoking in restaurants
and bars, owners may worry about losing patrons to sur-
rounding communities. Such a fear could be assuaged
through state-level restrictions that would level the play-
ing field for all localities within the state. To the extent that
professional legislators are more responsive to such local
concerns, we would expect a snowball effect of increased
pressure for statewide action upon local restrictions.
Similar predictions arise due to policy learning. Fea-
tures associated with more professional legislatures, such
as higher legislator salaries, larger staffs, and longer ses-
sion lengths, facilitate the processing of information.
Policies that are politically attractive and substantively
effective at the local level are more likely to catch the at-
tention of state-level policymakers when legislators see
policymaking as their full-time job, when they have capa-
ble staffs looking for policy solutions, and when they have
the time to deal with issues that could in some sense be left
3There may be many other reasons why one of these two typesof pressures may predominate. For example, where localities haveonly limited jurisdiction over a policy area, local action may beseen as only a partial victory, thus increasing the likelihood of asnowball effect. Additionally, a snowball effect would be more likelyfor policies with extensive negative economic or environmentalspillovers from one locality to the next, since these policies arelikely to generate pressure for further action at the state level. Partystrength and partisan competition may also matter. Evidence ofsuccessful local policies and those adopted very recently also wouldlikely promote a snowball effect more than would failing policiesor those from the distant past. While these are of interest, they arebeyond the scope of the present article.
828 CHARLES R. SHIPAN AND CRAIG VOLDEN
to the local level were legislators more time constrained.
Finally, legislators with progressive ambition—who are
more likely to be found in more professional legislatures
(Maestas 2000, 2003)—will be looking toward their future
constituents rather than just their current districts. They
are thus more likely to be aware of policies found else-
where in the state and will look to adopt them statewide,
or to take ideas from their own districts and try to build a
broader reputation with a geographically wider adoption.
To see how different levels of professionalism apply
to snowball and pressure valve effects, consider two hypo-
thetical states, one with a low level of professionalism, the
other with a high level of professionalism. In the legisla-
ture with a low level of professionalism, we expect to find a
pressure valve effect. Once policies are adopted at the local
level, state legislators with limited time and information
will feel that the issues have been resolved already and that
they need not dedicate their remaining resources to such
policy areas. They will have neither the staffs nor sufficient
constituent contacts to facilitate the policy learning im-
portant for effective diffusion. In the more professional
state, however, all of the stars will be aligned for local-
to-state diffusion. Policy learning is more likely, due to
the information flows facilitated by active staffs and full-
time, ambitious legislators. Local policies, if popular, will
be used as models for state policies. If local policies are
unpopular due to economic spillovers, state legislators in
professional states will be more likely to have the technical
expertise needed to see how the spillover concerns can be
overcome with statewide action. Coupled with ambition,
these professional legislators will thus build upon local
policies in a snowball effect.
Local Diffusion and Legislative Professionalism Hy-
pothesis: The effect of local laws on state-level
adoptions will be contingent on the level of leg-
islative professionalism. A snowball effect will oc-
cur in states with more professional legislatures,
while a pressure valve effect will dominate less
professional legislatures.
In addition to the dependence of local-to-state dif-
fusion on legislative professionalism, we argue that such
bottom-up diffusion also depends on the role of interest
groups that act as advocates. Scholars studying state-to-
state diffusion have already made a strong case for the
role of such policy entrepreneurs in the diffusion process
(Balla 2001; Mintrom 1997a; Skocpol et al. 1993). A sim-
ilar logic is relevant for bottom-up federalism, especially
as it relates to diffusion via policy-oriented learning. Lo-
cal adoptions can serve as policy experiments upon which
support for statewide action can be built and momentum
can be generated. Where advocates for a particular policy
are strong at the state level, they are more likely to bring
about a policy change and may be even more successful if
they can point to local adoptions. We therefore expect not
only that policy advocates will be more likely to secure pas-
sage of legislation to their liking generally, independent
of local actions, but also that they can turn the snowball
effect into a legislative avalanche. Absent such activism at
the state level, local adoptions are less likely to diffuse up-
ward. Instead, local activists who pushed for local laws will
be satisfied by their accomplishments, relieving pressure
for state-level action.
Local Diffusion and Policy Advocates Hypothesis:
The effect of local laws on state-level adoptions
will be contingent on the strength of policy advo-
cates at the state level. A snowball effect will occur
in states with strong advocates for policy change
at the state level, while a pressure valve effect will
dominate in the absence of such groups.
These first four hypotheses have outlined our primary
arguments about local-to-state diffusion. Other types of
diffusion—in particular, state-to-state and national-to-
state diffusion—also can occur at the same time and are
here considered as secondary hypotheses. State-to-state
diffusion may be based on policy learning and emulation
or based on concerns over economic spillovers. As dis-
cussed above, unlike local-to-state diffusion, there is no
pressure-valve-like effect to offset these pro-diffusion ef-
fects. Thus, we expect that a state is more likely to adopt
a policy if other states have already done so.
State-level Diffusion Hypothesis: Adoption of laws
in neighboring states increases the likelihood that
a state will adopt a similar policy.
Finally, diffusion can be top-down, transmitted from
the national government to the states. Even in areas where
the states and localities play a primary role, the national
government often weighs in. Often, for example, the U.S.
federal government relies on mandates or intergovern-
mental grant incentives that influence state and local
policy choices, such as when it coerced states to adopt
drinking age and speed limit restrictions by tying highway
funding to the enactment of such laws. When the federal
government takes such actions (and does not specifically
preempt state actions), then we expect the likelihood of
state adoptions to increase. On the other hand, national
involvement may be similar to local action in bringing
about a pressure valve effect. If the national government
acts capably to resolve a policy crisis, or if it passes laws
BOTTOM-UP FEDERALISM 829
that reduce the incentive for states to act, then state action
is less likely. In effect, then, the influence of a national law
depends on the law’s incentives, one of which is charac-
terized in the following hypothesis.
National-level Diffusion Hypothesis: States will re-
spond positively to grant conditions encouraging
state policy adoptions.
The Politics of AntismokingDiffusion
While the above hypotheses are general, and likely to hold
in numerous policy areas, in this article we focus on the
spread of three types of antismoking policies between
1975 and 2000: government building restrictions, restau-
rant restrictions, and out-of-package sales restrictions.
Over this time period, 40 states adopted laws restricting or
banning smoking in government buildings, while 32 en-
acted laws that placed similar limitations on smoking in
restaurants.4 In addition to these sorts of “clean indoor
air” laws, during the same period states also passed “youth
access” laws designed to make it more difficult for young
people to obtain cigarettes. Thirty-one states, for exam-
ple, passed laws restricting sales of individual cigarettes
or those outside the original manufactured full packages,
since out-of-package sales make it easier for youths to
obtain cigarettes.
We similarly see a wide range of activity at the lo-
cal level. Local governments adopt restrictions similar
to those that states adopt—youth access provisions de-
signed to make it more difficult for young people to obtain
cigarettes, for example, or clean indoor air laws that regu-
late smoking in restaurants, bars, and government work-
places. According to one leading authority, more than
1,600 local governments have passed laws in the area of
clean indoor air policy alone (Schroeder 2004). And they
have done so across all existing categories of antismoking
conditions under which these local policies make state
action either more or less likely.
Studies within the public health literature concern-
ing tobacco control legislation occasionally note the
possibility of policy diffusion, but mainly highlight a
number of other causal influences, which we incorporate
in the form of control variables. Such work provides
insights about the passage of laws in a number of
states, including Vermont (Flynn et al. 1997), California
(Macdonald and Glantz 1997), and sets of six or seven
different states (Jacobson and Wasserman 1997; Jacobson,
Wasserman, and Raube 1993). Importantly, these scholars
and others identify factors that affect state-level adoptions
of antismoking laws (see also Chriqui 2000). Voting on
antismoking legislation, for example, is influenced by po-
litical ideology (Cohen et al. 2000) and is associated with
tobacco industry lobbying and campaign contributions
(Givel and Glantz 2001; Glantz and Begay 1994; Monardi
and Glantz 1998). In addition, the likelihood of passage
for these laws is higher when the health community takes
a strong stand, a finding that is suggested at the local level
(Samuels and Glantz 1991) and that has at least some sup-
port at the state level (Jacobson, Wasserman, and Raube
1993).
The few public health studies that entertain the possi-
bility of local-to-state diffusion tend to point to a snowball
effect, without considering the pressure valve effect or po-
tential contingencies. For example, Jacobson, Wasserman,
and Raube conjecture that “the growing proportion of the
population already covered by local smoking ordinances
suggests an environment where additional restrictions are
unlikely to be seen as arbitrary or cumbersome” (1993,
817). Indeed, they note a decline in resistance within states
that have seen successful local policies. For example, poli-
cymakers in New York were reassured because “the experi-
ence in those areas covered by local laws was positive. The
restaurant industry did not collapse, plants did not close,
smokers did not get carted off to jail” (794). To explore
whether this snowball effect occurred generally, whether
it was offset by a pressure valve effect, and whether state
politics influenced the pattern of local-to-state diffusion,
we turn now to our empirical analysis.
Data Analysis
Part of the reason for the paucity of vertical diffusion stud-
ies is the difficulty in gathering comparable data on poli-
cies at the state and local levels across a significant time
period. In the area of antismoking policy, we combine
data from multiple sources, starting with the National
830 CHARLES R. SHIPAN AND CRAIG VOLDEN
Cancer Institute, which has compiled a database of all
state-level antismoking laws. This database, the State Can-
cer Legislative Database (SCLD), was recently corrected
and updated by the MayaTech Corporation, which pro-
vided it to us. For various types of laws, the SCLD data
present a range of information, including whether a state
has passed a law in the area, when the legislature passed
the law, and information about the content of the law. For
example, for laws that restrict smoking in restaurants, the
database contains information about whether smoking is
banned outright in all restaurants or just in restaurants
that meet certain requirements (e.g., size), whether the law
requires a nonsmoking section, and so on. This database
includes the three types of antismoking laws that we ex-
amine, thereby providing the variety necessary to uncover
patterns of diffusion.6 Government building restrictions
include not only narrowly tailored laws, but also broad
laws limiting smoking in all workplaces (which there-
fore encompass government buildings). For restaurants,
we include any restrictions, ranging from those limiting
the ability to smoke in certain kinds of restaurants or
places within that restaurant to total bans on smoking.
For out-of-package sales restrictions, we include restric-
tions on the sales of individual cigarettes or reduced-size
packs, as well as those restricting sales of packages other
than those of the original manufacturer (which therefore
may lack required warning labels).7
To construct dependent variables in each of these
three areas—restrictions on smoking in government
buildings, on smoking in restaurants, and on out-of-
package sales—we code each variable as having a value
of 0 for the years in which the state has not yet adopted
the policy and 1 in the year of adoption. In subsequent
years, the state is dropped from the dataset. This approach
allows us to conduct a standard event-history analysis,
estimating the hazard rate for a policy adoption among
those states “at risk” for such an adoption. Because few
states passed antismoking laws prior to the mid-1970s, we
6Some state laws also preempted actions by localities. However,these occurred in few enough states that we were unable to discernseparate causal factors behind such adoptions. We therefore setaside preemption considerations for future work. The data analysisresults below are robust to the inclusion or exclusion of states withpreviously adopted preemptive policies.
7Our strategy in choosing these three areas is to strike a balance interms of generality. At one extreme, we could look to see whethera state has passed any sort of restrictions on smoking; at the other,we could break down all laws by the specific sorts of details theycontain. The problem with the former approach, of course, is thatit is too aggregated and blunt. Conversely, the problem with thelatter is that there is a striking amount of variation among laws(e.g., we uncovered well over 200 variants of policy change). Ourthree policy areas thus serve as an intermediate grouping allowingfor both variance and comparability across states and localities.
examine the period from 1975 to 2000; if a state passed
such a law before 1975, we do not include it in the anal-
ysis.8 As described below, we analyze these three policies
separately as well as pooled together in a single regres-
sion. Definitions of these and all other variables, along
with summary statistics and data sources, are given in the
appendix.
The most important independent variables are those
capturing local laws. In almost every policy area, local
data are far more difficult to obtain in a systematic fash-
ion than are state data, which is likely the primary reason
that no systematic, cross-state study of local-to-state dif-
fusion has ever been conducted. In the area of cigarette
smoking, we utilize the Local Tobacco Control Ordinance
Database compiled by the American Nonsmokers’ Rights
Foundation (ANR). This database indicates which cities
within each state have adopted antismoking measures and
when they were adopted.9 Using the dataset that we cre-
ated from the ANR data, we generated a Proportion of
State Population with Local Restriction variable for each
of our three policy choices.10 We calculated the propor-
tion of the state’s population that was covered, at the start
of each year, for each type of antismoking law, by sum-
ming the populations of those cities covered by laws and
dividing by the state’s overall population.11
Initially, we use the local proportion variable to test
both the Snowball Effect Hypothesis and the Pressure
Valve Effect Hypothesis; we then use it to test the inter-
active effects of legislative professionalism and of policy
advocacy on local-to-state diffusion. If a snowball effect
predominates, we would expect this variable to have a
positive coefficient. If, on the other hand, local laws take
the pressure off of the state government, then we expect
the coefficient to be negative. And if these effects are in
8No state passed an out-of-package law prior to 1981. Thus, forthis policy area we report results based on the years 1981–2000.Extending the analysis back to 1975 has little substantive effect onthe results.
9Because this dataset may have missed the actions of many smallcommunities, we use it to analyze only cities identified in the 2000census as having populations of 50,000 or more.
10As an alternative, we looked at whether local adoptions in thestate’s largest city or the capital city made state-level adoption morelikely. These measures generally were not significant and had noeffect on our other variables.
11There are some small differences in how ANR coded local dataand how the National Cancer Institute coded state data in SCLDthat are worth mentioning. For government buildings at the statelevel, the local match was quite close, covering local restrictionson public workplaces. For restaurants, the match was exact. Forout-of-package sales restrictions, there was no direct match withlocal-level data, so we relied on the more general category of youthaccess restrictions at the local level.
BOTTOM-UP FEDERALISM 831
balance and neither predominates (or if neither effect ex-
ists), we may find null results.12
Beyond local-to-state diffusion, we also wish to as-
sess and control for the possibility of state-to-state and
national-to-state diffusion. To assess the former, we cre-
ated a Proportion of Neighbors with Restrictions variable
for each of our three policies in each state and each year,
based on the same SCLD database used for our dependent
variables. This independent variable, which measures the
fraction of neighbor states that have adopted such a pol-
icy already, is used to test the State-level Diffusion Hy-
pothesis. If states are influenced by the actions of their
neighbors, we expect to see a positive coefficient for this
variable.13
We also constructed a variable to test our National-
level Diffusion Hypothesis. Scholars focusing on
national-to-state diffusion typically have isolated the ef-
fect of intergovernmental grant conditions. We follow
their lead here. In the area of tobacco control, the most
significant national mandate came about through the
Synar Amendment. Passed by Congress in 1992, the Synar
Amendment required states to pass laws to effectively pro-
hibit the sale of cigarettes to individuals under 18 years
of age. States where certain conditions are not met—
where illegal sales of cigarettes to minors remain high,
for example—risk losing federal funding from Substance
Abuse Prevention and Treatment block grants. Conse-
quently, the passage of the Synar Amendment gave the
states a strong financial incentive to pass laws, such as
out-of-package sales restrictions, that aim to reduce youth
access to tobacco. We thus created a Synar Amendment
Dummy, which takes a value of 0 prior to passage and
1 starting in 1993. Admittedly, this variable is a rather
blunt instrument. It does, however, capture the notion of
federal government involvement, at least in the area of
youth access laws. Because this law clearly was intended
to spur state activity on youth access, rather than clean
indoor air policies, we expect a positive coefficient for
out-of-package sales restrictions and no significant effect
on government building or restaurant restrictions.
Internal Influences and Policy Determinants
Beyond diffusion considerations, state policymakers are
likely to be influenced by other factors internal to the state,
12We examined, in several ways, the possibility that the effects oflocal laws on state adoptions might be nonlinear, finding no con-sistent evidence of nonlinearities.
13We also examined whether diffusion occurs between ideologicallysimilar states, regardless of their relative locations, but found noevidence of this sort of diffusion.
factors that we need to control for.14 Building on the ear-
lier tobacco control studies that we discussed, as well as
earlier state-to-state diffusion analyses, we identify sev-
eral categories of factors that might be influential. First,
and most obviously, organized interests are likely to play a
role (Gray and Lowery 1996). When health organization
lobbyists are strong and plentiful, we would expect state
policymakers to feel pressure to pass antismoking laws.
Conversely, states in which the tobacco lobby is strong
are more likely to defeat such measures. In order to cap-
ture the effect of organized interests on the adoption of
state-level laws, we include two measures of the strength
of health organization lobbyists in each state, along with
two equivalent measures for the tobacco lobby. The first
measure, for both pro- and antitobacco groups, is a ratio
of the number of health (or tobacco) lobbyists in the state
to the total number of registered lobbyists. Thus, Health
Organization Lobbyists measures the number of regis-
tered lobbyists for health organizations as a proportion of
all registered lobbyists in the state; and Tobacco Industry
Lobbyists, as collected by Goldstein and Bearman (1996),
does the same for the tobacco industry.
This first pair of variables captures the overall pres-
ence of health and tobacco lobbies in each state, relative to
other lobbies. A second pair captures the perceived power,
rather than just the presence, of these lobbies. As part of
a comprehensive study of interest group politics in the
states, Hrebenar and Thomas surveyed and interviewed
public officials and political observers in each state (see,
e.g., Thomas and Hrebenar 1999). Based on these surveys,
the authors compiled, for each state, a list of the most ef-
fective interest groups. If tobacco interests were listed as
one of the ten most effective lobbies within a state, then
Tobacco Influence was assigned a value of 2; if tobacco
interests were one of the top 20 groups, then this vari-
able was assigned a value of 1; and if tobacco groups were
not mentioned, the variable was set equal to 0.15 A sim-
ilar variable, Health Organizations Influence, captures
the power of pro-health (and presumably antitobacco)
lobbies.16 If organized interests are effective in generat-
ing or stopping antismoking legislation, we would expect
14Any outside factors that influence both local and state adoptionsmust be included to avoid omitted variable biases. This is a commonand serious concern in diffusion studies (Berry 1994).
15There may be some concerns that tobacco interests are perceivedto be powerful in this survey because they had previously effec-tively defeated legislation restricting smoking. Given this endo-geneity concern, we reran the analyses reported below without thisvariable and found similar results for our diffusion variables.
16Included in this category are organizations ranging from hospi-tal and health systems associations to assorted health and medicalgroups.
832 CHARLES R. SHIPAN AND CRAIG VOLDEN
positive coefficients on the health organization variables
and negative coefficients for the tobacco lobby.
Second, and independent of the effect from the above
lobbyists, citizen and producer pressures may influence
state legislative actions. To begin with, although previous
work has produced mixed findings for the role of public
attitudes (e.g., Jacobson, Wasserman, and Raube 1993),
it is possible that public sentiment does influence the ac-
tions of state legislators. More specifically, in states where
a greater number of adults smoke, we might expect the
legislature to be less inclined to pass an antismoking law.
Furthermore, if a state is a major producer of tobacco,
we might expect this to dampen the legislature’s enthu-
siasm for any antitobacco laws. We use three measures
to capture the interests of producers and citizens. First,
Percent Smokers is the percentage of adults in each state
who smoke, according to the Centers for Disease Control
and Prevention. Second, we created a dummy variable,
Tobacco-Producing State, which takes on a value of 1
in all states where tobacco is produced, and 0 otherwise.
Third, Production is a measure of the state’s total tobacco
production, in millions of tons. For each of these vari-
ables, we expect a negative coefficient, indicating greater
opposition to antismoking restrictions.
Third, we also need to consider government prefer-
ences. All else equal, a more liberal government, one that
prefers a higher level of government activism, will be more
likely to enact governmental restrictions on smoking. To
test for this effect, we use Government Ideology, which
is an overall measure for each state that has higher values
for states likely to lean toward government activism. For
this variable, created by Berry et al. (1998) and updated
on the ICPSR website, we would expect to find a positive
coefficient. Similarly, a government that is unified under
the control of Democrats should be more likely to adopt
antismoking laws, while a government that is unified un-
der control of Republicans should be expected to do the
reverse. Unified Democrats and Unified Republicans take
on the value of 1 when Democrats and Republicans, re-
spectively, control the legislature and governorship. We
anticipate a positive coefficient for Democrats and a neg-
ative one for Republicans.
We also expect that governments that spend a higher
proportion of their budget on health will attempt to stem
the flow of tobacco-related costs by adopting more re-
strictions on smoking. To capture the overall importance
of health spending in the state, we calculated the ratio
of state government spending on health to overall state
spending as Proportion Spent on Health. We expect a
positive coefficient on this variable. Finally, states with
more professional legislatures may be more likely to adopt
laws generally. We use Squire’s (1992) updated Legislative
Professionalism measure, which should have a positive
coefficient.17
Results
To analyze our data we use event history analysis (EHA),
which Berry and Berry (1990) pioneered as a way to
capture both diffusion and internal state determinants of
policy adoption. Because our main hypotheses and inde-
pendent variables are consistent across all three policies we
are analyzing, it is appropriate to pool the data into a single
repeated-events duration model (Box-Steffensmeier and
Zorn 2002). Given that any of the three policy adoptions
can occur at any time and in any order, a slight modifica-
tion of the approach of Wei, Lin, and Weissfeld (1989) is
well suited for our analysis. In our setting, this approach
yields one observation per state per year per policy, for
a total of 50 × 26 × 3 = 3,900 observations. Exclud-
ing observations not in the risk-set for adoption (such as
those after the given policy has already been adopted, or
prior to 1981 for out-of-package sales restrictions) leaves
2,256 observations suitable for our analysis. Because our
dependent variable is dichotomous—it takes on a value
of 0 until the state adopts a policy and 1 in the year of
adoption—we use logit analysis.18 To account for poten-
tial problems of nonindependence of observations and
of heteroskedasticity, we rely on the cluster procedure in
17We also tested different operationalizations for most of the inde-pendent variables. For example, to capture the effect of lobbying,we collected data on the strength of other lobbies (e.g., gambling,alcohol, general business) and also the amount of money spent bythe tobacco industry on lobbying in the state. We also substitutedspending on Medicaid for our measure of spending on health. Forcitizen and producer interests, we coded variables such as the per-centage of the state population under the age of 18, the percentageof the population with a high school education, and the existenceof a statewide initiative process. For government preferences, wecollected other measures of state ideology, such as the percentageof vote for the Democratic presidential candidate in the previouselection, Elazar’s state political culture measure, and, in light ofconcerns raised by Brace et al. (2005) about measures of ideology,the Erikson, Wright, and McIver (1994) measures of state govern-ment partisanship and ideology. And for legislative professional-ism, we alternatively used state legislative salary and legislative staffvariables. Substituting these control variables for the ones that wereport generally had little effect on our diffusion measures. Beyondthese findings, there was no evidence that states receiving greaterrevenues from tobacco taxes were any more or less likely to adoptthe restrictions studied here.
18Buckley and Westerland (2004) point out that the use of otherfunctional forms can affect the results of EHA tests. To see whetherour results were consistent across functional forms, we reran ourtests using probit and complementary log-log and found no differ-ence in our main results across these functions. Similar results alsofollow from a Cox proportional hazard model.
BOTTOM-UP FEDERALISM 833
Stata 8.19 We cluster observations by state-year, assuming
the errors are potentially dependent within state-years,
and rely on Huber/White robust standard errors.20
In Table 1 we present the results of these pooled mod-
els. Model 1 shows the baseline results. As is evident, we
find no independent effect of local laws, and thus, at least
initially, no support for either the Snowball Effect Hy-
pothesis or the Pressure Valve Effect Hypothesis. We had
no a priori expectation about whether the snowball effect
or the pressure valve effect was more likely to dominate,
and indeed, recognized that both effects could coexist,
making it difficult for the data, and our tests, to reveal one
or the other. The negative coefficient in Model 1 hints that
the pressure valve effect may be slightly stronger than the
snowball effect, all else equal. In contrast, we find strong,
consistent support for the State-level Diffusion Hypoth-
esis. The coefficient on the Proportion of Neighbors with
Restrictions variable is significant and positive. The likeli-
hood of a state adopting an antismoking policy increases
as neighboring states pass such policies. For example, for
a state with four neighbors, each additional neighbor with
statewide antismoking restrictions increases the odds of
adoption of a similar law in the home state by 59% in
any given year. Perhaps the fear of the economic spillover
of lost tobacco and restaurant sales revenues makes states
hesitant to act until neighbors do. Or perhaps this is ev-
idence of information flow and policy learning across
states.
We also find support for the National-level Diffu-
sion Hypothesis. In this pooled setting, the Synar Amend-
ment Dummy in constructed to take a value of 0 for
government building and restaurant restrictions; and for
out-of-package sales restrictions it is set at 0 prior to
implementation of the Synar Amendment and one af-
terwards. The sign on the Synar Amendment variable in
19We also explored whether previous adoptions of the other twoantismoking policies made the current policy adoption more orless likely. In some specifications there was a negative relationship.Including or excluding this control variable did not affect othersubstantive results.
20Beck, Katz, and Tucker (1998) suggest that potential temporaldependence for our type of data structure can be accounted forwith year dummies. Since this would not allow the inclusion ofour Synar Amendment Dummy variable, we instead included vari-ables measuring time and time-squared. Neither was significantat conventional levels, and since their inclusion did not affect ourresults, we omit them from our regressions. Using natural cubicsplines as an alternative also showed no temporal dependence. Inaddition, excluding observations with outlying values for indepen-dent variables of interest did not substantively alter the findingsbelow. Specifically, the results are robust to exclusion of states withparticularly high or low professionalism values, of states that hadpreempted local antismoking restrictions, and of states in whichlocalities adopted antismoking measures through ballot initiativesor through board of health regulations.
Model 1 is positive and significant, indicating that its pas-
sage at the national level increased the probability that
states would adopt out-of-package laws. Specifically, rel-
ative to before the national action, after passage of the
Synar Amendment, the odds of state adoption of out-of-
package sales restrictions tripled.
Several state internal determinants also significantly
affect the likelihood of adopting antismoking laws. First,
with respect to organized interests, all four of the coef-
ficients for health and tobacco organizations have the
anticipated signs in Model 1, although only Health Or-
ganizations Influence is statistically distinct from zero.
Citizen and producer pressures also seemed to play their
expected role. There are negative coefficients on all three
variables, with Tobacco-Producing State attaining statis-
tical significance. Concerning government preferences,
liberal states were more likely to adopt antismoking re-
strictions. Political parties did not appear to be influ-
ential in the baseline model. Legislative professionalism,
on its own, did not affect the likelihood of passage, but
states spending more of their budgets on health were more
likely to adopt tobacco control legislation. In all cases,
where significant, these findings comported well with our
expectations.
The Intervening Roles of LegislativeProfessionalism and Policy Advocates
Model 1 presents a test that looks for evidence of a snow-
ball or pressure valve effect and as such does not ade-
quately test our theory, which predicts that these effects
are conditional. In Models 2 and 3 of Table 1 we include
interactive effects that allow us to test the Local Diffusion
and Legislative Professionalism Hypothesis and the Local
Diffusion and Policy Advocates Hypothesis. In Model 2
we include an interaction between the proportion of the
state population covered by local laws and the state’s level
of professionalism.21 If legislative professionalism is a cru-
cial step in local-to-state diffusion, as expected, we would
anticipate a negative coefficient on the Proportion of State
Population with Local Restriction variable and a positive
coefficient on the interaction term. Moreover, the size of
the interaction coefficient should be large enough to in-
dicate a snowball effect for the most professional legis-
latures. Put simply, for low levels of professionalism we
expect that more local laws will decrease the likelihood of
21As noted above, other interactions (such as between local adop-tions and state government ideology, between local adoptionsand unified government, or between professionalism and percentsmokers) may also help explain adoption and diffusion processes.Our intention, however, is not to exhaustively explore all possi-ble relationships, but instead to test our theoretically motivatedhypotheses.
834 CHARLES R. SHIPAN AND CRAIG VOLDEN
TABLE 1 Policy Diffusion with Local, State, and National Pressures
Model 1 Model 2 Model 3
Baseline Professionalism Policy Advocates
Local-to-State Diffusion
Proportion of State Population −0.68 −4.54∗∗∗ −3.53∗
with Local Restriction (0.96) (1.74) (2.60)
Local Proportion × – 14.03∗∗∗ –
Legislative Professionalism (5.27)
Local Proportion × – – 2.83∗
Health Orgs. Influence (2.15)
State-to-State Diffusion
Proportion of Neighbors with 1.86∗∗∗ 1.82∗∗∗ 1.91∗∗
Restrictions (0.46) (0.46) (0.45)
National-to-State Pressures
Synar Amendment Dummy 1.08∗∗∗ 1.07∗∗∗ 1.02∗∗∗
(0.29) (0.30) (0.30)
Organized Interests
Health Organization Lobbyists 1.62 3.00 1.73
(3.22) (3.33) (3.21)
Health Orgs. Influence 0.56∗∗∗ 0.55∗∗∗ 0.44∗∗∗
(0.19) (0.19) (0.18)
Tobacco Lobbyists −16.8 −21.1∗ −16.0
(13.2) (13.6) (13.2)
Tobacco Influence −0.10 −0.21 −0.18
(0.42) (0.44) (0.42)
Citizen and Producer Pressures
Percent Smokers −0.02 −0.003 −0.02
(0.05) (0.05) (0.05)
Tobacco-Producing State −1.00∗∗∗ −1.02∗∗∗ −1.08∗∗∗
(0.34) (0.34) (0.34)
Production (millions of tons) −3.26 −3.42 −2.53
(3.33) (3.22) (3.35)
Government Preferences/Control
Government Ideology 0.02∗∗∗ 0.02∗∗∗ 0.02∗∗
(0.01) (0.01) (0.01)
Unified Democrats −0.01 −0.04 0.02
(0.35) (0.35) (0.35)
Unified Republicans −0.56 −0.50 −0.61
(0.56) (0.56) (0.57)
Proportion Spent on Health 19.0∗ 20.5∗ 19.7∗
(13.7) (13.7) (13.9)
Legislative Professionalism −0.45 −1.90 −0.52
(1.38) (1.66) (1.41)
Constant −4.72∗∗∗ −4.95∗∗∗ −4.58∗∗∗
(1.55) (1.60) (1.56)
Wald � 2 65.64∗∗∗ 73.00∗∗∗ 71.39∗∗∗
N 2256 2256 2256
Robust standard errors in parentheses, clustered by state-year. ∗∗∗p < 0.01, ∗∗p < 0.05, ∗p < 0.1 (one-tailed tests).
a state adoption, but for high levels of professionalism we
expect an increase.
The results shown in Model 2 strongly support the
Local Diffusion and Legislative Professionalism Hypoth-
esis. The significantly negative coefficient on the local
proportions variable indicates that, for a state with a
legislative professionalism score of zero, each percent of
the state’s public covered by local laws diminishes the odds
BOTTOM-UP FEDERALISM 835
FIGURE 1 Marginal Effect of Local Laws onState-Level Adoptions asProfessionalism Changes
0.0 0.1 0.2 0.3 0.4 0.5 0.6 0.7 0.8 0.9 1.0
0%
50%
100%
State Legislative Professionalism
Cha
nge
in P
erce
nt C
h anc
e of
Sta
te A
dop t
ion
as L
ocal
P
ropo
r tio
n R
ises
fro
m I
ts M
i nim
um t
o I t
s M
axi m
um
of statewide antismoking policy adoption by about 4%.
The positive and significant coefficient on the interactive
term, however, indicates that this pressure valve effect
is offset by the snowball effect in the more professional
states.
Figure 1 provides a graphic demonstration of these
two effects, centered within 90% confidence intervals, fol-
lowing the technique of Golder (2006). The solid line
indicates the average change in the probability of a state
policy adoption upon changing the proportion of local
policy coverage from its minimum (zero) to its maximum
(about two-thirds), given the specified level of profession-
alism, while holding all other variables at their means. For
states with a professionalism index above 0.32, there is
a positive response to more local-level adoptions. Given
the standard errors associated with these coefficients, the
figure shows with 90% confidence that states with a pro-
fessionalism score below 0.20 are dominated by pressure
valve considerations while those above 0.52 are domi-
nated by snowball effect considerations. Substantively,
this means that the pressure valve effect outweighs the
snowball considerations for just over half of the states,
pressure valve and snowball effect considerations nearly
balance out for about a third of the states, and the snowball
effect predominates in the remaining states.22 Moreover,
the sizes of these effects can be substantial. Consider, for
22Another way to look at this figure is to see that there is a band ofvalues for which we cannot say with a high degree of confidencethat a pressure valve or a snowball effect is occurring. This is unsur-prising, and indeed, is consistent with our argument, which holdsthat both effects can be present simultaneously. It is only as we ap-proach one end or the other of the professionalism scale that oneeffect begins to predominate over the other.
instance, Michigan with its professionalism score of about
0.5. Its probability of adopting a statewide antismoking
measure in any given year is about 22% higher when the
maximal proportion of its population is covered by local
laws than when the minimal proportion is covered.
Model 3 shows similar, although somewhat less
strong, support for the Local Diffusion and Policy Advo-
cates Hypothesis. Here we include an interaction between
the local proportions variable and health organizations
influence.23 For states without a health organization in-
cluded among its top 20 most influential state-level ad-
vocacy groups, the pressure valve effect outweighs the
snowball effect. The two effects are in near balance in the
states where these health groups are among the top 20
(but not top 10) advocacy organizations in the state. And
where they are among the top 10 most influential groups,
the snowball effect is dominant. The size of these effects
is fairly substantial. As 1% more of the public is covered
by local restrictions, the odds of statewide adoptions de-
crease by over 3% in the states with weak health advocacy
organizations and increase by just over 2% in the states
with the strongest health advocacy organizations.
In both of these models, the effects of the state and na-
tional diffusion variables remain strong. As before, health
and tobacco organizations help explain state antismoking
adoptions, as do the state’s tobacco production, govern-
ment ideology, and health care spending.
Robustness Considerations and Variationsby Policy Area
We have already noted some ways in which our results are
robust to alternative specifications, which we continue
to explore here. Put generally, these results are robust to
numerous alternative measures of the independent vari-
ables, to alternative assumptions about the hazard rates
of adoption, and to exclusion of many forms of potential
outlier observations. As further robustness checks, and
to examine whether the hypotheses are equally well sup-
ported across the policy areas we are examining, we turn
now to separate models for each of our three policies—
government buildings, restaurants, and out-of-package
sales restrictions.24 The results are shown for interactions
with professionalism in Table 2.
To begin with, as an initial robustness check, we
reran our analysis of legislative professionalism using real
23Due to multicollinearity concerns, we do not incorporate inter-actions for both professionalism and health organizations in thesame model.
24To account for potential temporal dependence, observations areclustered by state.
836 CHARLES R. SHIPAN AND CRAIG VOLDEN
TABLE 2 The Effect of Legislative Professionalism (Salary) on Local-to-StateDiffusion
Model 4 Model 5 Model 6 Model 7
Pooled Government Restaurants Out-of-Pack
Buildings Sales
Local-to-State Diffusion
Proportion of State Population −5.05∗∗∗ −6.18∗ −5.24∗∗ −3.34
with Local Restriction (1.78) (3.83) (2.75) (5.07)
Local Proportion × 0.13∗∗∗ 0.25∗∗∗ 0.15∗∗∗ 0.02
Real Legislative Salary (0.05) (0.11) (0.06) (0.11)
State-to-State Diffusion
Proportion of Neighbors with 1.89∗∗∗ 1.10∗ 1.68∗∗ 2.30∗∗
Restrictions (0.45) (0.67) (0.83) (1.04)
National-to-State Pressures
Synar Amendment Dummy 1.05∗∗∗ −0.79 −0.26 2.37∗∗∗
(0.30) (0.73) (0.67) (0.58)
Organized Interests
Health Organization Lobbyists 1.69 −0.07 11.0∗∗∗ −1.50
(3.27) (3.44) (4.39) (6.77)
Health Orgs. Influence 0.48∗∗∗ 0.31 0.50∗∗ 1.04∗∗∗
(0.19) (0.29) (0.29) (0.37)
Tobacco Lobbyists −17.1 −18.0 −37.9 −44.3∗
(13.8) (19.4) (25.8) (32.4)
Tobacco Influence −0.45 −0.98∗∗ −0.53 −0.02
(0.47) (0.59) (0.92) (0.56)
Citizen and Producer Pressures
Percent Smokers −0.01 0.02 −0.01 −0.14∗∗
(0.05) (0.07) (0.09) (0.08)
Tobacco-Producing State −0.98∗∗∗ −0.66∗ −1.25∗∗ −1.95∗∗∗
(0.36) (0.50) (0.66) (0.66)
Production (millions of tons) −2.55 −1.80 −13.65 2.48
(3.17) (2.55) (13.32) (5.38)
Government Preferences/Control
Government Ideology 0.02∗∗∗ 0.03∗∗ 0.04∗∗∗ 0.01
(0.01) (0.01) (0.01) (0.01)
Unified Democrats −0.001 −0.23 −0.20 −0.47
(0.35) (0.54) (0.66) (0.60)
Unified Republicans −0.53 0.32 0.32 −2.13∗∗
(0.56) (0.90) (0.89) (0.95)
Proportion Spent on Health 17.0∗ 15.4 33.3∗ 41.4∗∗∗
(13.0) (20.5) (25.6) (16.9)
Real Legislative Salary −0.005 −0.01 −0.02 −0.005
(0.011) (0.01) (0.02) (0.017)
Constant −4.70∗∗∗ −4.92∗∗∗ −6.22∗∗ −2.69∗
(1.52) (2.03) (2.95) (1.90)
Wald � 2(16) 77.40∗∗∗ 88.80∗∗∗ 49.95∗∗∗ 36.83∗∗∗
N 2256 678 807 771
Robust standard errors in parentheses, clustered. ∗∗∗p < 0.01, ∗∗p < 0.05, ∗p < 0.1 (one-tailed tests).
BOTTOM-UP FEDERALISM 837
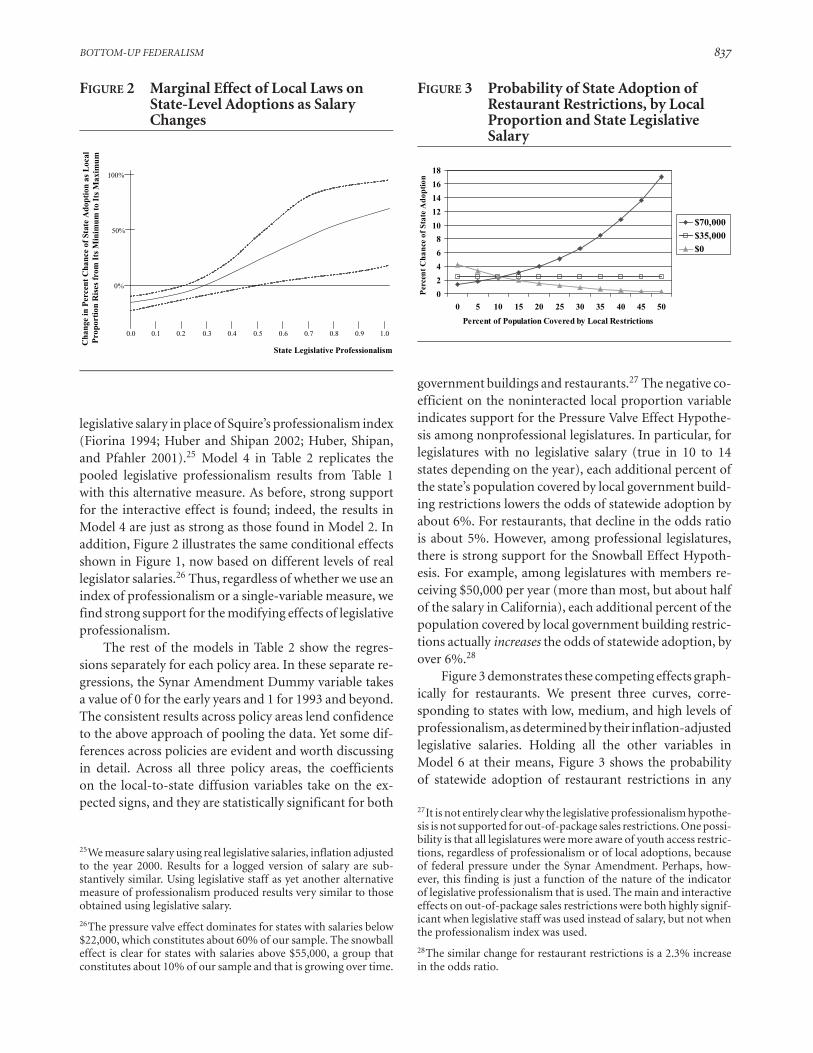
FIGURE 2 Marginal Effect of Local Laws onState-Level Adoptions as SalaryChanges
0.0 0.1 0.2 0.3 0.4 0.5 0.6 0.7 0.8 0.9 1.0
0%
50%
100%
State Legislative Professionalism
Cha
nge
in P
erce
nt C
h anc
e of
Sta
te A
dop t
ion
as L
ocal
P
ropo
r tio
n R
ises
fro
m I
ts M
i nim
um t
o I t
s M
axi m
um
legislative salary in place of Squire’s professionalism index
(Fiorina 1994; Huber and Shipan 2002; Huber, Shipan,
and Pfahler 2001).25 Model 4 in Table 2 replicates the
pooled legislative professionalism results from Table 1
with this alternative measure. As before, strong support
for the interactive effect is found; indeed, the results in
Model 4 are just as strong as those found in Model 2. In
addition, Figure 2 illustrates the same conditional effects
shown in Figure 1, now based on different levels of real
legislator salaries.26 Thus, regardless of whether we use an
index of professionalism or a single-variable measure, we
find strong support for the modifying effects of legislative
professionalism.
The rest of the models in Table 2 show the regres-
sions separately for each policy area. In these separate re-
gressions, the Synar Amendment Dummy variable takes
a value of 0 for the early years and 1 for 1993 and beyond.
The consistent results across policy areas lend confidence
to the above approach of pooling the data. Yet some dif-
ferences across policies are evident and worth discussing
in detail. Across all three policy areas, the coefficients
on the local-to-state diffusion variables take on the ex-
pected signs, and they are statistically significant for both
25We measure salary using real legislative salaries, inflation adjustedto the year 2000. Results for a logged version of salary are sub-stantively similar. Using legislative staff as yet another alternativemeasure of professionalism produced results very similar to thoseobtained using legislative salary.
26The pressure valve effect dominates for states with salaries below$22,000, which constitutes about 60% of our sample. The snowballeffect is clear for states with salaries above $55,000, a group thatconstitutes about 10% of our sample and that is growing over time.
FIGURE 3 Probability of State Adoption ofRestaurant Restrictions, by LocalProportion and State LegislativeSalary
0
2
4
6
8
10
12
14
16
18
0 5 10 15 20 25 30 35 40 45 50
Percent of Population Covered by Local Restrictions
Per
cen
t C
han
ce o
f S
tate
Ad
opti
on
$70,000
$35,000
$0
government buildings and restaurants.27 The negative co-
efficient on the noninteracted local proportion variable
indicates support for the Pressure Valve Effect Hypothe-
sis among nonprofessional legislatures. In particular, for
legislatures with no legislative salary (true in 10 to 14
states depending on the year), each additional percent of
the state’s population covered by local government build-
ing restrictions lowers the odds of statewide adoption by
about 6%. For restaurants, that decline in the odds ratio
is about 5%. However, among professional legislatures,
there is strong support for the Snowball Effect Hypoth-
esis. For example, among legislatures with members re-
ceiving $50,000 per year (more than most, but about half
of the salary in California), each additional percent of the
population covered by local government building restric-
tions actually increases the odds of statewide adoption, by
over 6%.28
Figure 3 demonstrates these competing effects graph-
ically for restaurants. We present three curves, corre-
sponding to states with low, medium, and high levels of
professionalism, as determined by their inflation-adjusted
legislative salaries. Holding all the other variables in
Model 6 at their means, Figure 3 shows the probability
of statewide adoption of restaurant restrictions in any
27It is not entirely clear why the legislative professionalism hypothe-sis is not supported for out-of-package sales restrictions. One possi-bility is that all legislatures were more aware of youth access restric-tions, regardless of professionalism or of local adoptions, becauseof federal pressure under the Synar Amendment. Perhaps, how-ever, this finding is just a function of the nature of the indicatorof legislative professionalism that is used. The main and interactiveeffects on out-of-package sales restrictions were both highly signif-icant when legislative staff was used instead of salary, but not whenthe professionalism index was used.
28The similar change for restaurant restrictions is a 2.3% increasein the odds ratio.
838 CHARLES R. SHIPAN AND CRAIG VOLDEN
given year based on the extent of local government re-
strictions. Among those states with no state legislative
salaries, the pressure valve effect dominates, with the per-
cent chance of statewide adoption declining when more
cities pass laws. Where no cities have restaurant restric-
tions, the state legislature will adopt a restriction in a given
year 4% of the time. This declines to near zero when half
of the population is already covered by local restaurant
restrictions, leaving little pressure for statewide action.
Among moderately professional legislatures, those earn-
ing $35,000 per year, the snowball and pressure valve ef-
fects seem to balance out, leaving a 2.5% annual chance
of statewide adoption regardless of local restrictions. For
the most professional legislatures, however, the snowball
effect dominates. As the proportion of the public covered
by local restrictions rises from 0 to 50%, the likelihood of
state action increases from less than 2% in any given year
to more than 16%.
Similar relationships hold for government building
restrictions, with a pressure valve effect giving way to a
stronger snowball effect for legislatures with salaries in
excess of $25,000 per year. Similar significant results hold
in these two areas using the Squire index instead of salary,
thus strongly supporting the Local Diffusion and Leg-
sion is significant across all three policy areas, although
it is strongest for out-of-package sales restrictions. As ex-
pected, the Synar Amendment does not affect the clean
indoor air types of antismoking policies, but has a major
effect on youth access restrictions. Coefficient sizes and
significance on the control variables do vary somewhat
across the three policy areas, although their signs are con-
sistent with theoretical expectations.
In Table 3, the effect of policy advocates is broken
down across the three different antismoking policies. As
in Model 3 above, we interact the proportion of the state
population covered by local restrictions with health or-
ganizations influence.29 As in the pooled model, the lo-
cal proportion variable has a positive coefficient and the
interaction is negative across all three models. However,
these coefficients are statistically significant only for out-
of-package sales restrictions. In that model, we find solid
support for the Pressure Valve Effect Hypothesis where
health advocates are not a strong force in the state (i.e.,
not one of the 20 most important groups). Specifically,
in such states, when an additional 10% of the population
is covered by local out-of-package sales restrictions, the
29Interactions with the tobacco industry’s influence instead showedno systematic effects. This is unsurprising as it is not clear theoreti-cally whether the tobacco industry would redouble its efforts uponlocal adoptions or would redirect its resources to more favorablestates.
odds of a statewide adoption decline by 56%. At the other
extreme, where health organizations are among the top
10 most influential groups before the state legislature, a
10% increase in local coverage is associated with a rise in
the odds ratio of statewide adoption by about 16%.
There may be several reasons for the lack of support
for the policy advocates hypothesis in the areas of govern-
ment building and restaurant restrictions. One potential
explanation for the null results for restaurants is that the
pressure of health organizations may be drowned out by
the economic interests of restaurateurs, the controversial
claims of restaurant staffs and nonsmokers, and the power
of the tobacco industry. For government buildings, it is
again possible that health organizations’ arguments were
overpowered by those of the tobacco industry. For out-of-
package sales restrictions, unlike clean indoor air debates,
the shift to a focus on children, rather than on individ-
ual rights, delegitimized opposition to youth access re-
strictions (Jacobson, Wasserman, and Anderson 1997). In
states with strong health advocates within the legislature,
then, we find such entrepreneurs building on local suc-
cesses, generating a snowball effect. In the absence of such
advocacy, however, the pressure valve effect outweighs the
snowball effect, with mobilized parents and antismoking
groups returning home with their local victories and no
major groups at the state level pushing for action.30 Alter-
natively, the results may be strongest for out-of-package
sales restrictions merely because the health organizations
influence variable is based on a 1994 snapshot, about the
time that the bulk of youth access restrictions were be-
ing adopted; hence, the interactions are less noisy for that
policy area than for others.
Our findings on the effects of health organizations
complement and expand upon recent scholarship on the
role of policy entrepreneurs and advocates in the diffu-
sion process (Balla 2001; Mintrom 1997a; Skocpol et al.
1993). Although these scholars each find a greater likeli-
hood of state adoption of their respective policies when
such groups are present, they do not explore interactions,
through which evidence might emerge that these groups
facilitate diffusion. The baseline results in Table 1 indicate
the importance of health organizations in antismoking
adoptions generally. But the interactive results go a step
further. Absent these groups, local policies hinder state
action, at least in the area of out-of-package sales restric-
tions. But in the presence of effective health lobbying or-
ganizations, state governments respond positively to local
30Separate analyses of local adoptions find that strong health advo-cates at the state level actually lower the likelihood of local adop-tions, thus alleviating any concerns that the interactive effect foundhere is a result of effective advocacy at both the local and state levelsimultaneously.
BOTTOM-UP FEDERALISM 839
TABLE 3 The Effect of Policy Advocacy on Local-to-State Diffusion
Model 8 Model 9 Model 10
Government Restaurants Out-of-Pack
Buildings Sales
Local-to-State Diffusion
Proportion of State Population −1.68 −3.26 −8.17∗∗
with Local Restriction (4.30) (6.86) (4.22)
Local Proportion × 3.24 2.97 4.83∗∗
Health Orgs. Influence (3.29) (6.57) (2.77)
State-to-State Diffusion
Proportion of Neighbors with 1.12∗ 1.92∗∗ 2.47∗∗∗
Restrictions (0.69) (0.87) (1.01)
National-to-State Pressures
Synar Amendment Dummy −1.08 −0.56 2.33∗∗∗
(0.79) (0.71) (0.54)
Organized Interests
Health Organization Lobbyists 0.30 10.3∗∗ −2.75
(2.86) (3.59) (6.06)
Health Orgs. Influence 0.37 0.46∗ 0.77∗∗
(0.31) (0.30) (0.39)
Tobacco Lobbyists −24.6∗ −26.3 −40.2
(18.7) (26.7) (31.9)
Tobacco Influence −0.45 0.03 −0.61
(0.44) (0.64) (0.70)
Citizen and Producer Pressures
Percent Smokers 0.005 −0.02 −0.15∗∗
(0.071) (0.09) (0.08)
Tobacco-Producing State −0.79∗ −1.28∗∗ −2.22∗∗∗
(0.48) (0.65) (0.66)
Production (millions of tons) −2.28 −14.8 7.21
(2.54) (15.4) (5.82)
Government Preferences/Control
Government Ideology 0.03∗∗∗ 0.03∗∗∗ 0.002
(0.01) (0.01) (0.015)
Unified Democrats −0.11 −0.04 −0.50
(0.56) (0.68) (0.61)
Unified Republicans 0.31 0.09 −2.37∗∗∗
(0.95) (0.96) (0.95)
Proportion Spent on Health 23.8 39.0∗ 40.9∗∗∗
(22.4) (27.9) (16.2)
Legislative Professionalism −1.74 −1.58 1.11
(1.69) (1.84) (2.59)
Constant −4.96∗∗∗ −6.15∗∗ −1.97
(1.98) (3.01) (1.92)
Wald � 2(16) 83.03∗∗∗ 51.73∗∗∗ 56.58∗∗∗
N 678 807 771
Robust standard errors in parentheses, clustered by state. ∗∗∗p<0.01, ∗∗p<0.05, ∗p<0.1 (one-tailed tests).
840 CHARLES R. SHIPAN AND CRAIG VOLDEN
youth access restrictions.31 These findings provide strong
evidence that health organizations serve as a conduit for
the diffusion of youth access restrictions, lending support
to the Local Diffusion and Policy Advocates Hypothesis.
Discussion and Conclusion
Scholars have long known that state policy adoptions of-
ten are influenced both by factors internal to the state
and by the diffusion of policies across states. We find
that the adoption of antismoking policies is no exception,
with understandable state-to-state and national-to-state
patterns of diffusion. However, previous studies have ne-
glected the role that local laws can play in influencing state
adoptions and have not identified the political conditions
under which policy diffusion occurs. We present evidence
that local-to-state diffusion does exist, but that it depends
crucially on the political environment. Ignoring the role
of legislative professionalism and of interest groups pro-
duces evidence of neither a snowball nor a pressure valve
effect; instead, these effects counterbalance each other and
produce null results for the influence of local laws.
However, when state legislatures are more profes-
sional, and thus have higher capabilities to address local
economic spillovers, to learn from local actions, and to
proactively pursue a similar statewide course, a snowball
effect becomes more prominent. Absent such profession-
alism, legislatures give way to a pressure valve effect, where
local laws solve the problems at hand without the need for
further action. We find a similar interactive effect between
local laws and the strength of pro-health lobbies in the area
of youth access. Where they have enough political clout
relative to other actors, strong health organizations help
overcome the pressure valve effect to restore the positive
snowball effect of local adoptions. In the absence of such
groups, local laws serve as a substitute for legislation at
the state level.
Our analysis also points to two clear paths for fu-
ture research. First, by identifying the intervening nature
of political variables in the diffusion process, we open
the door to future research on the conditional nature of
policy diffusion. State-to-state diffusion also may depend
on factors such as legislative professionalism and interest
group advocacy. Interacting such variables with neigh-
borhood effects should become commonplace in state-
to-state diffusion analyses. Likewise, other intervening
relationships may be crucial. For example, one fruitful
31A similar relationship holds for the interaction between theseorganizations and state-to-state diffusion, here excluded for spaceconsiderations.
line of research might examine whether policy adoptions
elsewhere (among localities or other states) are perceived
to be successful by state policymakers. If they see evidence
of local restaurant restrictions negatively influencing din-
ing receipts, for instance, lawmakers would be less likely
to adopt statewide restrictions than if they observed no
such adverse effects.
Second, the vertical diffusion of local-to-state policy
adoptions is suggestive of additional diffusion relation-
ships that are ripe for further study. State-to-local and
local-to-local patterns have been understudied, as have
state-to-national diffusions. State-to-national diffusion is
difficult to examine, as there is only one government be-
ing analyzed in terms of its adoptions. Drawing on our
current findings, we expect that areas of greater upward
diffusion to national policy would be those in which ac-
tive national interest groups build on their local and state
successes. Studies of diffusion among localities have been
limited by data availability; thus numerous questions re-
main. Does diffusion exist among cities? Do local diffu-
sion patterns stop at state borders? How do state actions
influence local adoptions? This may be a particularly im-
portant direction for antismoking policies, as the strength
of the tobacco industry appears to be greater at higher lev-
els of government. Furthermore, tobacco’s strength at the
state level can result in preemption, wherein a state law
precludes stronger action, or sometimes any action, at the
local level, thus dramatically altering the effect of one level
of government on another.
Beyond the scholarly evidence amassed here regard-
ing the complicated policy diffusion processes in Ameri-
can federalism, this study has produced some noteworthy
policy-relevant findings. Antismoking activists have often
concentrated their efforts at the local level, where they find
the least resistance from the tobacco industry. Our work
suggests that these local successes are likely to promote
statewide action only in states with professional legisla-
tures and powerful health organizations. Seemingly, a lo-
cal adoption strategy is a highly productive approach in
states with professional legislatures. Such legislators will
pick up on local measures and promote these policy ideas
as their own. Outside of such states, however, local adop-
tions discourage statewide action. Here, health advocates
would be well advised not to limit their efforts to the local
level. As demonstrated in the area of out-of-package sales
restrictions, strong health advocacy at the state level can
build upon local successes to promote statewide policy
change. Practically, this suggests that antismoking groups
that use a local-only approach should abandon this strat-
egy and dedicate additional resources at the state level,
especially in the area of youth access to tobacco and espe-
cially in states with less professional legislatures.
Allen, Mahalley D., Carrie Pettus, and Donald P. Haider-Markel.2004. “Making the National Local: Specifying the Conditionsfor National Government Influence on State Policymaking.”State Politics and Policy Quarterly 4(3):318–44.
Bailey, Michael A., and Mark Carl Rom. 2004. “A WiderRace? Interstate Competition across Health and Welfare Pro-grams.” Journal of Politics 66(2):326–47.
Balla, Steven J. 2001. “Interstate Professional Associations andthe Diffusion of Policy Innovations.” American Politics Re-search 29(3):221–45.
Beck, Nathaniel, Jonathan N. Katz, and Richard Tucker. 1998.“Taking Time Seriously: Time-Series-Cross-Section Analy-sis with a Binary Dependent Variable.” American Journal ofPolitical Science 42(4):1260–88.
Berry, Frances Stokes. 1994. “Sizing Up State Policy InnovationResearch.” Policy Studies Journal 22(3):442–56.
Berry, Frances Stokes, and William D. Berry. 1990. “State LotteryAdoptions as Policy Innovations: An Event History Analysis.”American Political Science Review 84(2):395–415.
Berry, William D., Evan J. Ringquist, Richard C. Fording, andRussell L. Hanson. 1998. “Measuring Citizen and Govern-ment Ideology in the American States, 1960–93.” AmericanJournal of Political Science 42(1):327–48.
Boeckelman, Keith. 1992. “The Influence of States on FederalPolicy Adoptions.” Policy Studies Journal 20(3):365–75.
Boehmke, Frederick J. 2005. The Indirect Effect of Direct Legisla-tion: How Institutions Shape Interest Group Systems. Colum-bus: The Ohio State University Press.
Boehmke, Frederick J., and Richard Witmer. 2004. “Disentan-gling Diffusion: The Effects of Social Learning and EconomicCompetition on State Policy Innovation and Expansion.” Po-litical Research Quarterly 57(1):39–51.
Box-Steffensmeier, Janet M., and Christopher Zorn. 2002.“Duration Models for Repeated Events.” Journal of Politics64(4):1069–94.
Brace, Paul, Kevin Arceneaux, Martin Johnson, and Stacy G. Ul-big. 2005. “Does State Political Ideology Change over Time?”Political Research Quarterly 57(4):529–40.
Brandeis, Louis Dembitz. 1932. “Dissenting Opinion.” NewState Ice Co. v. Liebmann, 285 U.S. 262, 311.
Buckley, Jack, and Chad Westerland. 2004. “Duration Depen-dence, Functional Form, and Correct Standard Errors: Im-proving EHA Models of State Policy Diffusion.” State Politicsand Policy Quarterly 4(1):94–113.
Case, Anne C., James R. Hines, Jr., and Harvey S. Rosen. 1993.“Budget Spillovers and Fiscal Policy Interdependence: Evi-dence from the States.” Journal of Public Economics 52:285–307.
Chriqui, Jamie F. 2000. Restricting Minors’ Access to TobaccoProducts: An Examination of State Legislation and Policy In-novation. Ph.D. Dissertation, University of Maryland.
Cohen, Joanna E., et al. 2000. “Political Ideology and TobaccoControl.” Tobacco Control 9:263–67.
Crain, Robert L. 1966. “Fluoridation—Diffusion of an Innova-tion among Cities.” Social Forces 44(4):467–76.
Erikson, Robert S., Gerald C. Wright, and John P. McIver.1994. Statehouse Democracy. New York: Cambridge Univer-sity Press.
Fiorina, Morris P. 1994. “Divided Government in the AmericanStates: A Byproduct of Legislative Professionalism?” Ameri-can Political Science Review 88:304–16.
Flynn, Brian S., et al. 1997. “State Legislators’ Intentions toVote and Subsequent Votes on Tobacco Control Legislation.”Health Psychology 16(4):401–4.
Gilardi, Fabrizio. 2005. “The Institutional Foundations of Reg-ulatory Capitalism: The Diffusion of Independent Regula-tory Agencies in Western Europe.” Annals of the AmericanAcademy of Political and Social Science 598:84–101.
Givel, Michael S., and Stanton A. Glantz. 2001. “Tobacco LobbyPolitical Influence on U.S. State Legislatures in the 1990s.”Tobacco Control 10:124–34.
Glantz, Stanton A., and Michael E. Begay. 1994. “Tobacco Indus-try Campaign Contributions Are Affecting Tobacco ControlPolicymaking in California.” Journal of the American MedicalAssociation 272:1176–82.
Glick, Henry R., and Scott P. Hays. 1991. “Innovation andReinvention in State Policymaking: Theory and the Evolu-tion of Living Will Laws.” The Journal of Politics 53(3):835–50.
Godwin, Marcia L., and Jean R. Schroedel. 2000. “Policy Diffu-sion and Strategies for Promoting Policy Change: Evidencefrom California Local Gun Control Ordinances.” Policy Stud-ies Journal 28(4):760–76.
Golder, Sona Nadenichek. 2006. “Pre-Electoral Coalition For-mation in Parliamentary Democracies.” British Journal ofPolitical Science 36(2):193–212.
Goldstein, Adam O., and Nathan S. Bearman. 1996. “StateTobacco Lobbyists and Organizations in the UnitedStates: Crossed Lines.” American Journal of Public Health86(8):1137–42.
Gray, Virginia. 1973. “Innovation in the States: A DiffusionStudy.” American Political Science Review 67:1174–85.
Gray, Virginia, and David Lowery. 1996. The Population Ecol-ogy of Interest Representation: Lobbying Communities inthe American States. Ann Arbor: University of MichiganPress.
Huber, John D., and Charles R. Shipan. 2002. Deliberate Dis-cretion? The Institutional Foundations of Bureaucratic Auton-omy. New York: Cambridge University Press.
Huber, John D., Charles R. Shipan, and Madelaine Pfahler. 2001.“Legislatures and Statutory Control of Bureaucracy.” Amer-ican Journal of Political Science 45(2):330–45.
Jacobson, Peter D., and Jeffrey Wasserman. 1997. Tobacco Con-trol Laws: Implementation and Enforcement . Santa Monica:RAND.
Jacobson, Peter D., and Jeffrey Wasserman. 1999. “The Imple-mentation and Enforcement of Tobacco Control Laws: PolicyImplications for Activists and the Industry.” Journal of HealthPolitics, Policy, and Law 24(3):567–98.
Jacobson, Peter D., Jeffrey Wasserman, and John R. Anderson.1997. “Historical Overview of Tobacco Legislation and Reg-ulation.” Journal of Social Issues 53(1):75–95.
Jacobson, Peter D., Jeffrey Wasserman, and Kristiana Raube.1993. “The Politics of Antismoking Legislation.” Journal ofHealth Politics, Policy, and Law 18(4):787–819.
Ka, Sangjoon, and Paul Teske. 2002. “Ideology and Profession-alism: Electricity Regulation and Deregulation over Time inthe American States.” American Politics Research 30(3):323–43.
BOTTOM-UP FEDERALISM 843
King, James D. 2000. “Changes in Professionalism in U.S. StateLegislatures.” Legislative Studies Quarterly 25(2):327–44.
Kingdon, John W. 1984. Agendas, Alternatives, and Public Poli-cies. Boston: Little, Brown and Company.
Knoke, David. 1982. “The Spread of Municipal Reform: Tem-poral, Spatial, and Social Dynamics.” American Journal ofSociology 87(6):1314–39.
Macdonald, Heather R., and Stanton A. Glantz. 1997. “PoliticalRealities of Statewide Smoking Legislation: The Passage ofCalifornia’s Assembly Bill 13.” Tobacco Control 6:41–54.
Maestas, Cherie. 2000. “Professional Legislatures and Ambi-tious Politicians: Policy Responsiveness of State Institutions.”Legislative Studies Quarterly 25(4):663–90.
Maestas, Cherie. 2003. “The Incentive to Listen: ProgressiveAmbition, Resources, and Opinion Monitoring among StateLegislators.” Journal of Politics 65(2):439–56.
Mintrom, Michael. 1997a. “Policy Entrepreneurs and the Dif-fusion of Innovation.” American Journal of Political Science41(3):738–70.
Mintrom, Michael. 1997b. “The State-Local Nexus in PolicyInnovation Diffusion: The Case of School Choice.” Publius:The Journal of Federalism 27(3):41–59.
Monardi, Fred, and Stanton A. Glantz. 1998. “Are Tobacco In-dustry Campaign Contributions Influencing State Legisla-tive Behavior?” American Journal of Public Health 88(6):918–23.
Mooney, Christopher Z., and Mei-Hsien Lee. 1995. “Legisla-tive Morality in the American States: The Case of Pre-RoeAbortion Regulation Reform.” American Journal of PoliticalScience 39(3):599–627.
Mossberger, Karen. 1999. “State-Federal Diffusion and PolicyLearning: From Enterprise Zones to Empowerment Zones.”Publius: The Journal of Federalism 29(3):31–50.
Peterson, Paul E., and Mark C. Rom. 1990. Welfare Magnets:A New Case for a National Standard. Washington, DC: TheBrookings Institution.
Samuels, Bruce, and Stanton A. Glantz. 1991. “The Politics ofLocal Tobacco Control.” JAMA 266(15):2110–17.
Schroeder, Steven A. 2004. “Tobacco Control in the Wake of the1998 Master Settlement Agreement.” New England Journalof Medicine 350(3):293–301.
Skocpol, Theda, Marjorie Abend-Wein, Christopher Howard,and Susan Goodrich Lehmann. 1993. “Women’s Associ-ations and the Enactment of Mothers’ Pensions in theUnited States.” American Political Science Review 87(3):686–701.
Squire, Peverill. 1992. “Legislative Professionalization andMembership Diversity in State Legislatures.” Legislative Stud-ies Quarterly 17(1):69–79.
Squire, Peverill. 1993. “Professionalization and Public Opinionof State Legislatures.” Journal of Politics 55(2):479–91.
Squire, Peverill. 1998. “Membership Turnover and the Effi-cient Processing of Legislation.” Legislative Studies Quarterly23(1):23–32.
Thomas, Clive R., and Ronald J. Hrebenar. 1999. “InterestGroups in the States.” In Politics in the American States: AComparative Analysis, 7th ed., ed. Virginia Gray, Russell L.Hanson, and Herbert Jacob. Washington, DC: CQ Press,pp. 113–43.
Volden, Craig. 2006. “States as Policy Laboratories: EmulatingSuccess in the Children’s Health Insurance Program.” Amer-ican Journal of Political Science 50(2):294–312.
Walker, Jack L. 1969. “The Diffusion of Innovations among theAmerican States.” American Political Science Review 63:880–99.
Walker, Jack L. 1973. “Problems in Research on Diffusionof Policy Innovations.” American Political Science Review67(4):1186–91.
Wei, L. J., D. Y. Lin, and L. Weissfeld. 1989. “Regression Analysisof Multivariate Incomplete Failure Time Data by ModelingMarginal Distributions.” Journal of the American StatisticalAssociation 84(408):1065–73.