20
BOWLING GREEN CITIZEN CUSTOMER SATISFACTION SURVEY Fall 2010 – National Citizen Survey
| Date post: | 17-Dec-2015 |
| Category: |
Documents |
| Upload: | byron-wilkinson |
| View: | 214 times |
| Download: | 0 times |

BOWLING GREEN CITIZEN CUSTOMER SATISFACTION SURVEY
Fall 2010 – National Citizen Survey

National Citizen Survey
Collaborative effort between the National Research Center (NRC) & International City/County Management Association (ICMA)
The City of BG participates in ICMA’s Center for Performance Measurement
Survey focuses on community characteristics, local government services, and issues of public trust
Also measures resident behaviors relating to civic engagement

Additional Information – Survey Process
City staff reviewed standard NCS form menu and customized
We included services not provided by the City as well (library, utilities, transit)
NRC mailed questionnaires to a representative sample of 1200 BG households (100 were undelivered)
Multi-contact notification was delivered via postcard and then survey sent twice on City letterhead/envelopes

Additional Information – Survey Process
The adult with the most recent birthday was asked to complete the survey – this was done to get a representative sample
There was a 24% response rate (20 to 40% is typical) 263 of the 1200 surveys were completed and returned.

Why Survey?
Immediate Benefits – Provides useful information for: Planning Resource Allocation Performance Measurements Program and Policy Evaluation

Why Survey?
Long Term Benefits – Provides useful information for: Improved Services More Civic Engagement Better Community Quality of Life Stronger Public Trust

Understanding the Results
The Survey Contains a Margin of Error of 5% If 75% of respondents rate a
service as “excellent or good” then the range of likely responses from the entire community is between 70% and 80%
Data is statistically weighted to reflect proper community demographics including rent/own

Understanding the Results – Comparisons
Nationally, public safety services tend to be rated higher than transportation services
It is better to compare BG’s services to similar services provided by other jurisdictions rather than comparing one service to another within our City.
In order for a comparison from a previous survey to be “significant,” the +/- needs to be more then 8%
Overall, our comparisons in 2010 were better then 2008

Understanding the Results – Benchmarking
A benchmark is a standard by which something can be measured or judged
NRC has a database of survey results from 500 jurisdictions that can be used as a benchmark
Bowling Green chose to compare to: The entire database of 500
jurisdictions And the southern region specifically -
with 136 jurisdictions in 16 states

Understanding the Results – Benchmarking
77% of residents rated the overall quality of life in BG as excellent (E) or good (G) which is above or similar to the national and southern region benchmarks

Understanding the Results – Benchmarking
31 community characteristics and 37 City services were surveyed and compared to the benchmark data
For the 31 community characteristics surveyed, BG was rated “above” the benchmark in 16 categories; “similar” in 9 categories and “below” in 6 categories
For the 37 City services surveyed, BG was rated “above” the benchmark in 17 areas; “similar” in 17 areas and “below” in 3 areas

Overall Community Quality - % rated as Excellent or Good
BG as a place to live – 81% Your neighborhood as a place
to live – 67% BG as a place to raise children
– 85% BG as a place to work – 67% BG as a place to retire – 69% The overall quality of life in BG
– 78%

Service Quality - % rated as Excellent or Good
BG Police Department Services – 76%
BG Fire Department Services – 94% Street Repair – 41% Street Cleaning – 62% Street Lighting – 68% Snow Removal – 63% Sidewalk Maintenance – 51% Storm Drainage – 53%

Service Quality - % rated as Excellent or Good
City Parks – 87% Recreation Programs or Classes –
76% Recreation Centers or Facilities –
76% Code Enforcement (weeds,
abandoned buildings, etc.) – 50% Animal Control – 64% Public Information Services – 72% Cleanliness of BG – 73%

Community Characteristics - % rated as Excellent or Good
Overall Appearance of BG – 74% Cleanliness of BG – 73% Recreational Opportunities – 67% Opportunities to Volunteer – 77% Opportunities for Employment –
49% Opportunities to Participate in
Community Matters – 62% Ease of Walking in BG – 43%

Community Characteristics - % rated as Excellent or Good
Availability of Paths and Walking Trails in BG – 45%
Traffic Flow on Major Streets – 28%
Overall Image or Reputation of BG – 80%
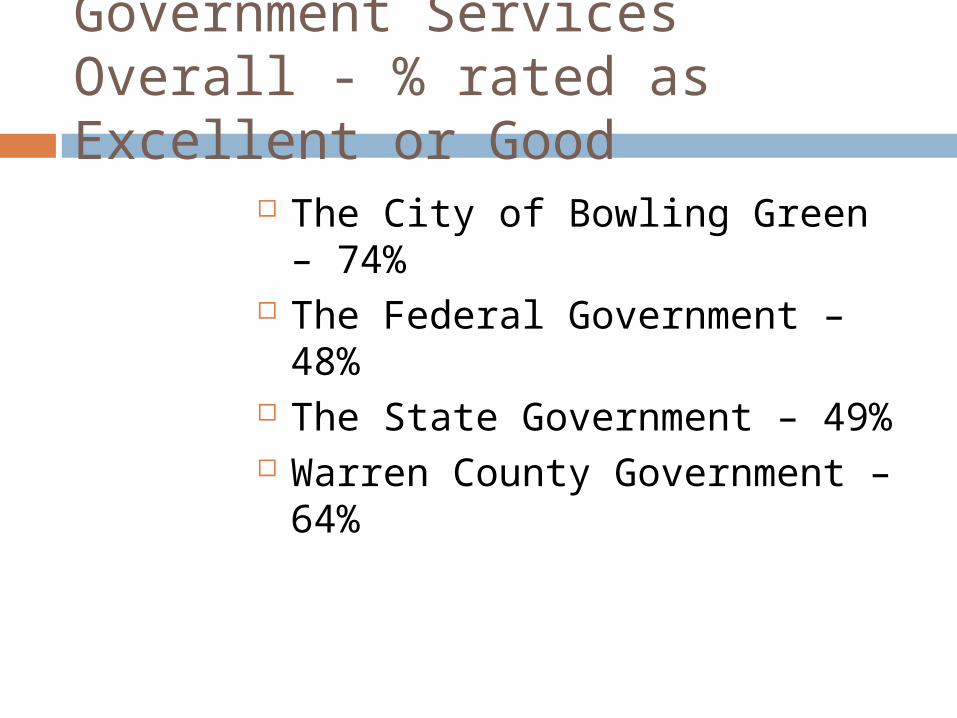
Government Services Overall - % rated as Excellent or Good
The City of Bowling Green – 74%
The Federal Government – 48% The State Government – 49% Warren County Government –
64%

Areas for Improvement – services or characteristics that rated below average
Street Repair Sidewalk Maintenance Overall Cleanliness of BG Traffic Flow Fire Services Strom Water drainage Police Services Citizens Attending Local
Meetings

Areas We Are Excelling – services or characteristics that rated above average
Overall Image/Reputation of BG Services provided by BG City Recreation Centers Street Lighting Public Education City Parks Safety in Bowling Green’s
Downtown area during the day

Additional Information – Contact
The information presented in this power point does not include all survey questions and responses.
To view the survey in its entirety, visit www.bgky.org/
For more information or if you have questions, please contact Kim Lancaster at 393-3642 or [email protected]


