84
BP 2010 results and investor update London 1 February 2011

8/3/2019 Bp Fourth Quarter 2010 Results Presentation Slides
http://slidepdf.com/reader/full/bp-fourth-quarter-2010-results-presentation-slides 1/84
BP 2010 results and investor updateLondon1 February 2011

8/3/2019 Bp Fourth Quarter 2010 Results Presentation Slides
http://slidepdf.com/reader/full/bp-fourth-quarter-2010-results-presentation-slides 2/84
2
Bob DudleyGroup Chief Executive

8/3/2019 Bp Fourth Quarter 2010 Results Presentation Slides
http://slidepdf.com/reader/full/bp-fourth-quarter-2010-results-presentation-slides 3/84
8/3/2019 Bp Fourth Quarter 2010 Results Presentation Slides
http://slidepdf.com/reader/full/bp-fourth-quarter-2010-results-presentation-slides 4/84
4
Agenda
Introduction Bob Dudley
2010 results Byron Grote
Safety & Operational Risk Bob Dudley
Gulf of Mexico oil spill
Exploration & Production
Refining & Marketing Iain Conn
Alternative Energy Bob Dudley
Conclusion
Q&A
8/3/2019 Bp Fourth Quarter 2010 Results Presentation Slides
http://slidepdf.com/reader/full/bp-fourth-quarter-2010-results-presentation-slides 5/84
5
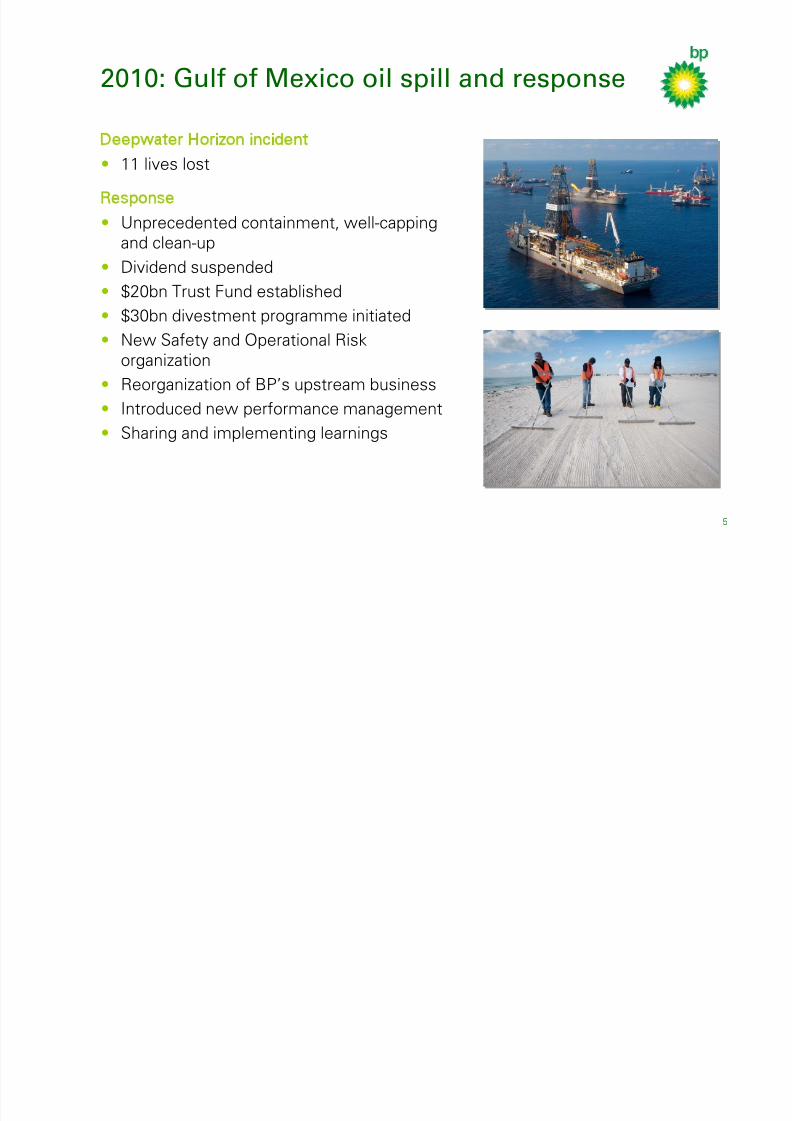
2010: Gulf of Mexico oil spill and response
Deepwater Horizon incident
• 11 lives lost
Response• Unprecedented containment, well-capping
and clean-up
• Dividend suspended
• $20bn Trust Fund established• $30bn divestment programme initiated
• New Safety and Operational Risk
organization
• Reorganization of BP’s upstream business• Introduced new performance management
• Sharing and implementing learnings

8/3/2019 Bp Fourth Quarter 2010 Results Presentation Slides
http://slidepdf.com/reader/full/bp-fourth-quarter-2010-results-presentation-slides 6/84
6
2010: underlying performance
Strong underlying financial performance(1)
• Underlying earnings of $20.5bn and operating cash flow of $29.6bn
Business performance delivery
• 106% reserves and 470% resource replacement(2)
• Access and exploration success
− Brazil, Azerbaijan, Egypt, North Sea, Indonesia, China
• 15 projects progressed through Final Investment Decision
• Improved Production Target achieved in Iraq
• $0.9bn of underlying performance improvement in R&M(3)
Successful divestment program• Realized values exceeded expectations
• Portfolio refocused
(1) Adjusted for the costs associated with the Gulf of Mexico oil spill, other Non-Operating Items and Fair Value Accounting Effects
(2) Reserves and resource replacement, as reported on a combined basis of subsidiaries and equity accounted entities, excluding acquisitions and divestments
(3) Adjusted for non-operating items, fair value timing effects and the environment effect of refining margins, petrochemical margins,forex and energy costs

8/3/2019 Bp Fourth Quarter 2010 Results Presentation Slides
http://slidepdf.com/reader/full/bp-fourth-quarter-2010-results-presentation-slides 7/84
7
Energy demand to 2030
* Includes biofuels
Source: BP Energy Outlook 2030
Bo
to
0
3
6
9
12
15
18
1870 1910 1950 1990 2030
Renewables* Nuclear Hydro Gas Oil Coal

8/3/2019 Bp Fourth Quarter 2010 Results Presentation Slides
http://slidepdf.com/reader/full/bp-fourth-quarter-2010-results-presentation-slides 8/84
8
The challenge of meeting growing demand
(1) Today’s borders
* Includes biofuels
Source: BP Energy Outlook 2030
Bo
to
Renewables* NuclearHydro Gas OilCoal
US
0
1
2
3
4
1990 2010 2030
EU(1)
0
1
2
3
4
1990 2010 2030
China
0
1
2
3
4
1990 2010 2030
8/3/2019 Bp Fourth Quarter 2010 Results Presentation Slides
http://slidepdf.com/reader/full/bp-fourth-quarter-2010-results-presentation-slides 9/84
9
Moving BP forward
Our strategic agendaPutting Safety & Operational Risk management at the heart of the company
• A long term integrated approach
− How we manage risk
−How we operate
− How we partner with governments and contractors
− How we reward our people
Re-building trust
• Meeting our commitments to the US
• Sharing and implementing lessons globally
Value growth
• Dividend resumed
• Active portfolio management: divesting/acquiring for value
• Investing for upstream value
− Growth project portfolio + focussed base = potential for stronger growth
− Increasing investment in exploration
− New forms of partnerships with resource holders
• Reshaping downstream
− More focussed portfolio: improved returns and growth

8/3/2019 Bp Fourth Quarter 2010 Results Presentation Slides
http://slidepdf.com/reader/full/bp-fourth-quarter-2010-results-presentation-slides 10/84
10
The BP team
Mike Daly
Executive Vice President,
Exploration
Bernard LooneyExecutive Vice President,
Developments
Bob Fryar
Executive Vice President,
Production
Andy Hopwood
Executive Vice President,
Strategy & Integration
Mark Bly
Executive Vice President,
Safety & Operational Risk
Bob Dudley
Group Chief Executive
David Peattie
Senior Vice President,
Russia
Lamar McKay
President & Chairman
BP America & GCRO
Rupert Bondy
Group General Counsel
2011 BP investor roadshow team
Brian Gilvary
Deputy Group CFO &
Head of Finance
Iain Conn
Chief ExecutiveRefining & Marketing
Byron Grote
Chief Financial Officer
Steve Westwell
Executive Vice President,
Group Strategy &
Integration
Peter HenshawGroup Head of
Communications
Fergus MacLeodHead of Investor
Relations

8/3/2019 Bp Fourth Quarter 2010 Results Presentation Slides
http://slidepdf.com/reader/full/bp-fourth-quarter-2010-results-presentation-slides 11/84
11
Byron GroteChief Financial Officer

8/3/2019 Bp Fourth Quarter 2010 Results Presentation Slides
http://slidepdf.com/reader/full/bp-fourth-quarter-2010-results-presentation-slides 12/84
12
Trading environmentLiquids realization
0
30
60
90
1Q 2Q 3Q 4Q 1Q 2Q 3Q 4Q
2009 2010
Refining indicator margin
0
2
4
6
8
1Q 2Q 3Q 4Q 1Q 2Q 3Q 4Q2009 2010
Gas realization
0
4
8
12
16
1Q 2Q 3Q 4Q 1Q 2Q 3Q 4Q
2009 2010
$m
$b
$b
Change vs 2009
Average realizations 4Q Year
Liquids $/bbl 16% 30%
Natural gas $/mcf 8% 22%
Total hydrocarbons $/boe 10% 25%
Refining indicator margin $/bbl 211% 11%

8/3/2019 Bp Fourth Quarter 2010 Results Presentation Slides
http://slidepdf.com/reader/full/bp-fourth-quarter-2010-results-presentation-slides 13/84
13
Financial resultsAll earnings figures are adjusted for the costs associated with the Gulf of Mexico oil spill,
other non-operating items and fair value accounting effects.
* 4Q10 excludes post-tax cash outflows of $(5.4)bn related to Gulf of Mexico oil spill
Replacement cost profit before interest and tax
4Q10 vs 4Q09 ($bn)
0
1
2
3
4
5
6
7
8
4Q09 E&P R&M OB&C Co.adj. 4Q10
5.2.9rganic capital expenditure ($bn)
14.0
2.6
7.3
23.4
4.4
(1.5)
(0.4)
6.3
(0.5)
(0.3)
0.0
7.1
4Q09
(2.2)Tax
7.0eplacement cost profit before
interest and tax
0.1Consolidation adjustment
(0.4)Interest & minority interest
5.2ash from operations ($bn)*
-ividend paid ($bn)
7.0ividend per share ($c)
0.7Refining & Marketing
6.7Exploration & Production
23.2arnings per share ($c)
4.4eplacement cost profit
(0.5)Other businesses & corporate
4Q10bn

8/3/2019 Bp Fourth Quarter 2010 Results Presentation Slides
http://slidepdf.com/reader/full/bp-fourth-quarter-2010-results-presentation-slides 14/84
14
Gulf of Mexico oil spill costs and provisions
(pre-tax, pre partner recovery)
5.4
23.3
(3.4)
(2.0)
1.0
27.7
1.0
4Q10
10.1
27.7
(7.1)
(3.0)
7.7
30.1
7.7
3Q10
17.72.1• Cash payments
(5.0)– Payments into Trust Fund
(12.7)(2.1)– Other related payments in the period
30.1– Carried forward
40.9
FY10
32.2– Charge/ (credit) to income statement
• Balance sheet *
– Brought forward
32.2– Charge for the period
• Income statement
2Q10bn
* Balance sheet amount includes all provisions, other payables and the reimbursement asset balances related to the Gulf of Mexico oil spill

8/3/2019 Bp Fourth Quarter 2010 Results Presentation Slides
http://slidepdf.com/reader/full/bp-fourth-quarter-2010-results-presentation-slides 15/84
15
Exploration & Production
• Stronger environment
• Lower depreciation
• Loss in gas marketing and trading
• Reported production 9% lower –
adjusting for PSA entitlement
effects and A&D, production 6%
lower
− Higher turnaround activity than
4Q09
− Continued impact of the Gulf of
Mexico drilling moratorium− Absence of 40mboed benefit in
4Q09 from make-up of prior-
period underlift
0
2
4
6
8
10
4Q09 1Q10 2Q10 3Q10 4Q100
10
20
30
40
50
60
Average hydrocarbon realizations ($/boe)
US Non-US TotalTNK-BP
A v e
r a g eh y d r o c a r b onr e a l i z a t i on s ( $ / b
o e )
$
Replacement cost profit before interest and taxAdjusted for non-operating items and fair value accounting effects

8/3/2019 Bp Fourth Quarter 2010 Results Presentation Slides
http://slidepdf.com/reader/full/bp-fourth-quarter-2010-results-presentation-slides 16/84
16
Refining & Marketing
Replacement cost profit before interest and taxAdjusted for non-operating items and fair value accounting effects
(1.0)
(0.5)
0
0.5
1.0
1.5
2.0
4Q09 1Q10 2Q10 3Q10 4Q10
0
2.0
4.0
6.0
8.0
10.0
12.0
US Non-US
Refining indicator margin ($/bbl)
Total
$
R ef i ni n gi n d i c a t or m
a r gi n ( $ / b b l )
• Stronger refining margins
• Strong operational performance in
fuels value chains
• Continued momentum in
international businesses
• Further cost efficiencies
• Loss in supply and trading

8/3/2019 Bp Fourth Quarter 2010 Results Presentation Slides
http://slidepdf.com/reader/full/bp-fourth-quarter-2010-results-presentation-slides 17/84
17
Other businesses & corporate
• Adverse foreign exchange effects
Adjusted for non-operating items and fair value accounting effectsReplacement cost profit before interest and tax
(0.8)
(0.6)
(0.4)
(0.2)
0
0.2
4Q09 1Q10 2Q10 3Q10 4Q10
$

8/3/2019 Bp Fourth Quarter 2010 Results Presentation Slides
http://slidepdf.com/reader/full/bp-fourth-quarter-2010-results-presentation-slides 18/84
18
Sources & uses of cash
• Disposal proceeds of $6.2 billionfor deals closed in 4Q
• Additional $6.2 billion of cash
deposits held at year end for
disposals expected to complete insubsequent periods, which is
reported as short-term debt.
• Cash at 31 December is
$18.6 billionDividends
Dividends
Capex
CapexperationsOperations
Disposals
DisposalsOther Gulfof Mexico
oil spillpayments
Trust Fund
0
5
10
15
20
25
30
35
40
45
Sources Uses Sources Uses
2009 2010
$

8/3/2019 Bp Fourth Quarter 2010 Results Presentation Slides
http://slidepdf.com/reader/full/bp-fourth-quarter-2010-results-presentation-slides 19/84
19
Net debt ratio
Net debt ratio = net debt / (net debt + equity)
Net debt includes the fair value of associated derivative financial instruments used to hedge finance debt
Cash of $6.2bn received as deposits for disposals completing after year-end is reported as short-term debt at 31 December 2010
%
0
10
20
30
40
10 to 20%
20 to 30%
2002 2011003 2004 2005 2006 2007 2008 2009 2010 2012

8/3/2019 Bp Fourth Quarter 2010 Results Presentation Slides
http://slidepdf.com/reader/full/bp-fourth-quarter-2010-results-presentation-slides 20/84
20
2011 guidance
32% - 34%31%ull year effective tax rate***
~ $400m~ $350mB&C: average underlying quarterly charge
Slightly higherSlightly lowerash costs** (year-on-year change)
~ $500m higher$11bnD&A
$5bn$5bnayments into Trust Fund
$13bn$17bnash from disposals*
~ $20bn$18bnrganic capital expenditure
2011 guidance010
* Cash from disposals including deposits of $6.2bn received at year end 2010 relating to disposal transactions expected to complete in
subsequent periods
** Excluding the effects of changes in exchange rates and fuel costs. A full definition of cash costs can be found on bp.com
*** Excluding the impact of the Gulf of Mexico oil spill

8/3/2019 Bp Fourth Quarter 2010 Results Presentation Slides
http://slidepdf.com/reader/full/bp-fourth-quarter-2010-results-presentation-slides 21/84
21
Financial framework
• Increased investment to grow the firm
• Resumption of the quarterly dividend supported by:
−Continued success in the disposal program
− Improving business environment
balanced by:
− The need to retain significant level of financial flexibility
• Financial flexibility provided by:
− Maintenance of a significant cash liquidity buffer
− Reduction in gearing to range of 10% - 20%
• Quarterly dividend level (7 cents/share) reflects:− Continuing obligation to the Trust Fund
− Uncertainties the company still faces
− Intention to grow over time in line with improving circumstances of firm

8/3/2019 Bp Fourth Quarter 2010 Results Presentation Slides
http://slidepdf.com/reader/full/bp-fourth-quarter-2010-results-presentation-slides 22/84
22
Bob DudleyGroup Chief Executive

8/3/2019 Bp Fourth Quarter 2010 Results Presentation Slides
http://slidepdf.com/reader/full/bp-fourth-quarter-2010-results-presentation-slides 23/84
23
Safety track record
Group excluding response contribution
Gulf of Mexico oil spill contribution
API US benchmark
Int. Assoc. of Oil and Gas Producers benchmark
0.0
0.4
0.8
1.2
1.6
2.0
1999 2000 2001 2002 2003 2004 2005 2006 2007 2008 2009 2010
Recordable Injury Frequency (RIF)
Loss of Primary Containment incidents
0
50
100
150
200
1Q 2Q 3Q 4Q 1Q 2Q 3Q 4Q 1Q 2Q 3Q 4Q
2008 2009 2010
Process Safety Related Major Incidents
0
2
4
6
810
12
14
16
2007 2008 2009 2010
Gulf of Mexico oil spill
Note: LOPC definition aligned with API recommended practice

8/3/2019 Bp Fourth Quarter 2010 Results Presentation Slides
http://slidepdf.com/reader/full/bp-fourth-quarter-2010-results-presentation-slides 24/84
24
Putting Safety and Operational Risk
management at the heart of BPResetting the focus on safe, reliable operating activity to achieve long
term value creation
Leadership priorities• Process safety and operating risk reduction
• Embedding BP’s Operating Management System (OMS)
− Consistent and systematic operating rigour
• Competency, capability and safety culture
Rebasing performance management and reward
• Focus on priorities, foundation for long term performance
New Safety and Operational Risk organization (S&OR)• Head of S&OR is member of Executive Team
• Strengthen central standards setting and auditing
• Deployed into the operating line

8/3/2019 Bp Fourth Quarter 2010 Results Presentation Slides
http://slidepdf.com/reader/full/bp-fourth-quarter-2010-results-presentation-slides 25/84
25
Implementing lessons globally
Building on our learnings and sharing them around the world
Internal changes to strengthen BP
• Centralized global wells organization• Broadening areas of expertise
• Enhancing our standards and practices
Advancing technology, standards and equipment in 5 key areas
• Prevention/drilling safety – the highest priority
• Containment – stopping the flow
• Relief wells – plan for rapid well kill
• Spill response – control near the source
• Crisis management – preparation and co-ordination
Engaging with industry to develop new global capability
8/3/2019 Bp Fourth Quarter 2010 Results Presentation Slides
http://slidepdf.com/reader/full/bp-fourth-quarter-2010-results-presentation-slides 26/84
26
Living up to our commitments and
earning back trustGulf Coast Restoration Organization
Economic & environmental impact
• ~$5bn of claims & government payments to date
• Natural Resource Damages Assessment
− Understanding the incident’s effects
− Restoring the environment & use of natural resources
Voluntary funding
Funding includes:
• $500m Gulf of Mexico Research Initiative (GRI)
• Rig Worker Assistance Fund
• Behavioural health
• Tourism and seafood testing & marketing projects

8/3/2019 Bp Fourth Quarter 2010 Results Presentation Slides
http://slidepdf.com/reader/full/bp-fourth-quarter-2010-results-presentation-slides 27/84
27
Gulf of Mexico oil spill
Expected milestonesIndicated dates*
Investigations
• Presidential Commission final report March 2011
• Marine Board investigation final report Spring 2011
• Chemical Safety Board report to be determined
• National Academy of Engineers final report end 2011
Department of Justice inquiry continues
Multi District Litigation trials
• OPA 90** test trials to be determined
• Limitation & Liability trial February 2012
* Dates as expected only
** OPA 90 = Oil Pollution Act of 1990
8/3/2019 Bp Fourth Quarter 2010 Results Presentation Slides
http://slidepdf.com/reader/full/bp-fourth-quarter-2010-results-presentation-slides 28/84
28
Gulf of Mexico oil spill
Financial impacts• $20bn Trust Fund
− Claims by individuals and businesses
−Government claims
− Natural Resource Damages claims
• $41bn charge taken against income
• Partner recovery not included
• Final $1.25bn cash payment to Trust Fund in Q4 2013
8/3/2019 Bp Fourth Quarter 2010 Results Presentation Slides
http://slidepdf.com/reader/full/bp-fourth-quarter-2010-results-presentation-slides 29/84
29
Upstream:Exploration, Developments and Production

8/3/2019 Bp Fourth Quarter 2010 Results Presentation Slides
http://slidepdf.com/reader/full/bp-fourth-quarter-2010-results-presentation-slides 30/84
30
Upstream − agenda
• Focus on value growth
– Risk reduction
– New forms of relationships
– Increased investment in exploration
– Active portfolio management: divestments / acquisitions
– Build technology and capability
• 2010 delivery
• 2011 guidance

8/3/2019 Bp Fourth Quarter 2010 Results Presentation Slides
http://slidepdf.com/reader/full/bp-fourth-quarter-2010-results-presentation-slides 31/84
31
Divestment update
50% of Kirby Heavy Oil JV to Devon
Pakistan to United Energy Group Limited
Devon Gulf of Mexico producing assets to Marubeni
46% interest in Lukarco JV to Lukoil
Venezuela to TNK-BP
Vietnam to TNK-BP
Colombia to Ecopetrol and Talisman
60% stake in Pan American Energy JV
US Permian, Egypt Western Desert, Canada Gas to Apache
Key transactions
Divestment program success
• Total headline proceeds of more than $21bn
• Reserves and non-proved resources of 1.7bn boe and 3.2bn boe, with 0.4bn boe and
1.8bn boe closed in 2010
• Financial impact of ~$1.5bn pre-tax underlying replacement cost profit
Financial impact BP projections at $75/bbl
Proceeds include $1.4bn of deferred payments in 2010 and 2011 for deals closed in 2009
9
19
21
Net
BookValue
Wood
MackenzieValue
Headline
Proceeds

8/3/2019 Bp Fourth Quarter 2010 Results Presentation Slides
http://slidepdf.com/reader/full/bp-fourth-quarter-2010-results-presentation-slides 32/84
32
Net asset value distribution:
Focused portfolio with potential for growth
Source: Wood Mackenzie; Assumptions: Value as of 1/1/11; 10% nominal discount rate; $80/barrel / $6/mcf Disposed assets valued at headline proceeds; Brazil value shown as purchase price
TNK-BP and Gulf of Mexico not shown
Divested portfolio
Asia
Pacific
AlaskaAngolaNorth
America
Gas
AzerbaijanNorth
Sea
PakistanVenezuelaVietnamCanada
Oil
Sands
ColombiaUS
(Permian)
BrazilCanada
Gas
Middle
East
North
Africa
PAETrinidad

8/3/2019 Bp Fourth Quarter 2010 Results Presentation Slides
http://slidepdf.com/reader/full/bp-fourth-quarter-2010-results-presentation-slides 33/84
33
Resources to reserves to production
50.2 bn boe
End 2010
18.1 bn boe
1.4 bn boe
Total resources:
production 48 years
End 2009
18.3 bn boe
1.5 bn boe
Total resources:
production 43 years
Non-proved resources
Proved reserves
Production
Discovered
resource access
Field extensions and improved
recovery
45.3 bn boe
Prospect
inventory
Exploration
discoveries
Exploration and Access
Impact of
2010 disposals
(1.8) bn boe
(0.4) bn boe
Resources and reserves on a combined basis of subsidiaries and equity-accounted entities
End 2010 includes impact of acquisitions and divestments completed in 2010

8/3/2019 Bp Fourth Quarter 2010 Results Presentation Slides
http://slidepdf.com/reader/full/bp-fourth-quarter-2010-results-presentation-slides 34/84
34
Resource and reserve distribution
TNK-BP
Trinidad
North America Onshore
Non-proved: 50.2 bn boe
Proved: 18.1 bn boe
North Africa, Middle East,Caspian
North Sea
Gulf of Mexico
South America
2010 resource base 2010 reserves additions %
13 years
35 years
Conventional oil
Deepwater oil
Water-flood viscousand heavy oil
LNG gas
Conventional gas
Unconventional gas
Reserves and resources at end-2010 on a combined basis of subsidiaries and equity-accounted entities

8/3/2019 Bp Fourth Quarter 2010 Results Presentation Slides
http://slidepdf.com/reader/full/bp-fourth-quarter-2010-results-presentation-slides 35/84
35
Recent access
Canada
Terre de Grace 750km2
Brazil
10 blocks, 1 producing field,
3 discoveries, 6 exploration areas
Indonesia
Papua province
Awarded ~5,000km2 block
US shale gas
Eagle Ford
38,000 acres
North Sea
Valhall deepening
UKCS 26 th licensing round
China
South China Sea
Farmed in to 2 blocks
Azerbaijan
PSA for 1100km2 Shafag-Asiman block
US Gulf of Mexico
OCS lease sale 213
18 leases awarded
218 leases acquired
from Devon
Jordan
Risha concession
Govt endorsed entry into
~7,000km2 block
Russian Arctic
South Kara Sea
Strategic alliance with Rosneft
Australia
Ceduna basin4 blocks ~ 25,000km2 Angola
Kwanza/Benguela basins
4 blocks
Angola, Brazil and one block in South China Sea subject to government approval

8/3/2019 Bp Fourth Quarter 2010 Results Presentation Slides
http://slidepdf.com/reader/full/bp-fourth-quarter-2010-results-presentation-slides 36/84
36
Project Final Investment Decisions
• Final Investment Decisions made
on 15 projects
• ~$20bn of total BP net investment
– 8 projects over $1bn BP net
– Gulf of Mexico, Egypt and
North Sea $4-5bn BP net each
• ~2bn boe of BP net resourcesunder development
new additionAngolaCLOV
2012 FIDTNK-BPSuzun
TNK-BPUvat East Expansion
TNK-BPVerkhnechonskoye FFD Ph1
2011 FIDNorth AfricaIn Salah Southern Fields
CanadaSunriseAzerbaijanChirag Oil
North SeaKinnoull
North SeaDevenick
North SeaClair Ridge
North SeaWoS Q204
EgyptWest Nile Delta Gasunder reviewGulf of MexicoHorn Mountain Phase 2
Gulf of MexicoNa Kika Phase 3
Gulf of MexicoGalapagos
Gulf of MexicoAtlantis Phase 2
Gulf of MexicoMars B
Gulf of MexicoTubular Bells
FFD - Full field development

8/3/2019 Bp Fourth Quarter 2010 Results Presentation Slides
http://slidepdf.com/reader/full/bp-fourth-quarter-2010-results-presentation-slides 37/84
37
2011 increased turnaround activity
• ~ 50% increase in turnaround activity
• Major investment programs to manage
safety and operational risk
• Short-term production impact with
long-term reliability benefit
2011 BP projection
Number of turnarounds
2011010009
51
3534

8/3/2019 Bp Fourth Quarter 2010 Results Presentation Slides
http://slidepdf.com/reader/full/bp-fourth-quarter-2010-results-presentation-slides 38/84
38
Deepwater: Gulf of Mexico
• Resource base remains unchanged
• Industry-wide production reduced in 2010
• 2011 focus on safely bringing back rig
activity
• Our restart criteria will cover:
− Regulatory requirements
− Activity and pace
− Capability
− Contractor management
• 2011-2012 production impact dependent
on restart timing
2013012011
Thunder Horse (1)
Thunder Horse (2)
Atlantis (1)
Atlantis (2)
Exploration / Appraisal
Resumption of rig activities including plugging andabandonment is subject to regulatory approval
Range of uncertainty
Source: BP projection, BOEMRE, Wood Mackenzie
0.0
0.5
1.0
1.5
2.0
2.5
3.0
2006 2007 2008 2009 2010 2011
Gulf of Mexico regionBP
Production, mmboed

8/3/2019 Bp Fourth Quarter 2010 Results Presentation Slides
http://slidepdf.com/reader/full/bp-fourth-quarter-2010-results-presentation-slides 39/84
39
Production 2006−2011
• 2011 year of consolidation
• Increased turnaround activity and
planned losses
• Key drivers of uncertainty:
– Gulf of Mexico restart
– Divestment timing
– Oil price and PSA effects
– OPEC quota restrictions
1.0
1.5
2.0
2.5
3.0
3.5
4.0
4.5
2006 2007 2008 2009 2010 2011
Production, mmboed
2011 BP projection at $75/bbl
DivestmentsReported

8/3/2019 Bp Fourth Quarter 2010 Results Presentation Slides
http://slidepdf.com/reader/full/bp-fourth-quarter-2010-results-presentation-slides 40/84
40
Capital investment 2006-2011
Increasing investment in line with
priorities:
• Safety and operational risk activity,
including an increased number ofturnarounds
• Increased exploration spend
• Resumption of activity in Gulf of
Mexico
• Major Projects progression,
particularly in Angola, North Sea and
Egypt
• Iraq ramp up of activity
Organic capital expenditure, $bn
Organic capital expenditure above excludes the following acquisition impacts: 2006 – Rosneft; 2007 – asset exchanges with Occidental; 2008 – Accounting for our transactions with Husky and Chesapeake; 2009 – BG asset swap and Eagle Ford; 2010 – Completed acquisitions from Devon, accounting for our transaction with Value Creation Inc.,
and for the purchase of additional interests in the Valhall and Hod fields 2011 – BP projections
0
5
10
15
20
2006 2007 2008 2009 2010 2011
Developments:
Global Projects
Organisation
Production
Developments:
Global Wells
Organisation
Exploration
TNK-BP
BP
Pan American Energy

8/3/2019 Bp Fourth Quarter 2010 Results Presentation Slides
http://slidepdf.com/reader/full/bp-fourth-quarter-2010-results-presentation-slides 41/84
41
Long term value growth
Portfolio
choice
Capturing valueacross life cycle
Enduring presencein key basins
Deepwater Gas Giant fields
Exploration Developments Production
Relationships Basin knowledge Technology
V l h i h lif l f b i

8/3/2019 Bp Fourth Quarter 2010 Results Presentation Slides
http://slidepdf.com/reader/full/bp-fourth-quarter-2010-results-presentation-slides 42/84
42
Value growth in the life cycle of a basin:Azerbaijan example
FFD - Full Field Development SCP – South Caucasus Pipeline
BTC – Baku-Tbilisi-CeyhanResources are indicative Source: BP internal
Explore Develop Produce
Value creation
Resources
Proven
Chirag
Azeri / BTC
Shah Deniz / SCP
Shafag-Asiman
Shah Deniz FFD
1990 1995 2000 2005 2010 2015 2020 2025 2030

8/3/2019 Bp Fourth Quarter 2010 Results Presentation Slides
http://slidepdf.com/reader/full/bp-fourth-quarter-2010-results-presentation-slides 43/84
43
Increasing investment in exploration
N
dsoee
voum
Post-merger
drill-out Portfolio rebuild The future
N
ae
e
voum
2001 2005 2010 2015002 2003 2004 2006 2007 2008 2009 2011 2012 2013 2014
Source: BP internal
Exploration accessDirect resource access

8/3/2019 Bp Fourth Quarter 2010 Results Presentation Slides
http://slidepdf.com/reader/full/bp-fourth-quarter-2010-results-presentation-slides 44/84
44
Future exploration focus
Azerbaijan
Existing positions
New / untested positions
Jordan
Angola
Australia
SouthChina Sea
Gulf ofMexico
Brazil
Canadian Arctic Russian Arctic
Indonesia
Libya
Egypt

8/3/2019 Bp Fourth Quarter 2010 Results Presentation Slides
http://slidepdf.com/reader/full/bp-fourth-quarter-2010-results-presentation-slides 45/84

8/3/2019 Bp Fourth Quarter 2010 Results Presentation Slides
http://slidepdf.com/reader/full/bp-fourth-quarter-2010-results-presentation-slides 46/84
46
Developments: deepwater projects
Angola
• Block 31 PSVM
• Clochas-Mavacola
• CLOV
• Pazflor
• Block 18 West
• Kizomba Satellites Phase 2
• Block 31 SE
Gulf of Mexico
• Atlantis Phase 2
• Galapagos
• Mars B
• Na Kika Phase 3
• Tubular Bells
• Freedom
• Mad Dog Phase 2
• Atlantis Phase 3
• Kaskida
• Mad Dog North
• Na Kika Phase 4
• Tiber
Brazil
• Itaipu
• Wahoo

8/3/2019 Bp Fourth Quarter 2010 Results Presentation Slides
http://slidepdf.com/reader/full/bp-fourth-quarter-2010-results-presentation-slides 47/84
47
Developments: gas projects
Azerbaijan
Shah Deniz Full Field Development
Egypt
West Nile Delta
Asia Pacific
Tangguh expansion
Oman
Khazzan-Makarem Full Field Development

8/3/2019 Bp Fourth Quarter 2010 Results Presentation Slides
http://slidepdf.com/reader/full/bp-fourth-quarter-2010-results-presentation-slides 48/84
48
Developments: new start-ups
* BP operated
Alaska
Liberty *
2011 start-ups
2012 start-ups
2013-2016 start-ups
Canada
Sunrise
Gulf of Mexico
Galapagos *
Na Kika Phase 3 *
Tubular Bells
Mars B
Mad Dog Phase 2 *
Freedom
Trinidad & Tobago
Serrette *
Juniper *Angola
B31 PSVM *
Pazflor
Angola LNG
Clochas-Mavacola
Kizomba Satellites Phase 2
B18 West *CLOV
Asia Pacific
North Rankin 2
Azerbaijan
Chirag Oil *
North Sea
Skarv *
Devenick *
Kinnoull *
WoS Q204 *Clair Ridge *
Egypt
WND Gas *lgeria
In Salah Southern Fields
In Amenas Compression
Russia (TNK-BP)
Verkhnechonskoye FFD
Suzun
Uvat Central Expansion
Russkoye
Middle East
Oman FFD *
FFD - Full Field Development 2016 production from 2011-2016 new project start-ups at $75/bbl
2016
~1000
mboed

8/3/2019 Bp Fourth Quarter 2010 Results Presentation Slides
http://slidepdf.com/reader/full/bp-fourth-quarter-2010-results-presentation-slides 49/84
49
2013+011-2012
Production: Iraq
• Cost recovery starts
• Rehabilitation; inspection,
maintenance, commence FEED• Water, gas, power, export
solutions
• Set up the business
• Achieved Improved
Production Target (IPT)
2010
• Brownfield project underway
• Deliver plateau target end
2015
Activity ramp up after Rumaila Operating Organization
established on 1 July 2010
2010 2011
Company positions in Iraq 1Q 2010
1 st Round
2 nd Round
Basra
IRAN
IRAQ
KUWAIT
GHARAF
WEST QURNA 2
WEST QURNA 1
RUMAILA
MAJNOON
HALFAYAH
ZUBAIR
BADRA
BP projections
# of jobs
J F M A M J J A S O N D 1Q 2Q 3Q 4Q
Surveillance and Facilities
Wellwork
Drilling
BP has a unique growth-oriented position

8/3/2019 Bp Fourth Quarter 2010 Results Presentation Slides
http://slidepdf.com/reader/full/bp-fourth-quarter-2010-results-presentation-slides 50/84
50
2010 production, mmboed
RG
pom
9.0
8.5
3.0
2.5
2.0
1.5
1.0
0.5
0.0
C
oT
a
MH
Mts
s
MtsC
O
OXOM
SnE
O
W
inesS
TN
B
LU
BP
BP has a unique growth oriented positionin Russia
Source: Wood Mackenzie / BP internal
BP
TNK BP

8/3/2019 Bp Fourth Quarter 2010 Results Presentation Slides
http://slidepdf.com/reader/full/bp-fourth-quarter-2010-results-presentation-slides 51/84
51
TNK-BP
Core production areas
Project areas
Uvat
Yamal projects
Verkhnechonskoye
Nyagan
Samotlor
Orenburg
RospanRusskoye
Suzun
Novosibirsk
Tagul
Kamennoye
Moscow
BP is forming a global strategic alliance
8/3/2019 Bp Fourth Quarter 2010 Results Presentation Slides
http://slidepdf.com/reader/full/bp-fourth-quarter-2010-results-presentation-slides 52/84
52
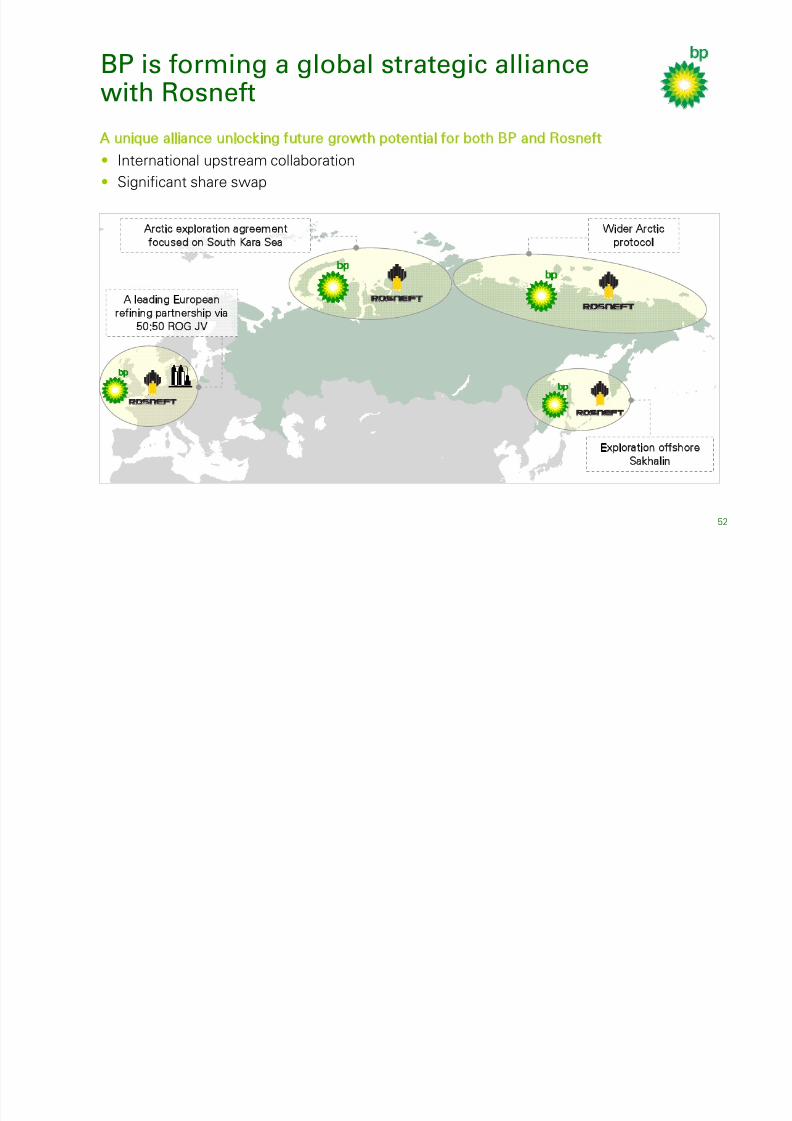
BP is forming a global strategic alliancewith Rosneft
A unique alliance unlocking future growth potential for both BP and Rosneft
• International upstream collaboration
• Significant share swap
Arctic exploration agreement
focused on South Kara Sea
Wider Arctic
protocol
Exploration offshore
Sakhalin
A leading Europeanrefining partnership via
50:50 ROG JV
Leveraging technology to reduce risk and

8/3/2019 Bp Fourth Quarter 2010 Results Presentation Slides
http://slidepdf.com/reader/full/bp-fourth-quarter-2010-results-presentation-slides 53/84
53
Leveraging technology to reduce risk andunderpin long term reliability and value
FieldoftheFuture ®
Unconventional Oil
Unconventional Gas
Advanced Seismic
Pushing Reservoir Limits
Gulf of Mexico Paleogene
Beyond Sand Control
Inherently Reliable Facilities
Subsea Well Intervention
Effective Reservoir Access
Technologies for UO
resource progression
Globalize unconventional
gas development through
technology
High quality and efficient
reservoir imaging
Growing recovery
factors across portfolio
Developing equipment
and techniques for
reservoir conditions
Real-time downhole
sand monitoring,
diagnostics and control
Managing and reducing
integrity risk
Digital tools for managing
operational integrity threats
Real time life-of-well integrity
monitoring
New and reliable equipment for
deepwater subsea systems
Safe wells informed by real-time data
Deepwater Facilities
U t l th

8/3/2019 Bp Fourth Quarter 2010 Results Presentation Slides
http://slidepdf.com/reader/full/bp-fourth-quarter-2010-results-presentation-slides 54/84
54
Upstream value growth
• 2010
− Gulf of Mexico incident
− Strategic and operational progress
• 2011 – year of consolidation:
− Increased turnaround activity
− Uncertainty on Gulf of Mexico timing
−Increasing investment for growth
• Long-term value growth
− Portfolio focus – deepwater, gas, giant fields
− Enduring positions in best basins – relationships, resource knowledge and
technology
− Functional excellence across lifecycle: exploration, developments, production
− Strong projects contribution – growing from a smaller base

8/3/2019 Bp Fourth Quarter 2010 Results Presentation Slides
http://slidepdf.com/reader/full/bp-fourth-quarter-2010-results-presentation-slides 55/84
55
Iain ConnChief Executive, Refining & Marketing
Refining & Marketing agenda

8/3/2019 Bp Fourth Quarter 2010 Results Presentation Slides
http://slidepdf.com/reader/full/bp-fourth-quarter-2010-results-presentation-slides 56/84
56
Refining & Marketing − agenda
• R&M turnaround and 2010 performance
• Strategy and portfolio
• Outlook and what you can expect
Refining & Marketing turnaround

8/3/2019 Bp Fourth Quarter 2010 Results Presentation Slides
http://slidepdf.com/reader/full/bp-fourth-quarter-2010-results-presentation-slides 57/84
57
g gThe five priorities
• Safe operations and OMS(1)
• Behaviours and core processes
• Restoring missing revenues and
earnings momentum
• Business simplification
• Repositioning cost efficiency
(1) Operating Management System
Delivering competitive performance

8/3/2019 Bp Fourth Quarter 2010 Results Presentation Slides
http://slidepdf.com/reader/full/bp-fourth-quarter-2010-results-presentation-slides 58/84
58
0
1
2
3
4
5
6
2003 2004 2005 2006 2007 2008 2009 2010
0
5
10
15
20
25
30
2003 2004 2005 2006 2007 2008 2009 2010
Delivering competitive performance
Underlying net income $/bbl(3)
Rolling 4-quarter data
Underlying ROACE % (post tax)(1)
(1) BP and competitor return on average capital employed data adjusted to comparable basis
(2) Competitor set comprises R&M segments of Super Majors (3) Capacity as stated in F&OI / company disclosures (4) 2010 competitor data are 3Q YTD plus average broker estimates for 4Q. 2010 competitor capital employed are last reported 2009 data.
Competitor range(2)Competitor average(2) BP R&MBP R&M
Performance momentum 2007–2010

8/3/2019 Bp Fourth Quarter 2010 Results Presentation Slides
http://slidepdf.com/reader/full/bp-fourth-quarter-2010-results-presentation-slides 59/84
59
Performance momentum 2007–2010
GIM$/bbl
9.9 6.5 4.0
Environment adjusted for refining margins, petrochemical margins, forex and energy costs
4.4
Environ’t Performance
improvement
3.9
2007
3.3
2008
Peta
u
yn
R
pot$
2.7
(3.3)
2.1(1.8)
3.6
2009Performance
improvement
BsGo ncoMagnGM)
Environ’t
0.9
4.9
2010Environ’t Performance
improvement
0.4
Our portfolio and performance 2007–2010

8/3/2019 Bp Fourth Quarter 2010 Results Presentation Slides
http://slidepdf.com/reader/full/bp-fourth-quarter-2010-results-presentation-slides 60/84
60
Our portfolio and performance 2007 2010
International Businesses
Fuels Value Chains
2010 average operatingcapital employed (pre tax) $bn
24
9
14
Total Refining & Marketing
Refining
Lubricants
Global Fuels
Petrochemicals
Fuels Marketing
and Supply
Convenience
Pre-tax underlying RCprofit $bn
2009
(1.6)
2.1
3.1
3.6
2008
2.0
(0.7)
2.0
3.3
2007
1.2
1.2
1.5
3.9
Relative areas in pie charts based on average operating capital employed (pre tax)
2010
0.3
2.9
1.7
4.9
2010 performance delivery

8/3/2019 Bp Fourth Quarter 2010 Results Presentation Slides
http://slidepdf.com/reader/full/bp-fourth-quarter-2010-results-presentation-slides 61/84
61
2010 performance delivery
Simplification
Restoring revenues &earnings momentum
2009 2010 2011 2012007
>$1.5bn
>$0.5bn
Up to$0.5bn
Repositioning cost
efficiency
Values based on underlying pre-tax RCP pa at 2009 conditions
$0.6bn
$1.4bn
$2.8bn
$4.8bn > $2bn0.9bn
Repositioningcost efficiency
Portfolio quality &integration
Growing margin share
Improving efficiencyR fi i
8/3/2019 Bp Fourth Quarter 2010 Results Presentation Slides
http://slidepdf.com/reader/full/bp-fourth-quarter-2010-results-presentation-slides 62/84
62
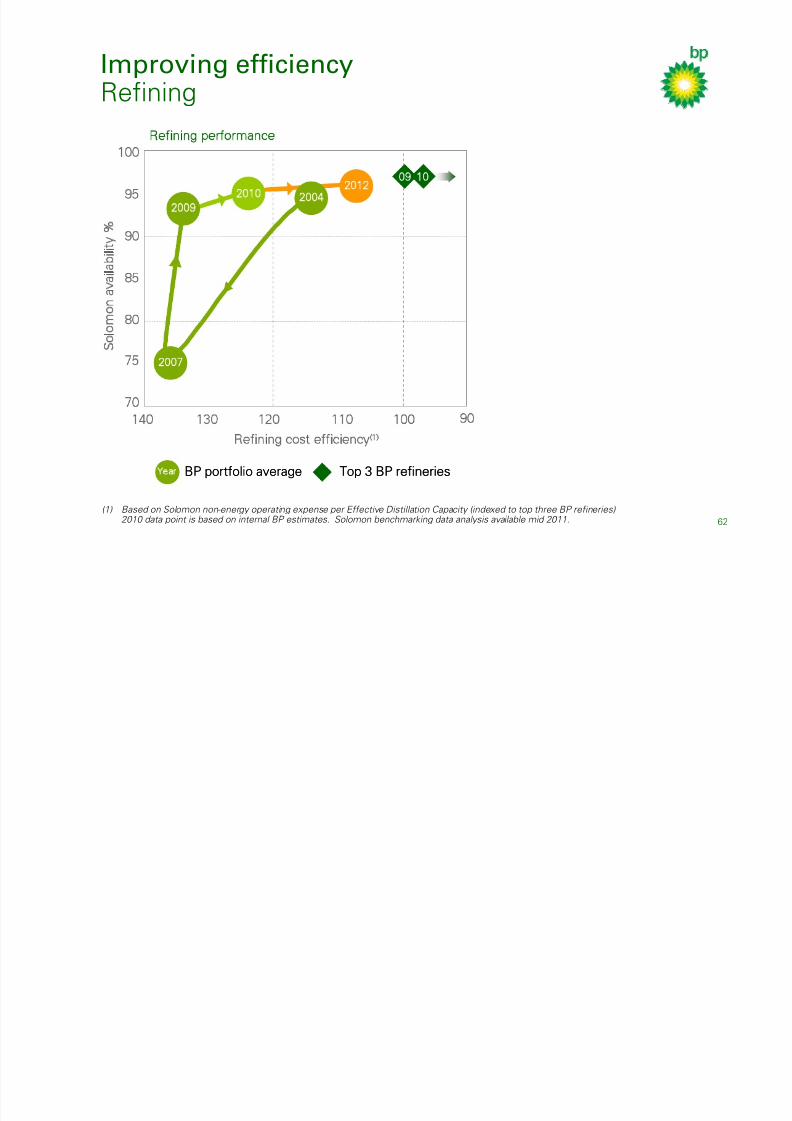
Refining
Year BP portfolio averageear BP portfolio average Top 3 BP refineriesTop 3 BP refineries
S
om
a
abty%
70
75
80
85
90
95
100
Refining cost efficiency(1)
2012
2007
2009
140 120 10030 110
2004
Refining performance
90
2010
09 10
(1) Based on Solomon non-energy operating expense per Effective Distillation Capacity (indexed to top three BP refineries)2010 data point is based on internal BP estimates. Solomon benchmarking data analysis available mid 2011.
Repositioning cost efficiency

8/3/2019 Bp Fourth Quarter 2010 Results Presentation Slides
http://slidepdf.com/reader/full/bp-fourth-quarter-2010-results-presentation-slides 63/84
Repositioning cost efficiency
(1) Corrected for major historic divestments (2) Refinery turnaround costs (3) Variable costs associated with petrochemicals and refining operations
Adjusted for
energy & forex(1) Normalized for energy, forex,
TAR(2) & manufacturing
variable costs(3)
BP Refining & Marketing cash cost index
TAR costs(2)
50
60
70
80
90
100
110
120
130
2004 2005 2006 2007 2008 2009 2010
63
Refining Marker Margin 1990–2010

8/3/2019 Bp Fourth Quarter 2010 Results Presentation Slides
http://slidepdf.com/reader/full/bp-fourth-quarter-2010-results-presentation-slides 64/84
64
Refining Marker Margin 1990 2010
$b
0
2
4
6
8
10
12
14
16
18
20
1 1 1 1 1 1 1 1 1 1 2 2 2 2 2 2 2 2 2 2 2
Refining Marker Margin adjusted to 2010 $
2010 performance progression

8/3/2019 Bp Fourth Quarter 2010 Results Presentation Slides
http://slidepdf.com/reader/full/bp-fourth-quarter-2010-results-presentation-slides 65/84
65
p p g
2010
20092008
2007
20062005
2004
0
1
2
3
4
5
6
7
8
9
10
0 4 8 12 16 20
BP's Refin ing Marker Ma rg in (RMM) $/ bb l
P
re-tax undery
ing RC proft$/bbl
$0.9bn delivered
in 2010
~$5bn recovery2007>2009
>$2bn earningsgrowth by 2012
Net investment

8/3/2019 Bp Fourth Quarter 2010 Results Presentation Slides
http://slidepdf.com/reader/full/bp-fourth-quarter-2010-results-presentation-slides 66/84
66
$Total net investment
Organic capex
Depreciation
(7)
(6)
(1)
0
1
2
3
4
5
2005(1) 2006 2007 2008 2009 2010 2011(2)
(1) Includes $8.3bn proceeds for Innovene sale (2) 2011 BP projections
Portfolio performance 2008–2010Fuels Value Chains & International Businesses progression

8/3/2019 Bp Fourth Quarter 2010 Results Presentation Slides
http://slidepdf.com/reader/full/bp-fourth-quarter-2010-results-presentation-slides 67/84
67
Fuels Value Chains & International Businesses progression
Pre-tax returns - %(1)
(2)
(1)
1
2
3
4
(10)% 10% 20% 30% 40%
US FVC2008
US FVC(2)
2010
EH FVC(3)
2008
EH FVC2010
IBs2008
IBs(4)
2010
P r e - t a x u n d e r l y i n g
R C
p r o f i t $ b
n
$10bn Size of bubble = Average operating capital employed (1) Returns are based on Pre-tax average operating capital employed
(2) US Fuels Value Chains (3) Eastern Hemisphere Fuels Value Chains (4) International Businesses
Strategy and portfolio
8/3/2019 Bp Fourth Quarter 2010 Results Presentation Slides
http://slidepdf.com/reader/full/bp-fourth-quarter-2010-results-presentation-slides 68/84
68
Reposition US Fuels Value Chains and halve US refining capacity
• Divest Texas City refinery(1)
• Divest Southern West Coast Fuels Value Chain(1)
• Transform Whiting refinery capability
• Improve Cherry Point and Toledo refineries
• Focused marketing and logistics footprint
Growth in high quality International Businesses
• Lubricants volume / earnings growth and margin mix
• Petrochemicals expansion in Asia
• Air BP growth
Improve Eastern Hemisphere Fuels Value Chains and access market growth
• Rotterdam hydrocracker option• Gelsenkirchen yield improvement option
• Focused marketing and logistics footprint
• Marketing margin growth
1
2
3
(1) Subject to legal and regulatory approval
Divest Texas City refinery

8/3/2019 Bp Fourth Quarter 2010 Results Presentation Slides
http://slidepdf.com/reader/full/bp-fourth-quarter-2010-results-presentation-slides 69/84
69
• 3rd largest US refinery, highly complex(1)
• Significant improvement in safety and operations
• $2.5bn p.a. improvement in profit(2)
• Plan to complete before end 2012(3)
• BP’s obligations will be fulfilled
0
100
200
300
400
500
600
Relative Equivalent Distillation capacity (kd/d)
Cu
D
s
ao
U
tc
tyk
d
(1) Source: Oil and Gas Journal 2010 (2) Environment adjusted pre-tax underlying RC profit (3) Subject to legal and regulatory approval
Divest Southern West Coast FuelsValue Chain

8/3/2019 Bp Fourth Quarter 2010 Results Presentation Slides
http://slidepdf.com/reader/full/bp-fourth-quarter-2010-results-presentation-slides 70/84
70
Value Chain
Retain Northern Fuels Value Chain
• High quality modern refinery
• Feedstock flexibility and location• Diesel/ Jet yield focus
• Good integrated margins and relative
returns
Divest Southern Fuels Value Chain
• High quality refinery, high market share
• Limited feedstock flexibility
• Gasoline yield focus
• Will require investment to reposition
Seattle
Portland
Sacramento
Stockton
Vinvale
Carson
San Diego
E. Hynes Colton
Pipelines
BP refinery
BP terminal
Cherry Point refinery
LosAngeles
SanFrancisco
Seattle
Portland
Sacramento
Stockton
Vinvale
Carson
Colton
LosAngeles
SanFrancisco
Carson Refinery
Richmond
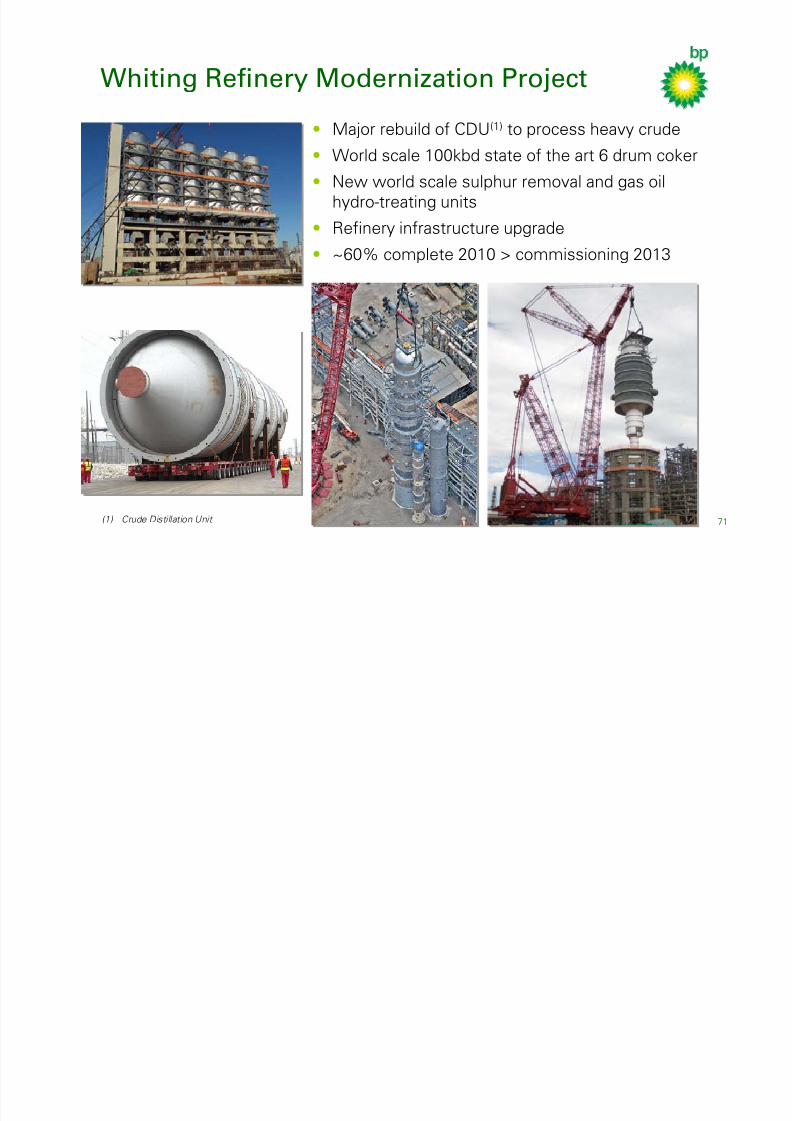
Whiting Refinery Modernization Project
8/3/2019 Bp Fourth Quarter 2010 Results Presentation Slides
http://slidepdf.com/reader/full/bp-fourth-quarter-2010-results-presentation-slides 71/84
71
• Major rebuild of CDU(1) to process heavy crude
• World scale 100kbd state of the art 6 drum coker
• New world scale sulphur removal and gas oil
hydro-treating units
• Refinery infrastructure upgrade
• ~60% complete 2010 > commissioning 2013
(1) Crude Distillation Unit
Whiting Refinery Modernization ProjectSources of value

8/3/2019 Bp Fourth Quarter 2010 Results Presentation Slides
http://slidepdf.com/reader/full/bp-fourth-quarter-2010-results-presentation-slides 72/84
72
Sources of value
Regression line established from rolling 4Q average 1Q’02–1Q’07
Based off nameplate capacity as stated in F&OI = maximum sustainable rate for a 30 day period
In
e
peta
u
yn
R
pot
$b o
cp
ty
Mid West Refining Marker Margin $/bbl
0
100
200
300
400
500
600
0 2 4 6 8 10 12
Mid West historicalperformance range
Mid West post project
performance for a range
of WTI – Lloydminsterdifferentials
On-stream performance at end 2010 refining environment
Repositioned US Fuels Value Chains

8/3/2019 Bp Fourth Quarter 2010 Results Presentation Slides
http://slidepdf.com/reader/full/bp-fourth-quarter-2010-results-presentation-slides 73/84
73
Canadian
Crude
ANS
Crude
Gulf Coast
Crude
ANS crude adv
+$ 1-2/bbl
Cush ing
Edmonton
Hard is ty
ANS
Crude
ANS
Crude
Gulf Coast
Crude
Gulf Coast
Crude
ANS crude adv
+$ 1-2/bbl
Canadian
crude adv
+$3
Canadian
crude adv
+$3-4/bbl-4/bbl
Canadian
Crude
Cher ry Po in t
To ledo
Whi t ing
Cher ry Po in t
Whi t ingTo ledo
Canadian
Crude
ANS
Crude
ANS
Crude
Gulf Coast
Crude
Gulf Coast
Crude
ANS crude adv
+$ 1-2/bbl
Cush ing
Edmonton
Hard is ty
ANS
Crude
ANS
Crude
Gulf Coast
Crude
Gulf Coast
Crude
ANS crude adv
+$ 1-2/bbl
Canadian
crude adv
+$3
Canadian
crude adv
+$3-4/bbl-4/bbl
Canadian
Crude
Cher ry Po in t
To ledo
Whi t ing
Cher ry Po in t
Whi t ingTo ledo
TradedProductSupply
• US refining capacity halved
• Repositioned configurations
• Advantaged feedstock and flexibility
• Increased diesel manufacturing capability
• Access to advantaged logistics
• Integrated with marketing
Improve Eastern Hemisphere Fuels ValueChains, access market growth

8/3/2019 Bp Fourth Quarter 2010 Results Presentation Slides
http://slidepdf.com/reader/full/bp-fourth-quarter-2010-results-presentation-slides 74/84
74
Chains, access market growth
Margin growth options
• Rotterdamhydrocracker
• Gelsenkirchen yield
improvement
BP owned refinery
Joint BP owned refinery
Market growth
• Fuels: China, Australasia,
Turkey, South Africa,
Poland, Iberia
• Convenience: Rhine,
Poland, Australasia, UK
Impact of portfolio choices – refining

8/3/2019 Bp Fourth Quarter 2010 Results Presentation Slides
http://slidepdf.com/reader/full/bp-fourth-quarter-2010-results-presentation-slides 75/84
75Source: Oil & Gas Journal 2010 Size represents absolute scale of refining portfolio
Nelson complexity
100
150
200
250
7 8 9 10 11
Aeagre
n
yszekb
Global refining quality
Current
Post 2013
Divested
00>12
Alliance Mombasa
Coryton Reichstett
Grangemouth Salt Lake
Lavera Singapore
Mandan Yorktown
BP divestments ’00-’10
BP divestment plans ’11-’12
Texas City
Carson
Lubricants – high returns, high growth

8/3/2019 Bp Fourth Quarter 2010 Results Presentation Slides
http://slidepdf.com/reader/full/bp-fourth-quarter-2010-results-presentation-slides 76/84
76
Profit growth(3)
2010
ROW
BRICs
OECD
Return on sales(1)
2007
Top Quartile Midpoint(2)
Consumer Sector Companies
Median(2)
Consumer Sector Companies
2007 2008 2009 2010
(1) Pre tax basis. 2010 based on 3Q YTD (2) Based on average 2007-09 performance of 2,500+ consumer sector
companies (3) Pre-tax underlying RC profit - inland lubricants excluding aviation and
marine lubricants (4) BP estimates based on available industry data and internal analysis.
Expressed as a percentage of total automotive engine lubricants sales.
Synthetic/premium lubricants sales(4)
0%
25%
50%
Market BP
Petrochemicals – high quality, Asia growth

8/3/2019 Bp Fourth Quarter 2010 Results Presentation Slides
http://slidepdf.com/reader/full/bp-fourth-quarter-2010-results-presentation-slides 77/84
77
KEY
PTA sites
Acetyls sites
PX sites
O&D
PTA growth
• East China
• Zhuhai 2 DB
• Zhuhai 3
• India
• Taiwan• Indonesia
SECCO growth
Acetyls growth
• Middle East
• India
• China
PET co-location
• Decatur
• Geel
• Zhuhai
Return on sales(1)
2005 2006 2007 2008 2009 2010004
Competitor range
BP
Competitor
average
2004 2010
Profit growth(2)
Asia
US &Europe
Production MTes
Asia
US &Europe
0
4
8
12
16
2004 2010
(1) Post tax adjusted to comparable basis. 2010 based on 3Q YTD (2) Pre-tax underlying RC profit
Portfolio performance outlook

8/3/2019 Bp Fourth Quarter 2010 Results Presentation Slides
http://slidepdf.com/reader/full/bp-fourth-quarter-2010-results-presentation-slides 78/84
78
Pre-tax returns - %(1)
(2)
(1)
1
4
(10)% 10% 20% 30% 40%
P
r e - t a x u n d e r l y i n g
R C
p r o f i t $ b n
3
2
I n t e r n a t
i o n a l
B u s i n
e s s e
s 2 0 1 3 +
E a s t e r n
H e m i s p
h e r e
F V C
( 2 )
2 0 1
3 +
U S F V
C ( 2 ) 2
0 1 3 +
(1) Returns are based on pre-tax average operating capital employed (2) Fuels Value Chains
Refining & Marketing growth and returns

8/3/2019 Bp Fourth Quarter 2010 Results Presentation Slides
http://slidepdf.com/reader/full/bp-fourth-quarter-2010-results-presentation-slides 79/84
79
Returns based on pre-tax averageoperating capital employed
Actual pre-tax underlyingRC profit $bn
Pre-tax underlying RC profit $bnin 2009 refining environment
(1) Compound Annual Growth Rate
0
1
2
3
4
5
6
7
8
9
10
11
12
2007 2008 2009 2010 2011 2012 2013+
P r e - t a x u n d
e r l y i n g R C p
r o
f i t ( $ b n )
0%
2%
4%
6%
8%
10%
12%
14%
16%
18%
P r e- t axR e t ur n s ( % )
(1)
(2)
Differential Growth
15-20% CAGR
SustainableGrowth and
AttractiveReturns
CompetitiveRecovery
>50% CAGR(1)
Refining & MarketingSummary and what to expect

8/3/2019 Bp Fourth Quarter 2010 Results Presentation Slides
http://slidepdf.com/reader/full/bp-fourth-quarter-2010-results-presentation-slides 80/84
80
• Safe and reliable operations remains #1 priority
• On track to deliver >$2bn pa of pre-tax underlying RC profit
improvement by 2012
− Costs: efficiency improved, returning to 2004 levels
− Refining: achieved break-even in similar environment to 2009
• Portfolio: focus on quality and integration in advantaged locations
− Reposition US Fuels Value Chains: halve refining; focus on
margin capability, integration
− Improve and grow Eastern Hemisphere Fuels Value Chains:
improve margin capability; access growth
−Growth in quality International Businesses
• Sustainable long term growth and attractive returns

8/3/2019 Bp Fourth Quarter 2010 Results Presentation Slides
http://slidepdf.com/reader/full/bp-fourth-quarter-2010-results-presentation-slides 81/84
81
Bob DudleyGroup Chief Executive
Alternative Energy

8/3/2019 Bp Fourth Quarter 2010 Results Presentation Slides
http://slidepdf.com/reader/full/bp-fourth-quarter-2010-results-presentation-slides 82/84
82
Goshen wind farm, Idaho, USA
• Alternative Energy is the fastest growing energy sector
• BP continues to invest: focus on biofuels and wind
Source: BP Energy Outlook 2030
Shares of world primary energy
0%
10%
20%
30%
40%
50%
1970 1990 2010 2030
Oil
Coal
Gas
Hydro
NuclearRenewables
Sugar cane harvesting in Brazil
Goshen wind farm, Idaho, USA
Moving BP forward

8/3/2019 Bp Fourth Quarter 2010 Results Presentation Slides
http://slidepdf.com/reader/full/bp-fourth-quarter-2010-results-presentation-slides 83/84
83
Putting Safety & Operational Risk management at the heart of the company
Re-building trust
Value growth
• Dividend resumed− Quarterly dividend level of 7 cents/share
− Intention to grow over time in line with improving circumstances of firm
• Active portfolio management: divesting/acquiring for value
− Divestment proceeds of ~$13bn in 2011 to complete $30bn program
−Divestment of two US refineries planned by end 2012
− Acquisition of Devon assets expected to complete in 2011
• Investing for upstream value
− Doubling exploration spend
− 32 project start ups by 2016: 1mmboe of new production
−New forms of partnerships with resource holders : Rosneft strategic alliance
• Reshaping downstream
− $2bn+ pre tax performance improvement by end 2012: $0.9bn delivered in 2010
− More focussed portfolio: improved returns and growth
− Repositioning US fuels value chains and halving US refining capacity
Q&A

8/3/2019 Bp Fourth Quarter 2010 Results Presentation Slides
http://slidepdf.com/reader/full/bp-fourth-quarter-2010-results-presentation-slides 84/84
84
Byron Grote
Chief Financial Officer
Bob Dudley
Group Chief Executive
Mike Daly
Executive Vice President,
Exploration
Bernard Looney
Executive Vice President,
Developments
Bob Fryar
Executive Vice President,
Production
Andy Hopwood
Executive Vice President,
Strategy & Integration
Iain Conn
Chief Executive
Refining & Marketing
Mark Bly
Executive Vice President,
Safety & Operational Risk


