+ All Categories
Home > Documents > bp - oil.alaska.govoil.alaska.gov/Documents/Units/2018/20180329_PB_IPA_POD_2018.pdf2.2 Development...

bp - oil.alaska.govoil.alaska.gov/Documents/Units/2018/20180329_PB_IPA_POD_2018.pdf2.2 Development...

Date post: 12-Jun-2018
Category:
Upload: tranhanh
View: 215 times
Download: 0 times
Share this document with a friend
17
bp March 29, 2018 Hand Delivered Ms. Chantal Walsh, Director Division of Oil and Gas Department of Natural Resources 550 West 7 th Avenue, Suite 1100 Anchorage, AK 99501-3560 Re: PRUDOE BAY UNIT INITIAL PARTICIPATING AREAS ANNUAL PROGRESS REPORT and 2018 UPDATE TO PLAN OF DEVELOPMENT JULY 1, 2018 -JUNE 30, 2019 Dear Ms. Walsh: BP Exploration (Alaska) Inc 900 East Benson Boulevard PO Box 196612 Anchorage, Alaska 99519-6612 (907) 561-5111 BP Exploration (Alaska) Inc., as the operator of the Prudhoe Bay Unit and on behalf of the working interest owners, submits the accompanying 2018 Plan of Development and Annual Progress Report for the Initial Participating Areas. This Plan of Development ("POD") provides a review of the 2017 activities as well as descriptions of future development activities under consideration consistent with previous PODs. Questions can be directed to Bill Bredar at 564-5348 or through email at [email protected]. Sincerely, Katrina Gamer Fieldwide Manager Alaska Reservoir Development BP Exploration (Alaska) Inc. cc: w/attachment: G. Smith, ExxonMobil Production Company H. Jamieson, ExxonMobil Production Company J. Schultz, ConocoPhillips Alaska, Inc E. Reinbold, ConocoPhillips Alaska, Inc Dave White, Chevron U.S.A. Inc. D. Roby, AOGCC
Transcript

bp

March 29, 2018

Hand Delivered

Ms. Chantal Walsh, Director Division of Oil and Gas Department of Natural Resources 550 West 7th Avenue, Suite 1100 Anchorage, AK 99501-3560

Re: PRUDOE BAY UNIT INITIAL PARTICIPATING AREAS ANNUAL PROGRESS REPORT and 2018 UPDATE TO PLAN OF DEVELOPMENT JULY 1, 2018 -JUNE 30, 2019

Dear Ms. Walsh:

BP Exploration (Alaska) Inc 900 East Benson Boulevard PO Box 196612 Anchorage, Alaska 99519-6612 (907) 561-5111

BP Exploration (Alaska) Inc., as the operator of the Prudhoe Bay Unit and on behalf of the working interest owners, submits the accompanying 2018 Plan of Development and Annual Progress Report for the Initial Participating Areas. This Plan of Development ("POD") provides a review of the 2017 activities as well as descriptions of future development activities under consideration consistent with previous PODs.

Questions can be directed to Bill Bredar at 564-5348 or through email at [email protected].

Sincerely,

Katrina Gamer Fieldwide Manager Alaska Reservoir Development BP Exploration (Alaska) Inc.

cc: w/attachment: G. Smith, ExxonMobil Production Company H. Jamieson, ExxonMobil Production Company J. Schultz, ConocoPhillips Alaska, Inc E. Reinbold, ConocoPhillips Alaska, Inc Dave White, Chevron U.S.A. Inc. D. Roby, AOGCC


IPA Plan of Development                                                                                                                     Page | 1   


PRUDHOE BAY UNIT 

INITIAL PARTICIPATING AREAS 

ANNUAL PROGRESS REPORT AND 

2018 UPDATE TO PLAN OF DEVELOPMENT 

JULY 1, 2018 – JUNE 30, 2019  


IPA Plan of Development                                                                                                                     Page | 2   

TABLE OF CONTENTS  


1.0   INTRODUCTION  


2.0   ANNUAL PROGRESS REPORT 2.1   Production and Injection Volumes 

A. Crude and Condensate B. Produced Gas C. Natural Gas Liquids D. Miscible Gas 

E. Produced Water 

F. Injected Water 

2.2   Development and Production Activity 

A. Enhanced Recovery – Injected Water  

B. Enhanced Recovery – Miscible Gas 

C. Well Activity  

D. Facility and Reservoir Optimization 


3.0  UPDATED PLAN OF DEVELOPMENT  

3.1   Reservoir Management 

3.2   Production Forecast  3.3   Well Activity  

3.4   Miscible Gas Enhanced Oil Recovery  

3.5   Projects 3.6   Technology 3.7   Major Gas Sales 


LIST OF ATTACHMENTS  

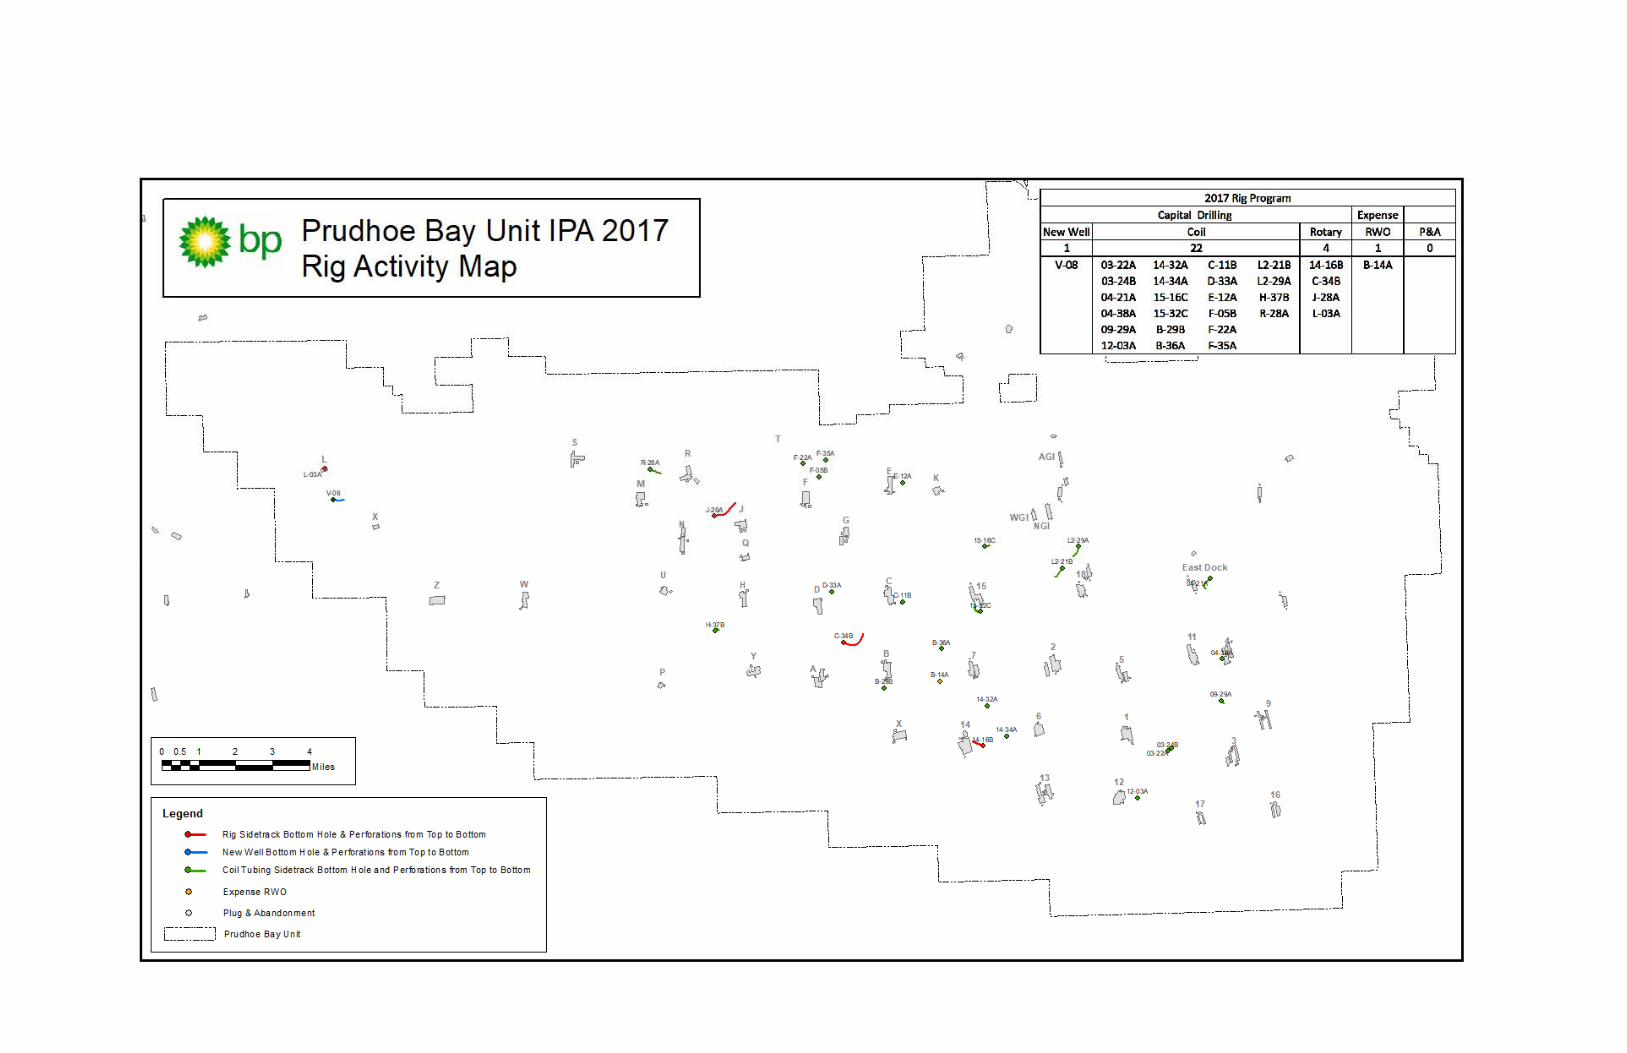
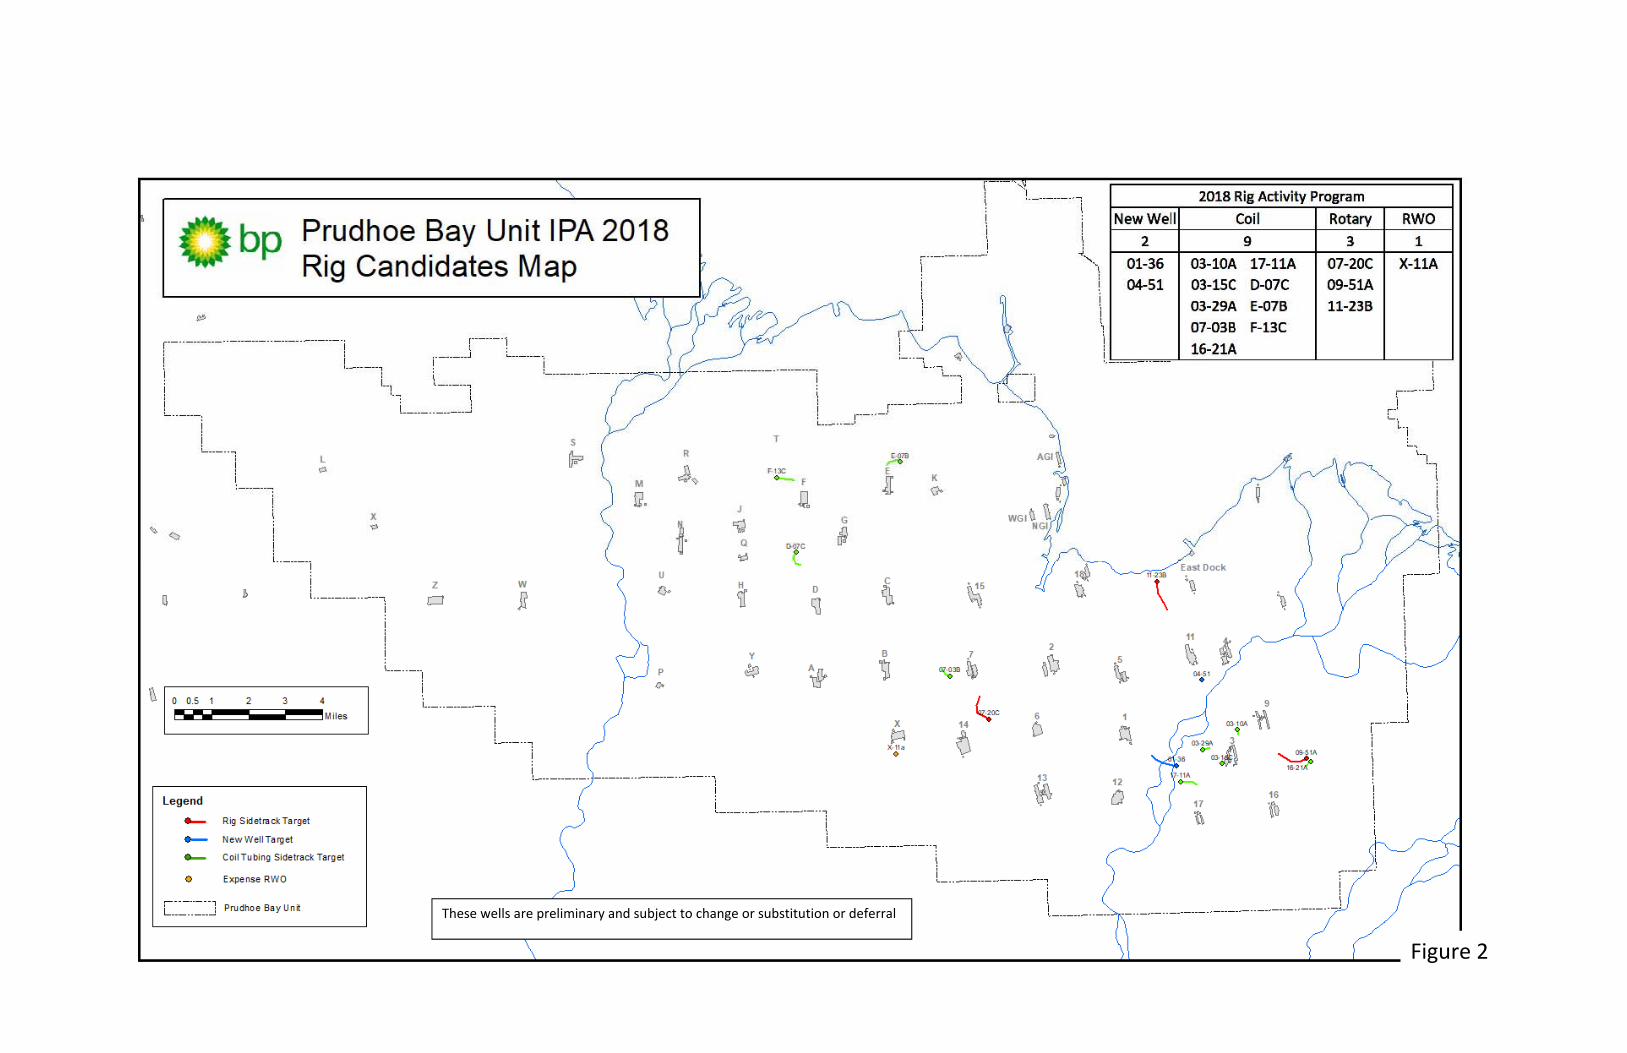
FIGURE 1: 2017 IPA RIG ACTIVITY MAP 

FIGURE 2: 2018 IPA RIG ACTIVITY CANDIDATES  


IPA Plan of Development                                                                                                                     Page | 3   


1.0 INTRODUCTION 

This Annual Progress Report and update to the Plan of Development for the Oil Rim Participating Area 

and Gas Cap Participating Area (IPA) within the Prudhoe Bay Unit (PBU) has been prepared in 

accordance with the Findings and Decision of the Commissioner on the Application for Change of Unit 

Operator, dated June 27, 2000.  This Plan of Development updates and modifies the initial Plan of 

Development and Operation for the IPA that was incorporated into both the Prudhoe Bay Unit 

Operating Agreement and the Prudhoe Bay Unit Agreement as Exhibit "E".  The plan period for this 

submission addresses the period July 1, 2018, through June 30, 2019.  

The objective of the Plan of Development for the 2018 plan period is to maximize commercial 

production of crude oil in a cost‐effective, safe, and environmentally responsible manner.  The Annual 

Progress Report summarizes development and production activities from January 1, 2017 to December 

31, 2017. The Plan of Development provides an overview of the activities that will comprise the 

development and production program for the IPA (Permo‐Triassic) reservoir during the 2018 plan 

period.  This update to the initial IPA Plan of Development assumes a continuation of the current 

business climate and reflects the current understanding of the reservoir.  Changes in the business 

climate, new insights into the reservoir, or other new information could alter the timing, scope, or 

feasibility of one or more of the plan components. 


2.0 ANNUAL PROGRESS REPORT 

2.1 Production and Injection Volumes 

A. Crude and Condensate  

Crude and condensate rates averaged 186.8 MB/D in 2017. This rate, combined with production from 

the PBU Satellite fields and a portion of the Pt. McIntrye field (which are addressed in separate annual 

reports and plans of development), fully utilized available PBU processing capacity within reservoir 

management constraints. A total of 68.19 MMB were delivered to the Trans‐Alaska Pipeline System 

(TAPS) during the year ending December 31, 2017. 

B. Produced Gas 

IPA gas production totaled 2549 BSCF or 6985 MMSCFD for the reporting period, which continues to be 

governed by facility handling constraints.  Field gas offtake (FGO) increased by 29 MMSCF/D, (1.1%) 

from the previous year.  Re‐injection of dry gas amounted to 2289 BSCF (6271 MMSCFD), 89.8% of the 

produced gas stream.  Gas production that was taken in kind and removed from the PBU included about 

6.3 BSCF (0.2% of produced gas, and about 15.3 MMB of Natural Gas Liquid (NGL), which equates to 

about 18 BSCF (0.7%) of produced gas.  Fuel usage accounted for 145 BSCF (398 MMSCFD), 5.7 % of the 

produced gas. Flare volumes were limited to 7 BSCF, (0.3%). Produced gas used in miscible Injectant 

production, which was reinjected in enhanced oil recovery operations, totaled 84 BSCF (3.29% of 

produced gas), of which 55 BSCF (2.2% of produced gas) was injected within the IPA.  Minor gas sales 

totaled 6 BSCF (0.2% of produced gas). Gas taken in kind and exported to the Northstar Unit was 0.078 

BSCF (.003% of produced gas). 


IPA Plan of Development                                                                                                                     Page | 4   


C. Natural Gas Liquids 

NGL production for the IPA averaged 42 MB/D for the reporting period, with 15.3 MMBO delivered to 

TAPS. 

D. Miscible Gas 

IPA continued operation with injection of a total of 55 BSCF of Miscible Injectant (MI) during the report 

period. The CGF produced approximately 230 MMSCF/D during 2017, with about 79 MMSCF/D injected 

into areas outside the IPA (Aurora, Borealis, Orion, Polaris, Midnight Sun and Pt. McIntyre). 

E. Produced Water 

Water production averaged 930 MB/D (without  W‐400).  This water rate yields a field wide average 

water cut of 83%. 

F. Injected Water 

Waterflood (WF) and Water Alternating Gas (WAG) operations continued through the reporting period 

with an annual average of 804 MB/D of produced water injected. During 2017, 94 MB/D of produced 

water were exported for injection into satellite fields. This was offset by produced water imports of 67 

MB/D.  Produced water disposal volumes decreased from 105 MB/D to 100 MB/D. This represents a 

produced water injection efficiency of 87.6%.  Additional FS‐1 water was also disposed of at the Lisburne 

Production Center. 

Additionally, approximately 36 MB/D annual average of seawater, from the Seawater Treatment Plant, 

was injected in the FS1 & FS2 flood area.  Seawater injected as part of the Gas Cap Water Injection 

project averaged 368 MB/D.  In total, IPA seawater injection averaged approximately 404 MB/D for the 

year.  

Supplemental Prince Creek water produced from W‐400 in 2017 was 10.7 MB/D.  The Prince Creek 

water augments water injection at the Eileen West End. 


2.2 Development and Production Activity 

Field development and production activities have continued in accordance with the 2017 Plan of 

Development. 

A. Enhanced Recovery – Injected Water 

Waterflood (WF) and Water Alternating Gas (WAG) operations continued through the reporting period.  

The Gas Cap Water Injection (GCWI) project continued throughout the reporting period.  In 2017, static 

pressure surveys were acquired field‐wide, confirming a continuing trend of maintaining reservoir 

pressure. Water movement continued to be monitored by neutron logging in offset wells. 


IPA Plan of Development                                                                                                                     Page | 5   

B. Enhanced Recovery – Miscible Gas  

Miscible gas injection operations continued throughout the operating period as per the Prudhoe Bay 

Miscible Gas Project with MI delivered to MI‐capable drill sites within operational constraints. The 

available MI was allocated based on the MI efficiency (barrels of oil per unit of MI) to projects within the 

IPA, including: (1) PBMGP patterns, (2) Miscible Injection Stimulation Treatment (MIST) patterns, (3) 

Eileen West End (EWE) patterns, and to the other fields in the Prudhoe Bay Unit area. 

In 2017 MI injection was expanded to two new MI patterns at Pt. McIntyre. The N Pad UZI project began 

in 2014 with the drilling of two injectors (N‐28 and N‐29).  Construction of N Pad injection headers, 

providing both water and MI and tie‐ins for all N Pad injectors was completed in 2015.  In conjunction 

with the N Pad UZI Project, one (N‐07A) of three producer‐to‐injector conversions were completed and 

put on injection in 2015.  The remaining two conversions, N‐01A and N‐27, were determined to have 

channeling behind liner.  Over the course of 2016 and 2017, the cement squeeze repairs were executed 

to achieve zonal conformance into the UZI target lenses. N‐01A was planned to begin injection on MI, 

but due to an unsuccessful squeeze, the well is restricted to water injection. The squeeze intervention in 

N‐27 was successful, and the well was put on water injection in January 2018, and will be put on MI 

injection later in 2018. The Low Temperature Separator (LTS) continuous methanol injection project was 

progressed in 2017. More Rich gas components were available due to the rich gas add perf program. 

There were some challenges to get MI injection back to WOA in 4Q, but reinstatement of MI is in 

progress, and several pads are back on MI injection.   


C. Well Activity  

Wellwork activity remained at a high level in 2017 with 386 rate adding jobs done and about 1000 total 

jobs performed.  Wellwork activity included integrity, surface repairs, capacity sustainment, rate 

enhancement (addition of perforations, stimulations, gas and water shut‐offs), well diagnostics, 

surveillance, and rig workovers. 

The recovery of liquids from the Sag River gas cap via wellwork on uncompetitive Ivishak producers was 

a focus area for 2017.  Sag River gas contains condensate that has not been swept out through updip 

lean gas reinjection and can be recovered as liquids at surface.  Recovery of this resource is being done 

via a systematic program of plugging off uncompetitive Ivishak producers and adding perforations 

uphole in the Sag River gas cap.  Plug / add perforation jobs at 29 wells were executed in 2017 at pads in 

the GC‐1, GC‐3, FS‐1, and FS‐3 areas yielding 7000 bopd of new production at competitive GORs at year 

end.  The entire program currently produces over 650 mmscf/d and yields approximately 12,000 bopd.  

An Area Performance Evaluation was completed for the Sag River Formation in the E/K Graben on the 

north side of the Prudhoe Field. 

Two rigs ran with 27 wells drilled in 2017.  New penetrations were drilled primarily by sidetracking 

underperforming wells using both conventional rotary and coil tubing drilling rigs. A bottomhole location 

map of all wells drilled in 2017 is included as Figure 1. Displayed on the map are top to bottom 

perforated intervals for each new wellbore. As Prudhoe Bay has matured, drilling targets continue to 

become smaller and more complex with increasing drilling and reservoir risk.  


IPA Plan of Development                                                                                                                     Page | 6   

FS2 was a focus area for 2017 drilling with 5 wells drilled. Three of the wells drilled in 2017 were a 

combination of pattern rotation/GDWFI targets, one well was a “FURY” well in Zone 1A, and the last was 

a Zone 2A horizontal at DS04.   Drilling at EWE/NWE during 2017 involved one new grassroots rotary 

well, V‐08 and one new rotary sidetrack well, L‐03A (suspended). 


D. Facility and Reservoir Optimization 

Summarized below are significant activities over the past year: 

The main scope of work completed during the 2017 GC1 facility maintenance turnaround (TAR) was the 

replacement of corroded carbon steel piping in wet gas service with stainless steel piping. Upgrading 

mist eliminators and inlet devices, upgrading heat exchanger bundles, gas dehydration system cleaning, 

and replacement of contactor distributors were also performed during the GC1 2017 TAR. 

Integrity Management Activities 

In‐Line Inspection. In‐Line Inspections (ILI, or smart pigging) were performed on three produced oil 

pipelines, eight three‐phase cross‐country pipelines, ten produced water injection (PWI) pipelines, one 

seawater injection (SWI) pipeline, and one gas lift transit pipeline totaling 83 miles in length. The scope 

of work for follow‐up has employed the use of data integration to target key areas for additional 

inspection or repair.  Field results are being continuously monitored thereby allowing for continuous 

refinement and improvement of the in‐line inspection program. Follow‐up inspection and mitigation, as 

necessary, are complete on 100% of ILI anomalies that were due, to date, from ILI runs that were 

completed in 2011 through 2016. Follow‐up inspection and mitigation, as necessary, were completed on 

100% of ILI anomalies that were due to date from 2017 runs.  To date, all In‐line inspection reports from 

the 2017 in‐line inspection program have been received from the ILI vendors.     

Pipeline Replacement Program (PRP) Studies and Project Execution.  PRP projects make flowlines in‐line 

inspectable, and/or maintenance piggable, and/or replace pipelines.  The DS14 B/C Production 

Commonline Replacement project was completed in 2017. 

Fire and Gas Activities.  The FS‐1 Fire & Gas Renewal project continued installation through 2017 with 

cutover completed in 2018.  The GC‐1 Fire & Gas Renewal project continues to advance with Optimize 

stage completion planned for 2018. CPS Fire & Gas Renewal project continues to advance with Optimize 

stage completion planned for 2018. 

Safety Systems.   The FS‐3 Safety System Renewal (SSR) project began construction activities with 

expected completion in 2018. GC3 SSR project entered the Concept Development (CD) stage with 

anticipated CD completion 2018.  

Facility Siting.    Facility Siting projects reduce personnel exposure risk of permanently occupied spaces 

to process safety hazards within processing facilities by installing a standardized BRM (blast resistant 

module). CGF Facility Siting and CCP Facility Siting BRM installations were completed in 2017 and a 

project is progressing for GC2.   


IPA Plan of Development                                                                                                                     Page | 7   

STV‐IP Compressor Replacement FS‐1, FS‐2, and FS‐3   

The Stock Tank Vapor & Intermediate Pressure turbine‐driven gas compressors at all three Flow Stations 

(FS) were replaced with more reliable and efficient electric motor driven compressors designed for 

current and projected gas rates and molecular weights. The project was fully sanctioned in 2012, and 

the compressor replacement at FS‐1 was completed during 2014.  The compressor installation at FS‐3 

was completed and was started up in December 2016. The compressor installation at FS‐2 began in 

January 2017 with start‐up achieved in February 2018.   


3.0 UPDATED PLAN OF DEVELOPMENT 


As the IPA enters its 41st year online, 30 years beyond the end of the field’s production plateau, the PBU 

owners’ key priority is on efficient production of the existing wells and plant.  With 1423 wells, the field 

is well developed.   While drilling was the key driver for production during the development phase of the 

IPA, now that the field is in production phase, large scale drilling programs (i.e., more than 50 new 

penetrations per year) have largely been replaced by operations efficiency increases, hundreds of 

wellwork jobs each year to maintain and enhance existing wellstock (including accessing rich gas for 

increased liquids production), and reservoir management techniques as the key drivers. Development 

drilling still has an important role and will continue at a pace consistent with the business environment 

and the ability to identify viable targets informed by ongoing surveillance. The emphasis on increasing 

production efficiency resulted in only minor decline in the IPA’s 2017 production rate, when normalized 

for the GC‐1 TAR.   


3.1 Reservoir Management 

Fieldwide Reservoir Management  

The Prudhoe Bay reservoir management strategy is to maximize recovery through (1) optimization of 

base field production within facility constraints; (2) well work to enhance production and ultimate 

recovery; (3) pressure maintenance; (4) flood optimization; and (5) focused development drilling. Key 

reservoir mechanisms employed in IPA include gravity drainage, reinjection of lean gas (produced gas 

after cryogenic extraction of NGLs and MI at the CGF) for pressure support and gas cycling, rich gas 

displacement, and vaporization of condensates and black oil, pattern water injection, miscible gas 

injection, and gas cap water injection. 

The Prudhoe Bay Field simulation model continues to be refined, updated, and used for planning and 

field optimization.  Progress is continuing in the development of the next generation of the Prudhoe Bay 

full field simulation tools. 


IPA Plan of Development                                                                                                                     Page | 8   

Gravity Drainage Area  

Management of the Gravity Drainage (GD) area will largely be achieved through operation, 

maintenance, and repair of existing wells, and well sidetracks to enhance recovery of remaining oil as 

well as the efficiency of the oil vaporization by lean gas injection. Management of base liquid 

hydrocarbon resources and ongoing development of the GD area incorporates newly acquired 

surveillance and updated play type analyses.  Development in the Gravity Drainage area will continue to 

target opportunity driven site‐selective sidetracks as well as development of the up structure area 

(north of DS 15 and DS 18). The sidetrack program is designed to improve production and ultimate 

recovery. Sidetrack targets are based upon the results of ongoing area performance evaluations and 

smaller scale geologic and reservoir studies coupled with existing well performance. The majority of GD 

development drilling will target Zone 1 with horizontal sidetracks. Zone 2 is targeted in areas where 

sufficient light oil column can be identified. Ongoing drilling and well work in the GD area is increasingly 

challenged by continued gas cap expansion resulting in thinner oil columns, and water encroachment 

from gas cap water injection.  Management of the oil vaporization process incorporates lean‐gas 

surveillance through gas sampling of wells.  Activity to improve vapor‐born liquid recovery includes 

selective perforations in areas where sweep efficiency and condensate recovery are under‐performing 

including the Sag formation and Z4 in select areas.   


East Waterflood/EOR Area  

The East waterflood/enhanced oil recovery area (East Waterflood/EOR Area) reservoir management is 

focused on optimizing water and MI injection for flood management, identifying potential new 

penetrations,  pattern reconfigurations to improve water and MI flood efficiency, and wellwork.  The 

reservoir management objectives for the East Waterflood/EOR Area generally include optimizing 

recovery by minimizing gas influx, optimizing flood conformance, and replacing reservoir voidage within 

the flood area.  The area teams manage these processes through pattern reviews, area performance 

evaluations, and well reviews.  

Seven wells are planned at FS2 for 2018 and additional wells for expanding the successful MIST and 

pattern rotation programs are currently being planned for the future.   


West Waterflood (WWF)/EOR Area   

The West waterflood enhanced oil recovery area (West Waterflood/EOR Area) reservoir management 

objectives are to optimize production offtake and enhance recovery by replacing voidage and 

maintaining reservoir pressure to minimize down‐structure gas cap expansion. 

As in prior years, pattern/conformance reviews will continue to focus on opportunities to improve 

recovery and injection conformance through routine wellwork and injection management.    

Ongoing wellwork activity and system optimization practices, supported by surveillance logging, 

diagnostic integrity testing, and injection management should mitigate production decline. 


IPA Plan of Development                                                                                                                     Page | 9   

In 2018, one rig workover on injector X‐11A is planned, allowing that currently inoperable well to re‐

start injection in support of several offset waterflood producers. 


Updip Zone 4  

Pattern conversions associated with the Updip Zone 4 Injection (UZI) Project will continue.  The UZI 

Project targets remaining oil where the gas cap has expanded into Zone 4, where shale barriers and 

baffles make the gravity drainage process less efficient. The area of UZI potential is generally identified 

as immediately up‐structure of the existing waterflood enhanced oil recovery (WF/EOR) area. The UZI 

Project achieves improved recovery of isolated oil lenses through pattern injection of water or MI or 

both.   

Due to the success of the N‐27 squeeze mentioned in Section 2.2B, and after a review of the area, this 

well was selected as the new candidate for MI injection.  Currently there are four of the five injectors 

online (N‐07A, N‐27, N‐28, and N‐29), with plans to put N‐01A online this year. 

A comprehensive UZI surveillance plan has been developed to monitor the influence of the UZI injectors 

so that the offset producers can be perforated in the zone 4 lenses as the bypassed oil migrates past the 

producers. In addition to monitoring water cut and GOR changes in well tests, neutron logging will be 

performed at specified intervals to identify when swept oil in the zone 4 lenses has reached the 

producers. Samples of produced water will be collected to analyze for changes in water chemistry due to 

injection of produced water.  Additional samples of produced gas and oil will be collected and analyzed 

to better understand the impact of MI injection into the N‐27 pattern.   

Continued development of UZI type patterns will be based on evaluation of performance from previous 

investments.  Phased UZI development in the up‐structure region may encompass a mix of injector 

conversions, sidetracks and new wells.  In some UZI patterns, rig workovers may be necessary to bring 

key offset wells on production.   


Sag River Development  

The recovery of liquids from the Sag River gas cap via wellwork on uncompetitive Ivishak producers is 

planned to continue in 2018, with approximately 10 jobs expected.   

Ongoing area and pattern performance reviews, optimization of miscible injectant usage, and structural 

mapping utilizing improved seismic imaging have been key tools to identify and economically progress 

additional MI and waterflood pattern infill and Sag gas cap supported drilling targets in the Sag River 

reservoir.   

No wells targeting the Sag River are expected to be drilled in 2018. 


Eileen West End / Northwest Eileen   

The primary objective for the Eileen West End/Northwest Eileen (EWE/NWE) areas is to optimize 

production under the surface constraints of gas lift supply and the total gas oil ratio (TGOR) of the EWE 


IPA Plan of Development                                                                                                                     Page | 10   

large diameter flow line (LDF). This objective is accomplished though actively managing producers and 

injectors, maintaining the base set of wells through well work, and adding new wells through drilling. 

The EWE/NWE producers are actively managed based on the marginal TGOR of the EWE LDF.  Producers 

that are above the EWE LDF marginal TGOR are shut in to meet the velocity constraint of the EWE LDF. 

The field injection is managed by an efficient application of MI for the WAG flood, and the EWE GCWI 

program. Efforts toward effective management of the GCWI and pattern WAG flood will include 

maintaining pattern conformance and selecting strategic areas to inject MI. A voidage replacement ratio 

(VRR) of 1 is targeted for patterns with injection support, to maintain reservoir pressure and sweep oil 

to producers. The chemical tracer program that began in 2010 was concluded in 2015. This tracer study 

helped identify conformance between injectors and producers throughout EWE, and monitor the effects 

of gas cap water injectors within the patterns. 

Additional drilling opportunities in the EWE/NWE area are being evaluated; however, these 

opportunities are challenged in the current economic environment with the complex geology, and water 

and gas influx. 


Gas Cap Water Injection (GCWI)  

The GCWI project will continue as part of the reservoir management strategy. A similar static pressure 

and neutron log surveillance plan to 2017 is anticipated for 2018.  The GCWI project is generally 

performing as expected, although the seawater injection rate is below the initial plan.  The main 

objective of mitigating further reservoir pressure decline is being achieved. 


3.2 Production Forecast 

Reservoir management strategies are designed to optimize oil rate and recovery. Crude and condensate 

annual average rates (excluding NGL sales) decreased from 197.9 MBD in 2017 to 186.8 MB/D in 2017, 

due to natural decline and the GC‐1 facility turn‐around (TAR). Their full impact was partially offset by 

increased Operations Efficiency (from 83% to 85%) and continued high wellwork activity. The average 

annual IPA crude and condensate production rate for 2018 is expected to be between 150‐187 MB/D.  

The total NGL production for 2018 is expected to be between 30‐46 MB/D. Fuel and flare volumes are 

expected to remain relatively unchanged in 2018.  


3.3 Well Activity 

Production in 2018 will largely be driven through continuing improvements in operating efficiency, 

optimizing the base and wellwork.  Strong emphasis will continue to be placed on the wellwork program 

with an expectation of ~400 rate adding jobs, ~700 non‐rate adding jobs, as well as an active, fieldwide 

reservoir surveillance program driving these activities.  IPA rotary penetrations in 2018 will remain 

approximately the same as in 2017 (~5).  Coil penetrations will be reduced from 22 in 2017 to 

approximately 9 in 2018.  Rig workovers are expected to increase from 1 in 2017 to 1 ‐ 3 in 2018.  


IPA Plan of Development                                                                                                                     Page | 11   

Technical work to identify and evaluate drilling locations that are economically viable in the current oil 

price environment is ongoing. Candidates identified to date are displayed on Figure 2.   

Rig workover (RWO) and non‐rig workover (NRWO) activity will be used to return to service injectors 

and producers that are shut‐in because of wellbore integrity issues.  There will continue to be an 

increased focus on non‐rig methods including potential use of a pulling unit for simple tubing 

replacements and casing/liner repair. 


3.4 Miscible Gas Enhanced Oil Recovery 

Miscible gas injection operations are planned to continue during 2018.  


3.5 Projects 

Facility and Reservoir Optimization 

Controls Reliability & Renewal (CRR).    The objective of CRR is to reduce the backlog of aging control 

systems, install control systems with a broader base for support, and improve lifecycle cost, while 

minimizing the impact on production during implementation.   FS3 EMC (EMC is controller manufacturer 

company) replacement new construction activities are planned for completion in 2018.  FS1 and GC2 

CRR project development are planned to follow in 2018‐2019.   


Seawater System Upgrades    

The long‐term plan for the STP continues to be evaluated as part of the IPA strategy to maximize field 

recovery.  Seawater is used at the GCWI project for pressure support.  Seawater is also injected into 

parts of the down‐dip IPA, supporting production through waterflood and EOR operations.  Plant 

efficiency and reliability are recognized as important levers in delivering seawater to the field, and 

operations continue to focus on proactive optimization, defect elimination, and maintenance 

enhancements in the STP system.  


Gas Quality Projects    

Upgrades and maintenance projects are underway to improve the dew point of dehydrated gas from 

flow stations and gathering centers.  This will improve the reliability of the Central Gas Facility, which 

will benefit oil production and potential major gas sales.  Activity started in 2016, and will continue in 

2018, including installing new dew point analyzers at all facilities. 


IPA Plan of Development                                                                                                                     Page | 12   

CGF Low Temperature Separator Entrainment Project     

Performance improvement of CGF low temperature separators (LTS) to increase NGL production is in 

the early stages of evaluation. Project scope under consideration includes replacing vessel inlet devices, 

demisting systems, and potentially the separator trays for each of the three LTS separators. 


Integrity Management Activities  

There are currently no plans for any Pipeline Replacement Projects (PRP) in 2018. 


3.6 Technology 

Invention and application of new technology has underpinned the IPA’s outstanding production record 

and will continue in the future.  During the plan period the Operations team is planning pilot testing of 

the Operator Workbench which is a mobile device for field workers to collect and input data without 

returning to a computer station.  In the Reservoir Develoment team, a field wide 3D seismic survey 

utilizing the same technology that underpinned the successful North Prudhe survey of 2014 is being 

evaluated for execution.  In the Wells team, installation is planned for more wireless monitoring of wells 

involving pressure and temperature measurements. 

The following potentially promising technologies are being evaluated for the future: 

Using big data to inform areas of pipeline wall thickness changes  

A logistics tracking system to improve visibility to location and timing of receipt of materials 

Implementation of latest visualization software advances that puts Reservoir Development team 

in closer touch with IPA data 

Use of technology to support IPA initiative to make drillwell costs more competitive will 

continue 


3.7 Major Gas Sales 

MGS Activities during 2017‐18 

In the 2017 POD submittal, unit operator indicated that appropriate activities would be undertaken 

during the 2017‐18 plan period to prepare for a major gas sale (MGS). As in the past, the PBU operator 

expects to respond to requests for information from the Alaska Gas Development Corporation (AGDC) 

regarding the AGDC‐led Alaska LNG (AKLNG) project. The PBU operator has provided a draft 

confidentiality agreement to allow disclosure of information to AGDC for their AKLNG project. To date, 

PBU operator has not received requests for information from AGDC, FERC, any other agency, any other 

unit operator, or any third party regarding the AGDC‐led AKLNG project. 


IPA Plan of Development                                                                                                                     Page | 13   

MGS Activities during 2018‐19 

The AGDC‐led AKLNG project has stated publicly that it is considering various development options, 

including a phased development. The PBU owners anticipate undertaking appropriate planning and 

activities to position for an MGS consistent with AGDC progress on the AKLNG project and based on 

prior work done by the PBU operator to prepare for a MGS. Depending upon AKLNG project milestones 

and activity, the timing and scope of MGS‐related activity may need to be adjusted, and if plans do not 

occur as scheduled during the 2018‐19 plan period, then the PBU operator would not anticipate 

including similar information on MGS activities in the 2019 POD submission. 


Long Range MGS Activities 

Following is a preliminary list of activites the PBU owners anticipate would need to be undertaken to 

ensure alignment with an AGDC‐led project, and a decision by AGDC to proceed with AKLNG: 

1. Sales gas delivery  

Identify,  design  and  coordinate  installation  of  tie‐ins  at  PBU  Central  Gas  Facility  (CGF)  to 

connect to AK LNG Gas Treatment Plant (GTP) feed gas pipeline, valve manifold module and 

custody transfer metering module at CGF pad.  

Identify,  design  and  coordinate  installation  of  facilities  to mitigate  impact  on  gas  delivery 

from short‐term outages of Trans Alaska Pipeline System (TAPS).  

Identify, design and modify CGF low temperature separators to meet GTP inlet gas specs. 

2. Byproduct injection  

Identify, design and  coordinate  installation of high pressure pipelines  to  various pads and 

drilling of wells for byproduct injection.  

Use GTP byproduct flare for unplanned emergency depressurization to mitigate CO2 related 

hazards. 

3. Shared infrastructure 

Identify  potential  sharing  arrangements  for  fuel  gas,  power  and  propane  for  GTP 

construction.  

4. Field facility maintenance 

Develop operating and maintenance plans for wells and facilities to produce and deliver gas 

at requisite availability on annual average basis. 

 Develop maintenance programs  for existing  facilities  to maintain  facilities  integrity  (wells, 

piping,  controls,  fire  and  gas projects)  and  to  sustain  reliable  gas  supply  (gas dehydration 

systems, pads, pipelines, and wells).  


Activities to optimize the use of gas before a MGS 

As part of ongoing operations, the PBU owners will continue to maximize the opportunity for improved 

recovery by way of injection of indigenous lean gas and MI into Prudhoe Bay reservoirs. The use of 

indigenous gas to support production and improve ultimate recovery is a proven recovery mechanism. 


IPA Plan of Development                                                                                                                     Page | 14   

The use of indigenous gas injection contributes approximately 40% of PBU oil production through three 

main mechanisms: vaporization, displacement of IPA rich gas to improve condensate, NGL, and MI 

production, and enhanced oil recovery with MI. The use of indigenous gas is a valuable opportunity in 

the near‐term and current activities will continue to pursue production through the reinjection of the 

processed gas.  

Furthermore, in preparation for potential commercial discussions related to the potential delivery of gas 

from Pt. Thomson Unit (PTU) for injection into the PBU reservoir, the PBU owners will evaluate a range 

of potential impacts to the PBU reservoirs (including IPA), and on the operation of PBU. 


IPA Plan of Development                                                                                                                     Page | 15   


IPA Plan of Development                                                                                                                     Page | 16   


Figure 2 

These wells are preliminary and subject to change or substitution or deferral 


Recommended