36
Project Partners Wednesday, October 16, 2013 City of San Diego Natural Resources and Culture Committee

Project Partners
Wednesday, October 16, 2013
City of San Diego Natural Resources and Culture Committee

BACKGROUND Richard Brady & Associates - Multi-
discipline design and construction firm, specializing in water resources. Immense experience working with the City of San Diego, as well as many other large water purveyors throughout the Country. Richard Brady - Alvarado Water
Treatment Plant Upgrade & Expansion (200 MGD)
IBM has spearheaded several IT and Analytics & Optimization projects throughout the world in the water domain. Valley of the Moon Water Distribution (Sonoma, CA); Washington
DC Water and Sewer Agency; Mei Raanana Water Utility (Israel); Enemalta Smarter Water and Energy Metering (Malta, Europe)
Project Kickoff meeting in late January, 2012, involving BRADY, IBM, Neptune, and several different departments within the City of San Diego.

CITY OF SAN DIEGO WATER DISTRIBUTION SYSTEM STATS*
Average Daily Demand (~1.3M people) – 171 million gallons per day
Over 3,300 miles of water mains ranging in size from 4” to 84”
130 pressure zones 49 water pump stations More than 24,000 fire hydrants,
48,000 valves, 275,000 service connections and meters
Approximately 200 million gallons of potable water storage capacity in 32 standpipes, elevated tanks, and reservoirs
* According to an August, 2011 City of San Diego Public Utilities Department presentation

9 3,200

NON REVENUE WATER

NRW STATISTICS City of San Diego Citywide NRW Estimate ~ 9.3 %.
National Average according to US EPA ~ 14%. City of Phoenix ~ 5.1%. San Francisco Public Utilities Commission ~ 9%. Philadelphia Water Department ~ 31.2%.
Roughly 70% of the City’s NRW could be attributed to real losses (leakage in the water network).
2010 City NRW Study showed this to correspond to approximately $29.6M in lost revenue in 2009.
Infrastructure Leakage Index – 2.39 Ideally around 1.0 ignoring financial considerations.

GOAL OF THE PILOT Use data analysis and mathematical optimization, coupled with sound
engineering practices and domain knowledge to demonstrate the ability to proactively detect leaks so as to reduce NRW.
Show the City of San Diego the value of data integration and network monitoring in order to better understand what is going on within their system.
Combine BRADY’s hydraulic engineering expertise and familiarity with the City of San Diego, with IBM’s Smarter Planet Initiatives, optimization technologies and advanced mathematical ingenuity and applications.
*Leaks in images above not from City of San Diego Pilot

PILOT PROCESS
Install Sensors & Meters
Estimate NRW in Zone
Create/update Demand Model
Update Hydraulic Model
Calculate Suspected Leak
Hotspot Locations
Validate / Investigate
location in Field
Ongoing Data Analysis
Select Target Zone

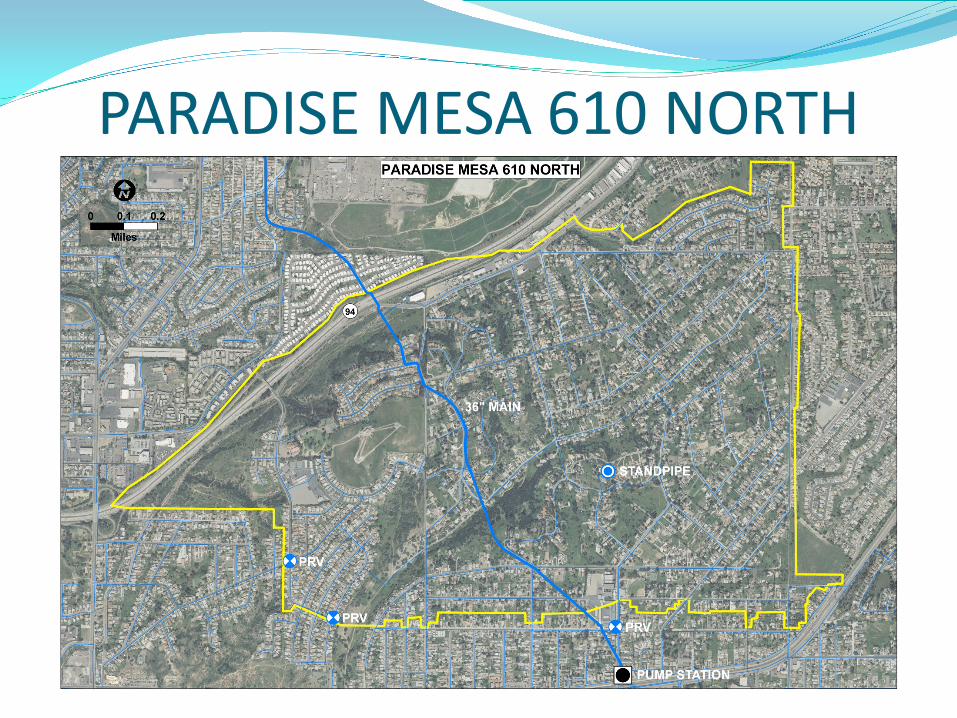
PILOT PRESSURE ZONE Paradise Mesa 610 North Pressure Zone
Statistics Approximately 2 square miles, 2,200
services (mostly residential, some irrigational, commerical, and institutional).
Ability to be isolated from other pressure zones.
1 Pump Station feeding the entire Northern Zone (65th & Herrick PS)
2 Pressure Reducing Stations/Valves, 11 Border Valves connected to lower pressure zones. Normally closed, trapped shut for the pilot.
A combination of aging AC, CI, and PVC pipe ranging in sizes from 6” – 16”.
1 decommissioned standpipe. No capital improvement projects
scheduled during the pilot. Expected to have a relatively high
amount of leakage.
PARADISE MESA 610 NORTH

PARADISE MESA 610 NORTH

EQUIPMENT 200 AMR Neptune R900 smart meters (3/4” – 2”) Sparling TigerMag Magnetic Flow Meter at PS (previously installed
before pilot, tied to City SCADA system) Suction & Discharge Pressure Gauge at PS (previously installed
before pilot, tied to City SCADA system) Pressure Gauge at Emerald Hills Standpipe in pressure zone
(Standpipe Out of Service) 4 Dickson Hydrant Pressure Loggers 16 Telog Hydrant Pressure Loggers

EQUIPMENT – NEPTUNE METERS Selected AMR (Automatic Meter Reading) over AMI (Advanced Metering
Infrastructure due to time of installation for AMI equipment). Metered all irrigational, commercial, and institutional customers (total of 27). All meters 1.5” or larger were included. Higher meter coverage for services with larger demand, as well as meters with older
age. Replaced 4.5 % of meters 1-3 years old, 6.5 % of meters 4-13, and 10.5 % of meters 14-
26 years old.
Residential Customers Meter Age Meter Age of Meters to Replace

NEPTUNE METER LOCATIONS

EQUIPMENT – PRESSURE LOGGERS DICKSON LOGGERS TELOG LOGGERS PR-325 300 PSI Hydrant
Pressure Logger Collected reading every 2
Minutes 4 Total
HPR-31 300 PSI Hydrant Pressure Logger
Collected Min., Max., and Average value in 2 minute span
16 Total

NRW / Unaccounted for Water ESTIMATE
The PM 610 North Pressure zone was for all intents and purposes, “isolated” for the pilot. 2 Pressure Relief Valves and 11 Border Gate Valves connected
to lower pressure zones trapped shut. One source of water supply to the zone, 65th & Herrick Pump
Station which solely feeds the PM 610 North zone. SCADA data available for discharge flow from the pump
station for the previous 2 years. Billing data for all residential, commercial, irrigational, and
institutional services available for the previous 2 years. Unaccounted for Water (UFW) = Water lost through
bleeding valves or PRVs (not billed in PM 610 zone). With this considered:

NRW / Unaccounted for Water ESTIMATE
AWWA recommends carrying out a Water Balance over a period of at least a year.
Pump Station SCADA discharge flow. February 1st, 2011 – January 31st, 2012. Summing this data, we estimated
total flow into the zone in this period to be 76,878,464 cubic feet.
Customer Service billing data. February 1st, 2011 – January 31st, 2012. Not all meters read at the same time,
an analysis of total consumption over this period had to completed individually for each of the nearly 2,200 meters in the zone.
Summing the data from all meters, we estimated consumption in the zone during this period to be 25,781,519 cubic feet.
Amounted to 67 % difference between water pumped into the zone and water consumed in the zone.
Something appeared to be off.

NRW ESTIMATE After further analysis and discussions with the modeling team
and water operations, realized PRVs had been open for a portion of the analysis period.
Water that flows through PRVs into lower zones is considered unaccounted for water, not Non-Revenue water. Can be billed in another pressure zone.
We needed a more accurate assessment. More accurate estimation of NRW / UFW came from a water
balance on the more recent data, AMR cross-validation, and analysis and data from the City of SD hydraulic modeling team. Performed water balance from March 27th to May 28th, and May 29th
to July 29th, shorter than the AWWA recommended 1 year period. Independently narrowed in on a range of 32-40% NRW / UFW
for the zone, which was then corroborated by the modeling team with their estimation of 35%.

HYDRAULIC MODEL City of San Diego existing hydraulic existed in Synergee water modeling
software. Model calibrated by the City of San Diego hydraulic modeling team annually. IBM Model Adjustments: Shutting off and removing valves, Updated PS
elevation based on As-Builts, Updating Pipe Material on sections replaced by CIP projects, added nodes at the locations of our hydrant pressure loggers.
572 Junctions, 602 Pipes. Pump Station modeled as a constant head reservoir for simplicity.
• Regular and As-Needed meetings with the City of SD hydraulic modeling team to smooth out clarify any modeling issues.
• Became the basis for the demand model and mathematical analysis.
• Physical hydrant logger pressure were compared to predicted node pressures in the model in order to determine approximate locations of leaks.

NIGHT FLOW AND DEMAND MODEL ANALYSIS
Accurate demand model and diurnal patter is instrumental in obtaining reliable results from the hydraulic model.
Also important in advanced analytics related to night-flow analysis and leak detection. Used a combination of billing and AMR data from our 200 pilot meters, historical billing data,
and the mapping of the full list of customers to nodes in the model. Provided invaluable information about the zone, its customers, and flow/consumption
patterns. Night flow analysis helped us develop a more accurate NRW estimate in the zone.
Larger than expected flows during night time hours: 1 AM – 3 AM.

DATA ANALYSIS Includes data from a wide variety of sensors (SCADA data, pressure logger data,
customer billing data, and AMR data). A hydraulic model simulates the behavior of the network under a wide variety of
conditions. The water purveyor’s model needs to be updated and accurate to provide the most up-to-date operational insights. City of SD does this.
Mathematical Optimization Model that runs in unison with the hydraulic model. What is the location of a leak(s) that would best explain the discrepancy between the
ideal no leak model, and the actual data acquired from sensors in the zone? Constant data analysis of flow/pressure to detect anomalous events.

ITERATION 1 ANALYSIS

ITERATION 1 VALIDATION

ITERATION 2 ANALYSIS
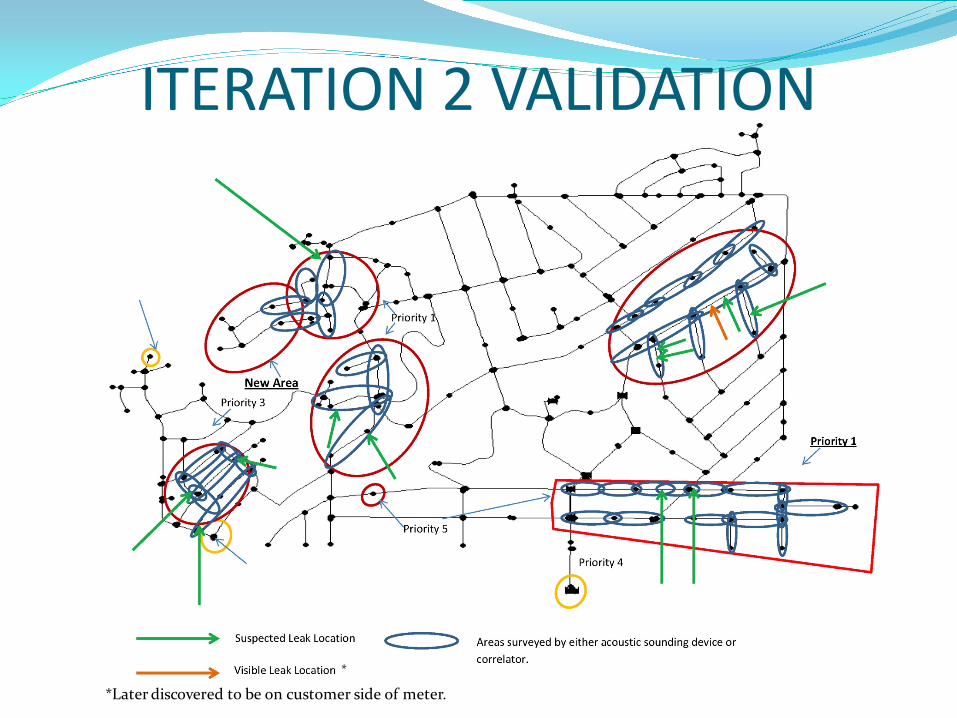
ITERATION 2 VALIDATION
*Later discovered to be on customer side of meter.
*

RESULTS SUMMARY AND CONTINUED ANALYSIS
In locations in which potential leak locations were identified by correlator, we attempted to validate by acoustic sounding methods. Difficult due to nature of pipes.
Potential, suspicious leak locations were identified.
Final validation would require excavation, pot-holing.
Several locations in which the correlator identified peaks or distinct acoustic signatures.
We ruled out locations that corresponded to services, blow-offs, Ts or Crosses, etc.

DEVELOPMENTS SINCE ACOUSTIC TESTING
City follow up and investigation of the suspected locations. Pressure testing at 4 of the locations. No indications of leaks found by City staff.
City investigated all red border valves and Pressure reducing valves. No serious indication of bleeding into lower pressure zones. Any bleeding into lower zones would be considered unaccounted for
water. Investigation into the accuracy / calibration of the flow meter at the
65th & Herrick Pump Station. Discovered malfunction in summer of 2012, manufacturer
recommended replacement. Accuracy and reliability of the flow meter in question during analysis
period. Could severely impact results and estimation of NRW / UFW.
City crews excavated the study’s suspected leak location.

FIELD EXCAVATATION It was agreed upon by all parties that two of the suspected
locations would be excavated by City Staff. The City asked BRADY to provide the two locations that
were most likely to contain a leak. BRADY marked out the two locations in the streets.
1 Location on Klauber Street, 1 Location at the intersection of Broadway & Madera.
On Thursday, August 29th, City of San Diego field operations crews excavated approximately a 10’ stretch of 12” pipe in front of 1875 Klauber Avenue. Location selected through combination of advanced
modeling analysis and acoustic testing.

FIELD EXCAVATATION No leak found at the pipe in Klauber Street. See photos below. It was decided after the first excavation not to move forward with
the excavation of the 2nd location.

FINAL THOUGHTS The NRW / UFW estimate was estimated straight forward
through the data, no technology used to calculate this number. Several potential explanations for high NRW / UFW number.
Inaccuracy of the flow meter at the Pump Station. Bleeding of water into other pressure zones (UFW). Inconsistencies in billing data and customers in the zone. Metering inaccuracies. Fire service/hydrant leaks. Theft. Meter inaccuracies.
Initially we though the likely explanation was leaks at indicated locations. Due to questionable input and other factors, we are no longer sure to a point where further excavation is justified. After City excavation we agree that it is unlikely the leaks in the
suggested areas are the explanation of NRW / UFW. The issue with the flow meter needs to be further explored.
Manufacturer cited a malfunction in summer of 2012 and complete replacement necessary.

LESSONS LEARNED / MOVING FORWARD
Several potential explanations for high NRW / UFW numbers. Zone by zone analysis can provide insight on where to focus NRW
reduction effort. Additional sensors, data analysis, and real time reporting can tell you new
things about the network. Pressure fluctuations in the zone and Pump Station anomalies. Potentially used to understand and respond to system phenomenon quickly
and efficiently. Benefit must outweigh costs.
Data integration from several sources can provide significant benefits in understanding the status in terms of NRW or UFW. The 35% NRW / UFW Estimate that we have found in this zone. This data is to include but is not limited to billing, SCADA, AMR/AMI, pressure and data loggers, and flow meters.
Some indication that the methodology can be successful in identifying suspicious “leak locations” based on acoustic correlating device. However, field verification did not indicate a leak at the once location investigated.
Can be a valuable supplement to acoustic leak detection methods.

LESSONS LEARNED / MOVING FORWARD
Integrate and expand upon what we have learned in the City of San Diego, develop and fine tune the technologies, and apply this application elsewhere, pioneering the expansion into the Smart Water realm. Just a matter of time before this is a widespread application.
Smart Water Applications White Paper released in AWWA Magazine – “Information Engineering” and Water System Management

FINAL BRADY/IBM RECOMMENDATIONS
Investigate the TigerMag flow meter at Pump Station. Remove and test for proper function, reliability and accuracy.
Continue with phased AMR implementation Citywide. “Smart Meters” provide the necessary data to build an accurate demand model. More instrumentation, more data, better results.
In depth zone by zone analysis as done during this study. BRADY / IBM estimated ~ 35% NRW / UFW in this zone. A small number of zones can potentially make up a large portion of the Citywide average. Focus capital improvement efforts and future Smart Water
implementations. Explore pressure management strategies for NRW reduction. Continued efforts in full scale real time monitoring of the
hydraulic network. At this time BRADY / IBM would not recommend expanding
Smart Water leak detection technologies into other City of San Diego pressure zones.

ITEMS NEEDED TO IMPLEMENT THIS TYPE OF LEAK DETECTION STUDY
There needs to be an effective method to validate the results provided in Leak Detection report. (Currently the only method to validate is to excavate the “possible” leak locations) AMR/AMI Technology would provide faster field data collection. A larger sample or perhaps all
water services using AMI/AMR would provide a more accurate depiction of water consumption in the pressure zone being analyzed. This implementation would result in more expenses for the Department.
Additional Pressure Data Loggers to analyze more locations throughout the pressure zone. This implementation would result in more expenses for the Department. Better SCADA communication signals to avoid gap periods during the studies. Customer Support Division to have meter services data that can be sorted by pressure zone. This will require coordination between Customer Support Division Staff and Water
Operations/EPM staff to assign the pressure zone to each meter service in the pressure zone being analyzed. It possibly may require new software for the Customer Support Division.
The hydraulic water model will need to accurately depict each fire hydrant in each pressure zone being analyzed. The elevation of each fire hydrant will need to be accurately labeled in the model. Currently the water model is not detailed to this level.
More Field Crews will need to be assigned to validate the findings of leak detection studies. This requires City leak detection staff and hydraulics crews for standby and traffic control. The larger the pressure zone it is, the more City staff will be required to support the consultants
conducting the studies. It is important to conduct a Cost-Benefit Analysis before implementing this type of leak detection
studies.

SPECIAL THANKS TO THE CITY OF SAN DIEGO
Jesus Meda, PE, Deputy Director, Water System Operations
Stan Medina, Deputy Director, Water Construction & Maintenance
Michael Vogl, Deputy Director, Customer Support Division
Isam Hireish, PE, Senior Civil Engineer, Operations Engineering Section
Johnny Mitchell, Water Systems District Manager, Water Construction & Maintenance
Tatyana Fikhman, Senior Water Distribution Operations Supervisor, Water Systems Operations
Feryal Moshavegh, Associate Civil Engineer, Engineering & Program Management Division
Santiago Crespo, PE, Associate Civil Engineer, Operations Engineering Section
Michael Voss, PE, Assistant Civil Engineer, Operations Engineering Section
Ramon Mesta, SCADA Administrator, Water Systems Operations
Jimmy Evans, Water Systems Technician Supervisor, Water Construction & Maintenance
Aminda Rocha, Water Distribution Operator Supervisor, Water Systems Operations
Provided BRADY/IBM with the necessary data.
Provided the hydraulic model, assistance, and any necessary support and coordination.
Removed old meters, and installed 200 AMR meters.
Coordinated and provided public relations to the residents of the pilot zone.
Procured, installed, and secured the 20 pressure loggers used throughout the zone.
Isolated the zone for the sake of the study. Participated in Bi-Weekly project calls to
ensure successful and efficient progress of the Pilot.
Participated in field investigations and acoustic surveying events.
Provided dedicated staffing for the pilot. Amongst much, much more.

QUESTIONS AND DISCUSSION Thank you for your time!
Feel free to contact me at:
Sean Sudol Richard Brady & Associates
www.RichardBrady.com [email protected]
Phone: 858-634-4566 Fax: 858-496-0505 Cell: 858-361-6559
IBM Israel
Segev Wasserkrug, Ph.D Sergey Zeltyn, Ph.D Eitan Israeli, Ph.D
IBM USA
Peter Williams, Ph.D Cecilia Laverty, PMP
Neptune USA
Andy Bohn Olange Anise
BRADY USA
Richard Brady, PE, BCEE Michael Slawson, PE, PLS
Roland Rossmiller, PE, BCEE Ryan Faherty, EIT
Also Special Thanks and Credit to:


