26
PRELIMINARY REPORT ON STAKE HOLDERS CONFERENCES (11 th AND 12 th April , 2007)

PRELIMINARY REPORT ON STAKE HOLDERS CONFERENCES (11th AND 12th April , 2007)

ANNEX 1
List of Participants from BRAHMATWINN partners Name Organisation Craig Hutton University of Southampton Indrani Gogoi Assam Engineering Institute Ivo Cerny Vodni Jacopo Crimi FEEM Manjari Mehta ICIMOD Manoj Talukdar Assam Engineering College Nayan Sharma IIT Roorkee Padma Sharma Cotton College Partha Ganguly DHSK College Rajesh Thapa ICIMOD S.P. Biswas Dibrugarh University Sanchita Baruah DHSK College Stefan Keinberger Salzburg University Utpal Sarma ARSAC/ASTEC Zoe Matthews University of Southampton Zuzana Boukalova Vodni
The two stakeholders’ meetings - organised on the 11th and 12th April 2007 by IIT Roorkee in the Conference Room at Hotel Brahmaputra Ashok and chaired by Prof. Nayan Sharma - followed the same agenda. TIMING SESSIONS 9:00- 9:30 Registration 9:30-9:40 Welcome Indrani Gogoi – Assam Eng’g. Institute 9:40-9:50 Introduction to Project Nayan Sharma – IIT Roorkee 9:50-10:00 Introduction to Brainstorming Jacopo Crimi - FEEM
10:00-10:50 First Brainstorming question: Issues affecting the river basin Jacopo Crimi - FEEM
10:50-11:20 Coffee break
11:20 -12:10 Second Brainstorming question: Consequences on the river basin Jacopo Crimi - FEEM
12:10-13:00 Third Brainstorming question: Responses and adaptive strategies Jacopo Crimi - FEEM
13:00-14:00 Lunch break 14:00-14:10 Ranking procedure Craig Hutton - GeoData 14:10-14:30 Ranking exercise Craig Hutton - GeoData
14:30-15:15 Project specific presentation: Land Use Classification Validation and Gender concerns
Stefan Keinberger – ZGIS Manjari Mehta - ICIMOD
15:15-15:30 Presentation of Ranking results Craig Hutton - GeoData 15:30-16:00 Coffee break 16:00-16:15 Presentation of Brainstorming results Jacopo Crimi - FEEM 16:15-17:30 Closing Discussion Nayan Sharma – IIT Roorkee
1

11/04/2007 – LIST OF PARTICIPANTS
Name & Designation Organisation Role* Dr. Anjali Baruah Nemcare Hospital. Dr. Archana Sharma Gauhati University A B. Talukdar Public Health Engineering Department GO D. K. Sharma Public Health Engineering Department GO Dr. D.C. Choudhury Population Research Centre, G.U. NA Dr. Aswini Sarma UNESCO Association, Assam chapter. NGO Dr. B. Lahon Assam Fisheries Department GO Dr. D.D. Patgiri BO AACP (LDC) Dr. M. M. Saikia Assam Administrative Staff College A Dr. M.K. Das J’t. Dir. - Directorate of Animal Husbandry GO Dr. Manab Goswami Indian Medical Association, Assam chapter NA Dr. R.K. Goswami Water Resources Department GO Dr. S. Ahmed Gauhati Medical College A Dr. Walter Fernandez NESRC NA Gitanjali Baruah NSMS NGO H.N. Das Ex-Chief Secretary, Assam NA Indrani Sharma RGVN NGO M.U. Ahmed, OSD, PWD Public Works Department - Buildings GO Motika Baruah Voluntary Health Association of Assam NGO Mrinal Gohain Action Aid NGO N.C. Das Water Resources Department GO Ruchie Neog Voluntary Health Association of Assam NGO Saito Basumatary Lawyer for Rights NA Sanjoy Hazarika Center for North East Research NGO Swapan Singh Action Aid NGO Trilochan Baruah Brahmaputra Board GO Tulika Hazarika NSMS NGO V. Das Public Health Engineering Department GO *Note: GO= Government organisation
NGO= Non Government organisation A= Academic
2

12/04/2007 – LIST OF PARTICIPANTS Name & Designation Organisation Anupam Sharma Directorate of Fisheries GO B.Talukdar Public Health Engineering Department GO Bhaskar Jyoti Das Water Resources Department GO Dr. Ashwini Sharma UNESCO Association NGO Dr. M.M. Saikia AASC NA Dr. Manab Goswami Indian Medical Association NA Dr. Naba Sarma NSMS NA Dr. Nitish Das Public Health Engineering Department GO Dr. Partha J. Das AARANYAK NGO Dr. S. Ahmed Gauhati Medical College A H.N. Das Ex-Chief Secretary, Assam NA K.K. Dutta Irrigation Department GO Kavita Devi North-East Electricity Power Corporation,Shillong GO M.C. Baishya Directorate of Agriculture, Assam GO Moushumi Bardalai Pollution Control Board of Assam GO O.P. Pandey Forest Department GO R.K.Mazumdar Revenue Department GO R.N. Das Irrigation Department GO Sanjib Dhar UNESCO Association NGO Trilochan Baruah Brahmaputra Board GO *Note: GO= Government organisation
NGO= Non Government organisation A= Academic
3

ANNEX 2 DAY 1 For the original graph of day 1, summarised in this figure and in the table below, please refer to ANNEX2_1st_day.jpg
DAY 1
Short vision approach 1. only eng. solution ? 2. delayed impact not factored in
DRIVERS GOVERNANCE
Policy lacunae
3. Crumbling government activity 4. uncoordinated development acitivity 5. inadequate planning 6. lack of funds 7. lack of expertise 8. lack of awareness 9. lack of political will 10. lack of ground water policies

Lack of implementation
11. lack of implementation
Inter-state conflict 12. down- and upstream issues 13. Political differences
River transport facility 14. river transport facility
Health status 15. access to services (health... 16. poverty (BPL & vulnerability 17. AIDS
Agriculture activities
18. practice of trad. cultivation 19. drainage facilities 20. traditional fishing 21. fishing communities
Environmental drivers
22. climate change 23. physical characteristics of the river 24. Topography changes 25. Earthquake 26. drought
Industrial development 27. industrial development
Demographic patterns 28. Demographic pressures 29. setllement on river banks 30. immigration
Urban development 31. Urban development
DRIVERS
Socio-political context
32. access to resources (gender 33. issue of gender 34. different capacities (gender 35. increasing child labor
Industry pressures
36. increased quarrying activities 37. boulder extraction 38. effluent from tea gardens 39. effluent from oil industry 40. effluent from paper industry
Hydro power/reservoires 41. hydro power/reservoires Deforestation 42. deforestation
Urban pressures 43. road construction 44. sewerage
Agricultural pressures 45. Agricultural pressures
PRESSURES
Environmental pressures 46. Environmental pressures Sedimentation 47. sedimentation Ground water level 48. ground water level STATE Marshland (water logging 49. Marshland (water logging Impinges on sustainability 50. impinges on sustainability IMPACTS Vicious cycle (poverty – ecology) 51. vicious cycle (poverty – ecology)

Health issues
52. morbidity implications of flood 53. arsenic poisening 54. safe drinking water 55. water-borne diseases 56. pressure on reproductive facilities
Impact on population
57. displaced people 58. collapse of traditional knowledge base 59. migration and destitution 60. poverty of women 61. migration into forest lands 62. urban blight 63. migration to urban areas 64. degraded farm land 65. consulation between man & animal 66. pressure on school infrastructure 67. Drop-out rates 68. marginalisation 69. shifting gender roles 70. lower HDI in affected areas 71. competition
Impact of infrastructure development
72. environmental impacts of infrastructure development
73. current and future constructions
Impact on resources
74. excessive strain on wetland resources 75. Loss of soil and fertility 76. pressure on buffer zones 77. loss of resources to food 78. loss of fishing grounds 79. Erratic course 80. loss of biodiversity 81. ecological hazards
River commission 82. river commission Embankments 83. Embankments
Implementation of laws
84. updating of relief code 85. enforcement of existing ground water policy 86. awareness of present policy 87. effective ground water strategies 88. need for implementable policies
Inter-state coordination 89. inter-state coordination
Holistic approach in policy making
90. Dissemination & implementation of inputs 91. monitoring? 92. understanding of after effects 93. integrate sectoral programs 94. Micro-level studies 95. coordination of research & policy 96. coping strategy --> mitigation to mgt.
Responsiveness of gov. Agencies
97. Early warning system (floods,.. 98. Need for a more responsive government 99. timely intervention 100. need for greater river transport
facilities 101. localised strategies 102. taking indigenous knowledge into
consideration Participatory approach 103. emphasis on participation 104. Participatory form of government
RESPONSES
Alternative options of livelihood 105. synergy of social and technical response

106. relapse to pre-conditions 107. rehabilitation and health issues 108. soil conservation efforts 109. livelihoods & governance
110. rehabilitation policy more focused 111. accountability and transparency
Accountability and transparency 112. transparency in gov. intervention

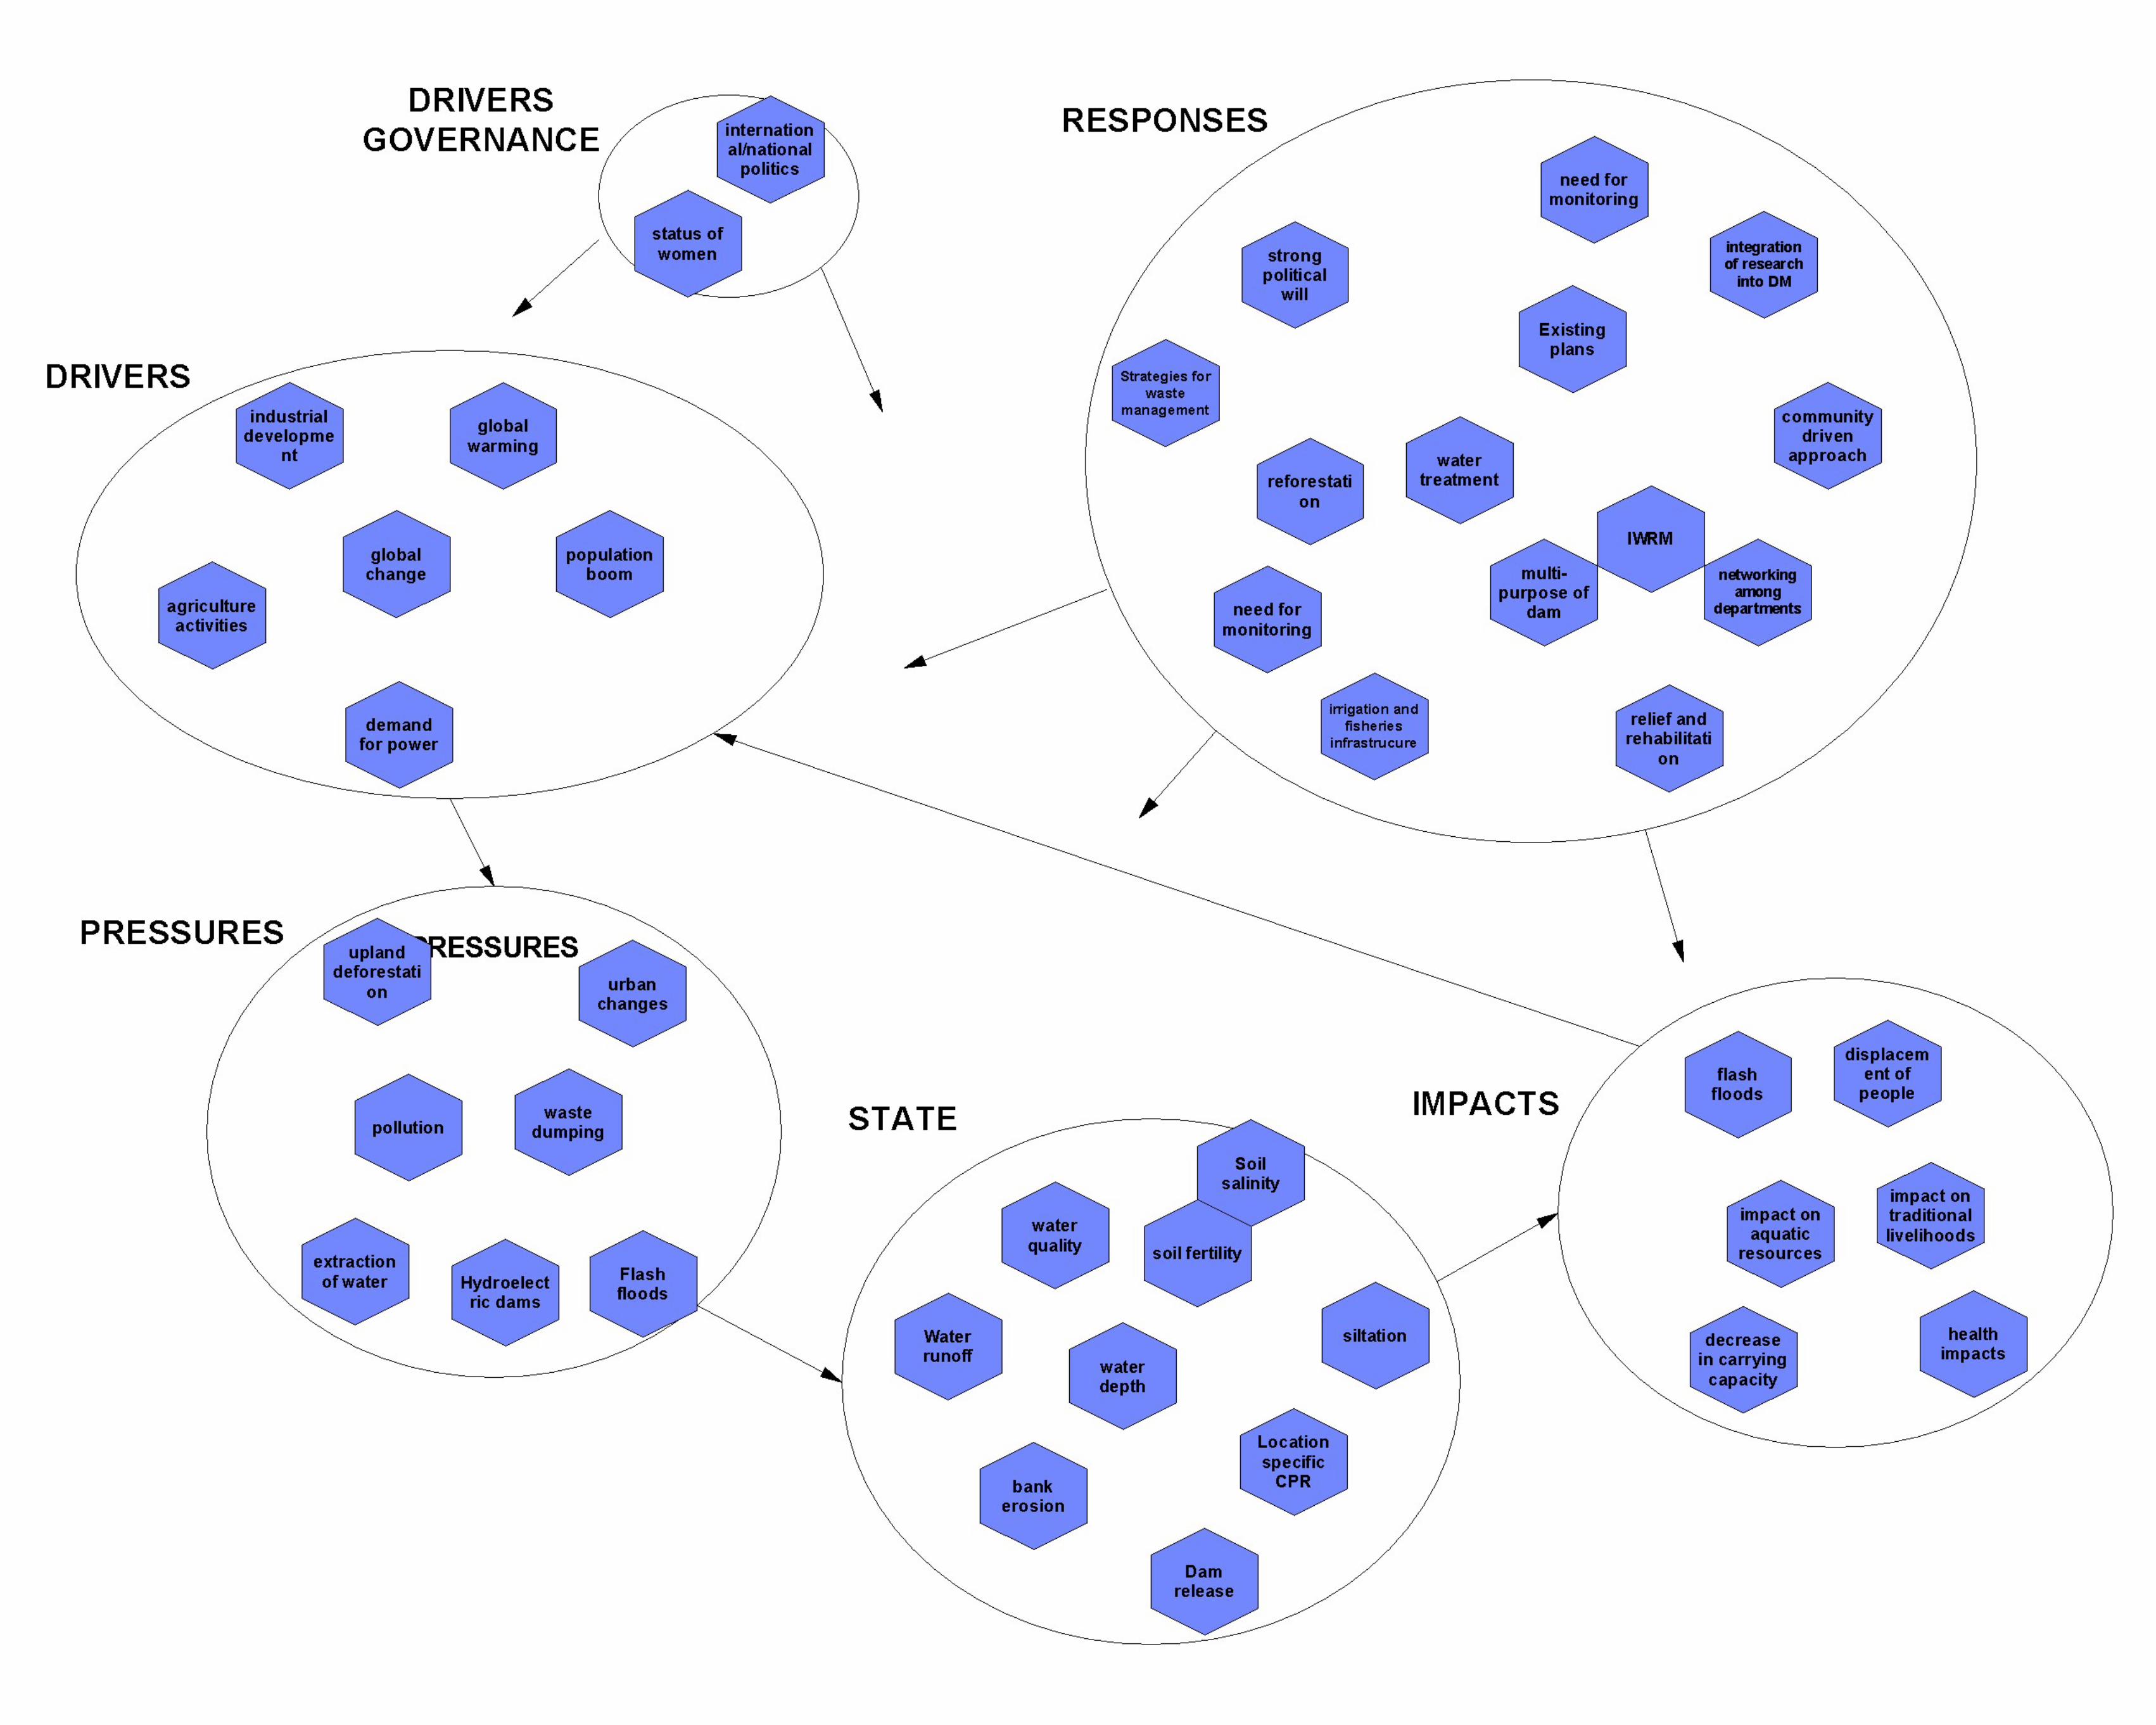
DAY 2 For the original graph of day 2, summarised in the figure and in the tables below, please refer to ANNEX2_2nd_day.jpg
DAY 2
International/national politics
1. Cross boundary issues 2. changing in riperian rights 3. No long term visions and
measures 4. Non cooperation of
participating states 5. Only short term engineering
solutions 6. Non application of state-of-
the art technologies
GOVERNANCE DRIVERS
Status of women
7. gender differential 8. social and psychological
pressures on women
DRIVERS Global warming
9. micro-climate change 10. extreme dry period 11. drought 12. excessive rainfall

13. extreme events Global change 14. changing life style Population boom 15. migration
Industrial development
16. paper industry 17. textile 18. tea plantations 19. oil industry 20. timber 21. extractive industries
Agriculture activities 22. sustainable agriculture 23. traditional agriculture 24. fisheries
Demand for power 25. increasing energy use/per
capita consumption
Hydroelectric dams 26. clean energy 27. dam break 28. induced seismic activity
Upland deforestation 29. firewood use Waste dumping 30. uncontrolled waste disposal
Agricultural pressures
31. Methan emission 32. Irrigation 33. gravity system 34. use of fertilizers 35. increased surface runoff of
fertilizers
Urban changes
36. built-up areas 37. automobile use 38. road construction
Pollution 39. Pollution Extraction of water 40. Extraction of water
PRESSURES
Flash floods 41. Flash floods
Water quality 42. drinking water
Salinity 43. Deposition of agricultural
runoff
Dam release 44. minimum vital flow 45. flooding plain
Water depth 46. Water depth Soil fertility 47. soil fertility Bank erosion 48. bank erosion Siltation 49. Siltation Water runoff 50. Water runoff
STATES
Location specific cpr 51. location specific CPR
Flash floods 52. landslides 53. flash floods
Decrease in carrying capacity
54. decrease in carrying capacity
Health impacts 55. malaria/mosquito
IMPACTS
Impact on aquatic resources 56. changes in ecology
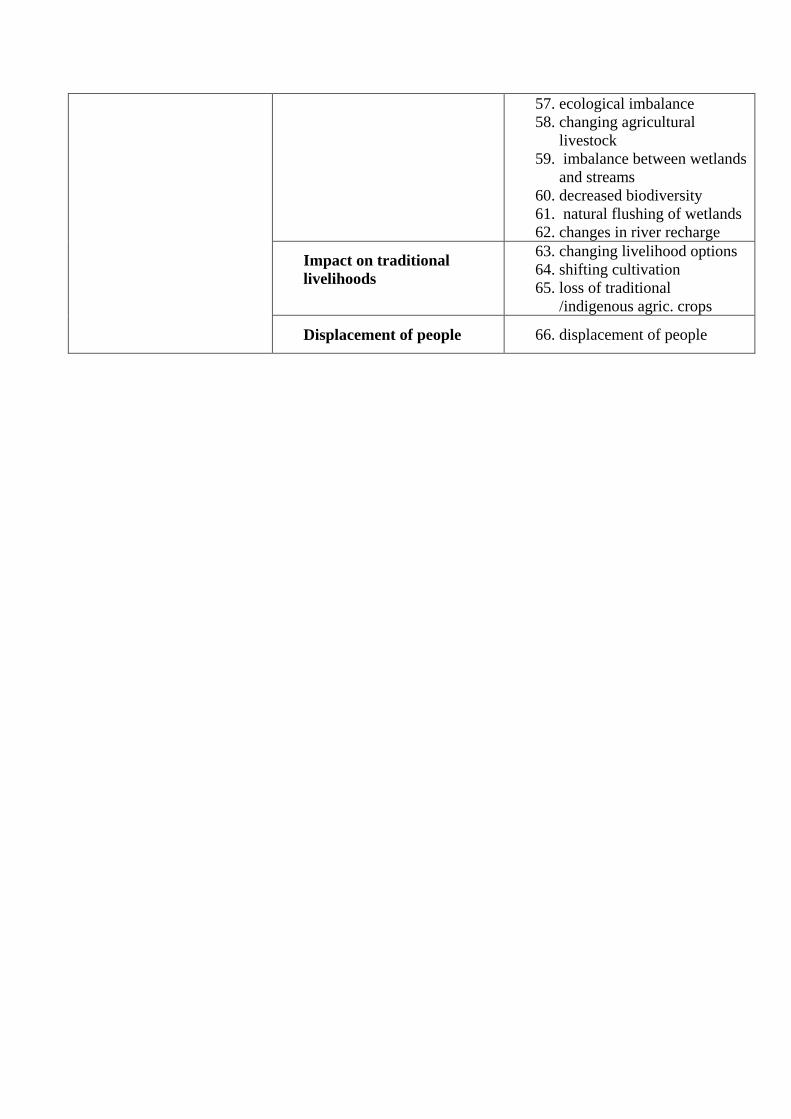
57. ecological imbalance 58. changing agricultural
livestock 59. imbalance between wetlands
and streams 60. decreased biodiversity 61. natural flushing of wetlands 62. changes in river recharge
Impact on traditional livelihoods
63. changing livelihood options 64. shifting cultivation 65. loss of traditional
/indigenous agric. crops
Displacement of people 66. displacement of people

Water treatment
67. provision of safe drinking water 68.
Multi-purpose of dam
69. mini dam construction
Strategies for waste management
70. Strategies for waste management
Integration of research into DM
71. need for monitoring 72. flood & erosion control 73. baseline surveys 74. hazard zonation 75. need for historical studies 76. think tank for binding recommendations 77. social audit of water use 78. implications for health 79. coordination of research work
Relief and rehabilitation
80. relief and resettlement plan 81. habitat structuring 82. employment generation
Reforestation
83. reforestation around green belt 84. aforestation deforestation
Multi-purpose dam
85. unplanned development in flood plain 86. EIA before dam construction 87. dam break analysis
IWRM
88. need for master plan 89. catchment area development plan 90. need for common platform of governm.
in basin 91. regional water policies for local project
impl 92. networking among departments
Existing plans
93. GOI Monitoring Commitee for proper implementation World Bank plan
94. NEWRA - North East Water Resource Authority
95. disaster risk management 96. central state and district disaster
management authorities Irrigation and fisheries infrastructure
97. commercial agriculture 98. facilities for aquaculture 99. restoration of upstream species 100. fish ladder
RESPONSES
Community driven approach
101. participatory approach 102. sustainable livelihood approach 103. enable participatory approach 104. local conflicts & protection 105. involvment of local people in
construction 106. monitoring of current part.
group decision making 107. integrate local mitigation

approaches 108. scaling up 109. enable fora to bring
stakeholders together 110. restoring of local knowledge
Strong political will
111. incentives for personnel working in risk areas
112. strong implementation of laws 113. promote awareness of existing
initatives

1
THE WORKSHOP RESULTS
1.1. THE BRAINSTORMING SESSION
1.1.a. Introduction Within the Brahmatwinn project, the exercise carried out with local experts on April 11th and 12th 2007 in the Hotel Brahmaputra Ashok in Guwahati, is part of the NetSyMoD approach. The NetSyMoD framework methodology is design to support the integration of local experts’ specific knowledge in the research activities, and to involve them effectively in the implementation of the project’s objectives. The main objective of the stakeholders’ meeting was to elicit people’s perceptions on the main problems that affect the case study area, in particular with reference to driving forces, pressures, and responses active within the river basin. The methodology used in Assam is based on Cognitive Mapping (CM): a general term that applies to a series of methods for providing external representations of mental models, functional to the further development of simulation models. CM techniques aim to provide a tool for revealing peoples' subjective beliefs in a meaningful way, usually expressed as networks of nodes connected by causal links. They are useful to gain insights into the problem from different perspectives, and this may then facilitate the evaluation process by identifying divergences and convergences, as well as encouraging negotiations and helping to reduce conflicts. In Assam, a CM technique based on Hodgson’s hexagon mapping was implemented. The experts’ workshop was organised in several phases. In the enrolment phase, the facilitator explained the CM exercise idea and its goals, and introduced participants to the workshop technique. During the brainstorming , individuals contributed ideas through a semi-structured, open discussion, initiated by open questions projected with a beamer in a screen, and providing blank hexagons to be filled with the statements of the experts. Once all participants’ perceptions were collected, the concepts were roughly clustered by the facilitator and shown back to the group. Further comments were integrated as participants reviewed one another's contributions and piggy-back of one another's ideas in a plenary session. Linking concepts and building causal loops for further evaluation was then exploited to initiate discussion around causes and effects, and to come to a shared understanding of the problem. When addressing concerns about the interactions between the environment and society, it is useful to adopt a framework which can help to conceptualise and communicate the existing interdependencies. Within the NetSyMoD approach, the DPSIR - Driving Force-Pressures-State-Impact-Response - framework defined by the European Environmental Agency is deemed a very useful conceptual tool to define in an easy to understand manner the cause-effects relationships at stake.
1.1.b. The DPSIR framework The DPSIR framework allows us to link performances in terms of human behaviour to their consequences for the biophysical environment (outcomes/impacts). It also emphasises the importance of tracing through the causality of effects, thus linking the effects of a driving force (e.g. agricultural activities) to a certain pressure (e.g. nitrogen surpluses) to a change in the state of the natural resource (e.g. depletion of water quality) to a final impact (e.g. eutrophication of water bodies).

2
Thus, in order to evaluate the effects of a policy measure (i.e. a response in the DPSIR terminology), we need to trace through the strength of the arrows linking the different DPSIR elements, as well as tracing the policy process chain of performances to impacts. At the centre of the framework is the current State of the environment and how this has changed over time. State indicators bring to the fore any undesirable changes which need to be combated, (for example, nitrate or pesticide concentrations in water) as well as particularly desirable states which should be preserved. The second step is to identify the Pressures which have brought about undesirable changes or environmental benefits, resulting from the economic activities which have contributed to preserve or enhance the environment. In fact, Pressures could have a negative or a positive Impact on the environment. The third step is to link these pressures and processes to the Driving Forces in the economy (human activities) which are directly influenced by policies. It is at this point that the integration process is applied. Final questions to be answered are: are measures (Responses) having the desired effect? Are they responding quickly enough? Or are they producing unforeseen problems? The DPSIR framework allows the relevant questions to be posed, and the needed information (i.e. the indicators) to be identified. Both brainstorming exercises were thus designed to address these issues.
1.1.c. Management of the sessions During the 1st meeting, the majority of the 28 participants belonged to the social sector, but representatives from a few of the line departments also attended: the Water Resources Department, The Public Health Engineering Department, The Irrigation Department and representatives from the State’s Disaster Management Cell among others. The social experts involved during the first day seemed to have a constructive approach towards the Brainstorming exercise, probably because these techniques are part of their background. However, the DPSIR framework was not explicitly addressed rather; the semi-structured brainstorming exercise was structured around three, very open questions. 1. What are the main issues facing the Brahmaputra river basin in Assam? 2. What are the effects of the identified issues: on the people and their environment? 3. What are the existing strategies? And are there any potential strategies that you can think of?
To avoid potential misunderstanding, the first question was simplified with respect to the original work plan (What are the drivers of change - economic activities, human activities, global patterns… - in the Brahmaputra river basin in Assam?). This strategy did allow to gather a significant number of contributions and to open the floor to a wider discussion over the Brahmaputra river basin. The discussion focused mostly on impacts and governance aspects, both concerning the existing shortcomings and desirable policies to address them. On the other hand, however, the simplified approach produced few contributions on drivers, pressures and states to be considered within the basin for constructing a mental model of the problem based on the DPSIR framework. Therefore during the 2nd meeting, where the majority of the 21 participants had mainly an engineering background, the questions for the semi-structured brainstorming exercise were maintained in their original format: 1. What are the drivers of change (economic activities, human activities, global patterns) in the
Brahmaputra river basin in Assam?

3
2. What are the effects of the identified drivers: on the people and their environment? 3. What are the existing strategies? And are there any potential strategies that you can think of? As expected, the first question was not clearly understood by the participants, and the management of the session needed frequent interventions from the facilitator. However, this common effort led at the end to a clear definition of the underlying causal model, to be considered within the basin. As expected, however, the second meeting did not focus so much on the social impacts of human activities and on current policies shortcomings, which were on the other hand thoroughly discussed in the first meeting. Furthermore, it must be mentioned that a consistent part of the discussion focused on positive and negative issues related to dam management.
1.1.d. Results The preliminary results of the two sessions of the brainstorming exercise, clustered according to the DPSIR framework, are presented in Annex 2 and summarised in Figure 1 and 2 below.
- Orange: contributions of the experts - Green: contributions of the researchers - Blue: title of the clusters
Figure 1: 1st meeting: socio-economic focus
- Yellow: contributions of the experts - Green: contributions of the researchers - Blue: title of the clusters

4
Figure 2: 2nd Meeting: physical focus It therefore clearly emerged that the results of both meetings should be merged together, to gain a more comprehensive picture of the problems currently existing in the Assam basin, and the potential solutions. When possible, the hexagons have been clustered and they have been assigned to one of the categories of the DPSIR framework, although the collocation may be sometimes ambiguous. Once groups of similar contributions were defined, a name able to represent the content of each group was assigned to each of the clusters (blue hexagons in the figure above). As the integration of both experts’ perspective is essential to have a clear picture of all the issues at stake in the river basin, these titles were clustered together among both groups as shown in the figure 3.
Fig.3: Underlying DPSIR model
Starting from the Drivers, two main clusters have been produced thanks to the experts’ contributions:
DRIVERS • Environmental drivers • Global warming • Global change
• Demographic patterns • Population boom
GOVERNANCE DRIVERS • International/national politics • Status of women • Short vision approach • Policy lacunae

5
• Urban development • Industrial development • Agriculture activities
• Demand for power • River transport facility
• Socio-political context • Health status
As for the Pressures these drivers exert on the system under analysis, the results are listed here below: PRESSURES
• Environmental pressures • Urban pressures • Industry pressures • Agricultural pressures
• Flash floods
• Hydroelectric power/reservoirs • Upland deforestation
• Waste dumping • Pollution • Extraction of water
These pressures thus change the State of the environment: STATE
• Water quality • Dam release • Water depth • Soil fertility • Soil Salinity • Bank erosion
• Siltation • Water runoff • Location specific CPR • Sedimentation • Ground water level • Marshland (water logging)
These States do have some Impacts on the people and their environment: IMPACTS
• Impinges on sustainability • Vicious circle (poverty – ecology) • Impact on population • Impact on traditional livelihoods • Displacement of people • Health issues
• Impact on resources • Impact on aquatic resources • Changes in river recharge • Decrease in carrying capacity • Impact of infrastructure development • Landslides • Flash floods
These impacts lead the society to elaborate responses and strategies to cope with them: RESPONSES AND STRATEGIES
• Water treatment • Community driven approach

6
• Multi-purpose of dam • Strategies for waste management • Integration of research into DM • Relief and rehabilitation • Reforestation • Multi-purpose dam • IWRM • Existing plans • Irrigation and fisheries infrastructure
• Crumbling government activity • River commission • Embankments • Implementation of laws • Inter-state coordination • Holistic approach in policy making • Responsiveness of gov. Agencies • Timely intervention • Alternative options of livelihood
As mentioned, a detailed review of the whole set of contributions is presented in Annex 2. The simplified clustering of the contributions as presented in figure 3 allows however to understand a whole range of dynamic processes including the main cause effects relationships active in the basin, the state of the environment which may be monitored to assess the effectiveness of the policies, the common pitfalls of policy itself. More importantly, it allows producing a shared conceptualisation of the problem which can become a basis for discussion in forthcoming meetings or iterations with the interested parties. The aggregations presented in the previous pages are necessarily simplified to present the results in a suitable format; some further understandings of more detailed dynamics are still possible when analysing the problem at a lower scale, as in the figure below.
Fig.4: Example of lower scale analysis

7
1.2 THE DELPHI SESSION During both workshop days a rapid partial Delphi (method for capturing the perceptions of experts) approach was undertaken to asses the expert ranking of census availed data which will be utilised to determine and map vulnerability. The above process provides a clear structure upon which the Delphi approach could build. The ongoing identification of issues and associated discussion provided by FEEM gave the attendant stakeholders a context in which to allow the Delphi process to proceed. During this approach (with day 1 dominated by socio-economic stakeholders and day 2 dominated by engineering participants – please see the participation list), each member of the workshop, including project participants, was asked to asses the significance of the below parameters to flood, drought and bank erosion vulnerability by attributing 40 arbitrary points within the range listed below. There was no restriction on the attribution of points and even the value “0” could be attributed. The final result should add up to 40 in each individual case. DAY 2 DAY 1FLOODMean
6.33 clean water 5.17 clean water4.42 settlements 4.87 livelihoods4.00 livelihoods 4.09 economic alternatives3.92 access to health (emergency) 3.83 access to health (emergency)3.25 economic alternatives 2.96 environment2.92 immigrants/indigenous 2.96 settlements2.75 low income 2.78 low income2.25 environment 2.57 gender2.08 fertility 2.35 access to infrastructure (roads etc)2.08 poor human resource (education etc) 2.22 access to health (long term)2.00 access to infrastructure (roads etc) 1.78 poor human resource (education etc)1.58 access to health (long term) 1.74 fertility1.33 poor social networks 1.52 immigrants/indigenous0.92 gender 1.39 poor social networks
DAY 2 DAY 1DROUGHTMean
8.36 clean water 5.78 clean water4.18 livelihoods 4.70 livelihoods4.18 environment 4.09 economic alternatives3.64 access to health (emergency) 3.91 environment3.55 low income 3.43 low income3.45 economic alternatives 2.65 access to health (emergency)2.73 immigrants/indigenous 2.57 gender1.91 access to health (long term) 2.39 poor human resource (education etc)1.82 fertility 2.22 access to health (long term)1.55 settlements 1.83 fertility1.45 poor human resource (education etc) 1.83 poor social networks1.45 poor social networks 1.43 settlements1.00 gender 1.35 immigrants/indigenous0.82 access to infrastructure (roads etc) 1.22 access to infrastructure (roads etc)
DAY 2 DAY 1EROSIONMean
5.18 settlements 5.57 livelihoods4.73 economic alternatives 4.35 settlements4.45 livelihoods 4.17 economic alternatives3.91 clean water 3.78 environment3.27 environment 3.35 clean water3.27 access to infrastructure (roads etc) 2.65 access to health (emergency)3.18 access to health (emergency) 2.48 access to infrastructure (roads etc)2.55 immigrants/indigenous 2.26 poor human resource (education etc)2.36 access to health (long term) 2.17 gender1.91 poor social networks 2.13 immigrants/indigenous1.73 low income 2.09 low income1.45 fertility 2.00 poor social networks1.27 poor human resource (education etc) 1.52 access to health (long term)0.73 gender 1.04 fertility

8
A total of 50 documents were collected and processed to the results above. The process took approximately half an hour and was intentionally time restricted to try and capture participants’ initial thoughts. The afternoon placement of the session provided a context to the Delphi approach through the extensive discussions of the morning sessions.
The values listed above are simply the mean of the values recorded for both days and give a clear picture of the parameters that are considered as significant for the selected water related hazards identified for research within the context of Brahmatwinn. The WP lead partner will now begin the process of:
1) combining the above 2 days data sets into one data set for analysis; 2) determining the use of the selected parameters in the context of Sensitivity and Adaptive
Capacity and therefore Vulnerability. This approach is based upon the following function: Vulnerability = f(Sensitivity, Adaptive Capacity)
3) Develop Decision Support Tool to allow decision makers to adjust weightings and realise
spatial output of vulnerability in real-time.
1.3 CONCLUSIONS DRAWN FROM THE WORKSHOP SESSIONS Even if the visions gathered during both workshops is biased by the subjective selection of participants, the exercises held allowed the research team to gain a more focused understanding of the key issues affecting actors in Assam basin from their own perspective. The information is very useful in that it can complement, validate or help us reduce the range of factors to consider in the models, which are drawn purely from a technocratic/experts point of view. The true importance of local knowledge can therefore be integrated scientifically and robustly and can furthermore ensure that the project’s findings are indeed relevant for the specific local context. More specifically, both exercises allowed validating the initial list of domains which were identified from the literature review, that is, the relevant aspects that need to be considered in the vulnerability mapping. Joint assessment of underlying DPSIR model and Delphi ranking should allow us to identify the key impacts for the area, thus drawing detailed causal loops for those, and then exploring better the possible responses. The Delphi has allowed WP4 the opportunity to validate the Vulnerability approach by providing specific numbers and rankings to the V=f(S,Ac) which underpins the research approach. In addition the post workshop analysis will influence the internal decision making process that will be undertaken to ensure that the indicators and weightings selected are representative of the current expert knowledge on the ground. This process is further enhanced by the small number of community interviews carried out which allowed the team to validate some of the key findings from both the workshop and the Delphi approach. There is further discussion on the potential validation of this approach in a community context in the appropriate section of the field report (Community visit) The initial intention is to include in the vulnerability mapping approach all parameters which exceed a value of 3 (any figure exceeding 2.8 exceeds the 14/40 average). The specific metric (%, 0-1, etc) of the selected parameters will then be identified and a weighting attributed. This approach

9
will then provide a vulnerability value to be attributed to a given community based upon the census and other household aggregated data sets for Assam. As mentioned, a key point is the representativeness of actors effectively involved with respect to the whole range of active ones. This issue represents a limited risk for the refinement of our analyses as we are in the early stages of the project’s implementation. Furthermore, prior to the second round of consultation with local experts - more focused on Scenario definition - a Social Network Analysis is scheduled to keep the group manageable in size, but allowing all views to be integrated during the same session. It will therefore be necessary to select some participants among the ones which participated in the April 2007 Workshops. Our Indian partners will ask you to fill in a questionnaire which will help us to understand the relationships between you and other experts, as well as your perspective on specific issues. This analysis will lead to reduce the group of experts to a total of about 20 persons, avoiding duplication and knowing in advance potential conflicts between contributors. You will receive this questionnaire at the end of May 2007, together with the final version of the April Workshop report.