IZA DP No. 3035 Brain Drain or Brain Gain? Micro Evidence from an African Success Story Cátia Batista Aitor Lacuesta Pedro C. Vicente DISCUSSION PAPER SERIES Forschungsinstitut zur Zukunft der Arbeit Institute for the Study of Labor September 2007
Transcript
IZA DP No. 3035
Brain Drain or Brain Gain?Micro Evidence from an African Success Story
Cátia BatistaAitor LacuestaPedro C. Vicente
DI
SC
US
SI
ON
PA
PE
R S
ER
IE
S
Forschungsinstitutzur Zukunft der ArbeitInstitute for the Studyof Labor
Any opinions expressed here are those of the author(s) and not those of the institute. Research disseminated by IZA may include views on policy, but the institute itself takes no institutional policy positions. The Institute for the Study of Labor (IZA) in Bonn is a local and virtual international research center and a place of communication between science, politics and business. IZA is an independent nonprofit company supported by Deutsche Post World Net. The center is associated with the University of Bonn and offers a stimulating research environment through its research networks, research support, and visitors and doctoral programs. IZA engages in (i) original and internationally competitive research in all fields of labor economics, (ii) development of policy concepts, and (iii) dissemination of research results and concepts to the interested public. IZA Discussion Papers often represent preliminary work and are circulated to encourage discussion. Citation of such a paper should account for its provisional character. A revised version may be available directly from the author.
Does emigration really drain human capital accumulation in origin countries? This paper explores a unique household survey purposely designed and conducted to answer this specific question for the case of Cape Verde - the African country with the largest fraction of tertiary educated population living abroad, despite also having a fast-growing stock of human capital. Unlike previous literature, our tailored survey allows us to adjust existing inflated “brain drain” numbers for educational upgrading of emigrants after migration. We do so by combining our survey data on current, return and non-migrants with information from censuses of the destination countries. Our micro data also enables us to propose a novel, explicit test of “brain gain” arguments according to which the possibility of own future emigration positively impacts educational attainment in the origin country. Crucially, the innovative empirical strategy we propose hinges on the ideal characteristics of our survey, namely on full histories of migrants and on a new set of exclusion restrictions to control for unobserved heterogeneity of emigrants. Our results point to a very substantial impact of the “brain gain” channel on the educational attainment of those left behind. Alternative channels (namely remittances, family disruption, and general equilibrium effects at the local level) are also considered, but these do not seem to play an important role. Overall, we find that there may be substantial human capital gains from allowing free migration and encouraging return migration. JEL Classification: F22, J24, O15, O55 Keywords: brain drain, brain gain, brain circulation, international migration, human capital,
effects of emigration in origin countries, household survey, Cape Verde, sub-Saharan Africa
Corresponding author: Cátia Batista Department of Economics University of Oxford Oxford OX1 3UQ United Kingdom E-mail: [email protected]
* We would like to thank Pierre-Richard Agénor, Randall Akee, Catalina Amuedo-Dorantes, Raquel Carrasco, Marcel Fafchamps, Alessandra Fogli, Timothy Hatton, David Jaeger, Rocco Macchiavello, Marco Manacorda, Melanie O’Gorman, Silvio Rendon, Gauri Shastry, Francis Teal, Ernesto Villanueva, Robert Willis and Adrian Wood for helpful comments and suggestions. We are indebted to Paul Collier for providing initial encouragement for this research project. We are also grateful to seminar participants at Oxford, Manchester, Bank of Spain, and at the Oxford CSAE 2007, IZA/World Bank 2007, and Chicago ESPE 2007 conferences and IZA/SOLE Transatlantic Meeting 2007. We acknowledge financial support from the ESRC-funded Global Poverty Research Programme (GPRG) for the tailored household survey conducted in Cape Verde on which this paper is based. We are indebted to the dedicated team of local enumerators with whom we worked, and to Deolinda Reis and Francisco Rodrigues at the National Statistics Office of Cape Verde. Research assistance was provided by Mauro Caselli, under the financial support of the George Webb Medley Fund at the Department of Economics of the University of Oxford.
1. Introduction 3 2. Cape Verde: a short introduction to the country 6 3. Data sources: tailored household survey and other sources, descriptive statistics. 7 4. Impact of emigration on the educational attainment of those who leave the country 9
4.1. Counterfcatual educational attainment of emigrants who are residing abroad 9 4.2. Counterfactual educational attainment of returning emigrants 12
5. Impact of emigration on the educational attainment of those left behind 13 5.1. Impact of household emigration on educational attainment 14 5.2. Impact of probability of own future migration and of other migration channels on educational attainment 16 5.3. Why does the own future probability of migration matter for educational decisions? 19 5.4. Counterfactual education of those who do not emigrate 21
6. Some counterfactual numbers on the “brain drain” vs. “brain gain” controversy 22 7. Concluding remarks 24 8. References 25 Appendix A: Growth accounting 27 Appendix B: Household survey 28 Appendix C: Classification of educational attainment 29 Figures 31 Tables 34
3
1. Introduction
International migration flows have been rapidly increasing in the last decades,1 bringing this topic to the
forefront of policy debates. In particular, migration of the highly educated from poor to rich countries (broadly
labeled “brain drain”) has deserved special attention.2 Whereas host countries and their immigration policies
tend to consider skilled immigration favorably in terms of domestic impact, there are widespread worries
about the potentially negative consequences of extensive emigration of the brightest for origin countries.
However, most questions regarding the quantitative impact of emigration on human capital accumulation or
economic growth performance of origin countries remain unanswered.
This paper examines whether emigration really drains human capital accumulation in origin countries, as is
commonly perceived. For this purpose, it uses a unique household survey purposely conducted to answer our
research question at the micro level, unlike existing literature. Our focus is on the case of Cape Verde –
reportedly the African country with the largest fraction of educated population living abroad,3 while
simultaneously displaying substantial numbers for human capital growth since 1990.4 These are apparently
contradictory facts under the light of traditional “brain drain” theories. Reconciling them is an additional
motivation for our study.
Concerns about “brain drain” (a general label for the depressing effects of the loss of the most educated
national citizens) are well rooted in the economics literature.5 These negative effects include the
disappearance of a critical mass in production, research, public services (notably health and education) and
political institutions. The impact of this departure may be particularly large given the special role of human
capital in production: positive externalities from the interaction of the most educated, or complementarities
with factors of production such as capital equipment or total factor productivity, are likely to magnify the
productive contribution of skilled workers.6 In addition, massive emigration of the most educated could entail
fiscal losses due to foregone revenues from public investment in the human capital of those who emigrate.
In recent years, the economic literature has turned its attention to the potential gains of emigration. In
particular, a new “brain gain” literature has emerged, proposing that the possibility of own future emigration
may prompt a net increase in the rate of human capital accumulation in origin countries.7 This would happen
if expected returns to education increased with the possibility of emigrating (as would be the case if host
1 Chiswick and Hatton (2003) offer a detailed description of this historical evolution and underlying mechanisms. 2 See, for instance, World Bank (2006a, 2006b). 3 Our source is Docquier and Marfouk (2006), who report this skilled emigration rate to be 67.5%. 4 As is shown in Appendix A, over the period 1990-2005, the stock of human capital in Cape Verde grew at an annual rate of 3.5%. In addition, according to our growth accounting results, human capital accumulation is the aggregate input most strongly related to the excellent growth performance of the Cape Verdean economy over those 15 years. 5 The traditional brain drain literature was notably developed by Gruber and Scott (1966) and Bhagwati and Hamada (1974). 6 The external effect of human capital on production was first modeled by Lucas (1988), and further discussed by Borjas et al. (1992) in the context of migration. Complementarities in aggregate production are discussed and empirically evaluated by Stokey (1996) and Krusell et al. (2000), respectively, among others. 7 Miyagiwa (1991), Mountford (1997) and Stark et al. (1997, 1998) were the main proponents of the “brain gain” hypothesis.
4
countries have higher returns to education than origin countries) and enough skilled individuals decided not to
emigrate when uncertainty is resolved.
Emigration may additionally generate human capital gains to origin countries through remittances, return
migration and “diaspora” or network effects. Indeed, the importance of international remittances has been
recently emphasized in the literature, basically on the grounds that they reduce financial constraints in
receiving countries that may reduce poverty and increase investment on both physical and human capital
investments.8 Return migrants may also be beneficial to their home country as they bring with them not only
financial savings, but also a set of newly acquired productive skills (either through formal schooling or on-the-
job learning) that positively contribute to a country’s stock of human capital.9 In addition, recent evidence
underlines the “diaspora effect” of migration networks in fostering investment and trade with the origin
countries,10 which may increase the demand for high-skilled workers at the domestic level.
In order to make our research question tractable, this paper takes a restricted perspective of the “brain drain”
vs. “brain gain” debate in the literature: we focus only on measuring the educational losses and gains caused
by emigration to its origin country. This narrow focus enables us to provide quantitative answers to the
question at stake, while considering a variety of channels suggested by theory.
The existing empirical literature on the relation between migration and human capital is scarce and
incomplete, in the sense that it cannot provide a full answer to our research question. In an improvement to the
cross-section work of Faini (2006) and Beine et al. (2001, 2003), Beine et al. (2007) use a panel of countries
from 1975 to 2000 to obtain partially supportive evidence of a “brain gain” hypothesis defined at a macro
level. This approach has the advantage of distinguishing between countries that are more or less affected by
“brain gain” – only in poorer countries with sufficiently low emigration rates does human capital
accumulation seem to benefit from skilled emigration. However, the simplistic definition of “brain gain” at the
macro level (as the change in the country’s tertiary schooling of natives due to migration of skilled workers)
misses potentially important individual heterogeneity and is, by design, incapable of identifying the channels
through which these positive effects work.
Our study overcomes these limitations by using micro data from our purposely designed household survey.
This dataset allows us to consider issues like “brain circulation” by distinguishing between current, return and
non-migrants. Indeed, we can measure the educational selection of those who do not reside in the country and
adjust it for educational upgrades abroad, because we combine our survey data (including the full history of
migrant characteristics) with information from censuses of the destination countries. Moreover, and unlike
previous literature, our micro data enables us to explicitly test and find supportive evidence to the original
8 Evidence of the positive effects of remittances on education and investment is provided, among others, by Edwards and Ureta (2003) for El Salvador, Yang (2006) for the Philippines and Mishra (2006) for several Caribbean countries. Moreover, as discussed by Ratha (2003) sizable and stable (countercyclical) remittance flows are capable of improving a country’s credit worthiness, improving its overall external financial situation with positive consequences at the domestic credit market level, an additional channel through which education may be affected. 9 See Dustmann and Kirchkamp (2003) and Mesnard and Ravallion (2006) on this topic. 10 See for instance Rauch and Trinidade (2002) and Javorcik et al. (2006).
5
“brain gain” hypothesis, according to which individual schooling decisions depend on her own future
probability of migration. This represents, to the best of our knowledge, the first such explicit and direct test in
the literature. The empirical strategy we introduce hinges crucially on the full histories of migrants and on a
new set of exclusion restrictions collected in our survey that allow us to control for unobserved heterogeneity
of emigrants.
This paper is also related to those by Hanson and Woodruff (2002) and McKenzie and Rapoport (2006), in
which individual data are used to estimate the effect of having a migrant in the household on the educational
attainment of Mexican children. In addition to answering this question for the case of Cape Verde, but unlike
what is done in these studies, we explicitly test for the original “brain gain” hypothesis, and control for the
importance of other potential channels through which emigration may affect educational attainment.
Our answer to this paper’s research question of whether emigration causes human capital losses or gains for
the sending country follows a three-step strategy that we now turn to describe.
We begin by examining the educational attainment of those who emigrated by combining information in our
survey with census data from the main destination countries. This allows evaluation of the actual human
capital losses and gains entailed by emigration out of the origin country, which have been typically
exaggerated in the literature mainly because it has not addressed educational gains at the destination country
after emigration. In measuring “brain drain” (defined as the fraction of skilled emigration as a percentage of
all nationals), we adjust individual educational attainment for this type of skill upgrading, which we estimate
with reference to what it would have been if these individuals had not left the country. In doing this, we
consider separately emigrants who currently live abroad and return migrants.
Our second step and contribution is to estimate the effects of emigration on the educational attainment of the
non-migrants who are left in the origin country. For this purpose, we offer a novel estimation method designed
to explicitly test for the original “brain gain” theory according to which individual schooling decisions depend
on her own future probability of migration. Taking advantage of the characteristics of our survey, we account
for individual heterogeneity by using past histories of migrants and an innovative set of exclusion restrictions
to estimate the schooling impact of their own probability of future migration. Because other migration
channels may also be at work, we control for family disruption variables and (endogenous) remittances, as
well as potential general equilibrium (at the local level) effects of emigration in this empirical analysis. These
channels do not, however, seem to be as relevant as previous literature would suggest.
To conclude our analysis, we quantitatively evaluate the “brain drain” vs. “brain gain” controversy under two
different counterfactual scenarios. The first counterfactual, of most conceptual interest, considers the situation
in which emigration is banned, and therefore allows us to measure the net impact of emigration on the
distribution of educational attainment in the origin country. This counterfactual distribution provides us with a
summary answer to the “brain drain” vs. “brain gain” question. The second counterfactual scenario assumes
that all current emigrants are obliged to return home, an ideal option for some policy makers. Our results point
to this hypothetical massive return having a generally positive impact (although at a small scale) on the stock
6
of educated individuals of the origin country. On the contrary, the effects of banning international emigration
would be substantially negative, importantly because this would shut down longer term positive effects on the
educational attainment of the origin country’s labor force.
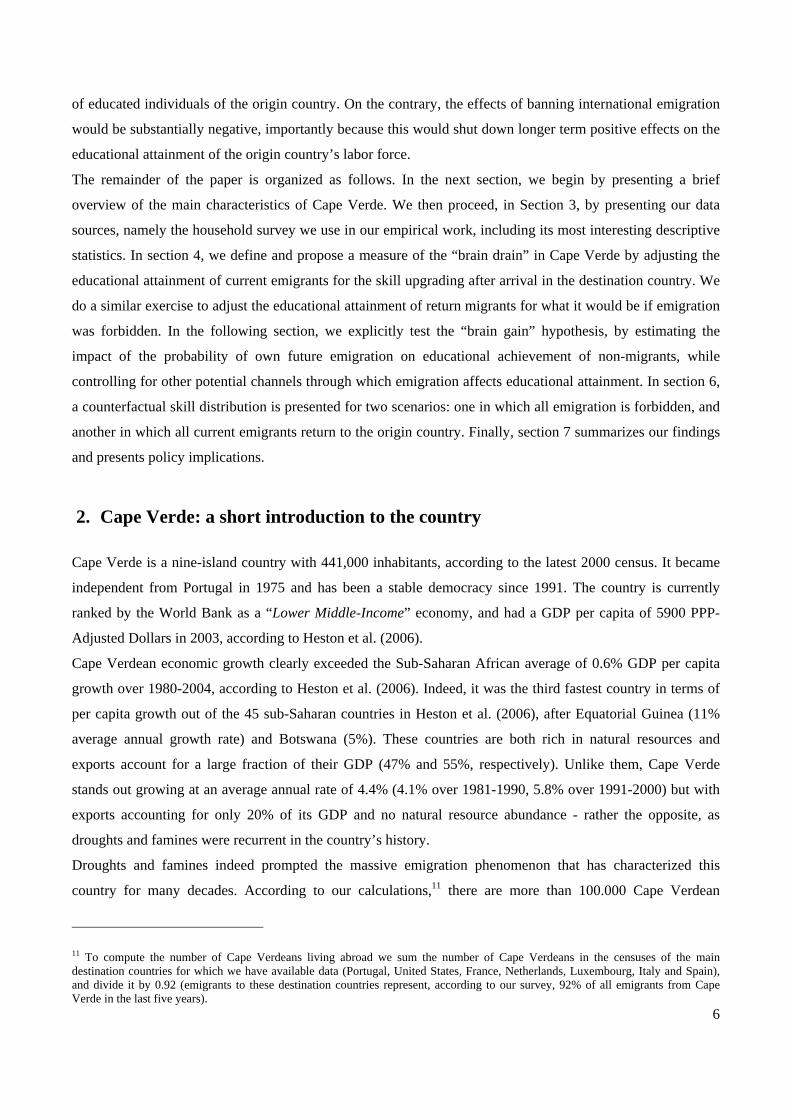
The remainder of the paper is organized as follows. In the next section, we begin by presenting a brief
overview of the main characteristics of Cape Verde. We then proceed, in Section 3, by presenting our data
sources, namely the household survey we use in our empirical work, including its most interesting descriptive
statistics. In section 4, we define and propose a measure of the “brain drain” in Cape Verde by adjusting the
educational attainment of current emigrants for the skill upgrading after arrival in the destination country. We
do a similar exercise to adjust the educational attainment of return migrants for what it would be if emigration
was forbidden. In the following section, we explicitly test the “brain gain” hypothesis, by estimating the
impact of the probability of own future emigration on educational achievement of non-migrants, while
controlling for other potential channels through which emigration affects educational attainment. In section 6,
a counterfactual skill distribution is presented for two scenarios: one in which all emigration is forbidden, and
another in which all current emigrants return to the origin country. Finally, section 7 summarizes our findings
and presents policy implications.
2. Cape Verde: a short introduction to the country
Cape Verde is a nine-island country with 441,000 inhabitants, according to the latest 2000 census. It became
independent from Portugal in 1975 and has been a stable democracy since 1991. The country is currently
ranked by the World Bank as a “Lower Middle-Income” economy, and had a GDP per capita of 5900 PPP-
Adjusted Dollars in 2003, according to Heston et al. (2006).
Cape Verdean economic growth clearly exceeded the Sub-Saharan African average of 0.6% GDP per capita
growth over 1980-2004, according to Heston et al. (2006). Indeed, it was the third fastest country in terms of
per capita growth out of the 45 sub-Saharan countries in Heston et al. (2006), after Equatorial Guinea (11%
average annual growth rate) and Botswana (5%). These countries are both rich in natural resources and
exports account for a large fraction of their GDP (47% and 55%, respectively). Unlike them, Cape Verde
stands out growing at an average annual rate of 4.4% (4.1% over 1981-1990, 5.8% over 1991-2000) but with
exports accounting for only 20% of its GDP and no natural resource abundance - rather the opposite, as
droughts and famines were recurrent in the country’s history.
Droughts and famines indeed prompted the massive emigration phenomenon that has characterized this
country for many decades. According to our calculations,11 there are more than 100.000 Cape Verdean
11 To compute the number of Cape Verdeans living abroad we sum the number of Cape Verdeans in the censuses of the main destination countries for which we have available data (Portugal, United States, France, Netherlands, Luxembourg, Italy and Spain), and divide it by 0.92 (emigrants to these destination countries represent, according to our survey, 92% of all emigrants from Cape Verde in the last five years).
7
currently residing abroad, or about 19% of all nationals. Docquier and Marfouk (2006) estimate the
percentage of the highly educated labor force of Cape Verde living abroad at 67.5% - the largest such number
in the African continent. In addition, the magnitude of international remittances received in Cape Verde is
impressive: as shown in Fig. 1, these flows account for 16% of GDP on average over 1987-2003 (according to
the World Bank, 2006c). Moreover, we should note that these are official numbers, likely underestimated as
they do not include informal channels. These figures are again the largest in sub-Saharan Africa and translate
the especially important role of remittances for the country, particularly given the relative magnitude when
compared to aid and foreign direct investment inflows.
A final note is deserved by the educational system in Cape Verde, which potentially provides the supply side
restrictions to our question of interest. This functions remarkably well, particularly for sub-Saharan African
standards, at least until the university level. Primary (six years of schooling) and secondary schooling (six
further years) are widely available at the local level (there is at least one secondary school per municipality,
even more so at the primary level). Higher education institutions only started working in the country in 1995
and are located in the capital island.
3. Data sources: tailored household survey and other sources, descriptive
statistics.
3.1. Data sources
Our empirical work is mainly based upon a household survey on migration and the quality of public services
purposely designed to answer our research questions. The survey was conducted in Cape Verde from
December 2005 to March 2006, as detailed in Appendix B. It is based on a representative sample of resident
households (including both non-migrants and returning migrants), which also provide information on a large
sample of current emigrants.
As detailed in the following sections, our survey seems to accurately depict the migration reality in Cape
Verde except for the fact that it misses a particular type of emigrants: those who did not leave family behind.
In order to correct for the selection bias potentially induced by this absence, we use census data characterizing
Cape Verdean immigrants in their main destination countries.12 This information allows us not only to
estimate the stock of emigrants abroad, but also to examine observable characteristics of emigrants, such as
gender, age and education. This information proves particularly important to precisely measure “brain drain”,
and adjust it for emigrants’ educational upgrades abroad.
12 The main destination countries for which we have available census data are: Portugal, United States, France, Netherlands, Luxembourg, Italy and Spain. We used the 5% sample of the American census from IPUMS (Ruggles et al., 2004). Information on Cape Verdeans in Portugal was provided by the National Statistics Office of Portugal and information for other European countries was taken from Eurostat.
8
A limitation of our survey is its relatively small sample size for some of our analysis purposes, such as to
obtain exact measures of household expenditure or to estimate rates of return to education. In order to mitigate
this problem, we complement our dataset with the Income and Expenditure Household Survey, which was
designed and conducted by the National Statistics Office (INE) in 2002-2003, under the sponsorship of the
World Bank.
At different stages of this paper, we also make use of various sources of data, namely the 1990 and 2000
censuses of Cape Verde, as well as additional national accounts, demographic and labor market data from
INE.
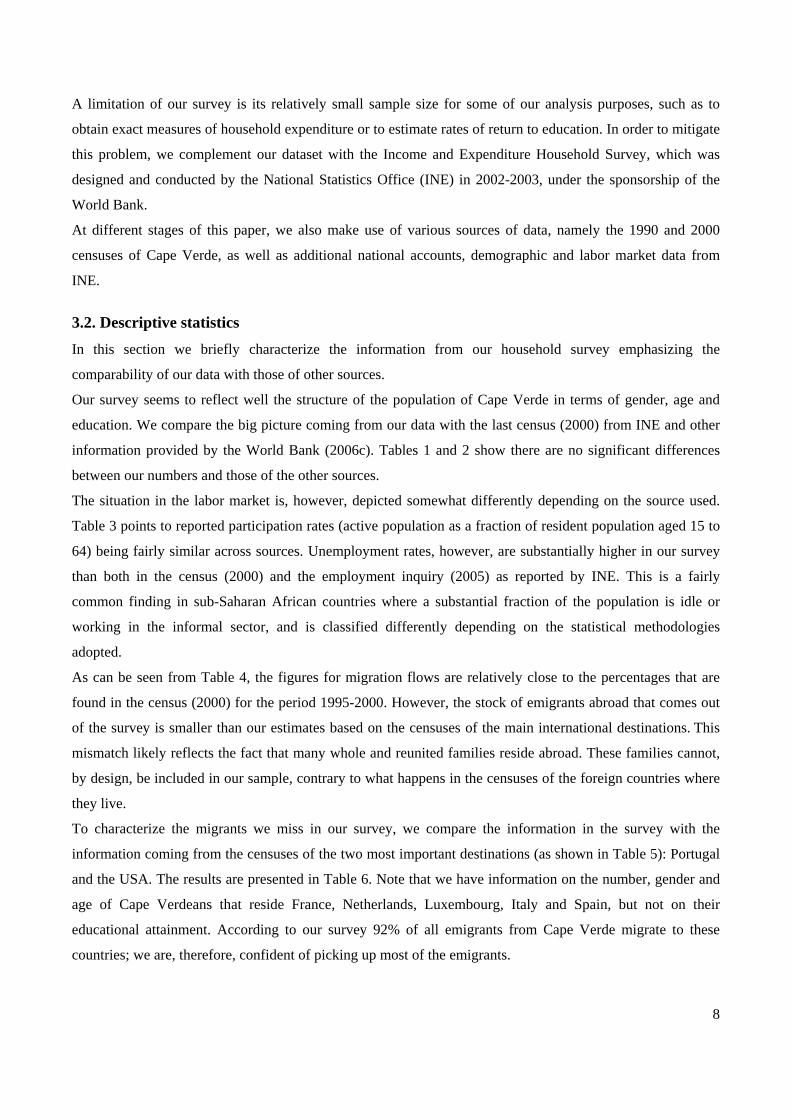
3.2. Descriptive statistics
In this section we briefly characterize the information from our household survey emphasizing the
comparability of our data with those of other sources.
Our survey seems to reflect well the structure of the population of Cape Verde in terms of gender, age and
education. We compare the big picture coming from our data with the last census (2000) from INE and other
information provided by the World Bank (2006c). Tables 1 and 2 show there are no significant differences
between our numbers and those of the other sources.
The situation in the labor market is, however, depicted somewhat differently depending on the source used.
Table 3 points to reported participation rates (active population as a fraction of resident population aged 15 to
64) being fairly similar across sources. Unemployment rates, however, are substantially higher in our survey
than both in the census (2000) and the employment inquiry (2005) as reported by INE. This is a fairly
common finding in sub-Saharan African countries where a substantial fraction of the population is idle or
working in the informal sector, and is classified differently depending on the statistical methodologies
adopted.
As can be seen from Table 4, the figures for migration flows are relatively close to the percentages that are
found in the census (2000) for the period 1995-2000. However, the stock of emigrants abroad that comes out
of the survey is smaller than our estimates based on the censuses of the main international destinations. This
mismatch likely reflects the fact that many whole and reunited families reside abroad. These families cannot,
by design, be included in our sample, contrary to what happens in the censuses of the foreign countries where
they live.
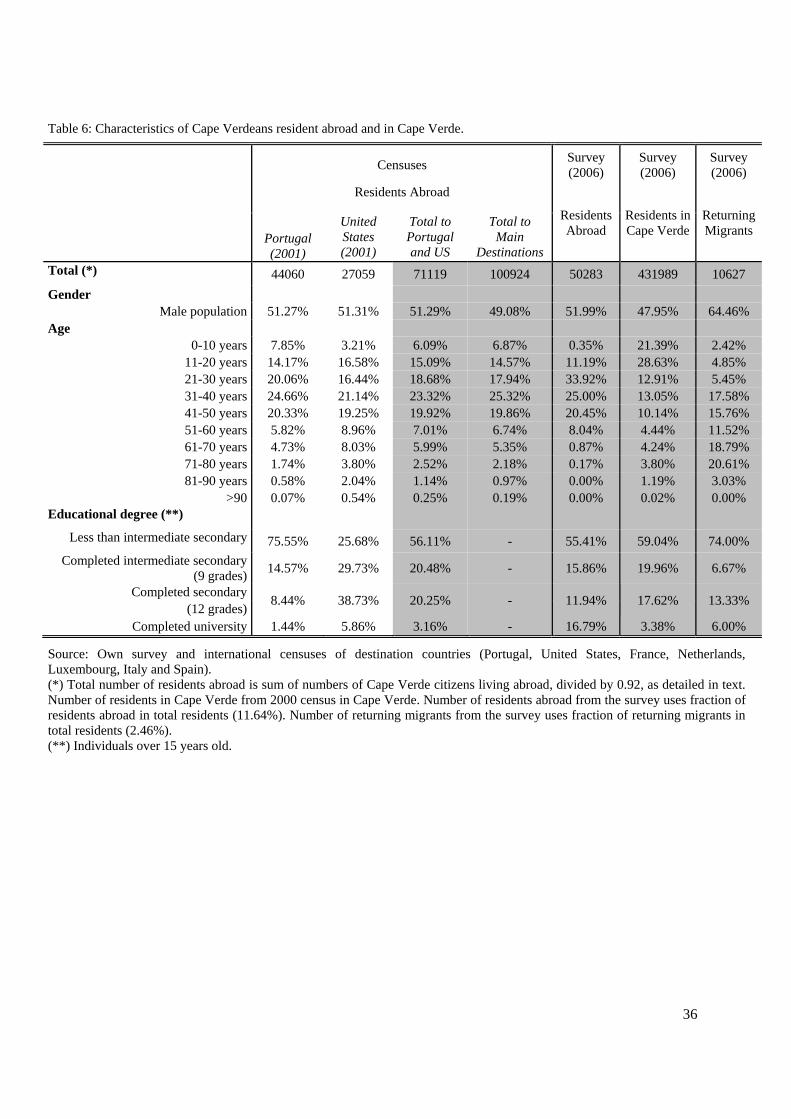
To characterize the migrants we miss in our survey, we compare the information in the survey with the
information coming from the censuses of the two most important destinations (as shown in Table 5): Portugal
and the USA. The results are presented in Table 6. Note that we have information on the number, gender and
age of Cape Verdeans that reside France, Netherlands, Luxembourg, Italy and Spain, but not on their
educational attainment. According to our survey 92% of all emigrants from Cape Verde migrate to these
countries; we are, therefore, confident of picking up most of the emigrants.
9
The educational attainment of Cape Verdean residents abroad is only available in the censuses for Portugal
and the United States, which host almost 75% of all Cape Verdean emigrants. This is shown in Table 6. We
observe that the educational characterization of emigrants is very different in these censuses and in our survey.
Namely, the survey displays a much larger fraction of emigrants with higher education. This is probably due
to the fact that the survey misses information about complete household emigration, thereby increasing the
relative weight of those individuals who emigrated alone with the purpose of pursuing higher education. We
will therefore use data from the censuses as our main source to characterize residents abroad in the next
section.
4. Impact of emigration on the educational attainment of those who leave the
country
In this section we characterize the educational attainment of those who leave Cape Verde. Most importantly,
emigration implies the loss of a selected group of individuals, which has a direct impact on human capital
remaining at the origin country. This loss has been conventionally labeled as “brain drain”. Existing literature
measuring the magnitude of this “brain drain” has, however, failed to take into account that those who
emigrate may upgrade their skills abroad. It is likely, for instance, that individuals who emigrate as children
get an education very different from the one they would have obtained if they had stayed in Cape Verde. We
also know that a non trivial fraction of the emigrant population will not stay abroad forever and there will be a
selected group of people who will come back while still in the labor force, possibly bringing new skills that
could be valuable in the Cape Verdean labor market – this entails the possibility of a “brain gain” through
return migration.
For the above mentioned reasons, it will be useful to take into account the effect of emigration on the
educational attainment of two main groups: emigrants who are currently residing abroad and returning
migrants who are already residing in Cape Verde.
4.1. Counterfactual educational attainment of emigrants who are residing abroad
We begin this section by computing a narrow measure of “brain drain”, defined as the proportion of high
skilled Cape Verdeans living abroad. Using data from the destination country censuses, we calculate the
“brain drain” measures displayed in Table 7.13 Our results show that the probability of emigration for a high
skilled Cape Verdean (university degree holder) is 24.68%, very far away from the 67.5% reported by
13 Note that the characteristics of the “average resident abroad” in this and following tables are computed using data from destination country censuses, assuming that this average emigrant is 60% in Portugal and 40% in the United States. This assumption is further justified below.
10
Docquier and Marfouk (2006), who provide the only existing numbers for “brain drain” in Cape Verde.14
Even though the loss appears to be slightly higher (27.23%) when considering our group of secondary school
graduates (which includes individuals with some college, overlapping with Docquier and Marfouk (2006)’s
definition of high skilled), this small magnitude cannot be reconciled with the observed large difference in
“brain drain” numbers. Most likely this difference is due to Docquier and Marfouk (2006)’s source of data on
educational attainment for residents in Cape Verde,15 in addition to discrepancies in the classification of
educational degrees.16
The order of magnitude of our results is in line with an overall probability of emigration of 25.2%, together
with only scarce evidence of emigrant selection (defined as the proportion of skilled emigrants in the total
emigration stock relative to the proportion of skilled individuals in the resident population). This evidence is
shown in Table 8, where the educational attainment of emigrants seems very similar to that of residents: there
is only a slightly higher proportion of emigrants who complete secondary education (12 years of schooling),
compensated by a lower fraction of individuals who did not even complete intermediate secondary schooling
(9 grades).17
Using information on the educational attainment of emigrants to Portugal and the United States (displayed in
Table 6), we uncover finer patterns of emigrant selection than those provided by aggregate numbers. Actually,
there seems to be positive selection for emigrants to the United States, whereas emigrants residing in Portugal
do not appear to be much different from residents in Cape Verde (if anything, they seem to be less educated).
Two potential explanations may be underlying this fact: either positive selection in the United States is much
stronger than in Portugal, or there is important educational upgrading after emigrant arrival to the United
States.18 We therefore turn our attention to disentangling which part of the educational distribution of
emigrants is due to selection at the date of emigration, and which part is due to human capital gains derived
from residing in the United States.19 For this purpose, we compare the educational attainment of Cape
Verdeans depending on their place of residence, age and gender, and then relate existing differences with the
age of entry of Cape Verdean immigrants in the US.
Our first step is to estimate the probability of completing a certain degree for Cape Verdean residents using
our own survey. This probability is given by
14 Carrington and Detragiache (1998) and Collier et al. (2004) provide numbers for several African countries, but not for Cape Verde. 15 For most developing countries, Docquier and Marfouk (2006) use Barro and Lee (2001) as their source of information on educational attainment. This is missing for Cape Verde, and the criterion indicated for these cases is to use “neighboring countries”. 16 Comparability of classifications of educational degrees in Cape Verde, the United States and Portugal are discussed in Appendix C. 17 This is generally in line with intermediate selection found in the case of Mexico by Chiquiar and Hanson (2005) and Lacuesta (2006). It is, however, in apparent contrast with the selection pattern presented by Docquier and Marfouk (2006). This is because the way of classifying individuals “with some college” makes an important difference. In origin data sets, including our survey, we could only identify individuals who completed university. Therefore, we should treat “some college” as “completed secondary”. Otherwise, the “completed university” group would increase disproportionately (from 3% to around 15%). This explains the difference between the selection pattern we identify and that of Docquier and Marfouk (2006). 18 Rosenzweig (2007) presents evidence supportive of the importance of educational upgrading by international students in the US. 19 Based on the United States census (2001) data, Table 9 presents information on the age of entry of Cape Verdean emigrants to the United States. A large fraction of these (45%) enters the country under 20 years old and it is likely that at least some of these individuals decide to increase their educational attainment after arrival.
Finally, still using the United States census (2001), we estimate how computed differences depend on gender,
age, and age of entry.
∑=
=++++=}90,...4{
23210 )_(1
kiki kmigAgeageageGenderDifference γγγγγ (3)
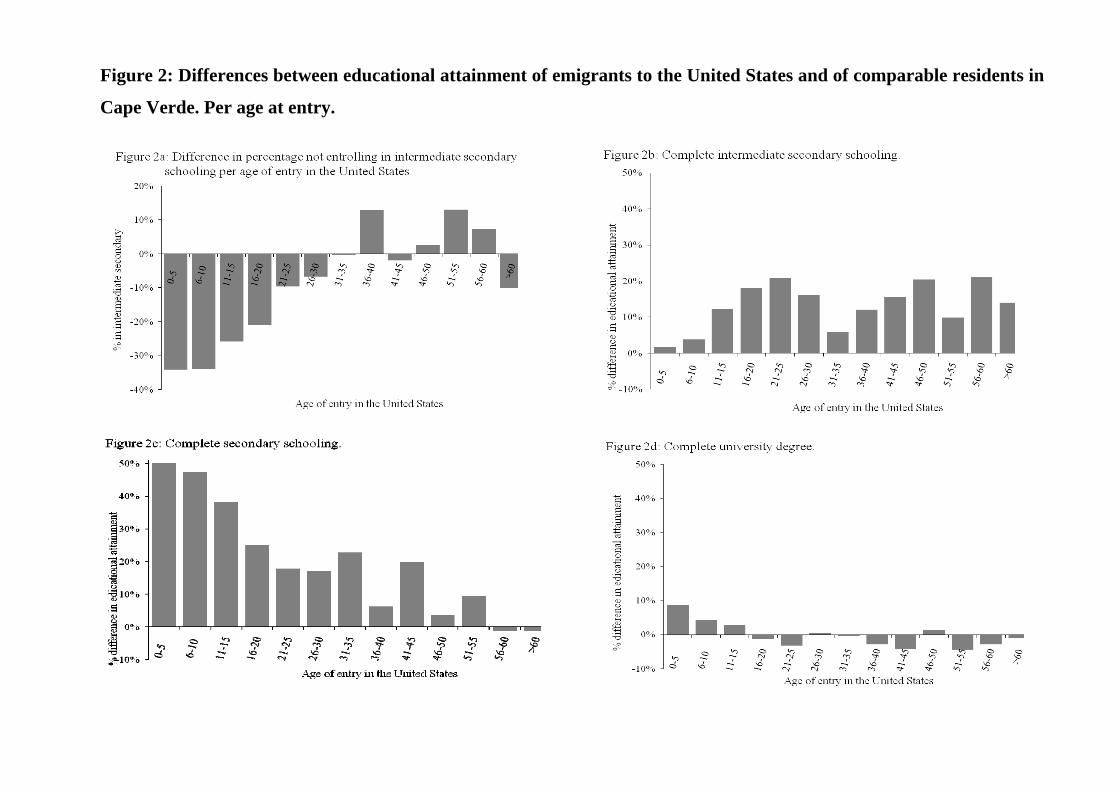
This procedure is repeated for the levels of education we consider. Figure 2 shows the predicted educational
differences (in percentage) by age of entry in the United States for each educational level. There are indeed
differences among migrants who enter at different ages, especially for those who did not graduate from
university. A migrant who enters after age 20 seems to be more likely than a non-migrant to have finished
secondary education (either intermediate or complete secondary). This is evidence of intermediate selection of
migrants in the United States. On the other hand, arriving early in life seems to particularly increase the
probability of completing secondary schooling (and university, although to a lesser extent). We attribute this
pattern to the fact that migrants entering the United States early in their lives have the opportunity to complete
schooling in the country.20
Based on our results, we can construct a counterfactual distribution of educational attainment of emigrants
who entered the United States before the age of 20. This counterfactual corresponds to a “no emigration”
situation, in which current emigrants in the United States would have obtained the same education as identical
migrants who enter in the United States after that age. This scenario will therefore identify the selection
pattern of emigrants at their date of emigration, thereby excluding any educational upgrades from emigration.
To compute this counterfactual, we attribute to emigrants in the United States who entered the country before
age 20 the educational attainment of the average emigrant in the United States with similar characteristics who
entered being 20. Table 8 shows the results. In particular, it gathers the educational distributions of emigrants
to Portugal and to the United States in a single counterfactual distribution. Note that, since there was no
apparent positive selection for those who migrate to Portugal, we keep their schooling level unadjusted.21
20 We recognize that a part of these differences may be explained by unobserved differences between immigrants who arrive early in their lives and immigrants who arrive late. However, our results are kept when controlling for the education of the father in both countries, although this restriction lowers the number of observations in both samples, especially in the United States and that is the reason to use these unconditional results. These results can be provided upon request. 21 The lack of data for the age of entry in Portugal does not allow us to do the same exercise. However, we could do something similar by actual age. We see slightly negative selection for those emigrants who are over 15 and reside in Portugal. Since someone cannot decrease the educational level after arrival we keep their educational level unadjusted. The fact that selection in Portugal and in the United States is different makes us reluctant to extrapolate educational attainment results to the whole population of emigrants. However, we believe that the selection of migrants that go to France, Netherlands, Italy and Spain or even Brazil should be in the middle of the selection observed in these two countries. If we consider the selection of migrants a function in terms of language and
12
Our adjustment for educational upgrading after emigration especially decreases the proportion of people who
completed secondary school as a counterpart to an increase in the fraction of people who complete only
intermediate secondary schooling. This counterfactual distribution of education can be used to re-calculate a
conventional measure of brain drain, as displayed in Table 7. As expected, numbers for the brain drain are
reduced by our “no emigration” counterfactual experiment. Actually, since the group that was mostly affected
by the counterfactual estimation was the group of migrants having completed secondary schooling, those
“brain drain” differences decreases with education, attaining a reduction for university degree holders from
24.68% to 21.08%.
4.2. Counterfactual educational attainment of returning emigrants
A sizeable fraction of Cape Verdean emigrants returns after spending some time abroad. Indeed, according to
our estimates, more than 10,000 inhabitants (i.e., 10% of all emigrants) have some international migration
experience.22 As shown in Table 6, these returning migrants are over-proportionately adult males over 50
years old. Their typical older age is certainly a reason for them to show disproportionately lower average
education. We must note, however, the large (relative to non-migrants) fraction of return migrants completing
a university degree. This fact points to returning migrants having obtained their degrees abroad, and ultimately
to the question of whether they would have obtained the same degree if they had stayed in Cape Verde,23 a
question which we address in this section.
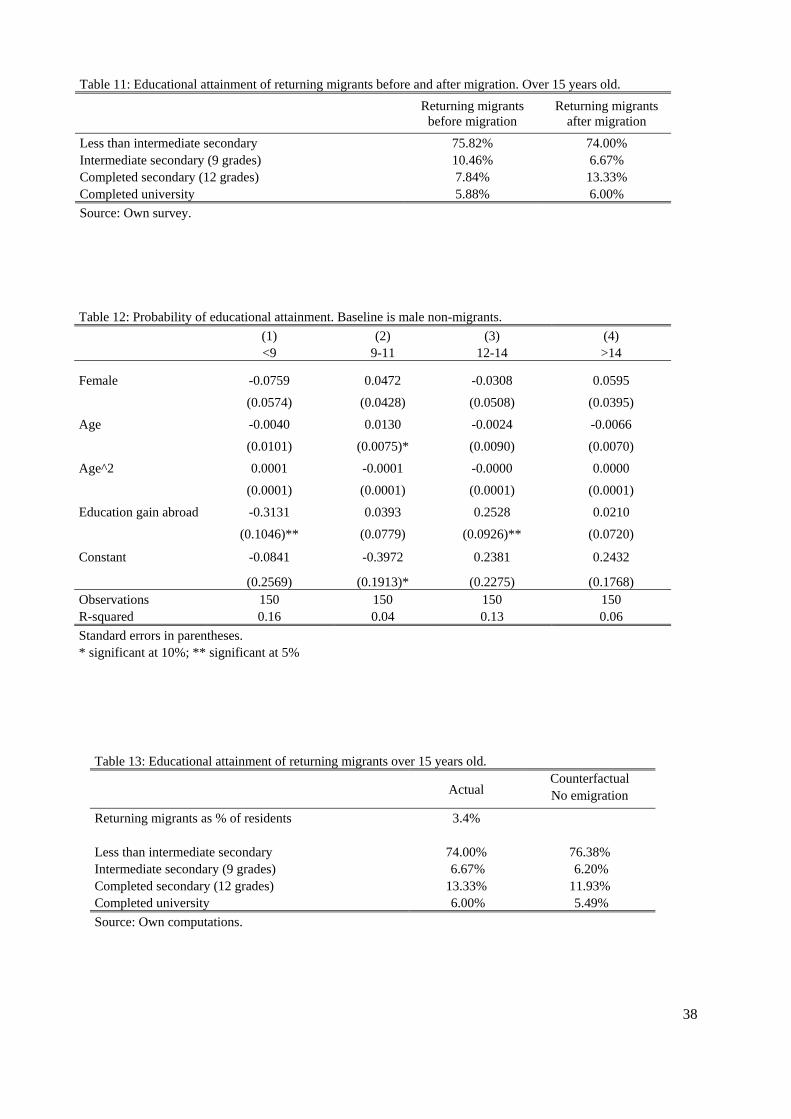
Using our survey data to compare the educational attainment of returning migrants before and after migration,
we actually observe an increase in the percentage of those with a secondary school degree, partially
compensated by a decrease in the percentage of people who report to have finished intermediate secondary.
This is shown in Table 11. We cannot, however, use the educational attainment before migration to answer
our question since they might have decided to continue their studies even if they had not emigrated.
In order to compute the educational attainment of returning migrants had they not migrated, we employ a
similar technique to the one used to estimate the “no emigration” counterfactual for current emigrants.
Unfortunately, we do not have enough observations in our survey to run the same regressions. Instead, we
keep the first two steps of the previous approach, and introduce a new third step. Overall our method can be
summarized as follows: (i) estimate the probability of completing secondary education for Cape Verdean
residents as in (1), using our own survey; (ii) using the survey’s data on returning migrants, predict the
counterfactual education these would have attained if they had stayed in Cape Verde according to the results
from the first step, and compute the difference between observed and predicted counterfactual education as in
distance: Portugal would be the closest destination in terms of distance and language and the United States will be the most distant in both dimensions. The other destinations will be close only in one dimension. 22 We extrapolate the fraction of the resident population who reports to have lived abroad for some time in our survey (2.46%) to apply to the resident population in the census (2000). This means that the numbers we obtain are a lower bound for returning migration, as some migrants who left the country recently may plan to come back in the future, but did not have enough time to do it. 23 Although the age of entry in the destination country for returning migrants is higher than for migrants residing abroad (Table 10), more than 20% emigrate before age 20 and have a median emigration spell of more than 8 years.
13
(2); (iii) finally, still using our data on returning migrants, estimate how computed differences depend on
where the educational gains variable (educ_gain) is binary, taking value 1 if there is an improvement in the
educational attainment of the returning emigrant while abroad. The idea behind controlling for these gains is
to isolate actual selection, in the sense of explaining the difference in educational attainment between return
migrants without school upgrading abroad and non-migrants. This selection effect is captured by the constant
term in the regressions shown in Table 12, which reports the results of estimating (4) for each educational
level.
From our results in Table 12, it is clear that return migrants have a slightly higher probability of completing
secondary school or a university degree relatively to non-migrants. This is the case even for those who do not
study abroad, although the difference relatively to non-migrants is not statistically significant.
In order to estimate the counterfactual educational attainment of return migrants had they not been able to
emigrate, we drop this positive gain from the actual educational attainment of return migrants. The results are
displayed in Table 13. They show a decrease in the percentage of secondary school and university graduates
would have occurred if they had not been able to emigrate.
5. Impact of emigration on the educational attainment of those left behind
Emigration can affect the educational attainment of non-migrant children through a variety of channels.
Having a current or return emigrant in the family may change these children’s own probability of emigrating
(because they have better access to migration networks abroad that lower their emigration costs, or because
they are generally more informed about the net benefits from emigration24), which can change their incentives
to pursue schooling. The educational attainment of these children may also suffer as a consequence of
disruptions to the family structure (absence of parents in their roles of models and guardians, as well as the
requirement of older children to take on household responsibilities), although it may also potentially benefit
from remittances to the household (which may relieve financial and/or credit constraints for poorer
households). In addition, there may be general equilibrium effects on educational choices, particularly in
countries such as Cape Verde in which substantial emigration can potentially affect relevant labor market
outcomes (such as returns to schooling and/or costs of providing education, due to the selected skill
composition of emigration flows) or cause changes in the financial system (due to massive remittance inflows)
that may relieve credit constraints faced by households. Overall, the impact of migration on the educational
attainment of non-emigrant children is an empirical question – the one which we explore in this section.
24 This effect may have a positive or a negative impact on their probability of emigrating as implied by the work of McKenzie et al. (2007). Indeed, it appears that underestimation of incomes abroad may occur as a consequence of misreporting by family members (possibly trying to reduce remittance flows), or of high probabilities being attributed to bad migration experiences of family members.
14
Our analysis begins by following the scarce existing literature on the topic and examining the impact on
children’s educational attainment of having an international emigrant in their household. We then propose an
innovative empirical strategy to distinguish between different mechanisms through which family migration
may affect schooling, which is made possible by the ideal characteristics of our unique survey. After
presenting a brief analysis of the forces behind the estimated effects, we turn to calculate the counterfactual
distribution of educational attainment in the population that would have occurred in a scenario where
emigration had been abolished.
5.1. Impact of household emigration on educational attainment
Hanson and Woodruff (2003) and McKenzie and Rapoport (2006) both examine the consequences of
household emigration on educational attainment of Mexican children. However, they provide apparently
contradictory results: Hanson and Woodruff (2003) report evidence of positive (heterogeneous) effects of
household migration on completed years of schooling, whereas McKenzie and Rapoport (2006) find that
family migration depresses educational attainment for the majority of rural Mexican children (although they
find some evidence for the positive effects of remittances on financially constrained households). Even though
these studies adopt different methodologies,25 their results underline that there is no consensus on the
empirical effects of emigration on the educational attainment of those left behind, at least for the case of
Mexico. We therefore start by examining this same question for the case of Cape Verde.
Econometric model and identification
We now turn to presenting a simple theoretical framework for our empirical analysis. Broadly following
Hanson and Woodruff (2003) and McKenzie and Rapoport (2006), we consider at this stage that individual
education and migration decisions are simultaneously determined at the household level. As pointed by these
authors, it is not possible to know a priori the direction of the implied bias. Indeed, it may be that financial
hardship prevents parents from emigrating and forces children to dedicate less to school; or it may happen that
parents more concerned with their children’s education decide to emigrate to better support this investment. In
any of these instances, the OLS estimate for the effect of household migration on children’s education would
be exaggerated. Alternatively, a negative labor market shock (such as unemployment) may prompt parental
emigration while children may be required to participate more in household production instead of attending
school - in this situation, OLS estimates would be negatively biased.
To model these simultaneous decisions, let us assume the existence of the following two latent (unobservable)
variables, which determine schooling and migration decisions, respectively:
25 Both studies address simultaneity between migration and education, but Hanson and Woodruff (2003) examine the impact on years of schooling, whereas McKenzie and Rapoport (2006) use completed school grades as their dependent variable which requires the use of censored-order probit models to account for right-censoring problems. We will also use data on completed school grades, but will consider each grade separately, which (in addition to adopting appropriate age intervals) mitigates right-censoring for our variable of interest and allows us to construct our final counterfactual skill distribution.
15
isiji XMS εααα +++= '' 210* (5)
jmjij YSM εβββ +++= '' 210* (6)
These latent variables depend on vectors of variables Xi and Yj (which include individual, family, and locality-
level characteristics of child i and household member j determining future benefits and costs of education and
migration, respectively) and on additive, random error terms, εsi and εmj. Given the simultaneity of this model,
latent variables also depend on the actual, observable education and migration decisions. These obey the
following rules:
)0(1 * ≥= ii SS (7)
)0(1 * ≥= jj MM (8)
According to these rules, individual child i will attain a secondary level grade (Si = 1) as long as the education
latent variable Si* is non-negative, and household member j will emigrate (Mj = 1) if the latent variable Mj
* is
non-negative.
To identify the parameters of interest in this model (α1 in particular), we need exclusion restrictions on X and
Y. Assuming errors are normally distributed, we follow Newey (1987), and use conditional maximum
likelihood estimators on our bivariate probit model.
Empirical implementation and results
The measure of educational attainment we consider in our regressions is educational attainment of a certain
school grade by children in a certain age interval. This specification allows us to clearly restrict the identified
effects of migration variables: we evaluate what the effect of migration is on attaining a certain school grade
by a certain age. In our baseline model we consider attainment of an intermediate secondary school grade (9
years). This grade is relevant because about 40% of students attain this grade and it is not compulsory, unlike
primary schooling. Complete secondary schooling would also be interesting to study, but is only attained by a
small fraction of individuals.
Following the standard in the literature on the determinants of educational attainment, we consider our
reduced form model to be dependent upon three types of variables available from our survey: (i) individual
level characteristics empirically related to performance (gender, age); (ii) household level proxies for
available resources (number of children, asset ownership, credit constraints), as well as for the quality of
family environment (highest educational level completed by members of the household) and for perceptions
of the quality of schooling (which are likely related to the expected benefits to be derived from education);
and, finally, (iii) local level variables such as island, urban area or other average local variables (such as
unemployment, average per capita household expenditure or the skill to unskilled labor force ratio) that may
affect local returns to schooling.
16
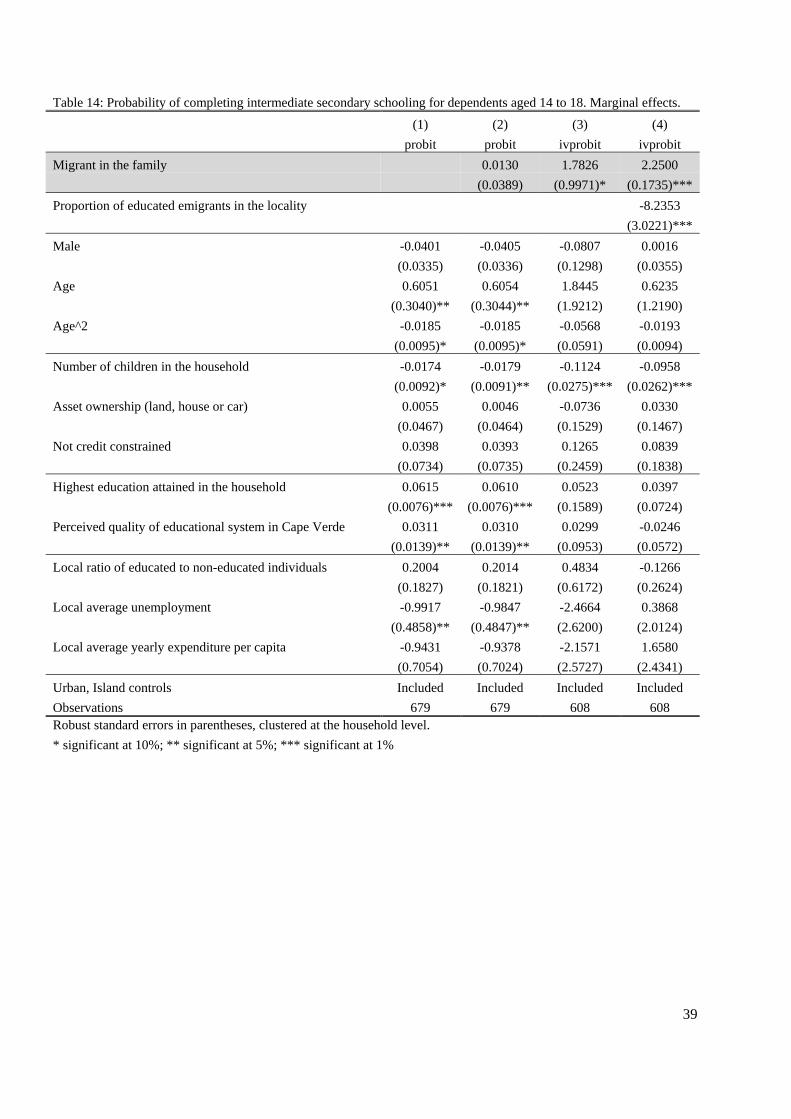
As shown in columns (1) and (2) of Table 14, we find that simply introducing a regressor for the presence of a
migrant in the household does not change the magnitude and level of significance of the other regressors. The
estimated coefficient is itself positive, but statistically insignificant. Since there may be a simultaneity
problem as described above, we use the following exclusion restrictions: local history of migration (proxying
for information and networks abroad which may reduce the costs of emigrating); confidence in Oxford
University (which broadly denotes confidence in foreign organizations); optimism regarding Cape Verde’s
future and perceived quality of the political system (a proxy for the overall state-of-affairs in Cape Verde). As
shown in column (3) of Table 14, instrumenting for household migration significantly increases the magnitude
and significance of the estimated positive effects. One potentially puzzling consequence is that the educational
level of household member and the perceived quality of the education system lose significance under this
framework. We interpret this as evidence that having a migrant in the household is much more informative
about migration prospects and the relevance of education for these, which makes this presence more
determinant in making educational decisions than simply having an educated individual at home. To further
test that the effect we are identifying is that of a household level migrant, we introduce a proxy for the general
equilibrium labor market effects of migration: the fraction of local population who is an educated emigrant,
which should contribute to the relative scarcity of skilled labor at the locality level. Column (4) of Table 14
points to this proxy having a negative, very significant effect on educational attainment, which may be
understood as evidence of a positive externality between educated individuals in the local labor market – this
interpretation is corroborated by the positive sign (although insignificant) of the coefficient for the ratio of
educated to non-educated workers in the local labor market in columns (1), (2) and (3) of Table 14). Including
this control for the general equilibrium labor market effects of migration dramatically increases the magnitude
and significance of the estimated positive effects of having an emigrant in the household.
5.2. Impact of probability of own future migration and of other migration channels on
educational attainment
Despite being an important and motivating first step in this analysis, examining the overall impact of family
migration on individual educational attainment as done in the previous literature is unsatisfactory in that we
would like to distinguish the channels through which this effect may work. Using the ideal characteristics of
our unique survey, we attempt to tackle this problem by distinguishing between different mechanisms through
which family emigration may affect schooling. Most importantly, using the full migration histories of current
migrants available in our survey, we estimate the educational impact of the own probability of future
migration. This corresponds to the original “brain gain” hypothesis, which has never been explicitly tested in
the literature, to the best of our knowledge.
The estimation procedure we propose to evaluate this effect is particularly attractive because it allows us to
control for unobserved individual heterogeneity: we consider actual future migration choices, which we then
17
take into account when estimating the schooling decision those same individuals made at an earlier date.
Because other migration channels may also be at work as described above, we control for family disruption
variables and (potentially endogenous) remittances, as well as general equilibrium effects (at the local level)
of emigration in this empirical analysis.
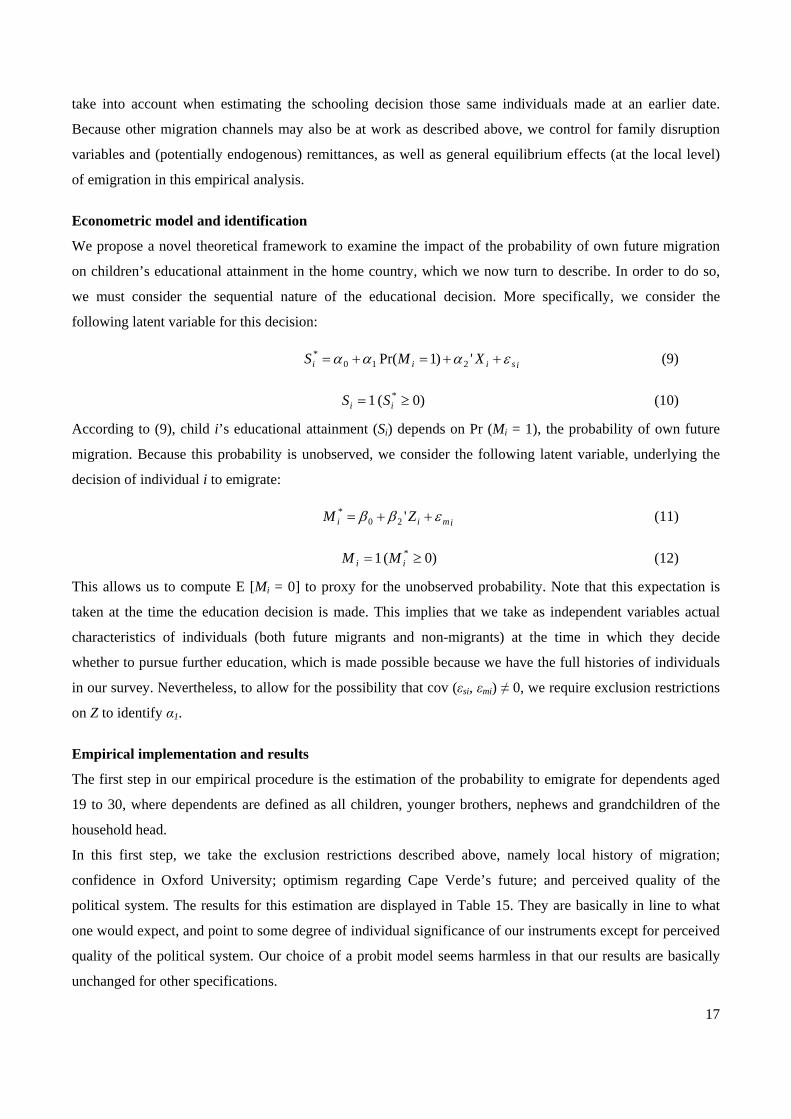
Econometric model and identification
We propose a novel theoretical framework to examine the impact of the probability of own future migration
on children’s educational attainment in the home country, which we now turn to describe. In order to do so,
we must consider the sequential nature of the educational decision. More specifically, we consider the
following latent variable for this decision:
isiii XMS εααα ++=+= ')1Pr( 210* (9)
)0(1 * ≥= ii SS (10)
According to (9), child i’s educational attainment (Si) depends on Pr (Mi = 1), the probability of own future
migration. Because this probability is unobserved, we consider the following latent variable, underlying the
decision of individual i to emigrate:
imii ZM εββ ++= '20* (11)
)0(1 * ≥= ii MM (12)
This allows us to compute E [Mi = 0] to proxy for the unobserved probability. Note that this expectation is
taken at the time the education decision is made. This implies that we take as independent variables actual
characteristics of individuals (both future migrants and non-migrants) at the time in which they decide
whether to pursue further education, which is made possible because we have the full histories of individuals
in our survey. Nevertheless, to allow for the possibility that cov (εsi, εmi) ≠ 0, we require exclusion restrictions
on Z to identify α1.
Empirical implementation and results
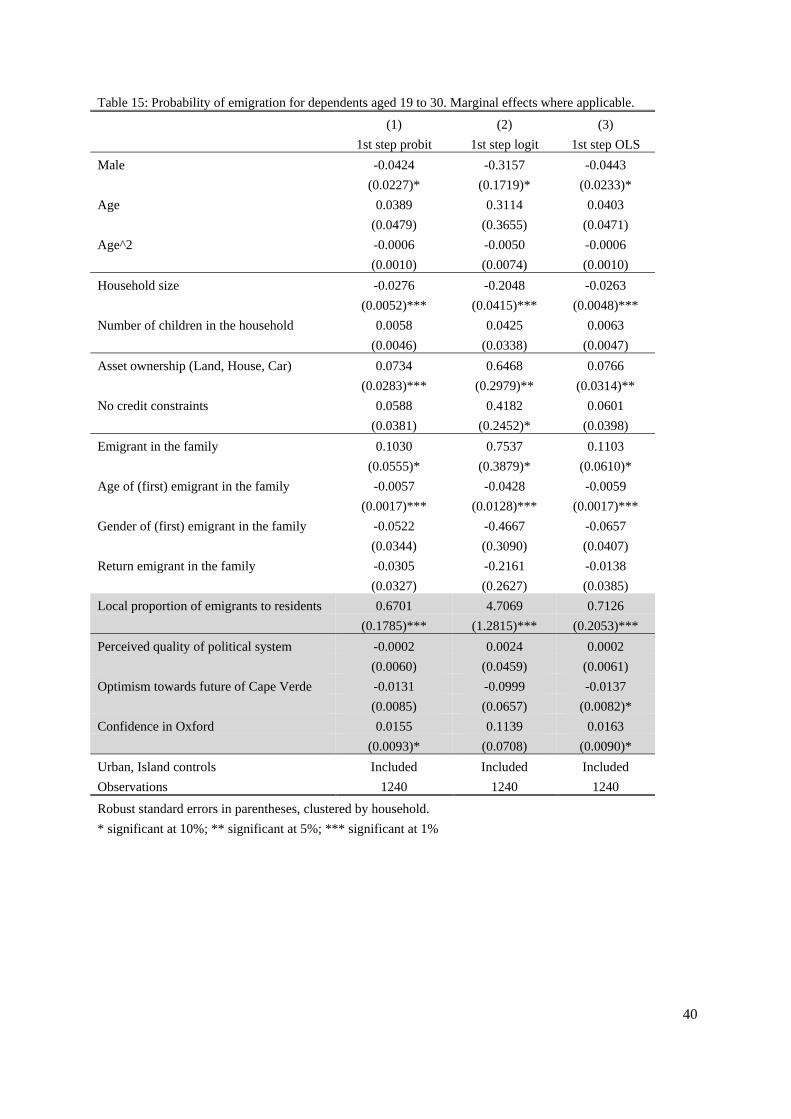
The first step in our empirical procedure is the estimation of the probability to emigrate for dependents aged
19 to 30, where dependents are defined as all children, younger brothers, nephews and grandchildren of the
household head.
In this first step, we take the exclusion restrictions described above, namely local history of migration;
confidence in Oxford University; optimism regarding Cape Verde’s future; and perceived quality of the
political system. The results for this estimation are displayed in Table 15. They are basically in line to what
one would expect, and point to some degree of individual significance of our instruments except for perceived
quality of the political system. Our choice of a probit model seems harmless in that our results are basically
unchanged for other specifications.
18
We next proceed to a second step in which we use characteristics of individuals at age 12 (using our full
history of residents and migrants’ lives and associated characteristics) to predict their probability of
emigration at that age.
In a third and final stage, this predicted probability of future emigration evaluated at age 12 is used as an
independent variable in several regressions of the educational attainment of individuals aged 14 to18 (the
relevant interval for completing intermediate secondary schooling, given the observed high levels of class
repetition). To account for this procedure, standard errors are bootstrapped. They are also clustered at the
household level to allow for likely correlation among members of the same family.
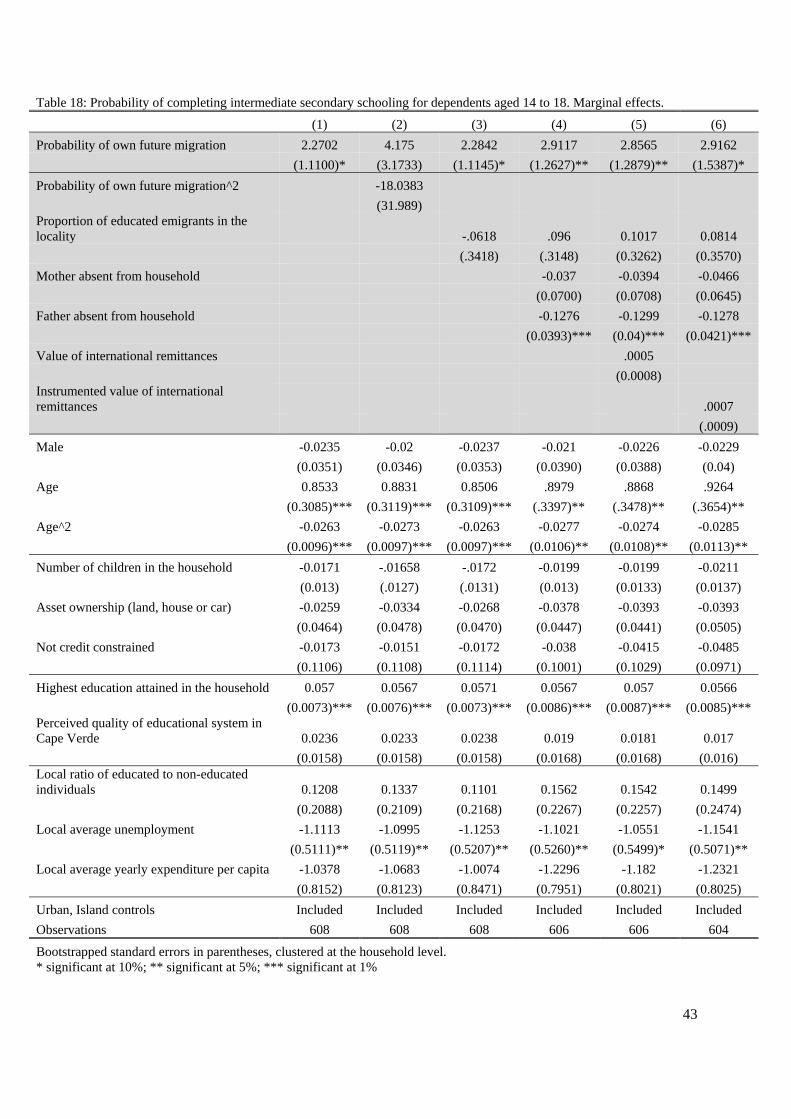
When running this set of regressions, summarized in Table 16, we begin by considering the probability of
future migration channel on its own. We are able to find the expected positive sign, but this coefficient is only
significant at the 10% level and significance is lost if we add a quadratic term as can be seen in columns (1)
and (2). Because there may be significant general equilibrium effects correlating with the individual
probability of own future migration, we introduce our proxy for these in column (3), which results in a sizable
increase in the magnitude and significance of the identified “brain gain” effect. The identified “general
equilibrium effects”, negative and very significant, point to some sort of complementarily or positive
externality of educated workers in the local labor force. To further test whether this may indeed be the channel
through which household migration positively affects educational attainment, we add controls for family
disruption and remittances. As can be seen in column (4), absences of the father or mother in the household
significantly disrupt educational attainment, but this only increases the magnitude of our estimated coefficient.
Columns (5) and (6) show that remittances (even when instrumented by distance to the post office and by
country of origin of remittances)26 have a very small and insignificant positive effect on educational
attainment, which barely affects the size and significance of our estimated positive effect of the own future
probability of migration on remittances. Although these results are in contrast with recent findings in the
literature,27 they are somewhat consistent with the self-reported evidence on credit-constraints from our
survey.
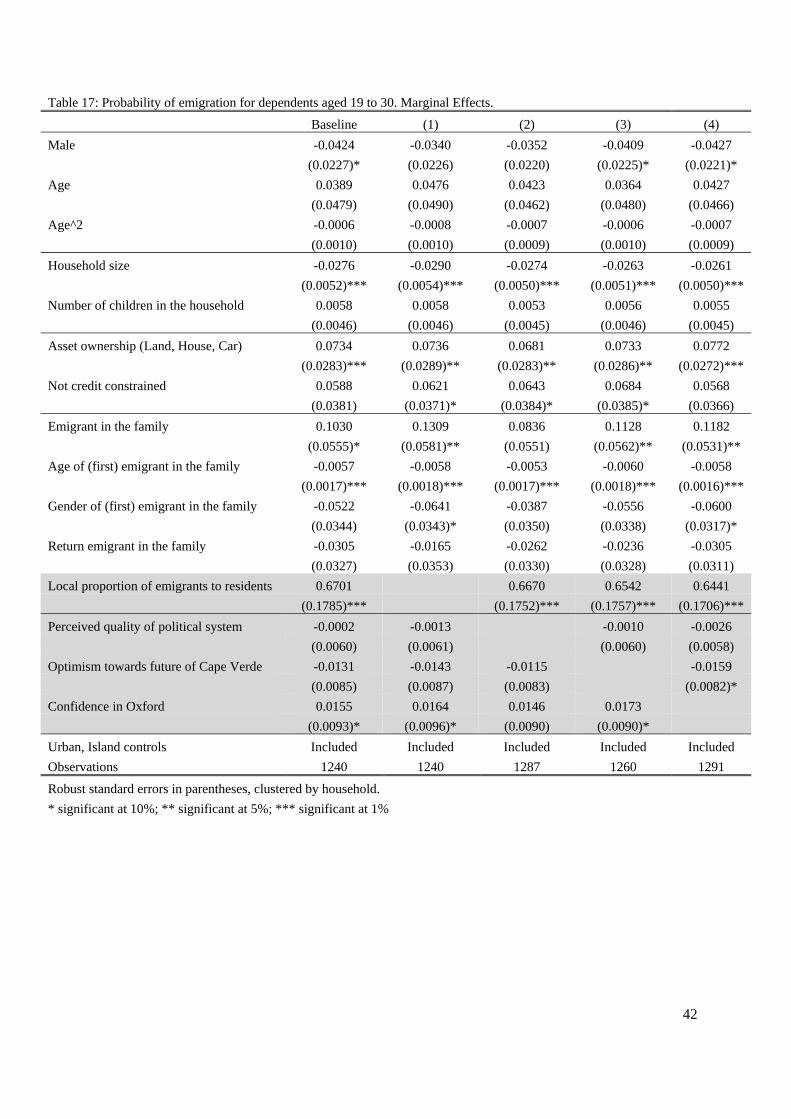
Relative importance of exclusion restrictions
One could potentially think that the use of local history of migration as an exclusion restriction to identify the
effects of the possibility of own future migration was prevented because the use of this restriction did not
allow us to distinguish between these effects and those of remittances, for instance. To answer this concern,
we redo our estimation procedure using only the remaining three instruments (confidence in Oxford
University; optimism regarding Cape Verde’s future; and perceived quality of the political system), arguably
uncorrelated not only with educational attainment, but also with remittances in the household.
26 These instruments are not the same, but share the spirit of Amuedo-Dorantes and Pozo (2006) who use the local availability of Western Union offices. 27 Namely, Edwards and Ureta (2003), Yang (2006) and Mishra (2006).
19
The results from our procedure are displayed in Tables 17 and 18. These show that excluding the local history
of migration instrument does not greatly change results in terms of signor significance of the estimated
coefficient. Magnitude, however, is somewhat increased. Remittances (instrumented or not) keep their small
positive insignificant effect on educational attainment.
5.3. Why does the own future probability of migration matter for educational decisions?
In the previous subsection, we obtained a sizable positive effect of the own future probability of emigration on
educational attainment. This finding raises further questions. In particular, one would like to understand the
mechanisms underlying this choice.
In line with the traditional migrant selection arguments proposed by Borjas (1987) and underlying the original
“brain gain” theory, we hypothesize that a positive probability of migration in the future may increase
educational attainment if there are higher returns to education abroad than in Cape Verde. Since the possibility
of emigration makes the expected return to schooling equal to a weighted average of returns at home and
abroad, the option of immigrating to a country where returns to schooling are higher should increase the
incentive to acquire education before emigration.
In order to test this hypothesis, we compare information on wages from the US Census (2001) and from the
Income and Expenditure Household Survey conducted by INE (2002-2003).28 We are interested in comparing
the returns to education (defined as completing 9 years of schooling) in Cape Verde and in the United States.
For this purpose, we run wage regressions controlling for gender, age, education, marital status and regional
dummies.29 However, as we have seen in Section 4, there are some people who obtain the degree at home and
some people that study after their arrival. Since the quality of the studies could be very different in Cape
Verde and in the United States, we have to somehow control for this issue. We choose to interact the
educational outcome with the age of entry in the US. We expect that those who enter being children, will have
a higher likelihood of having achieved the degree in the US.
Fig. 3 shows that workers completing intermediate secondary schooling in Cape Verde double the wage of
individuals with less education. The actual log-difference between the two groups is 0.92. This differential is
much higher than that for Cape Verdeans in the United States (0.37). Returns to education in the United States
vary, however, a lot with the age of entry. Indeed, the earlier someone enters, the higher the return.
Nevertheless, returns to education in the United States never overcome returns to education in Cape Verde.
Therefore, the average return to education (weighted by the probability of emigration) will never be higher
than the return in Cape Verde alone.
How can we then explain the observed pattern of positive selection for emigration together with the positive
effect of future emigration on education? Hatton and Williamson (2001) observe that emigration out of
28 The Portuguese census does not provide information on wages, and in other sources such as the European Household Panel, Cape Verdeans are only a small fraction of the sample. 29 The results of those regressions are available upon request.
20
African countries seems to be significantly determined by cross-country real wage differentials. Indeed,
although their sample does not include Cape Verde, it is very likely that wage differentials between Cape
Verde and the destination countries have not been competed away - as assumed by the standard Roy model
selection arguments used by Borjas (1987).30 As argued by Akee (2007), in this instance, it may be more
appropriate to consider the alternative model of Jasso and Rosenzweig (2005). This model, which may be
thought of as nested within the Roy model, takes the first (instead of the second) moments of the income
distribution across countries (i.e., real wage differentials) as determining incentives for the most educated
individuals to emigrate. In this context, skilled individuals decide to emigrate despite the lower relative returns
to education abroad because of the sizable absolute real differences in wages.
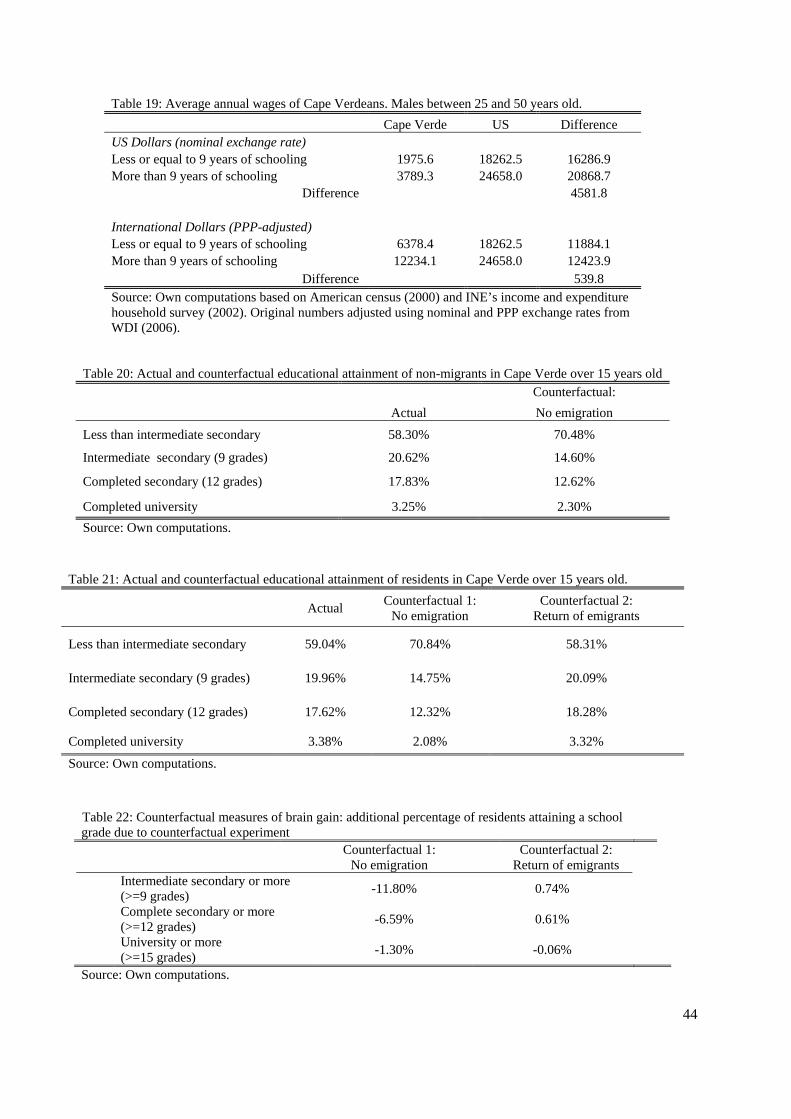
Table 19 shows that indeed there are substantial differences between annual wages in Cape Verde and the US.
The average 25-50 year old male, can earn around 12,000 additional international dollars after migrating to
the US. This difference is significantly wider if we do not adjust for purchasing power differences, which
makes sense for those who are able to save and remit US earnings to Cape Verde. If we take into account
educational attainment, we observe that the US-Cape Verde wage differential for those who complete
intermediate secondary schooling (9 grades) is only 540 international dollars, or 8% of the average unskilled
annual wage in Cape Verde. This differential between educated and non-educated workers is much higher
when we do not take PPP into consideration: it amounts to 4582 international dollars, or 232% of the average
unskilled annual wage in Cape Verde.
We believe this evidence to be partially supportive of our hypothesis that absolute migration differentials
determine positive emigrant selection in Cape Verde. This idea seems to have empirical support especially
when there is an intention to save and return to the origin country, or sizable remittances are sent back home.
Indeed, this mechanism may well explain why these individuals would like to invest in human capital before
emigrating. For individuals who emigrate with their whole family and who do not plan to return to the origin
country, it is, however, not obvious that it compensates to invest in further education based on absolute wage
differentials alone.
We finally argue that, in addition to the observed absolute wage differentials, the incentive to acquire further
education for individuals who plan to permanently emigrate in the future may also arise from education
decreasing the costs of emigration, as may be true of language barriers or legal characteristics of immigration
policies in destination countries, for instance. Individuals would, therefore, be interested in acquiring more
education to achieve a higher probability of emigration in the future, in line with the predictions of Chiquiar
and Hanson (2005) for the Mexican case. This argument is similar to that of absolute wage differentials, but
these authors further explore the implications of absolute costs of emigration, which may depend on
individual levels of education.
30 Batista (2007) discusses other instances in which this is the case even within more closely integrated economies, namely several countries in the European Union.
21
We have only limited evidence, although very much supportive of this hypothesis. In fact, selection patterns
seem to closely follow lingual distances. In addition to the findings of our analysis in Section 4.1, that positive
educational selection of emigrants was much stronger to the US than to Portugal, we have preliminary
evidence pointing to selection patterns of emigration to France being very similar to those of emigration to the
US, whereas emigration to Spain closely resembles emigration to Portugal.31 This is in line with the fact that
the Spanish language is very similar to Portuguese (spoken in Cape Verde), whereas French and English are
not. Lingual distance seems therefore an important emigration cost, which can be overcome by improved
educational attainment. This may well be an important motivation for acquiring additional education before
emigrating.
5.4. Counterfactual education of those who do not emigrate
Section 5.2. showed that the ex-ante probability of own emigration has a positive impact on the probability of
completing at least intermediate secondary school. Quantitatively, we can compute the counterfactual impact
of banning emigration on the educational attainment of individuals aged between 14 and 18. Indeed, the
percentage of dependents aged 14 to 18 who complete intermediate secondary school is 75.90%. If we restrict
their probability of emigration and the value of remittances to be 0, this percentage falls to 66.33%, which
represents a sizeable decrease on educational attainment for future generations.32
We can further extrapolate this decrease on educational attainment to the whole population of non-migrants.
This exercise has several shortcomings because neither emigration conditions were the same for previous
generations of children, nor the behavior was the same in the past. However, this is a necessary step to obtain
a distribution of education for those who never emigrated in a counterfactual world in which they had not
been allowed to emigrate. We therefore use the baseline empirical model estimated in Section 5.2. and assume
that different birth cohorts had the same opportunities to emigrate when they were 12 as nowadays.33
Under these assumptions, let us consider the proportion of non-migrant Cape Verdeans over 15 years old that
completed intermediate secondary school. The cutoff point that corresponds to this probability can be
computed as in (13).
( ))_,15|9Pr(1 emignoageSc >=>Φ= − (13)
We next aim at computing the counterfactual probability of non-migrant Cape Verdeans over 15 years old
completing intermediate secondary school when their possibility of emigration is eliminated. For this purpose,
we subtract the part that is attributed to the possibility of emigration from the cutoff obtained in (13), as is
made clear in (14):
31 Considering immigrants in France coming from African countries that do not speak French, we observe (using the French census) that their selection pattern is similar to that of Cape Verdean immigrants in the United States. On the other hand, the Spanish census gives information on the educational attainment of Cape Verdeans, although it does not match exactly our educational categories. The identified immigrant selection appears to be almost the same as that coming from the Portuguese census. 32 The main factor is the probability of emigration. The effect of dropping remittances is marginal. 33 Moreover, we assume that the flow of remittances was also similar, although this does not cause an important difference because the coefficient in front of the value of remittances is rather small.
34 Notice that in order to estimate the schooling decisions for higher degrees we need to restrict the sample to individuals above 25 years of age who are still residing with their parents, and there are very few of them. 35 In the actual data for non-migrants P(intermediate secondary|>=9)=49.4%, P(completed secondary|>=9)=42.7% and P(completed university|>=9)=7.9%. We apply those percentages to the counterfactual P(>=9)=29.52%. 36 In other words, we are keeping the estimated selection of emigrants and applying it to the counterfactual distribution of education of non-migrants.
23
where ( )EmigsP |1 , ( )EmigNonsP _|1 and ( )gReturn_EmisP |1 are the estimates of the counterfactual probability of
obtaining a certain degree, ( )1sP , conditional on, respectively, being a current emigrant, a non-migrant and a
returning emigrant.
The results in Section 5.4. provide us with the counterfactual ( )EmigNonsP _|1 . Using the results in Section 4,
we know the counterfactual differences ( )EmigDifference and ( )gReturn_EmiDifference . With these inputs in hand,
we can calculate the counterfactual educational attainment of residents abroad and returning migrants:
Table 21 shows that the distribution of schooling in Cape Verde would suffer notably (a reduction of up to
35% for university graduates) in a counterfactual world where migration is banned. This piece of evidence
supports the views of those who suggest that emigration may improve educational attainment at home.
An alternative counterfactual world would be one in which all current emigrants were forced to return to their
origin country. According to our results, displayed in Table 21, there would be very little changes to the
educational distribution at home under this scenario.37 Since current emigrants are slightly positively selected
and since they upgraded their degrees while abroad, the distribution of schooling in Cape Verde would
slightly improve (around 1% per secondary education category). Note, however, that this improvement is not
observed for the top of the education distribution, as university graduates are less than proportionately
represented in the emigration stock, which may be due to the fact that they tend to return home with a higher
probability than other emigrants (presumably after having completed their studies), as can be observed from
Table 6. The evidence we gather from this scenario is therefore only mildly supportive (given its small
magnitude and strong assumption that all emigrants would indeed be uniformly forced to return home) of
demands for incentive policies for emigrants to return to their home country.
As a way to summarize the findings in this paper, we finally calculate a summary statistic for our results on
the “brain drain” vs. “brain gain” controversy. For each of the counterfactual scenarios described above, we
compute the change in the fraction of residents attaining at least a certain school grade. It is our view that this
measure captures the idea of “brain drain” or “brain gain” better than the conventionally used fraction of
emigrants with a certain degree. This is the case because it relies on changes in the distribution of education
independently of the unconditional emigration rate.
According to our results, shown in Table 22, banning emigration would entail a 38% decrease in the fraction
of university graduates in the active population (from 3.38% to 2.08%). It would create proportionately
smaller falls in the lower education categories (31% and 29%, respectively), but still very substantial numbers,
which would likely affect the country’s performance.38 Forcing current emigrants to return to their home
37 We assume the educational attainment of Cape Verdean residents would remain unchanged in this scenario. 38 Note that the numbers we obtain are a lower bound for the likely effects of banning emigration, as many individuals obtain their university degrees abroad, which could further magnify the effects we calculate. Moreover, the positive effects of emigration on
24
country, would likely have much smaller effects, the most sizable being felt (almost 3%) at the completed
secondary education level or more.
7. Concluding remarks
This paper contributes in various ways to the important but still scarce literature on the effects of emigration
in origin countries. It departs from the essential premise that choices of educational attainment depend on
emigration options. This has important implications. First, in measuring brain drain, it suggests the need to
correct for educational upgrading after emigration. This correction addresses an important shortcoming of
existing studies which assume that the educational attainment of current and return emigrants would have
been the same had they not emigrated. We implement it by combining our survey data with information from
censuses of the main destination countries. Second, our essential premise demands the evaluation of the
channels through which household migration may affect educational attainment of non-migrant children. In
order to do so, we propose a new estimation method to explicitly test for the effect of the possibility of own
future emigration on educational attainment – the original “brain gain” hypothesis. This backward-looking
estimation method uses full histories of migrants and an innovative set of exclusion restrictions provided by
our unique microdata survey, allowing us to directly test the “brain gain” hypothesis unlike existing studies,
while also controlling for individual heterogeneity.
Our results point to “brain drain” not being as serious a problem as traditionally thought. Indeed, this paper
finds that massive emigration in Cape Verde seems to have significantly encouraged the accumulation of
human capital. Overall, our results point to emigration contributing by almost 40% to explain the fraction of
university graduates in the Cape Verdean active population. The main channel through which this effect
works does not seem to be neither remittances nor return migration, but educational gains associated with the
possibility of own future emigration. Our estimates suggest that an increase in the probability of own
migration by 1pp increases the probability of completing intermediate secondary schooling by 1.9pp.
The evidence obtained in this study should lead policymakers in both developing and developed countries not
to devote their efforts to restricting migration flows of educated individuals. Not only are destination countries
likely to benefit from the inflow of these skilled immigrants, as is relatively consensual, but these flows may
also be beneficial for origin countries as Cape Verde. Indeed, while further studies on other source countries
of educated migration would be required to make a stronger argument, for this case at least, keeping the doors
of rich countries open to educated migration may be regarded as a form of “efficient aid”.
educational attainment are likely to persist over time as human capital, which should prolong the effect of abolishing emigration on educational attainment.
25
References
Akee, Randall (2007). “Who’s Leaving? Deciphering Immigrant Self-Selection From a Developing Country”, Working Paper, IZA.
Amuedo-Dorantes, Catalina, and Susan Pozo (2006). “Migration, Remittances and Male and Female Employment Patterns”, American Economic Review Papers & Proceedings, 96(2): 222-226.
Barro, Robert J., and Jong-Wha Lee (2001). “International Data on Educational Attainment: Updates and Implications”, Oxford Economic Papers, 53: 541-563.
Batista, Catia (2007). “Why Doesn’t Labor Flow from Poor to Rich Countries? The European Integration Experience”, Working Paper, University of Oxford.
Beine, Michel, Frederic Docquier, and Hillel Rapoport (2001). “Brain drain and economic growth: theory and evidence”, Journal of Development Economics, 64: 275-289.
Beine, Michel, Frederic Docquier, and Hillel Rapoport (2003). “Brain drain and LDCs’ growth: winners and losers”, IZA Discussion Paper 819.
Beine, Michel, Cecily Defoort, and Frederic Docquier (2007). “A Panel Data Analysis of The Brain Gain”, Working Paper, Universite Catholique de Louvain.
Bhagwati, J., and K. Hamada (1974). “The brain drain, international integration of markets for professionals and unemployment: a theoretical analysis”, Journal of Development Economics, 1: 19-42.
Borjas, George (1987). “Self-Selection and the Earnings of Immigrants”, American Economic Review, 77(4): 531-53.
Borjas, George (1995). “The Economic Benefits of Immigration”, Journal of Economic Perspectives, 9(2): 3–22.
Borjas, George, Stephen Bronars, and Stephen Trejo (1992). “Self-Selection and Internal Migration in the United States”, NBER Working Paper Series 4002.
Carrington, William, and Enrica Detragiache (1998). “How Big is the Brain Drain?”, IMF Working Paper 98/102.
Chiquiar, Daniel, and Gary Hanson (2005). “International Migration, Self-Selection, and the Distribution of Wages: Evidence from Mexico and the United States”, Journal of Political Economy, 113(2): 239–281.
Chiswick, Barry, and Timothy Hatton (2003). “International Migration and the Integration of Labor Markets”, in Michael Bordo, Alan Taylor and Jeffrey Williamson (eds.), Globalization in Historical Perspective. Cambridge, MA: NBER.
Collier, Paul, Anke Hoeffler, and Catherine Pattillo (2004). “African Exodus, Brain Drain and Capital Flight”, Journal of African Economies, 13 (AERC Supp.2): ii15-ii54.
Docquier, Frédéric, and Abdeslam Marfouk (2006). “International Migration by Education Attainment, 1990–2000”, in World Bank (2006a).
Dustmann, Christian, and Oliver Kirchkamp (2003). “Migration Duration and Activity Choice After Re-Migration”, Journal of Development Economics, 67: 351-372.
Edwards, A. and M. Ureta (2003). “International migration, remittances, and schooling: evidence from El Salvador”, Journal of Development Economics, 72: 429-461.
Gruber, Herbert, and Anthony Scott (1966). “The International Flow of Human Capital”, American Economic Review, 56: 268-274.
Hanson, Gordon, and Christopher Woodruff (2003). “Emigration and Educational Attainment in Mexico”, Working Paper, UCSD.
26
Heston, Alan, Robert Summers and Bettina Aten (2006). Penn World Table Version 6.2, Center for International Comparisons of Production, Income and Prices at the University of Pennsylvania.
Hall, Robert E., and Charles I. Jones (1999). "Why Do Some Countries Produce So Much More Output Per Worker Than Others?", Quarterly Journal of Economics, February: 83-116.
Hatton, Timothy, and Jeffrey Williamson (2001). “Demographic and Economic Pressure Out of Africa”, NBER Working Paper 8124.
Jasso, Guillermina, and Mark Rosenzweig (2005). “Selection Criteria and the Skill Composition of Immigrants: A Comparative Analysis of Australian and US Employment Immigration”, Working Paper.
Krusell, Per, Lee E. Ohanian, Jose-Victor Rios-Rull and Giovanni L. Violante (2000). "Capital-Skill Complementarity and Inequality: A Macroeconomic Analysis", Econometrica, vol. 68 (5): 1029-1053.
Lacuesta, Aitor (2006). “Emigration and Human Capital: Who Leaves, Who Comes Back and What Difference Does it Make?”, Working Paper Bank of Spain 0620.
Lucas, Robert E. Jr. (1988). “On the Mechanics of Economic Development”, Journal of Monetary Economics, 22: 3-32.
McKenzie, David, John Gibson, and Steve Stillman (2006). “A Land of Milk and Honey with Streets Paved with Gold: Do Emigrants Have Over-Optimistic Expectations about Incomes Abroad?”, IZA Discussion Paper 2788.
McKenzie, David, and Hillel Rapoport (2006). “Can migration reduce educational attainment?”, World Bank Policy Research Paper 3952.
Mesnard, Alice, and Martin Ravallion (2006). “The Wealth Effect on New Business Startups in a Developing Economy”, Economica, 73: 367-392.
Mishra, Prachi (2006). “Emigration and Brain Drain: Evidence From the Caribbean”, IMF Working Paper 06/25.
Miyagiwa, Kaz (1991). “Scale economies in education and the brain drain problem”, International Economic Review, 32(3): 743-759.
Mountford A. (1997). “Can a brain drain be good for growth in the source economy?”, Journal of Development Economics, 53: 287-303.
Newey, W. K. (1987). “Efficient Estimation of Limited Dependent Variable Models with Endogenous Explanatory Variables”, Journal of Econometrics, 36: 231-250.
Psacharapoulos, G. and H.A. Patrinos (2004). “Returns to Investments in Education: A Further Update”, Education Economics, 12(2): 111-134.
Ratha, D. (2003). “Workers’ Remittances: An Important and Stable Source of External Development Finance”, Global Development Finance, Chapter 7.
Rauch, J., and V. Trinidad (2002) “Ethnic Chinese Networks in International Trade”, Review of Economics and Statistics, 84: 116–130.
Rosenzweig, Mark (2007). “Higher education and international migration in Asia: brain circulation”, Working Paper, Yale University.
Ruggles S., M. Sobek, T. Alexander, C. Fitch, R. Goeken, P. Kelly Hall, M. King, and C. Ronnander (2004). Integrated Public Use Microdata Series: Version 3.0. Minneapolis, MN: Minnesota Population Center.
Solow, Robert (1957). “Technical Change and the Aggregate Production Function”, Review of Economics and Statistics, 39: 312-320.
Stark O, C. Helmenstein, and A Prskawetz (1997). “A brain gain with a brain drain”, Economic Letters, 55: 227-234.
27
Stark O., C. Helmenstein, and A Prskawetz (1998). “Human capital formation, human capital depletion, and migration: a blessing or a “curse””, Economic Letters, 60: 363-367.
Stokey, Nancy L. (1996). "Free Trade, Factor Returns, and Factor Accumulation", Journal of Economic Growth, 1: 421-447.
World Bank (2006a). International Migration, Remittances and the Brain Drain. World Bank: Washington, DC.
World Bank (2006b), Global Economic Prospects. Economic Implications of Remittances and Migration. World Bank: Washington, DC.
World Bank (2006c). World Development Indicators, September 2006. World Bank: Washington, DC.
Yang, Dean (2006). “Philippine Migrants Remittances and Household Investment Responses to Exchange Rate Shocks”, IMF Working Paper 12325.
Appendix A: Growth accounting
In order to have an idea of the relative magnitude of the proximate sources of economic growth (physical and
human capital accumulation, raw labor and total factor productivity (TFP) growth) in Cape Verde over the
period 1990-2005, we conduct a growth accounting exercise in the spirit of Solow (1957)’s classical work.
We follow Hall and Jones (1999), in assuming the aggregate per worker production function:
Yt /Lt = At .(Kt/ Yt) α/ 1-α .exp (r . St) (A1)
where Y denotes aggregate output, A is total factor productivity (TFP), K the capital stock, L the number of
workers (or raw labor), S the average worker’s years of schooling, r the average return on year of schooling, α
the labor share of national income and t the time period.39
Per worker production (A1) is nested within aggregate per capita output in order to consider the effects on this
latter variable:
Yt /Nt = (Yt /Lt) * (1 - u) * ( NtA / Nt
15-64) * ( Nt15-64/ Nt) (A2)
where N denotes total resident population, u stands for the unemployment rate, NA for active population
(broadly defined as those residents aged 15 to 64 that are available to work), and N15-64 for the resident
population aged between 15 and 64.
In order to perform this growth accounting exercise, we used population and labor census data from Cape
Verde’s National Statistics Office (INE) to obtain N, N15-64, NA and u in 1990 and 2000. We also used INE’s
information on national income to compute α, the average labor share of national income between 1990 and
2000.40 Employment and investment data used to compute the capital stock (following the perpetual inventory
method with a depreciation rate of 10%) comes from the World Bank (2006c). Years of education were
39 This per worker version of aggregate production can be derived from the aggregate production function: Yt = (Kt) α . (At.Ht)1-α , where human capital Ht takes the form Ht = exp (r . St).Lt
. 40 The average labor share of national income between 1990 and 2000 was 45%. It is sensible that it is lower than the usual 2/3 applying to industrial countries: in Cape Verde, even though the tertiary structure of the economy is not very different from that of more developed countries, self-employment, temporary employment or unemployment are the norm and this is not taken into account in the formal labor share.
28
estimated based on information from the 1990 and 2000 census, provided by INE as well. The return to years
of schooling comes from Psacharopoulos and Patrinos (2004).
Our results show human capital accumulation as the driving force of Cape Verde’s economic growth per
worker in the recent decades, much more so than physical capital accumulation or TFP growth. This is better
understood if one looks at the 5-year subperiods included in our period of analysis, 1990-2005. Indeed, the
first sub-period immediately follows democratization and the associated high investment inflows and turmoil
period, plausibly responsible for the observed fall in TFP; the following periods witness the decline of
investment rates to lower levels, whereas TFP gains materialize. Throughout the whole period, we observe
important human capital gains.
Table A1 – Growth decomposition for Cape Verde, 1990-2005 Growth
Figure 2: Differences between educational attainment of emigrants to the United States and of comparable residents in
Cape Verde. Per age at entry.
34
Tables
Table 1: Basic demographics.
Residents in survey (2006) WDI (2006)
Gender Male population 47.95% 48%
Age Population between 15-64 years 58.13% 56.17%
Source: Own survey and World Development Indicators (2006).
Table 2: Basic demographics and educational attainment.
Residents in survey (2006) Census (2000)
Gender Male population 47.95% 48.42%
Age 0-9 years 21.39% 27.45%
10-19 years 28.63% 26.06% 20-29 years 12.91% 15.18% 30-39 years 13.05% 12.40% 40-49 years 10.14% 7.34% 50-59 years 4.44% 2.99% 60-69 years 4.24% 4.41% 70-79 years 3.80% 2.67%
>79 years 1.21% 1.51%
Education 15-64 No Education 10.35% 13.9%
Pre-school 1.34% 0.2% Alphabetized 11.15% 4.3%
Primary 53.22% 52.6% Secondary 20.12% 26.4%
Tertiary 3.82% 2.69% Source: Own survey and INE.
35
Table 3: Labor situation of residents over 15 years (*)
Survey (2006) Employment Inquiry (2005) Census (2000)
(*) Broad definitions of activity and unemployment rates are used (i.e. including as unemployed those who are available to work even if they not actively looking for a job).
Table 4: Migration flows and stocks.
Survey (2006) Census (2000) and
International Censuses
Flow of emigrants as % of residents in Cape Verde Between 2000 and 2005 3.96% Between 1995 and 2000 2.80%
Flow of return migrants as % of current emigrants
Between 2000 and 2005 19% Between 1995 and 2000 25%
Stock of migrants abroad as % of residents in Cape Verde 11.64% 18.94% (*)
Source: Own survey, INE and international censuses of destination countries (Portugal, United States, France, Netherlands, Luxembourg, Italy and Spain). (*) Stock of emigrants is sum of Cape Verde citizens living abroad, divided by 0.92, as detailed in text.
Table 5: Main destinations of Cape Verdean emigrants. Percentage of total emigration flows. Survey (2006)
2000-2005
Census (2000)
1995-2000 Portugal 54 55 US 21 19 France 12 8 Netherlands 2 5 Luxemburg 2 - Brazil 3 - Other 6 13 Source: Own survey and INE.
36
Table 6: Characteristics of Cape Verdeans resident abroad and in Cape Verde.
Source: Own survey and international censuses of destination countries (Portugal, United States, France, Netherlands, Luxembourg, Italy and Spain). (*) Total number of residents abroad is sum of numbers of Cape Verde citizens living abroad, divided by 0.92, as detailed in text. Number of residents in Cape Verde from 2000 census in Cape Verde. Number of residents abroad from the survey uses fraction of residents abroad in total residents (11.64%). Number of returning migrants from the survey uses fraction of returning migrants in total residents (2.46%). (**) Individuals over 15 years old.
37
Table 7: Alternative measures of the "brain drain". Probability of migration given a degree. Over 15 years old.
Actual Counterfactual:
No emigration Residents abroad as % of all Cape Verdeans 25.20%
Intermediate secondary (9 grades) or more 26.18% 25.97% Completed secondary (12 grades) or more 27.23% 25.08% University degree or more 24.68% 21.08% Source: Own computations based on censuses of the main destination countries (Portugal and United States).
Table 8: Educational attainment of residents in Cape Verde and abroad. Over 15 years old.
Actual
Residents Cape VerdeActual
Residents Abroad
Counterfactual: No emigration
Residents Abroad Less than intermediate secondary 59.04% 56.11% 57.86% Completed intermediate secondary (9 grades) 19.96% 20.48% 22.73% Completed secondary (12 grades) 17.62% 20.25% 17.26% Completed university 3.38% 3.16% 2.16% Source: Own survey and calculations based on censuses of the main destination countries (Portugal and United States).
Table 9: Age at migration to United States of current emigrants over 15 years old. Age at migration Percentage
Less than 10 years 18.13% 11-20 years 26.92% 21-30 years 26.05% 31-40 years 15.46% 41-50 years 6.25% 51-60 years 3.74%
>61 years 3.45% Source: United States census (2001).
Table 10: Age at migration to United States of returning emigrants over 15 years old.
Age at migration Percentage Mean duration Less than 10 years 6.92% 10.60 11-20 years 16.35% 8.77 21-30 years 24.53% 7.72 31-40 years 25.16% 6.05 41-50 years 12.58% 3.85 51-60 years 4.40% 2.71 >61 years 10.06% 1.31 Source: Own survey.
38
Table 11: Educational attainment of returning migrants before and after migration. Over 15 years old.
Returning migrants
before migration Returning migrants
after migration
Less than intermediate secondary 75.82% 74.00% Intermediate secondary (9 grades) 10.46% 6.67% Completed secondary (12 grades) 7.84% 13.33% Completed university 5.88% 6.00% Source: Own survey. Table 12: Probability of educational attainment. Baseline is male non-migrants. (1) (2) (3) (4) <9 9-11 12-14 >14
Female -0.0759 0.0472 -0.0308 0.0595
(0.0574) (0.0428) (0.0508) (0.0395)
Age -0.0040 0.0130 -0.0024 -0.0066
(0.0101) (0.0075)* (0.0090) (0.0070)
Age^2 0.0001 -0.0001 -0.0000 0.0000
(0.0001) (0.0001) (0.0001) (0.0001)
Education gain abroad -0.3131 0.0393 0.2528 0.0210
(0.1046)** (0.0779) (0.0926)** (0.0720)
Constant -0.0841 -0.3972 0.2381 0.2432
(0.2569) (0.1913)* (0.2275) (0.1768) Observations 150 150 150 150 R-squared 0.16 0.04 0.13 0.06 Standard errors in parentheses. * significant at 10%; ** significant at 5%
Table 13: Educational attainment of returning migrants over 15 years old.
Actual Counterfactual
No emigration
Returning migrants as % of residents 3.4% Less than intermediate secondary 74.00% 76.38% Intermediate secondary (9 grades) 6.67% 6.20% Completed secondary (12 grades) 13.33% 11.93% Completed university 6.00% 5.49% Source: Own computations.
39
Table 14: Probability of completing intermediate secondary schooling for dependents aged 14 to 18. Marginal effects.
(1) (2) (3) (4) probit probit ivprobit ivprobit Migrant in the family 0.0130 1.7826 2.2500
(0.0389) (0.9971)* (0.1735)*** Proportion of educated emigrants in the locality -8.2353 (3.0221)*** Male -0.0401 -0.0405 -0.0807 0.0016 (0.0335) (0.0336) (0.1298) (0.0355) Age 0.6051 0.6054 1.8445 0.6235 (0.3040)** (0.3044)** (1.9212) (1.2190) Age^2 -0.0185 -0.0185 -0.0568 -0.0193 (0.0095)* (0.0095)* (0.0591) (0.0094) Number of children in the household -0.0174 -0.0179 -0.1124 -0.0958 (0.0092)* (0.0091)** (0.0275)*** (0.0262)*** Asset ownership (land, house or car) 0.0055 0.0046 -0.0736 0.0330 (0.0467) (0.0464) (0.1529) (0.1467) Not credit constrained 0.0398 0.0393 0.1265 0.0839 (0.0734) (0.0735) (0.2459) (0.1838) Highest education attained in the household 0.0615 0.0610 0.0523 0.0397 (0.0076)*** (0.0076)*** (0.1589) (0.0724) Perceived quality of educational system in Cape Verde 0.0311 0.0310 0.0299 -0.0246 (0.0139)** (0.0139)** (0.0953) (0.0572) Local ratio of educated to non-educated individuals 0.2004 0.2014 0.4834 -0.1266 (0.1827) (0.1821) (0.6172) (0.2624) Local average unemployment -0.9917 -0.9847 -2.4664 0.3868 (0.4858)** (0.4847)** (2.6200) (2.0124) Local average yearly expenditure per capita -0.9431 -0.9378 -2.1571 1.6580 (0.7054) (0.7024) (2.5727) (2.4341) Urban, Island controls Included Included Included Included Observations 679 679 608 608 Robust standard errors in parentheses, clustered at the household level. * significant at 10%; ** significant at 5%; *** significant at 1%
40
Table 15: Probability of emigration for dependents aged 19 to 30. Marginal effects where applicable.
(1) (2) (3) 1st step probit 1st step logit 1st step OLS Male -0.0424 -0.3157 -0.0443 (0.0227)* (0.1719)* (0.0233)* Age 0.0389 0.3114 0.0403 (0.0479) (0.3655) (0.0471) Age^2 -0.0006 -0.0050 -0.0006 (0.0010) (0.0074) (0.0010) Household size -0.0276 -0.2048 -0.0263 (0.0052)*** (0.0415)*** (0.0048)*** Number of children in the household 0.0058 0.0425 0.0063 (0.0046) (0.0338) (0.0047) Asset ownership (Land, House, Car) 0.0734 0.6468 0.0766 (0.0283)*** (0.2979)** (0.0314)** No credit constraints 0.0588 0.4182 0.0601 (0.0381) (0.2452)* (0.0398) Emigrant in the family 0.1030 0.7537 0.1103 (0.0555)* (0.3879)* (0.0610)* Age of (first) emigrant in the family -0.0057 -0.0428 -0.0059 (0.0017)*** (0.0128)*** (0.0017)*** Gender of (first) emigrant in the family -0.0522 -0.4667 -0.0657 (0.0344) (0.3090) (0.0407) Return emigrant in the family -0.0305 -0.2161 -0.0138 (0.0327) (0.2627) (0.0385) Local proportion of emigrants to residents 0.6701 4.7069 0.7126 (0.1785)*** (1.2815)*** (0.2053)*** Perceived quality of political system -0.0002 0.0024 0.0002 (0.0060) (0.0459) (0.0061) Optimism towards future of Cape Verde -0.0131 -0.0999 -0.0137 (0.0085) (0.0657) (0.0082)* Confidence in Oxford 0.0155 0.1139 0.0163 (0.0093)* (0.0708) (0.0090)* Urban, Island controls Included Included Included Observations 1240 1240 1240
Robust standard errors in parentheses, clustered by household. * significant at 10%; ** significant at 5%; *** significant at 1%
41
Table 16: Probability of completing intermediate secondary schooling for dependents aged 14 to 18. Marginal effects.
(1) (2) (3) (4) (5) (6) Probability of own future migration 1.0717 2.4419 1.4680 1.8359 1.8251 1.9143 (.6045)* (1.5675) (.7013)** (0.8174)** (0.822)** (.8791)** Probability of own future migration^2 -7.7396 (8.1277) Proportion of educated emigrants in the locality -.4881 -0.4344 -0.4265 -.4856 (.4112) (0.3725) (0.3853) (.4655) Mother absent from household -0.033 -0.0354 -.0454 (0.0697) (0.0704) (.0654) Father absent from household -0.1246 -0.1275 -.126 (0.0381)*** (0.039)*** (.04157)*** Value of international remittances 0.0006 (0.0008) Instrumented value of international remittances .0009 (.0009) Male -.0254 -.0201 -.0224 -0.0193 -0.0208 -.0209 (.0340) (0.0352) (.0346) (0.0394) (0.039) (.0388) Age .8688 0.8678 .8537 0.9019 0.8886 .9294 (.3090)*** (0.3093)*** (.3115)*** (0.3402)** (0.3473)** (.375)** Age^2 -.0268 -0.0268 -0.0264 -0.0278 -0.0274 -.0286 (.0096)*** (0.0096)*** (0.0097)*** (0.0106)** (0.0108)** (.0116)** Number of children in the household -.01820 -0.0174 -0.0178 -0.0207 -0.0206 -.0221 (.0134) (0.0134) (0.0133) (0.0132) (0.0134) (.01396) Asset ownership (land, house or car) -.01074 -0.0195 -.0239 -0.0333 -0.0356 -.0382 (.0476) (0.0476) (0.0471) (0.0466) (0.0457) (.0499) Not credit constrained 0.0013 -0.0057 -.0060 -0.0247 -0.0296 -.0367 (0.1063) (0.1105) (0.1083) (0.0985) (0.1009) (.0906) Highest education attained in the household 0.0574 0.0568 .0579 0.0578 0.0581 .0575 (0.0073)*** (0.0073)*** (0.0072)*** (0.0085)*** (0.0086)*** (.0085)*** Perceived quality of educational system in Cape Verde .02533 0.0249 .0256 0.0213 0.0203 .0186 (.0156) (0.0154) (.0158) (0.0167) (0.0167) (.0159) Local ratio of educated to non-educated individuals .1631 0.1569 .1023 0.1479 0.1471 .1357 (.2167) (0.2195) (0.2200) (0.2322) (0.2309) (.2487) Local average unemployment -.9871 -1.0744 -1.0786 -1.0378 -0.9836 -1.1075 (.5228)* (0.5343)** (0.5245)** (0.5346)* (0.5566)* (.5044)** Local average yearly expenditure per capita -1.0862 -1.1923 -.9618 -1.1762 -1.1235 -1.1776 (.8480) (0.8474) (0.8560) (0.7952) (0.7983) (.7931) Urban, Island controls Included Included Included Included Included Included Observations 608 608 608 606 606 604
Bootstrapped standard errors in parentheses, clustered at the household level. * significant at 10%; ** significant at 5%; *** significant at 1%
42
Table 17: Probability of emigration for dependents aged 19 to 30. Marginal Effects.
Baseline (1) (2) (3) (4) Male -0.0424 -0.0340 -0.0352 -0.0409 -0.0427 (0.0227)* (0.0226) (0.0220) (0.0225)* (0.0221)* Age 0.0389 0.0476 0.0423 0.0364 0.0427 (0.0479) (0.0490) (0.0462) (0.0480) (0.0466) Age^2 -0.0006 -0.0008 -0.0007 -0.0006 -0.0007 (0.0010) (0.0010) (0.0009) (0.0010) (0.0009) Household size -0.0276 -0.0290 -0.0274 -0.0263 -0.0261 (0.0052)*** (0.0054)*** (0.0050)*** (0.0051)*** (0.0050)*** Number of children in the household 0.0058 0.0058 0.0053 0.0056 0.0055 (0.0046) (0.0046) (0.0045) (0.0046) (0.0045) Asset ownership (Land, House, Car) 0.0734 0.0736 0.0681 0.0733 0.0772 (0.0283)*** (0.0289)** (0.0283)** (0.0286)** (0.0272)*** Not credit constrained 0.0588 0.0621 0.0643 0.0684 0.0568 (0.0381) (0.0371)* (0.0384)* (0.0385)* (0.0366) Emigrant in the family 0.1030 0.1309 0.0836 0.1128 0.1182 (0.0555)* (0.0581)** (0.0551) (0.0562)** (0.0531)** Age of (first) emigrant in the family -0.0057 -0.0058 -0.0053 -0.0060 -0.0058 (0.0017)*** (0.0018)*** (0.0017)*** (0.0018)*** (0.0016)*** Gender of (first) emigrant in the family -0.0522 -0.0641 -0.0387 -0.0556 -0.0600 (0.0344) (0.0343)* (0.0350) (0.0338) (0.0317)* Return emigrant in the family -0.0305 -0.0165 -0.0262 -0.0236 -0.0305 (0.0327) (0.0353) (0.0330) (0.0328) (0.0311) Local proportion of emigrants to residents 0.6701 0.6670 0.6542 0.6441 (0.1785)*** (0.1752)*** (0.1757)*** (0.1706)*** Perceived quality of political system -0.0002 -0.0013 -0.0010 -0.0026 (0.0060) (0.0061) (0.0060) (0.0058) Optimism towards future of Cape Verde -0.0131 -0.0143 -0.0115 -0.0159 (0.0085) (0.0087) (0.0083) (0.0082)* Confidence in Oxford 0.0155 0.0164 0.0146 0.0173 (0.0093)* (0.0096)* (0.0090) (0.0090)* Urban, Island controls Included Included Included Included Included Observations 1240 1240 1287 1260 1291
Robust standard errors in parentheses, clustered by household. * significant at 10%; ** significant at 5%; *** significant at 1%
43
Table 18: Probability of completing intermediate secondary schooling for dependents aged 14 to 18. Marginal effects.
(1) (2) (3) (4) (5) (6) Probability of own future migration 2.2702 4.175 2.2842 2.9117 2.8565 2.9162 (1.1100)* (3.1733) (1.1145)* (1.2627)** (1.2879)** (1.5387)* Probability of own future migration^2 -18.0383 (31.989) Proportion of educated emigrants in the locality -.0618 .096 0.1017 0.0814 (.3418) (.3148) (0.3262) (0.3570) Mother absent from household -0.037 -0.0394 -0.0466 (0.0700) (0.0708) (0.0645) Father absent from household -0.1276 -0.1299 -0.1278 (0.0393)*** (0.04)*** (0.0421)*** Value of international remittances .0005 (0.0008) Instrumented value of international remittances .0007 (.0009) Male -0.0235 -0.02 -0.0237 -0.021 -0.0226 -0.0229 (0.0351) (0.0346) (0.0353) (0.0390) (0.0388) (0.04) Age 0.8533 0.8831 0.8506 .8979 .8868 .9264 (0.3085)*** (0.3119)*** (0.3109)*** (.3397)** (.3478)** (.3654)** Age^2 -0.0263 -0.0273 -0.0263 -0.0277 -0.0274 -0.0285 (0.0096)*** (0.0097)*** (0.0097)*** (0.0106)** (0.0108)** (0.0113)** Number of children in the household -0.0171 -.01658 -.0172 -0.0199 -0.0199 -0.0211 (0.013) (.0127) (.0131) (0.013) (0.0133) (0.0137) Asset ownership (land, house or car) -0.0259 -0.0334 -0.0268 -0.0378 -0.0393 -0.0393 (0.0464) (0.0478) (0.0470) (0.0447) (0.0441) (0.0505) Not credit constrained -0.0173 -0.0151 -0.0172 -0.038 -0.0415 -0.0485 (0.1106) (0.1108) (0.1114) (0.1001) (0.1029) (0.0971) Highest education attained in the household 0.057 0.0567 0.0571 0.0567 0.057 0.0566 (0.0073)*** (0.0076)*** (0.0073)*** (0.0086)*** (0.0087)*** (0.0085)*** Perceived quality of educational system in Cape Verde 0.0236 0.0233 0.0238 0.019 0.0181 0.017 (0.0158) (0.0158) (0.0158) (0.0168) (0.0168) (0.016) Local ratio of educated to non-educated individuals 0.1208 0.1337 0.1101 0.1562 0.1542 0.1499 (0.2088) (0.2109) (0.2168) (0.2267) (0.2257) (0.2474) Local average unemployment -1.1113 -1.0995 -1.1253 -1.1021 -1.0551 -1.1541 (0.5111)** (0.5119)** (0.5207)** (0.5260)** (0.5499)* (0.5071)** Local average yearly expenditure per capita -1.0378 -1.0683 -1.0074 -1.2296 -1.182 -1.2321 (0.8152) (0.8123) (0.8471) (0.7951) (0.8021) (0.8025) Urban, Island controls Included Included Included Included Included Included Observations 608 608 608 606 606 604
Bootstrapped standard errors in parentheses, clustered at the household level. * significant at 10%; ** significant at 5%; *** significant at 1%
44
Table 19: Average annual wages of Cape Verdeans. Males between 25 and 50 years old. Cape Verde US Difference US Dollars (nominal exchange rate) Less or equal to 9 years of schooling 1975.6 18262.5 16286.9 More than 9 years of schooling 3789.3 24658.0 20868.7
Difference 4581.8 International Dollars (PPP-adjusted) Less or equal to 9 years of schooling 6378.4 18262.5 11884.1 More than 9 years of schooling 12234.1 24658.0 12423.9
Difference 539.8 Source: Own computations based on American census (2000) and INE’s income and expenditure household survey (2002). Original numbers adjusted using nominal and PPP exchange rates from WDI (2006).
Table 20: Actual and counterfactual educational attainment of non-migrants in Cape Verde over 15 years old Counterfactual: Actual No emigration
Less than intermediate secondary 58.30% 70.48%
Intermediate secondary (9 grades) 20.62% 14.60%
Completed secondary (12 grades) 17.83% 12.62%
Completed university 3.25% 2.30% Source: Own computations.
Table 21: Actual and counterfactual educational attainment of residents in Cape Verde over 15 years old.
Actual Counterfactual 1: No emigration
Counterfactual 2: Return of emigrants
Less than intermediate secondary 59.04% 70.84% 58.31%