An Updated Model of Price-to-Book Ben Branch, Anurag Sharma, Chetan Chawla, and Feng Tu The price-to-book (PB) ratio is a measure of the relative value that the market places on a share of stock. We have estimated an empirical equation of two stages that explain about 62% of the variation in annual PB levels for the S&P 500 companies from the year 2000 to 2009. We explored the market's ability to anticipate changes in performance and found that the market price appears to reflect anticipatory information not present in the model value. This paper both advances understanding of PB 's determinants and provides a tool for managers who wish to enhance their firm's PB. V X •Almost 30 years ago. Branch and Gale (1983) developed a price-to-book (PB) (the ratio of a stock's price to its book value) model that explained over 70% of their sample's variability. Subsequent research on a later sample validated the model, explaining more than 63% of the variance (Branch, Sharma, Gale, Chichirau, and Proy, 2005). Since the original Branch-Gale (1983) paper, PB has taken on increasing significance. The price-to-book ratio is a basic measure of the relative value that the market places on a share of stock. For all of its shortcomings, a stock's book value per share remains the best easily accessible measure of the asset value (according to generally accepted accounting principles (GAAP) lying behind each share. Accordingly, the ratio of this per share book value to the stock's market price provides a useful index of how the market values the firm as a going Ben Branch is a Professor of finance at the Isenberg School of Management at the university Massachusetts in Amherst, MA. Anurag Sharma is an Associate Professor of management in the Isenberg School of at the University Massachusetts in Amherst, MA. Chetan Chawla is a Ph.D. candidate in strategic management at the Isenberg School of Management at the University Massachusetts in Amherst, MA. Feng Tu is a Ph.D. candidate infinanceat the Isenberg School of Management at the University Massachusetts in Amherst, MA. concern (market price of stock) as opposed to the bundle of assets (book value per share). The higher the PB, the more favorably the market views the company's prospects. A PB below one implies that the firm's going concern value is actually below the reported value its net assets. Herein, using a more recent sample (2000-2009), we fiirther explore the factors that influence the PB level. We build and test a multivariate model which relates those factors to PB. Our study and the resulting model are designed both to advance understanding of PB's determinants and to provide a tool for those managers who wish to enhance their own firm's PB. I. Literature Background The relation between the firm's market and book value has long been of interest to researchers. Tobin (1969), in his seminal paper theorized that the economy-wide rate of capital goods investment was related to the ratio (q) of those assets' market values to reproduction costs. The changes in rate of return brought about by a changing market value in relation to reproduction cost, he argued, regulated the rate of investment in durable goods. Conversely, increases in the marginal efficiency of capital (rate of rettim) tended to raise its valuation in relation to its cost. Quickly coined Tobin's q in honor of its originator, this ratio of market value to reproduction cost was adapted from macroeconomics to the industry and firm level of analysis. Yet, the interpretation tends to differ in economics and finance literatures. In industrial organization and strategy, the ratio is generally taken to indicate the efficiency with which the installed base of assets (on accounting cost basis) is being utilized. The higher the ratio of market to book. 73
Transcript
An Updated Model of Price-to-Book
Ben Branch, Anurag Sharma, Chetan Chawla, and Feng Tu
The price-to-book (PB) ratio is a measure of the relativevalue that the market places on a share of stock. We haveestimated an empirical equation of two stages that explainabout 62% of the variation in annual PB levels for the S&P500 companies from the year 2000 to 2009. We explored themarket's ability to anticipate changes in performance andfound that the market price appears to reflect anticipatoryinformation not present in the model value. This paper bothadvances understanding of PB 's determinants and provides atool for managers who wish to enhance their firm's PB.
V X
•Almost 30 years ago. Branch and Gale (1983) developeda price-to-book (PB) (the ratio of a stock's price to its bookvalue) model that explained over 70% of their sample'svariability. Subsequent research on a later sample validatedthe model, explaining more than 63% of the variance(Branch, Sharma, Gale, Chichirau, and Proy, 2005).
Since the original Branch-Gale (1983) paper, PB has takenon increasing significance. The price-to-book ratio is a basicmeasure of the relative value that the market places on a shareof stock. For all of its shortcomings, a stock's book value pershare remains the best easily accessible measure of the assetvalue (according to generally accepted accounting principles(GAAP) lying behind each share. Accordingly, the ratio ofthis per share book value to the stock's market price providesa useful index of how the market values the firm as a going
Ben Branch is a Professor of finance at the Isenberg School of Managementat the university Massachusetts in Amherst, MA. Anurag Sharma is anAssociate Professor of management in the Isenberg School of at theUniversity Massachusetts in Amherst, MA. Chetan Chawla is a Ph.D.candidate in strategic management at the Isenberg School of Managementat the University Massachusetts in Amherst, MA. Feng Tu is a Ph.D.candidate in finance at the Isenberg School of Management at the UniversityMassachusetts in Amherst, MA.
concern (market price of stock) as opposed to the bundle ofassets (book value per share). The higher the PB, the morefavorably the market views the company's prospects. A PBbelow one implies that the firm's going concern value isactually below the reported value its net assets.
Herein, using a more recent sample (2000-2009), wefiirther explore the factors that influence the PB level. Webuild and test a multivariate model which relates thosefactors to PB. Our study and the resulting model are designedboth to advance understanding of PB's determinants and toprovide a tool for those managers who wish to enhance theirown firm's PB.
I. Literature Background
The relation between the firm's market and book valuehas long been of interest to researchers. Tobin (1969), inhis seminal paper theorized that the economy-wide rate ofcapital goods investment was related to the ratio (q) of thoseassets' market values to reproduction costs. The changes inrate of return brought about by a changing market value inrelation to reproduction cost, he argued, regulated the rateof investment in durable goods. Conversely, increases in themarginal efficiency of capital (rate of rettim) tended to raiseits valuation in relation to its cost.
Quickly coined Tobin's q in honor of its originator, thisratio of market value to reproduction cost was adapted frommacroeconomics to the industry and firm level of analysis.Yet, the interpretation tends to differ in economics andfinance literatures. In industrial organization and strategy,the ratio is generally taken to indicate the efficiency withwhich the installed base of assets (on accounting cost basis)is being utilized. The higher the ratio of market to book.
73
74
the greater is the indicated efficiency. In finance, on theother hand, the ratio is more likely to be used as indicativeof market risk and increasingly seen as an additional (tobeta) proxy for risk; in other words, the lower the price tobook, the greater is the risk (of bankruptcy) to investors. Wediscuss both viewpoints in the sections below.
The earliest adaptations were in industrial organizationand in the merger literature in the banking industry.Lindenberg and Ross (1981), for instance, used Tobin's q- ratio of the market value of a firm to the replacement costof its assets - as a proxy for the presumed monopoly rentsearned by firms. Similarly, Smirlock, Gilligan, and Marshall(1984) used price-to-book to examine the structure-conduct-performance hypothesis in the industrial organizationliterature. In a slightly different vein, the banking literaturetoo was quick to use the price-to-book ratio as a proxy forthe premium paid in mergers and acquisitions (Rogowskiand Simonson, 1987; Cheng, Gup, and Wall, 1989). Veryrapidly after that, the ratio of market to book value foundits way into the mainstream literature in other areas such asmanagement.
A few early efforts notwithstanding, not until the 1990sdid a series of Fama and French papers (1992, 1993, 1995,and 1998) spur deeper interest in the relationship betweenmarket and book value of the firm. Unlike the literaturein other disciplines, however, their concern was with theability of the ratio to explain variations in the cross-sectionof portfolio returns. They also defined the ratio as book-to-market, the reciprocal of market-to-book conventionused in other areas. Below, we discuss the literature on therelationship between market and book values. We begin withthe literature in finance and then tum to a brief discussion ofthe related literature in other areas.
In one of their first papers in the series. Fama and French(1992) highlighted "several empirical contradictions" (pg.427) to the presumed supremacy of market in explainingcross-sectional returns. Ever since, they have continuedto highlight the prevailing anomalies as reflected in thedisconnect between average cross-section of returns onequities and the market ßs of the Sharpe (1964) and Lintner(1965) asset pricing model. The disconnect appears to holdtrue when using the consumption ßs of the inter-temporalasset pricing model (Breeden, 1979; Reinganum, 1981;Breeden, Gibbons and Litzenberger, 1989). Furthermore,invoking Banz (1981), Bhandari (1988), Basu (1983),Rosenberg, Reid and Lanstein (1985), and Fama and French(1993) claimed that variables which aren't part of the assetpricing theory, such as size, leverage, eamings-to-price,and book-to-market had reliable power to explain the crosssection of average returns.
Over the years, two broad explanations have been putforth for the anomaly as observed by Fama and French intheir series of empirical papers (Fama and French, 1992,
JOURNAL OF APPLIED FINANCE - No. 1, 2014
1993, 1995, and 1998). The traditional explanations adhereto the rational pricing assumption and the efficient markethypothesis; and the relatively newer literature relies more onpotential behavioral explanations for the observed anomalies.Each representing a different paradigm, the rational andbehavioral explanations have advanced further insights intowhy capital asset pricing model (CAPM) may not be able toexplain the variation in cross-section of returns - why book-to-market may, in fact, offer a better explanation.
Initial reaction to Fama and French (1992) was one ofskepticism. Within the rational fi"amework, in particular,researchers argued that the relationship observed betweenbook-to-market and average returns is an artifact of thesample chosen and is unlikely to be observed out of sample(Black, 1993; MacKinlay, 1995). Contrary evidence to thisobjection is presented, however, by Chan, Hamao, andLakonishok ( 1991 ), Capaul, Rowley, and Sharpe ( 1993), andFama and French (1998). Chan et al. (1991), for instance,find strong evidence linking book-to-market and expectedreturns in their sample of Japanese firms. Similarly, Capaulet al (1993) find clear confirmation for linkages betweenbook-to-price and returns in a diverse sample of firms fromFrance, Germany, Switzerland, United Kingdom, Japan, andthe US. Fama and French (1998) provide more evidencefor the out of sample robustness of their original results.Working with data from thirteen major markets (includingthe US), they show return premium for value (high book-to-market) stocks in twelve of those markets. Barber andLyon (1997) find similar value premium for financial firms(holdout sample in the original Fama and French 1992 study).Davis ( 1994) presents evidence of the value premium forUS stocks extending back to 1941. Davis, Fama and French(2000) extend this result back to 1926 and include the wholepopulation of NYSE industrial firms. Taken altogether, thisresearch presents formidable confirmation of the relationshipbetween book-to-market and equity returns.
In defense of Fama and French, researchers have arguedthat not only does the relationship between book-to-marketand returns hold true out of sample, it is in fact a reflectionof a perfectly reasonable trade-off between risk and return.That is, book-to-market is a proxy for risk and the observedrelationship with equity returns captures thus - high book-to-market reflects high risk and yields greater rewards, andvice versa. One should not be surprised, therefore, that thehigh book-to-market equities generate a value premium - ascompensation for risk within a broader multifactor modelof inter-temporal capital asset pricing (ICAPM) (Merton,1973) or the arbitrage pricing theory (APT) of Ross (1976).Much of Fama and French's work in the 1990s supports thisviewpoint.
In their seminal 1993 paper. Fama and French identifyfive common risk factors in the returns on stocks and bonds- three stock market factors, an overall market factor and
BRANCH, SHARMA, CHAWLA, AND TU - AN UPDATED MODEL OF PRICE TO BOOK
factors linked to firm size and book-to-market equity. Theyfind return covariation related to book-to-market that isbeyond that explained by the market return. In a later paper(1995), they refine the multi-factor model and posit thata three factor model (consisting of factors related to size,leverage, and book-to-market) largely captures the variationin average returns. Vassalou and Xing's study (2004) furthersupports the risk-based interpretation for the size and book-to-market effects.
Nevertheless, contradictory evidence to the "compensationfor risk" explanation is provided by Griffin and Lemmon(2002). Using a direct proxy for financial distress proposedby Ohlson (1980), Griffin and Lemmon (2002) examinethe linkages between book-to-market, distress risk andstock returns. Although they find a large return differentialbetween firms with high and low book-to-market values,they show that this differential is driven by extremely lowreturns on firms with low book-to-market equity. Arguingthat this differential cannot be explained by the three-factormodel. Griffin and Lemmon (2002) posit that the mispricingexplanation is better suited to the findings since "firms withthe highest distress risk exhibit the largest return reversalsaround earnings announcements and the book-to-marketreturn premium is largest in small firms with low analystcoverage" (pg. 2335). This explanation based on investormispricing is in line with the earlier behavioral explanations(e.g., over-reaction) that have been provided by DeBondtand Thaler (1987), Lakonishok, Shleifer, and Vishny (1994),and Haugen (1995).
In effect, the rational pricing response to Fama and Frenchis, first, of disbelief that a book-to-market anomaly exists andthen a grudging acceptance with an explanation based in therisk-reward framework of the efficient market hypothesis.That is, the book-to-market anomaly is encapsulated withinthe prevailing views about the value premium within therational pricing/efficient market branch of finance.
Yet, as in Griffin and Lemmon (2002), the risk-rewardexplanation for the book-to-market anomaly appears tobe less robust than originally thought and doubts aboutthat open the door to behavioral and other non-rationalexplanations. Along these lines, Daniel and Titman (1997)posit that the return (value) premium on small capitalization(size) and high book-to-market firms is caused not by co-movements of returns with pervasive factors but by specificcharacteristics of the equities in question. In explaining whycharacteristics may be important, they invoke the behavioralarguments of Lakonishok, Shleifer and Vishny (1994) that"investors may incorrectly extrapolate past growth rates"(pg. 29) based on certain particulars of stocks.
Davis et al. (2000) highlight the causal linkage betweenthe two behavioral explanations: while the first behavioralexplanation posits the importance of investor over-reactionto firm performance, the second behavioral explanation
75
links the value premium to value characteristic and not torisk. For example, investors may demonstrate a preferencefor growth stocks at the expense of value stocks - this mayresult in a value premium for value stocks (lower prices andhigher returns) that is unrelated to risk. This implies that thedifference between the two behavioral explanations is oneof preference, of demarcation of causal boundaries ratherthan presence of different causal processes. These final twobehavioral explanations are attempts to refiite the dominantexplanation within the rational pricing/efficient markethypothesis paradigm of finance, i.e., the value premium iscompensation for higher risk.
In spite of objections, the proponents of the rationalpricing/efficient market hypothesis paradigm have continuedto defend the risk-reward linkage between the value premiumand the three factor risk model (Davis et al , 2000; Malkiel,2003; Fama and French, 2006).
That argument has been extended in other ways aswell. Gutierrez (2001), for instance, reported that book-to-market and size effects also exist in the cross sectionof bond returns. Another variant in the literature has beenthe explaining away of size and price-to-book effects byincorporation of macroeconomic variables. Jensen, Johnson,and Mercer (1997) found that size and price-to-book effectsdepend largely on the monetary policy of the Fed. Theyclaim, for example, that the low price-to-book and smallfirm premiums are statistically and economically significantonly in expansive monetary policy periods. In a more recentwork, Hahn and Lee (2009) claim that changes in defaultspread and term spread capture the systemic differences inaverage returns - that, in effect, in the presence of defaultand term spread, the Fama-French factors are superfluous inexplaining the variation in the cross-section of returns.
A growing body of work surrounds the relationshipbetween market and book price and the immense relevanceand utility of this ratio. Where the literature in finance hasbeen concerned with the risk implications of the ratio,however, a well-established body of work is concerned withfactors that may explain the ratio itself (see Sharma, Branch,Chawla, and Qiu, 2013). That is, the concern in economicsand especially in the management literature has been withidentifying discretionary variables that managers may beable to use to influence their firm's market valuation inrelation to its book value.
Thus an extensive amount of literature is concernedwith identifying independent variables, especially firm-level characteristics that explain the market-to-book ratio(Rogowski and Simonson, 1987; Varaiya, Kerin, and Weeks,1987; Amit and Livnat, 1988; Barton, 1988; Montgomeryand Wernerfelt, 1988; Wemerfelt and Montgomery, 1988;Murray, 1989; Cheng, Gup, and Wall, 1989; Morck,Shleifer, and Vishny, 1989; Amit and Wemerfelt, 1990;Fombrun and Shanley, 1990; Nayyar, 1992; Nayyar, 1993;
76
Huselid, 1995; Welboume and Andrews, 1996; Becker andGerhart, 1996; Anand and Singh, 1997; Huselid, Jackson,and Schüler, 1997; Dutta, Narasimhan, and Rajiv, 1999;Wiggins and Ruefli, 2002; Chang, 2003; Lu and Beamish,2004; Kor and Mahoney, 2005; Cho and Pucik, 2005; Dutta,Narasimhan, and Rajiv, 2005; Tanriverdi and Venkatraman,2005; Dushnitsky and Lenox, 2006; Short, Ketchen, Palmer,and Huit, 2007; McDonald, Khanna, and Westphal, 2008).This literature is briefly reviewed below.
One of the earliest papers utilizing the price to book ratioas a dependent variable was Rogowski and Simonson ( 1987)study of bank mergers. They analyzed 168 mergers in order toidentify the factors related to the merger premium, measuredas excess purchase price over book value. Cheng, Gup,and Wall (1989) also looked into the financial determinantsof bank takeovers by analyzing 136 bank mergers in theSoutheast between 1981 and 1986. Their focus was onacquirer characteristics.
In the management literature, Varaiya, Kerin, and Weeks(1987) have shown that the market to book ratio and Tobin'sq are theoretically and empirically equivalent measures.Numerous studies have used the market to book ratio as ameasure of firm performance. Barton (1988), for instance,explored the relationship between corporate diversificationand systemic/market risk. Fombrun and Shanley (1990)studied reputation building as strategic and competitivesignaling utilizing market to book as a measure of economicperformance. Also relying on market to book, Nayyar( 1992) investigated firm focus in the context of service firmsfinding that focus on customer segments yielded higherperformance while focus on distinctive internal capabilitiesor geographical regions lowered performance (see alsoNayyar, 1993). McDonald, Khanna, and Westphal (2008)incorporate social networking research into their study ofChief Executive Officer's (CEO's) advice seeking behaviorand it's linkages to firm performance, also formulated asmarket.
The management literature on diversification contains aplethora of studies using market-to-book as a measure offirm performance. Amit and Livnat (1988) employed theratio as a market based measure of return in their studyof risk-return characteristics of firms with related andunrelated diversification strategies. Other studies whichhave used Tobin's q in the context of diversification andfirm focus based studies are: Wemerfelt and Montgomery(1988), Montgomery and Wemerfelt (1988), Anand andSingh (1997), Lu and Beamish (2004), and, more recently,Tanriverdi and Venkatraman (2005).
Tobin's q as a measure of firm performance has beenextensively used in the literature on top managementteams since the 1980s. Murray (1989), for instance,analyzed 84 Fortune 500 food and oil firms to explore therelationships between top management group composition
JOURNAL OF APPLIED FINANCE - No. 1, 2014
and firm performance measured as a mix of variablesthat included price to book. Morck, Shleifer, and Vishny(1989) studied the linkages between corporate boardperformance, substitute control devices (like takeovers)and firm performance operationalized as market price inrelation to other factors such as book value. The broaderhuman resources management (HRM) literature has alsoused this ratio as a measure of performance. Huselid (1995)investigated the links between systems of High PerformanceWork Practices (such as comprehensive employee selectionand recruitment procedures, incentive compensation, etc.)and firm performance as measured by Tobin's q. Welboumeand Andrews (1996) extended the application of populationecology model to study relations between HRM practicesand organizational performance. Other studies using Tobin'sq to measure of firm performance in the context of HRMare Becker and Gerhart (1996), and Huselid, Jackson, andSchüler (1997).
The literature on organizational slack has also frequentlyused market to book as a performance measure. Chakravarthy(1986) used market to book ratio as one of the measures oforganizational slack in his study of measures of strategicperformance. Davis and Stout ( 1992) concluded that marketto book was one of the measures that lowered the risk ofa takeover while organizational slack increased the risk oftakeover. In a similar vein, Gibbs (1993), who also lookedat organizational slack and the market for corporate control,used Tobin's q as an indicator of investment opportunity.Iyer and Miller (2008) also found that slack increased anorganization's propensity to indulge in acquisitions, theyused the market to book ratio to control for the firm's growthopportunities.
Combs and Ketchen (1999) explored the determinantsof inter-firm cooperation in the restaurant industry, theresource variable - slack was determined to be inverselyrelated to inter-firm cooperation. They used market to bookas a market measure of firm performance. Pitcher and Smith(2001) used multi-method research to study top managementheterogeneity and it's linkages to organizational slackand performance - measured using market to book ratio.O'Brien (2003) posited that competition type wouldinfluence the strategic importance of financial slack and thiswould be critical for firms pursuing a strategy of innovation.Wang, He, and Mahoney (2009) looked into trust-buildingmechanisms such as employee stock option plans and theirimpact in mitigating employee underinvestment in buildingfirm specific knowledge. They found financial slack to bepositively related to firm-employee relationships and usedTobin's q as measure of financial performance.
Within the corporate social responsibility (CSR)literature, slack has been indicated as a determinantof corporate philanthropy. Wang, Choi, and Li (2008)support this hypothesis and used Tobin's q as a market
BRANCH, SHARMA, CHAWLA, AND TU - AN UPDATED MODEL OF PRICE ro BOOK
based performance measure. More recently, contradictoryevidence has emerged, Surroca, Tribo, and Waddock (2010)studied the mediation of a firm's intangible resources (suchas innovation, reputation, human resources, etc.) on therelationship between corporate social responsibility andfinancial performance. They hypothesize that the causalrelationship between CSR (authors term - CRP: CorporateResponsibility Performance) and financial performanceis spurious due to mediation of intangibles in the slackresources literature (as well as the instrumental stakeholderliterature).
In sum, then, the relationship between market valueand book value of firms has been extensively used in theliterature. While the finance literature has been concernedwith the ability of the ratio to reflect market risk, theliterature in management has been concerned mostly with itas a measure of firm performance.
In spite of the burgeoning literature on the subjectsurprisingly little research has explored the contemporaneousand lagged determinants of the market to book valueratio itself. While the literature sheds useful light onthe importance of the PB ratio, it is less than helpful inidentifying discretionary variables that managers may use toinfluence the market valuation of the firms. What, one mayask, could managers do to ensure that their firm is correctly -and perhaps aggressively - valued in the financial markets?That is the topic we address herein.
II. Data & Methods
77
A. Pooled Data Problems and Tests
We begin our exploration of the behavior of PB byconstructing a database (from COMPUSTAT) consistingof the S&P 500 companies as of 2000. Each year thereafterour sample's membership was revised to refiect changes inthe index's composition. The S&P index is very well knownand carefully designed to be representative of large publiclytraded US companies. Periodic updates maintain the index'sbasic character. By following the S&P's membership overtime, we were thereby working with a set of companies whichS&P believed to be particularly representative of the typesof firms that its index was designed to reflect. We based oursample on S&P in order to limit the risk of selection bias. Webelieve our data set to be a well-structured, representativesample of large to midsized US companies.
The earliest Branch-Gale (1983) study employed a groupof 600 industrial COMPUSTAT companies for the 1968-1981 period. The more recent Branch et al (2005) studyused the S&P 500 companies for the 1980-2000. Thus, thetwo prior studies used somewhat different databases fromthat of the current study, which begins at about the point(2000) that the second study ends, and ends in 2009.
Sampling issues surrounding the combination of cross-sectional and time series data have a long history (Chetty,1968; Mundlak, 1978). The pooling approaches used runthe risk that they may have "completely neglected theconsequences of the correlation which may exist betweenthe effects and the explanatory variables. Such a correlationleads to a biased estimator" (Mundlak, 1978, pg. 70).However, testing for such multicollinearity yielded VIFvalues lower than ten for all independent variables in ourmodel.
Furthermore, use of the existing datasets or indices likethe S&P 500 universe as a selection criterion is commonpractice to identify large corporations with readily availablestock performance and firm data (Dlugosz, Fahlenbrach,Gompers, and Metrick, 2006).
III. Time Series and CrossDistribution of Price to Book
Sectional
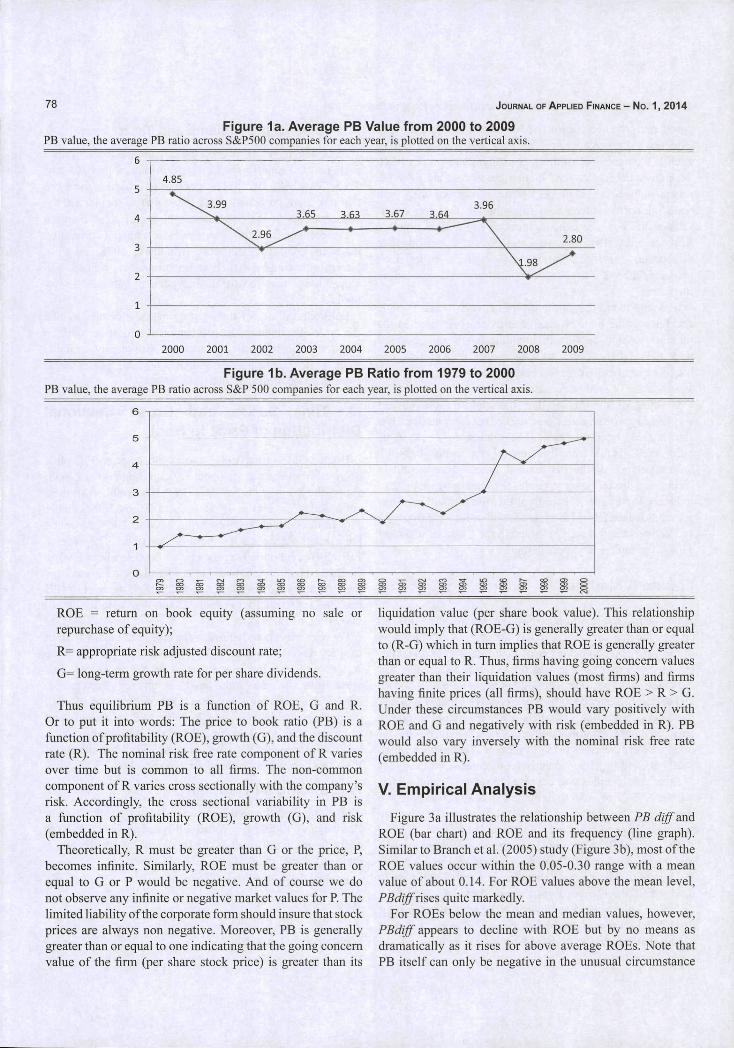
Branch-Gale (1968-1981) shows the average PB valuedeclined from about 2.3 to about 1.0, and Branch et al. (2005)shows the average PB for their S&P 500 sample rose fromabout 1.0 at the end of 1980 to about 5.0 by 2000 (Figure1 b). In the current study covering 2000 to 2009, however,the average PB does not exhibit a clear trend. The averagePB fell from about 5.0 at the end of 2000 to about 2.96 in2002, then rose to about 3.65 in 2003 and stayed around thislevel for the following four years. In 2008, the average PBdeclined substantially to around 2 and then rose to 2.80 in2009 (Figure la).
We primarily focus herein on the cross sectional variationof PB. As such we need to remove most of the timeseries variability in order to focus on the cross sectionalvariability. Our univariate analysis utilizes the variablePBdiff, the difference between each company's PB andthe corresponding average PB value. PBdiff values tendto cluster near zero (Figure 2a) but some PBs depart by asubstantial amount. We next examined the determinants ofPB's cross sectional and time series variability.
IV. Building a PB ModelWorking from the well-known Dividend Discount Model,
Branch et al. (2005) developed a theoretical framework fora PB model in the steady state (book equity growth rate =dividend growth rate):
PB = (ROE - G)/(R-G). (1)
Where:P= market price of stock;
B=per share book value;
78 JOURNAL OF APPLIED FINANCE - No. 1, 2014
Figure 1a. Average PB Value from 2000 to 2009PB value, the average PB ratio across S&P500 companies for each year, is plotted on the vertical axis.
6 ~
5
4
3
2
4.85
3.65 3.63 3.67 3.643.96
2.80
2000 2001 2002 2003 2004 2005 2006 2007 2008 2009
Figure 1b. Average PB Ratio from 1979 to 2000PB value, the average PB ratio across S&P 500 companies for each year, is plotted on the vertical axis.
5
4
ROE = return on book equity (assuming no sale orrepurchase of equity);
R= appropriate risk adjusted discount rate;
G= long-term grovi h rate for per share dividends.
Thus equilibrium PB is a function of ROE, G and R.Or to put it into words: The price to book ratio (PB) is afiinction of profitability (ROE), growth (G), and the discountrate (R). The nominal risk fi'ee rate component of R variesover time but is common to all finns. The non-commoncomponent of R varies cross sectionally with the company'srisk. Accordingly, the cross sectional variability in PB isa flinction of profitability (ROE), growth (G), and risk(embedded in R).
Theoretically, R must be greater than G or the price, P,becomes infinite. Similarly, ROE must be greater than orequal to G or P would be negative. And of course we donot observe any infinite or negative market values for P. Thelimited liability of the corporate form should insure that stockprices are always non negative. Moreover, PB is generallygreater than or equal to one indicating that the going concernvalue of the firm (per share stock price) is greater than its
liquidation value (per share book value). This relationshipwould imply that (ROE-G) is generally greater than or equalto (R-G) which in turn implies that ROE is generally greaterthan or equal to R. Thus, firms having going concern valuesgreater than their liquidation values (most firms) and firmshaving finite prices (all firms), should have ROE > R > G.Under these circumstances PB would vary positively withROE and G and negatively with risk (embedded in R). PBwould also vary inversely with the nominal risk free rate(embedded in R).
V. Empirical Analysis
Figure 3a illustrates the relationship between PB diff andROE (bar chart) and ROE and its frequency (line graph).Similar to Branch et al. (2005) study (Figure 3b), most of theROE values occur within the 0.05-0.30 range with a meanvalue of about 0.14. For ROE values above the mean level,PBdiff rises quite markedly.
For ROEs below the mean and median values, however,PBdiff appears to decline with ROE but by no means asdramatically as it rises for above average ROEs. Note thatPB itself can only be negative in the unusual circumstance
BRANCH, SHARMA, CHAWLA, AND TU - AN UPDATED MODEL OF PRICE TO BOOK 79
Figure 2a. Distribution of PBdiff for the Sample Period of 2000 to 2009The variable, PBdiff is the difference between each company's PB value and the corresponding average PB value.
Figure 2b. Distribution of PBdiff for the Sample Period of 1979 to 2000The variable, PBdiff, is the difference between each company's PB value and the corresponding average PB value.
20 -
5 -
- 5 -A - 3 - 2 - 1
of a negative book value and in general will not be verymuch below unity (or the firm becomes a candidate forliquidation). The liquidation value of a firm with a verylow or negative ROE tends to place a floor on its marketvalue. Thus, we should not be surprised to find that for ROEsabove its average value, ROE has a more favorable impacton PBdiffthan is the negative impact on PBdiff of a belowaverage ROEs.
VI. A Multivariate Model
The above reported univariate relationships are consistent
with our expectations.We next develop a more robust set of relationships by
building a multivariate regression model in the relationship:PB = (ROE - G)/(R-G). The firm's ROE, R, and G are alllong-term forward-looking expectations. Thus proxies forthose variables need to capture expectations of their futurevalues. Accordingly we built our model as follows. Firstwe sought to remove the time series variability of PB. Tothat end we followed Branch et al. (2005) in including inour model the variable average annual PB for our sampleof S&P 500 firms. All of the remaining model variables aredesigned to proxy for the three forward looking expectations
80 JOURNAL OF APPLIED FINANCE - NO. 1, 2014
Figure 3a. PBdiff rises with ROE in 2000-2009This exhibit shows the relation between PBdiff and ROE in 2000-2009. ROE value is plotted on the horizontal axis. The variable, PBdiff,the difference between each company's PB value and the corresponding average PB value, is plotted on the primary vertical axis. Thenumber of observations are plotted on the secondary vertical axis.
-400
10% 15% 20%
IPB diff
25% 30% 35% 40% 45% 50%
ROE
•—number of observations
Figure 3b. PBd/Tf rises with ROE in 1979-2000This exhibit shows the relation between PBdiff and ROE in 1979-2000. ROE value is plotted on the horizontal axis. The variable, PBdiffthe difference between each company's PB value and the corresponding average PB value, is plotted on the primary vertical axis. Thenumber of observations are plotted on the secondary vertical axis.
-2
2500
3000
-10005% 10% 15% 20% 25% 30% 35% 40% 45% 50%
ROE
of profitability, risk and growth.
A. Profitability Variables: ROE
We expect future profitability to be related to the currentlevels of return on equity (ROE) and return on capital (ROC)as well as the current dividend as it relates to book value. Tothe extent that the future will be like the past, current ROEshould proxy for the future level. ROC represents a broadermeasure of profitability which removes the impact ofleverage and as such may add to the model's ability to explainthe future ROE. Similarly, the dividend as a percentage ofbook value tends to reflect the firms confidence in its abilityto continue to earn profits sufficient to pay out dividends inthe future. Some of these relations may be nonlinear andmay interact with each other so various forms of the above
mentioned variables may enter the regression. We expectprofitability to play a major role in explaining PB.
B. Growth Variables: G
We expect future growth to be related to past growth ratesin sales and profits as well as the intensity and growth inresearch and development (R&D) and advertising. Again tothe extent that the fijture will be like the past, we expect thatpast levels of sales and profits will proxy for future rates.In addition the relative intensity of R&D and advertisingspending, which are designed to build future value, areexpected to help explain future growth rates. Growthwithout profits is, however, of little or no value to investors.Accordingly interacting the above mentioned variables withprofitability variables is expected to show their power.
BRANCH, SHARMA, CHAWLA, AND TU - A N UPDATED MODEL OF PRICE TO BOOK 81
Table I. Definitions and Summary Statistics for Exogenous VariablesThis table shows the definitions and summary statistics for the exogenous variables. The sample period is 2000-2009. Sample means,medians, and standard deviations are provided for all S&P 500 companies.
Variable Definition Sample Mean Median Standardsize deviation
Firm price to book ratio
mnpb Annual average price to book ratio
Firm profitability
roe Return on equity: calculated as the firm's netincome divided by equity
db The firm's dividend as a percentage of bookvalue
roc Return on capital: calculated as the firm'snet income divided by the sum of equity andlong term debt
shretn Change in the firm's stock price as aproportion of change in retained earnings
Firm growth
rdintb R&D intensity: research and developmentexpenses as a proportion of total revenue
Annual revenue growth rate
4839
4839
4793
4827
4827
2612
3.470 3.639 0.652
0.131 0.140 0.328
0.0488 0.0322 0.0637
0.0785 0.0816
4.046
0.0656
1.686
0.0284
0.146
46.31
0.0867
revgrth
advintb
Firm risk
cover
capxintb
Advertising intensity: advertising expensesas a proportion of revenue
Interest coverage ratio: calculated as thefirm's EBIT divided by interest expenses
Capital intensity: calculated as the firm'scapital expenditures divided by total revenue
4839
2062
4369
4678
0.0693
0.0299
28.82
0.0657
0.0623
0.0182
6.512
0.0^92
0.196
0.0309
98.98
00766
debtratio Calculated as the firm's long term debtdivided by the sum of equity and long termdebt
4827 0.367 0.349 0.242
C. Risk Variables: R
We expect both leverage and capital intensity to impact themarket's perception of risk. We use both the long term debtto capital ratio and the coverage ratio to reflect the extent ofleverage. As capital intensity is a major source of fixed costs,we expect it to be associated with risk.
The definitions and summary statistics for the exogenousvariables are shown in Table I. In this study, we follow Branchet al. (2005) procedures to build our model. We use both thelinear and non-linear form of the variables in order to capturethe relationship between PB and expected profitability,growth and risk. Then we winsorize our variables using a1 % screen and normalize each of the independent variablesexcept average PB and then create squares of the normalizedvariables. We also test a number of interaction terms someof which are designed to reflect the joint impact of annual
average PB and various independent variables while someothers capture the joint impact of profitability and growth.Our final model excludes industry dummies as Branch etal. (2005) finds that differences in PBs across industries arelargely due to differences in profitability, growth and risk.
VII. The Regression ModelUsing a stepwise regression procedure we obtain a model
with 17 statistically significant variables with an R^of0.5241. The multicollinearity test yields VIFs of less thanten for all independent, which indicates the absence of amulticollinearity problem. We also compute the correlationmatrix for the 17 independent variables (shown in TableIII). The absolute value of most correlation coefficients aresmaller than 0.1.
The specific PB model (stage I) is reproduced in Table 11and Table III.
82 JOURNAL OF APPLIED FINANCE - No. 1, 2014
Table II. PB Model Stage I Regression ResultsThis table presents regression results for PB Model Stage I. The dependent variable is price to book ratio. All of the level independentvariables except mnpb are normalized. The non-linear variables and interaction terms are created based on the normalized level variables.The sample period is 2000-2009.
mnpb
db
db^
roe
mnpb*|roe|
roe
roc
mnpb*shretn^
nmpb*rdintb
mnpb*revgrth
mnpb*advintb
roe*revgrth
roc*revgrth
cover
capxintb
debtratio
Constant
Observations
R^
Adjusted R^
Coefficient
0.5896
1.7070
-0.0532
1.0892
0.7331
-0.2249
0.6313
-0.0166
0.0052
0.1666
0.1123
0.0393
0.5628
-0.1312
0.2889
-0.1137
-0.4276
0.5928
4839
0.524
0.522
f-statistic
(8.9755)***
(28.0271)***
(-4.1902)***
(19.1999)***
(21.3660)***
(-12.6582)***
(11.5137)***
(-3.6831)***
(3.1899)***
(9.6990)***
(9.1273)***
(2.1574)**
(10.7010)***
(-3.1044)***
(6.4386)***
(-2.6702)***
(-8.5146)***
(2.6281)***
***SignificantattheO.Ol level.**Significant at the 0.05 level.*Significant at the 0.10 level.
Compared with Branch et al. (2005), /î-square declinedfrom 0.6324 to 0.5241, as tbe number of observationsin this study is less than half that of the 2005 study. Weidentify 15 pairs of variables that are highly correlated.As any one of the 15 pairs entering the model will lead tomulticollinearity, we select one variable from each pair.Among the original 14 variables, mnpb, db, db^, mnpb*\roe\,mnpb*roc^, mnpb*rdintb, mnpb*revgrth, andmnpb*advintbare all retained. Although mnpb*roc, mnpb*capxintb, shret\mnpb *cover, artd mnpb *roe are not included in the currentmodel, their level variables, roc, capxintb, mnpb*shretn\cover, and roe, which are highly correlated with these fivevariables respectively, emerge significantly in the model. Soonly one variable, mnpb *shreln , used in 2005 paper lost itsexplanation. Furthermore, we select four new variables, i.e.,roe^, roe*revgrth, roc*revgrth, and debtratio, to be includedin the model. Grouping the variables by category we find asfollows.
A. Pure Time Series Variables
mnpb = annual average PB(.0087 vs .120 in 2005 paper). (2)
Thus, mnpb by itself explain about 0.87% of the variabilityin the dependent variable, which is greatly reduced comparedto the 2005 study. From Figure 1, mnpb doesn't change asmuch in the 2000-2009 period as in the period of 1979-2000,thereby its power is much smaller than that in 2005 study.The partial contribution to B} appears in parentheses.
B. Profitability Variables
db = dividend / book (.3016 vs. .004 in 2005);
àW= dividend/book squared (.0015 vs. .238 in 2005);
roe = return on equity(.O651 vs. mnpb_roen .004 in 2005);
BRANCH, SHARMA, CHAWLA, AND TU - A N UPDATED MODEL OF PRICE TO BOOK 83
H
C(U
•oc(UQ .
a>TJç0)s:
for
XiZ
reSco
B.SooKnc/}C3(1>
x;"0)00C3
odel
oaOH
the
. T H
re
oo
(0
ent
-acOJO.<u
T3
_g
qiujxdeo
J3A03
qju!Ape,qduui
BA3j,qduiu
q;U!pj,qduiu
3OJ
,30J
|3Oj|,qduui
qp
qduuj
S S Sd 9 cb
o od d
9 o
o — ^ (N f^ o ^o d o_ d d ? 2-
g s g S s s ^ s ?O O o O o O o Ö Ö
„ 8 ^ 5 8 9 5 : ^ 8 2 : 8 Ö Ö <N o "H o —00 ^ o
d ^ 9 o 9 o 9 d d d d d 9 d 9 ' d d d o d ? £
d 9 9 d d d 9 o 9 d ° ¿
o 00 o "" op 00 p -^ pd d d 9 d
— Ç S — iïoo SUS— 9 9 9 9 — ^ 9d d P o Q o 0 0 .
o r - o iT) Ö o o o ^ o, — l O ^ O C N O ' « í ; O ~ o
Ö Ö O O ö c 5 o ^ ö
f i q ^ q r - i q — q i - OÖ O ^ ^ Ö Ö Ö Ö Ö Ö Ö Ö
as o o o o -H o — o •^ o^f ^ q ( N q f N q s q q q
o t^ O f N O o O i r i O r O t ^ o o O C D - ^ ^ O o O^ 20 9 o ' ^ o 9 — : 9 o 9 0 9 9 9 9 9 0 9 0 9 0 9 P 9 P 9 0 9 0 9 0 9
— o .— 0 0 — .—' d c> c^ <D —' - - - - 9 d ' — ' ¿ ^ _^ '—I
Br :
a.
.H
J3P.
>
*CL
.S- 0cd
I
84
mnpb*|roe| = roe absolute value interacted with annualaverage PB (.0375 vs. .005 in 2005);
roe^= roe squared (.0254);
roc = retum on capital (.0309 vs. mnpb_roc .0123 in 2005);
mnpb*roc^ = roc squared interacted with annual average PB(.0017 vs. .037 in 2005);
shret = the square of (change in stock price / change inretained eamings) (.0009 vs. mnpbshretnnsq .0065 in2005).
Variables mnpbjshretn could not explain PB in period2000-2009, although they have a significant role in period1979-2000 in 2005 study. And roe' is the newly enteringvariable.
All of the above variables except roe', db' and mnpb*roc^have positive signs and are highly significant (at least at the95% level). Together they imply that PB rises with dividend/ book, roe, and roc, the absolute value of roe with a greaterpositive effect the higher the annual average value for PB,which is indicated by the positive coefficient of mnpb*\roe\.These variables explain about 46.5% of the variability inPB, which is higher than that the 41% in 2005 study. So,profitability seems to play a greater role in explaining PB inthe recent period.
C. Growth Variables
mnbp*rdintb = R&D intensity interacted with annualaverage PB (.0096 vs. .020 in 2005);
mnpb*revgrth = revenue growth interacted with annualaverage PB (.0088 vs. .017 in 2005);
roe*revgrth = revenue growth rate interacted with roe(.0083);
roc*revgrth = revenue growth rate interacted with roc(0.0010);
nmpb*advintb = advertising intensity interacted with annualaverage PB (.0005 vs. .017 in 2005).
All of the three growth variables, mnpb*rdintb,mnpb*revgrth, mnpb*advintb, used in 2005 study, arestill significant and have the same positive sign as in the2005 study but with less power. Besides, two new growthvariables are added to the model: the interaction terms,roe*revgrth and roc*revgrth. The five growth variables alltogether explain about 2.8% of the variability in PB, whichis lower than that the 5.4% in the 2005 study.
Expected growth does impact PB but appears to havea much smaller affect than does profitability. Besides, thepositive coefficient of interaction term roe*revgrth suggestsroe with a greater positive impact on PB the higher level ofrevenue growth rate.
JOURNAL OF APPLIED FINANCE - No. 1, 2014
D. Risk Variablescover = interest coverage ratio (.0039 vs. mnpb_cover .004in 2005);
capxintb = capital intensity(0.0007 vs. mnpb_capxintbO.Q29);debtratio = total long term debt/total capital (0.0181).
All of the level risk variables cover, capxintb anddebtratio emerge significantly in the model. Together thethree risk variables explain about 2.3% of the variability inPB, only 1% lower than that 3.3% in the 2005 study. Note,although db and db^ are classified as profitability variables,such variables have both a profitability and risk component.Companies that pay dividends tend to have more stableeaming streams than those that do not. Here, db and db'together contribute 30.3%. Thus the impact of risk on PBvariability is greater than 2.3%.
In the model building, we also try the change of defaultspread and the change of the term spread, which are measureof default risk and interest risk, and their interactions with thethree risk variables. We expect the change of default spread(deltaDEF) may have a significant negative coefficient,the interaction between deltaDEF and cover positive, theinteraction between deltaDEF and capxintb{or debtratio)negative, and the level and interaction terms of change ofterm spread (deltaTERM) be opposite to those of deltaDEF.It tums out that the yearly average deltaDEF and deltaTERMare highly correlated and they have the right sign but theylose significance as other profitability variables come in themodel. Some of the interaction terms get the wrong sign. Inthe end, they all are out of model as they do not play a roleas big as other variables selected.
In the 2005 study, the mnpb variable and the nine interactionterms between mnpb and various independent variablestogether explained 37.5% of variability in PB. In contrast, themnpb s contribution is greatly reduced in the recent period2000-2009. Similarly the nine interaction terms are nowmuch less important. Only five mnpb interactions remain inthe model, together with mnpb explaining only about 6.68%of variability in PB. We do, however, find a significant jointimpact of profitability and growth, which was not significantin the 2005 study. However, these newly entered variablescould not make up the lost power of mnpb and its interactionterms. Therefore, we attribute the smaller i?-square in ourstudy to the reduced power of annual average ¥B{mnpb).
Having fit our model to contemporaneous data, we nextadded a data set of lagged variables which enter the model ina second stage. The second stage containing our lagged dataset, explains the first stage residual. Working with a set of 12variables, we were able to explain 19.39% of the variabilityof the residual. Since our first stage explained 52.41% ofthe variability and the second stage explained 19.39% of theresidual our combined explanatory power was about 61.63%
BRANCH, SHARMA, CHAWLA, AND TU - A N UPDATED MODEL OF PRICE TO BOOK 85
Table IV. PB model Stage II Regression ResultsThis table presents regression results for PB Model Stage II. The dependent variable is the residuals from Stage I regressions. All ofthe level independent variables except mnpb are normalized. The non-linear variables and interaction terms are created based on thenormalized level variables. The sample period is 2000-2009. r-statistics are in parentheses.
Coefficient f-statistic
pbjag
db lag
dbMag
revgrthlag
debtratio lag
roe lag
rdintblag
roeMag
cover lag
roc_lag
deltadePdebtratio lag
mnpb*|roe lag
Constant
Observations
R^
Adjusted ^-
1.53
-1.19
0.08
-0.21
0.19
-0.28
-0.18
-0.05
-0.11
0.13
-0.09
0.05
-0.11
4839
0.194
0.192
(29.99)***
(-19.11)***
(6.76)***
(-5.48)***
(4.48)***
(-5.88)***
(-3.29)***
(-3.46)***
(-2.74)***
(2.86)***
(-2.55)**
(2.09)**
(-2.33)**
***Significant at the 0.01 level.**Significant at the 0.05 level.*Significant at the 0.10 level.
Figure 4a. Distribution of the Residual Values from Stage II RegressionThis figure plots the distribution of stage II regression residual values for the sample period of 2000 to 2009.
-? -6 -5 -4 -3 -2 - I 0 I 2 3 4 5 6 7 8 3 10 I I 12 Í3
86 JOURNAL OF APPLIED FINANCE - NO. 1 , 2014
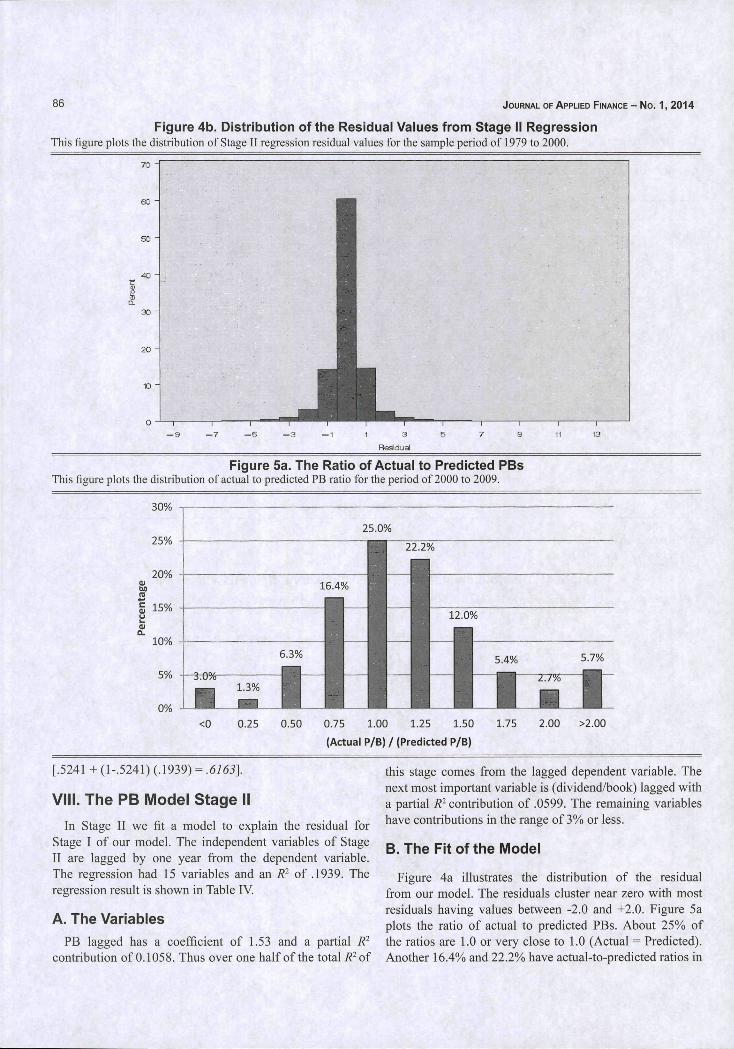
Figure 4b. Distribution of the Residua! Values from Stage II RegressionThis figure plots the distribution of Stage II regression residual values for the sample period of 1979 to 2000.
70 -
— 9 —7 —5 —3 — 1 1 3 5 7 9
Residual
Figure 5a. The Ratio of Actual to Predicted PBsThis figure plots the distribution of aetual to predieted PB ratio for the period of 2000 to 2009.
<0 0.25 0.50 0.75 1.00 1.25 1.50
(Actual P/B) / (Predicted P/B)
1.75 2.00 >2.00
[.5241 + (1-.5241) (.1939) = .6163\
VIII. The PB Model Stage II
In Stage II we fit a model to explain the residual forStage I of our model. The independent variables of StageII are lagged by one year from the dependent variable.The regression had 15 variables and an S^ of .1939. Theregression result is shown in Table IV.
A. The Variables
PB lagged has a eoefficient of 1.53 and a partial R^contribution of 0.1058. Thus over one half of the total 7? of
this stage comes from the lagged dependent variable. Thenext most important variable is (dividend/book) lagged witha partial R^ contribution of .0599. The remaining variableshave contributions in the range of 3% or less.
B. The Fit of the Model
Figure 4a illustrates the distribution of the residualfi'om our model. The residuals cluster near zero with mostresiduals having values between -2.0 and +2.0. Figure 5aplots the ratio of actual to predicted PBs. About 25% ofthe ratios are 1.0 or very close to 1.0 (Actual = Predicted).Another 16.4% and 22.2% have actual-to-predicted ratios in
BRANCH, SHARMA, CHAWLA, AND TU - A N UPDATED MODEL OF PRICE TO BOOK
Figure 5b. The Ratio of Actual to Predicted PBsThis figure plots the distribution of actual to predicted PB ratio for the period of 1979 to 2000.
87
<0 0.25 0.50 0.75 1.00 1.25 1.50 1.75 2.00 >2.00
(Actual P/B) / (Predicted P/B)
Figure 6a. Actual and Predicted PB Move Together in 2000-2009This figure shows the actual PB and Predicted PB moves together in the period of 2000 to 2009. The beginning actual PB to Predicted PBratio is plotted on the horizontal axis. Change in Actual to Par, the difference between the ending Actual PB to Predicted PB ratio and thebeginning actual PB to Predicted PB ratio, is plotted on the vertical axis.
u
-1<0.7 0.7-0.9 0.9-1.1 1.1-1.3
Beginning (Actual P/B) /(Predicted P/B)
the range of .75 and 1.25 respectively. Overall, about 63.6%of the observations (.25 + .164 +.222 = .636) are in thevicinity of .75 to 1.25.
IX. Dynamic Behavior
From the above reported results, we see that our modelexplains our dataset well.
We explore the model's dynamic properties in this section.We observe a similar tendency for the ratio of actual topredicted PB to move toward one over the period 2000-2009(Figure 6a) as over the period 1979-2000 (Figure 6b). If thebeginning actual is below the predicted, the ratio tends to riseand if the actual begins above the predicted, the ratio tends tofall. Put another way observations with large residuals tendto have smaller residuals in the subsequent period.
X. Actual versus Model Values andSubsequent Firm Performance
We next explore the market's ability to anticipate futurecompany performance, particularly future profitabilityand growth. When a company's actual PB is above itsmodel value, the market probably expects the company'sperformance to improve. Similarly, a company with anactual PB below its model value suggests that the marketis concerned that the company's performance is likely todeteriorate. The 2005 study documented the market's abilityto anticipate future company performance for the period of1979-2000. We also follow the procedure used in 2005 to testthe hypothetical set of relation over the period 2000-2009.Figure 7a illustrates the relationship between the beginning
88 JOURNAL OF APPLIED FINANCE - No. 1, 2014
Figure 6b. Actual and Predicted PB Move Together in 1979-2000This figure shows the actual PB and Predicted PB moves together in the period of 1979 to 2000. The beginning actual PB to Predicted PBratio is plotted on the horizontal axis. Change in Actual to Par, the difference between the ending Actual PB to Predicted PB ratio and thebeginning actual PB to Predicted PB ratio, is plotted on the vertical axis.
0.75
-0.75<0.7 0.7-0.9 C.9-1.1 1.1-1.3 >1.3
Beginning (Actual P/B) / (Predicted P/B)
Figure 7a. Lead Changes in ROE and Residuals in 2000-2009This figure shows the relationship between the beginning period residual and the change in ROE in the following year for the period 2000-2009. The beginning period residual is plotted on the horizontal axis. Lead change in ROE, the difference between the ending period ROEand the beginning period ROE, is plotted on the primary vertical axis. The number of observations are plotted on the secondary vertical
Residuals1 Average Lead Change in ROE - No. of observations
period residual and the change in ROE in the following yearfor the period 2000-2009. We see that the more positive theresidual the more ROE tends to rise, but the pattern is not aspersistent as in the 2005 study.
Figure 8a illustrates the relation between the beginningperiod residual and subsequent change in revenue growth.The more negative is the residual, the more the revenuegrowth rate tends to fall. Finally Figure 9a illustrates thejoint association of profitability and growth with the residual.Firms whose ROEs and revenue growth rates are rising tendto have positive beginning period residuals.
XI. Summary, Conclusion, and Directionfor Further Work
We have updated an earlier analysis by rebuilding our PBmodel and exploring the behavior of PB with a more recentsample. Using the foundation of the dividend discount modelwe have estimated an empirical equation of two stageswhich explain about 62 percent of the variation in annualPB levels for the S&P 500 companies from the year 2000 to2009. Most of the variables used in the earlier Branch et al.(2005) study still explain a significant part of the variation
BRANCH, SHARMA, CHAWLA, AND TU - AN UPDATED MODEL OF PRICE TO BOOK 89
Figure 7b. Lead Changes in ROE and Residuals in 1979-2000This figure shows the relationship between the beginning period residual and the change in ROE in the following year for the period 1979-2000. The beginning period residual is plotted on the horizontal axis. Lead change in ROE, the difference between the ending period ROEand the beginning period ROE, is plotted on the primary vertical axis. The number of observations are plotted on the secondary verticalaxis.
Figure 8. Lead Changes in Revenue Growth and Residuais in 2000-2009This figure shows the relationship between the beginning period residual and the change in revenue growth in the following year forthe period 2000-2009. The beginning period residual is plotted on the horizontal axis. Lead change in revenue growth, the differencebetween the ending period revenue growth and the beginning period revenue growth, is plotted on the primary vertical axis. The numberof observations are plotted on the secondary vertical axis.
I Average Lead Change in Revenue Growth —•— No. of observations
90 JOURNAL OF APPLIED FINANCE - NO. 1 , 2014
Figure 8b. Lead Changes in Revenue Growth and Residuals in 1979-2000This figure shows the relationship between the beginning period residual and the change in revenue growth in the following year forthe period 1979-2000. The beginning period residual is plotted on the horizontal axis. Lead ehange in revenue growth, the differencebetween the ending period revenue growth and the beginning period revenue growth, is plotted on the primary vertical axis. The numberof observations are plotted on the secondary vertical axis.
Residuals^ ^ ^ Average Lead Change in Revenue Growth — • — No. of observations
Figure 9a. The Joint Association of Profitabiiity and Growth with the Residual in 2000-2009This figure shows the joint association of profitability and growth with the residual in 2000-2009. Lead change in ROE, the differencebetween the ending period ROE and the beginning period ROE, is plotted on the x-axis. Lead change in revenue growth, the differencebetween the ending period revenue growth and the beginning period revenue growth, is plotted on the y-axis. The beginning periodresidual is plotted on the z-axis.
Residual
-1.5-0.5
0.32-1
-0.34-0.32
-1-0.34 Lead Change in ROE
-0.5-0.5
Lead Change in Revenue Growth0.5-1.5
of PB. And we also find a similar time series behavior of theresiduals. Observations with large residuals in period t tendto have smaller residuals in period t-i-1. This movement is aresult of both the predicted moving toward the actual and theactual moving toward the predicted.
We also explored the market's ability to anticipatechanges in performance. We found that those observationswith positive residuals (actual greater than model valuePB) tended to experience higher next period profitability(ROE) and more rapid revenue growth. The performance of
those with negative residuals tended to deteriorate. Thus themarket price appears to refiect anticipatory information notpresent in the model value.
Our current PB model focuses on four basic forces toexplain both cross section and time series variability inPB. First, the time series variability in the yearly averagePB picks up most of the market variability. This averagePB variable accounts for about 1% of the PB variability inour sample. Second, various profitability related variablesexplain about 46.5% of PB variability. Profitability
BRANCH, SHARMA, CHAWLA, AND TU - A N UPDATED ÍVIODEL OF PRICE TO BOOK 91
Figure 9b. The Joint Association of Profitability and Growth with the Residual in 1979-2000This figure shows the joint association of profitability and growth with the residual in 1979-2000. Lead change in ROE, the differencebetween the ending period ROE and the beginning period ROE, is plotted on the x-axis. Eead change in revenue growth, the differencebetween the ending period revenue growth and the beginning period revenue growth, is plotted on the y-axis. The beginning periodresidual is plotted on the z-axis.
-0.5-0.5
Lead Change in Revenue Growth0.5-1.5
levels above its mean value tend to impact PB more thanprofitability levels below its mean. Third, growth variablesexplain about 2.8% of PB variability. Finally risk variablesexplain about 2.3% of PB variability. Profitability still has avery powerful effect on PB in the more recent period. Notethat certain of the variables classified as profitability have
risk and growth components. Moreover, the market may bereacting to factors not refiected in our model and therebyanticipating growth and risk factors that we have not beenable to quantify. Still, we do find that profitability is morepowerful in explaining variability in PB in the 2000-2009period than in the 1979-1999 period.«
References
Amil, R. and J. Livnat, 1988, "Diversification and the Risk-Return Trade-off," Academy of Management Journal 31 (No. 1 ), 154-166.
Amit, R. and B. Weraerfelt, 1990, "Why do Firms Reduce Business Risk?"Academy of Management Journal 33 (No. 3), 520-533.
Anand, J. and H. Singh, 1997, "Asset Redeployment, Acquisitions andCorporate Strategy in Declining Industries," Strategic Management
o. SI), 99-118.
Banz, R.W., 1981, "The Relationship Between Return and Market Valueof Common Stocks," Journal of Financial Economics 9 (No. 1), 3-18.
Barber. B.M. and J.D. Lyon, 1997, "Firm Size, Book-to-Market Ratio, andSecurity Returns: A Holdout Sample of Financial Firms," Journal ofFinance 52 (No. 2), 875-883.
Barton, S.L., 1988, "Diversification Strategy and Systematic Risk: AnotherLook," Academy of Management Journal 3 \ (No. 1), 166-175.
Basu, S., 1983, "The Relationship between Earnings' Yield, Market Valueand Return for NYSE Common Stocks: Further Evidence," Journal ofFinancial Economics 12 (No. 1), 129-156.
Becker, B. and B. Gerhart, 1996, "The Impact of Human ResourceManagement on Organizational Performance: Progress and Prospects,"Academy of Management Journal 39 (No. 4), 779-801.
Bhandari, L.C., 1988, "Debt/Equity Ratio and Expected Common StockReturns: Empirical E\idence," Journal of Finance 43 (No. 2), 507-528.
Black, F., 1993, "Return and Beta," Journal of Portfolio Management 20(No. I), 8-8.
Branch, B.S. and B. Gale, 1983, "Linking Corporate Stock PricePerformance to Strategy Formulation," Journal of Business Strategy4 (No. 1), 44-50.
Branch, B.S., A. Sharma, B. Gale, C. Chichirau, and J. Proy, 2005,"Explaining Price to Book," Business Quest, westga.edu/~bquest/2005/Model.pdf.
Breeden, D.T., 1979, "An Intertemporal Asset Pricing Model withStochastic Consumption and Investment Opportunities," Journal ofFinancial Economics 1 (No. 3), 265-296.
Breeden, D.T., M.R. Gibbons, and R.H. Litzenberger, 1989, "Empirical Testof the Consumption-Oriented CAPM," Journal of Finance 44 (No. 2),231-262.
Capaul, C , I. Rowley, and W.F. Sharpe, 1993, "International Value andGrowth Stock Returns," Financial Analysts Journal 49 (No. 1), 27-36.
Chan, L.K.C., Y. Hamao, and J. Lakonishok, 1991, "Fundamentals andStock Returns in Japan," Journal of Finance 46 (No. 5), 1739-1764.
Chang, S.J., 2003, "Ownership Structure, Expropriation, and Performanceof Group-Affiliated Companies in Korea," Academv of ManagementJournal46 (No. 2), 23%-252.
Cheng, D.C., B.E. Gup, L.D. Wall, 1989, "Financial Determinants of BankTakeovers," Jo«/-na/ of Money, Credit & Banking 2\ (No. 4), 524-536.
92 JOURNAL OF APPLIED FINANCE - NO. 1, 2014
Chetty, V.K., 1968, "Pooling of Time Series and Cross Section Data,"Econometrica 36 (No. 2), 279-290.
Cho, H.J. and V. Pueik, 2005, "Relationship Between Innovativeness,Quality, Growth, Profitability, and Market Value," StrategicManagement Journal 26 (No. 6), 555-575.
Combs, J.G. and D.J. Ketchen, Jr., 1999, Explaining Interfirm Cooperationand Performance: Toward a Reconciliation of Predictions from theResource-Based View and Organizational Economics," StrategicManagement Journal 20 (No. 9), 867-888.
Daniel, K. and S. Titman, 1997, "Evidence on the Characteristics of CrossSectional Variation in Stock Returns," Journal of Finance 52 (No. 1 ),1-33.
Davis, G.F. and S.K. Stout, 1992, "Organization Theory and the Marketfor Corporate Control: A Dynamic Analysis of the Characteristics ofLarge Takeover Targets, 1980-1990," Administrative Science Quarterlv37 (No. 4), 605-633.
Davis, J.L., 1994, "The Cross-Section of Realized Stock Returns: The Pre-COMPUSTAT Evidence," Journa/ of Finance 49 (No. 5), 1579-1593.
Davis, .I.L., F.F. Fama, and K.R. French, 2000, "Characteristics,Covariances, and Average Returns: 1929 to X')')! ,'^ Journal of Finance55 (No. 1), 389-406.
De Bondt, W.F.M. and R.H. Thaler, 1987, "Further Evidence on InvestorOverreaction and Stock Market Seasonality," Journal of Finance 42(No. 3), 557-581.
DIugosz, J., R. Fahlenbrach, P. Gompers, and A. Metrick, 2006, "LargeBlocks of Stock: Prevalence, Size, and Measurement," Journal ofCorporate Finance 12 (No. 3), 594-618.
Dushnitsky, G. and M.J. Lenox, 2006, "When Does Corporate VentureCapital Investment Create Firm Value?" Journal of Business Venturing21 (No. 6), 753-772.
Dutta, S., O. Narasimhan, and S. Rajiv, 1999, "Success in High-TechnologyMarkets: Is Marketing Capability Critical?" Marketing Science 18 (No.4), 547-568.
Dutta, S., 0 . Narasimhan, and S. Rajiv, 2005, "Conceptualizing andMeasuring Capabilities: Methodology and Empirical Application,"Strategic Management Journal 2() (No. 3), 277-285.
Fama, E.F. and K.R. French, 1992, "The Cross-Section of Expected StockReturns," Journal of Finance Al (No. 2), 427-465.
Fama, E.F. and K.R. French, 1993, "Common Risk Factors in the Returnson Stocks and Bonds," Journal of Financial Economics 33 (No. 1 ),3-56.
Fama, E.F. and K.R. French, 1995, "Size and Book-to-Market Factors inEarnings and Returns," Jowrna/o/fina«ce 50 (No. 1), 131-155.
Fama, E.F. and K.R. French, 1998, "Value Versus Growth: The InternationalEvidence," Journal of Finance 53 (No. 6), 1975-1999.
Fama, E.F. and K.R. French, 2006, "The Value Premium and the CAPM,"Journal of Finance 61 (No. 5), 2163-2185.
Fombrun, C. and M. Shanley, 1990, "What's in a Name? ReputationBuilding and Corporate Strategy," Academy of Management Journal33 (No. 2), 233-258.
Gibbs, P.A., 1993, "Determinants of Corporate Restructuring: The RelativeImportance of Corporate Governance, Takeover Threat, and Free CashFlow," Strategic Management Journal 14 (SI), 51-68.
Griffin, J.M. and M.L. Lemmon, 2002, "Book-to-Market Equity, DistressRisk, and Stock Returns," Jowrna/o/F/í7o«ce 57 (No. 5), 2317-2336.
Gutierreez, Jr., RC, 2001, "Book-to-Market Equity, Size, and theSegmentation of the Stock and Bond Markets," Texas A&M UniversityWorking Paper.
Hahn, J. and H. Lee, 2009, "Financial Constraints, Debt Capacity, and theCross-Section of Stock Returns," Journal of Finance 64 (No. 2), 891 -92L
Haugen, R.A., 1995, The New Finance: The Ca.ie Against Efficient Markets,Prentice Hall, Upper Saddle River, NJ.
Huselid, M.A., 1995, "The Impact of Human Resource ManagementPractices on Turnover, Productivity, and Corporate FinancialPerformance," Academy of Management Journal 38 (No. 3), 635-672.
Huselid, M.A., S.E. Jackson, and R.S. Schüler, 1997, "Technical andStrategic Human Resource Management Effectiveness as Determinantsof Firm Performance," Academy of Management Journal 40 (No. 1),171-188.
Iyer, D.N. and K.D. Miller, 2008, "Performance Feedback, Slack, and theTiming of Acquisitions," Academy of Management Journal 51 (No. 4),808-822.
Jensen, G.R., R.R. Johnson, and J.M. Mercer, 1997, "New Evidence onSize and Price-to-Book Effects in Stock Returns," Financial AnalystsJournal 53 (No. 6), 34-42.
Lakonishok, J., A.,Shleifer, and R.W. Vishny, 1994, "Contrarian Investment,Extrapolation, and Risk," Journal of Finance 49 (No. 5), 1541 -1578.
Lindenberg, E.B. and S.A. Ross, 1981. "Tobin's q Ratio and IndustrialOrgim'aation," Journal of Business 54 (No. 1), 1-32.
Lintner, J., 1965, "The Valuation of Risk Assets and the Selection of RiskyInvestments in Stock Portfolios and Capital Budgets," Review ofEconomics and Statistics 41 (No. 1), 13-37.
Lu, J.W. and P.W. Beamish, 2004, "International Diversification and FirmPerformance: The S-Curve Hypothesis," Academy of ManagementJournal 47 (No. 4), 598-609.
MacKinlay, A.C., 1995, "Multifactor Models do not Explain Deviationsfrom the CAPM," Journal of Financial Economics 38 (No. 1 ), 3-28.
Malkiel, B.G., 2003, "The Efficient Market Hypothesis and its Critics,"Journal of Economic Perspectives 17 (No. 1), 59-82.
McDonald, M.L., P. Khanna, and J.D. Westphal, 2008, "Getting them toThink Outside the Circle: Corporate Governance, CEOS' ExternalAdvice Networks, and Firm Performance," Academy of ManagementJournal 5\ (No. 3), 453-475.
Montgomery, C.A. and B. Wemerfelt, 1988, "Diversification, RicardianRents, and Tobin's q," Rand Journal of Economics 19 (No. 4), 623-632.
Morck, R., A. Shleifer, and R.W. Vishny, 1989, "Alternative Mechanismsfor Corporate Control," American Economic Review 79 (No. 4), 842-852.
Mundlak, Y., 1978, "On the Pooling of Time Series and Cross SectionData," Econometrica 46 (No. 1), 69-85.
Murray, A.L, 1989, "Top Management Group Heterogeneity and FirmPerformance," Strategic Management Journal 10 (No. SI), 125-141.
Nayyar, PR., 1992, "Performance Effects of Three Foci in Service Firms,"Academy of Management Journal 35 (No. 5), 985-1009.
BRANCH, SHARMA, CHAWLA, AND TU - AN UPDATED MODEL OF PRICE TO BOOK 93
Nayyar, P.R., 1993, "Performance Effects of Information Asymmetryand Economies of Scope in Diversified Service Firms," Academy ofManagement Journal 36 (No. 1), 28-57.
O'Brien, J.P., 2003, "The Capital Structure Implications of Pursuing aStrategy of Innovation," Strategic Management Journal 24 (No. 5),415-431.
Ohlson, J.A., 1980, "Financial Ratios and the Probabilistic Prediction ofBankruptcy," Journal of Accounting Research 18 (No. 1), 109-131.
Pitcher, P. and A.D. Smith, 2001, "Top Management Team Heterogeneity:Personality, Power, and Proxies," Organization Science 12 (No. 1),1-18.
Reinganum, M.R., 1981, "A New Empirical Perspective on the CAPM,"Journal of Financial and Quantitative Analysis 16 (No. 4), 439-462.
Rogowski, R.J. and D.G. Simonson, 1987, "Bank Merger Pricing Premiumsand Interstate Banking," Paper presented at Financial ManagementAssociation Annual Meeting, Las Vegas, NV.
Rosenberg, B., K.. Reid, and R. Lanstein, 1985, "Persuasive Evidence ofMarket Inefficiency," Journal of Portfolio Management 11 (No. 3),9-16.
Ross, S.A., 1976, "The Arbitrage Theory of Capital Asset Pricing," Journalof Economic Theory 13 (No. 3), 341-360.
Sharma, A., B.S. Branch, C. Chawla, and L. Qiu., 2013, "ExplainingMarket to Book: The Relative Impact of Firm PerfonTiance, Growth,and Risk," Business Quest: http://www.westga.edu/~bquest/2013/research2013.htm.
Sharpe, W.F., 1964, "Capital Asset Prices: A Theory of Market EquilibriumUnder Conditions of Risk," Journal of Finance 19 (No. 3), 425-442.
Short, J.C., D.J. Ketchen, Jr., TB. Palmer, and G.TM. Huit, 2007, "Firm,Strategic Group, and Industry Influences on Performance," StrategicManagement Journal 2% (No. 2), 147-167.
Smirlock, M., T. Gilligan, and W. Marshall, 1984, "Tobin's q and theStructure-Performance Relationship," American Economic Review 74(No. 5), 1051-1060.
Surroca, J., J.A. Tribó, and S. Waddock, 2010, "Corporate Responsibilityand Financial Performance: The Role of Intangible Resources,"Strategic Management Journal 31 (No. 5), 463-490.
Tanriverdi, H. and N. Venkatraman, 2005, "Knowledge Relatedness and thePerformance of Multibusiness Firms," Strategic Management Journal26(No. 2), 97-119.
Tobirt, J., 1969, "A General Equilibrium Approach to Monetary Theory,"Journal of Money, Credit and Banking 1 (No. 1), 15-29
Varaiya, N., R.A. Kerin, and D. Weeks, 1987, "The Relationship BetweenGrowth, Profitability, and Firm Value," Strategic Management Journal8 (No. 5), 487-497.
Vassalou, M. and Y. Xing, 2004, "Default Risk in Equity Retums," Journalof Finance 59 (No. 2), 831-868.
Wang, H., J. Choi, and J. Li, 2008, "Too Little or too Much? Untanglingthe Relationship between Corporate Philanthropy and Firm FinancialPerformance," Organization Science 19 (No. 1), 143-159.
Wang, H.C., J. He, and J.T. Mahoney, 2009, "Firm-Specific KnowledgeResources and Competitive Advantage: The Roles of Economic-andRelationship-Based Employee Governance Mechanisms," StrategicManagement Journal ^Q (Ho. 12), 1265-1285.
Welboume, T.M. and A.O. Andrews, 1996, "Predicting the Performance ofInitial Public Offerings: Should Human Resource Management be inthe EquationT Academy of Management Journal 39 (No. 4), 891-919.
Wemerfelt, B. and CA. Montgomery, 1988, "Tobin's q and the Importanceof Focus in Firm Performance," American Economic Review 78 (No.1), 246-250.
Wiggins, R.R. and T.W. Ruefli, 2002, "Sustained Competitive Advantage:Temporal Dynamics and the Incidence and Persistence of SuperiorEconomic Performance," Organization Science 13 (No. 1), 82-105.
Copyright of Journal of Applied Finance is the property of Financial ManagementAssociation and its content may not be copied or emailed to multiple sites or posted to alistserv without the copyright holder's express written permission. However, users may print,download, or email articles for individual use.