Page 1
Electronic Supplementary Material (ESI) for Physical Chemistry Chemical Physics. This journal is © the Owner Societies 2015
1
Branching Ratios for the Reactions of OH with Ethanol Amines used in
Carbon Capture and the Potential Impact on Carcinogen Formation in the
Emission Plume from a Carbon Capture Plant
L. Onel,*a M.A. Blitz,
ab J. Breen,
a A.R. Rickard,
cd and P.W. Seakins,*
ab
a School of Chemistry, University of Leeds, Leeds, LS2 9JT, UK. Email:
[email protected]
b National Centre for Atmospheric Science (NCAS), University of Leeds, Leeds,
LS2 9JT, UK
c Wolfson Atmospheric Chemistry Laboratories, Department of Chemistry,
University of York, York, YO10 5DD, UK
d National Centre for Atmospheric Science (NCAS), University of York, York,
YO10 5DD, UK
Supplementary information
The notation of the quantities and the used abbreviations are the same as in main text.
Electronic Supplementary Material (ESI) for Physical Chemistry Chemical Physics.This journal is © the Owner Societies 2015
Page 2
Electronic Supplementary Material (ESI) for Physical Chemistry Chemical Physics. This journal is © the Owner Societies 2015
2
1. OH + DMEA reaction in the absence/presence of O2
Figure S1 shows the clear reduction in the observed bimolecular rate coefficient in the
presence of excess oxygen.
Fig. S1 - Bimolecular plots for DMEA in the absence of O2, (7.44 ± 0.44) × 10-11
cm3
molecule-1
s-1
, black squares and line, and in the presence of O2, (5.07 ± 0.26) × 10-11
cm3
molecule-1
s-1
, red circles and line. Both studies carried out at 298 K and a total pressure of 14
Torr of 100 % N2 or 90% N2 + 10% O2. A typical OH fluorescence decay trace and fit to
equation E1 in main text is shown in the inset.
2. Stern-Volmer plots for OH yield from OH + d4-DMEA reactions with O2
Fig. S2 shows 1/ΦOH vs [M] for d4-DMEA + OH/O2 system at 298 K. The result is
similar to that for nondeuterated DMEA at room temperature. The Stern-Volmer parameters
obtained by the unconstrained fits have overlapping error bars and the gradients of the fits at
298 K in Fig. S2 and Fig. 3 are close to each other (Table S1). The result suggests that, in
both systems DMEA/O2 and d4-DMEA/O2, the OH regeneration is described by the same
chemistry scheme (reactions R8-R10 in main text).
0 2x10¹⁴
4x10¹⁴
6x10¹⁴
0
10000
20000
30000
40000
50000
k' O
H / s
-1
0.0 0.2 0.4
0.000
0.002
0.004
0.006
0.008
OH
sig
na
l / arb
. un
its
time / ms
[DMEA] / molecule cm-3
Page 3
Electronic Supplementary Material (ESI) for Physical Chemistry Chemical Physics. This journal is © the Owner Societies 2015
3
Fig. S2 - Stern-Volmer plots for OH yield from d4-DMEA + OH/O2 system at 298 K, black
squares and line. The fits are constrained through unity intercept.
Table S1 Stern-Volmer parameters for the OH + DMEA/d4-DMEA reactions with O2 at 298
K.
Unconstrained intercept Intercept constrained to
unity
T
(K)
Intercepta
Gradienta/ cm
3 molecule
-1
/ 10-18
Gradienta/ cm
3 molecule
-1/
10-18
DMEA d4-DMEA DMEA d4-DMEA DMEA d4-DMEA
298 0.88 ± 0.13 0.73 ± 0.12 5.31 ± 0.66 4.81 ± 0.44 4.79 ± 0.26 3.84 ± 0.17
a Obtained by weighting the linear fit by the error bars, 2, of reciprocal of OH yield
0.00E+000 5.00E+017 1.00E+0180
1
2
3
4
5
(OH
Yie
ld)-1
[M] / molecule cm-3
Page 4
Electronic Supplementary Material (ESI) for Physical Chemistry Chemical Physics. This journal is © the Owner Societies 2015
4
3. OH/OD + d4-DMEA reaction with O2. Determination of the dominant abstraction site
of DMEA in reaction with OH
The unconstrained Stern-Volmer plots for the OH + DMEA/O2 and OH + d4-DMEA/O2
systems have intercept values which are consistent with unity OH yield at zero pressure
(Table S1), i.e. there is not another route leading to a set of products excluding OH. This
result shows that OH abstraction occurs at the C-H sites next to amine group. In order to
identify which one from the two positions (CH2 or CH3) is the dominant abstraction site we
monitored the OH and OD radicals obtained by the photolysis at 248 nm of d4-DMEA in the
presence of oxygen (Fig. S3).
Fig. S3 Parallel measurements of OH (red circles and line) and OD (black circles and line)
kinetic decays for OH/OD + (CH3)2N(CD2)2OH reaction at 298K and a total pressure of 15
Torr of 80% N2 + 20% O2. The OD signal was divided by the response factor for OD over
OH of 1.86.1 The inset shows the OD signal magnified.
In Fig. S3 the OH signal at time zero is ~250 times higher than the adjusted OD signal
at time zero. The domination of the initial hydroxyl signal by OH following the photolysis of
d4-DMEA suggests that photolysis primarily occurs at the CD2 site. The generated carbon-
Page 5
Electronic Supplementary Material (ESI) for Physical Chemistry Chemical Physics. This journal is © the Owner Societies 2015
5
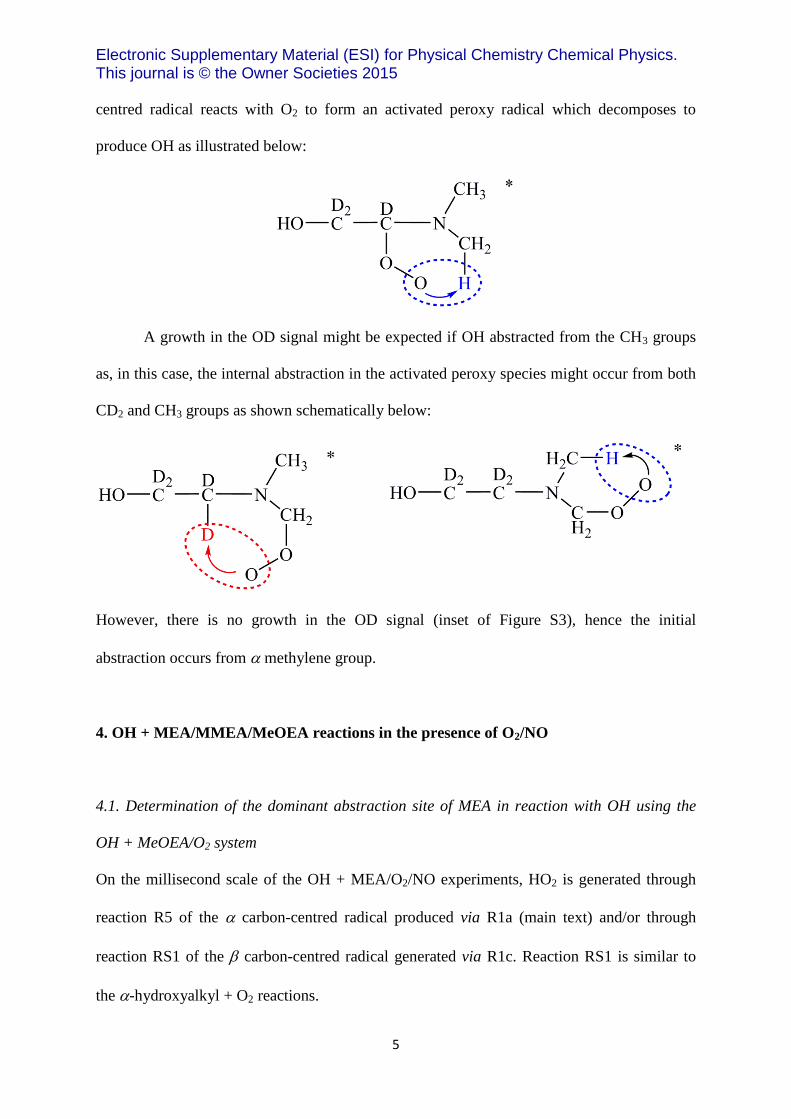
centred radical reacts with O2 to form an activated peroxy radical which decomposes to
produce OH as illustrated below:
A growth in the OD signal might be expected if OH abstracted from the CH3 groups
as, in this case, the internal abstraction in the activated peroxy species might occur from both
CD2 and CH3 groups as shown schematically below:
However, there is no growth in the OD signal (inset of Figure S3), hence the initial
abstraction occurs from methylene group.
4. OH + MEA/MMEA/MeOEA reactions in the presence of O2/NO
4.1. Determination of the dominant abstraction site of MEA in reaction with OH using the
OH + MeOEA/O2 system
On the millisecond scale of the OH + MEA/O2/NO experiments, HO2 is generated through
reaction R5 of the carbon-centred radical produced via R1a (main text) and/or through
reaction RS1 of the carbon-centred radical generated via R1c. Reaction RS1 is similar to
the -hydroxyalkyl + O2 reactions.
Page 6
Electronic Supplementary Material (ESI) for Physical Chemistry Chemical Physics. This journal is © the Owner Societies 2015
6
HOCHCH2NH2 + O2 OCHCH2NH2 + HO2 (RS1)
In order to determine which one from the two C-H positions in MEA is the dominant
abstraction site in reaction with OH we determined if the HO2 yield is altered by using
MeOEA (CH3OCH2CH2NH2) instead of MEA (HOCH2CH2NH2) as, in the OH + MeOEA/O2
system, initial abstraction at position cannot result in formation of HO2. The resultant HO2,
MeOEA = 0.69 ± 0.09 at 20 Torr and HO2, MeOEA = 0.68 ± 0.06 at 40 Torr are within the error
limits of HO2, MEA = 0.62 ± 0.06 in the range 20 – 150 Torr (Table 2 in main text). Therefore,
the results strongly suggest the dominant H-abstraction site of MEA is in the position.
4.2. Determination of the HO2 yield
In the presence of NO reaction R6 regenerates OH in the OH + MEA/MMEA/MeOEA/O2
systems and the OH decays are biexponential in nature (see the example shown in the inset of
Fig. S4). The method for assign HO2 yield was described previously1 and is illustrated
schematically:
The biexponential OH decays were fitted to the solution of the rate equations for reactions
R1a, R1b and R6 to determine the pseudo-first-order rate coefficients k’1a and k’1b and k’6.1
The determined parameters were used to assign the HO2 yield, and hence r1a and r1b:
(equation S1)
HO2
1b
1
1b
1
a11aHO2 11
'
'r
k'
k'
k
kr
Page 7
Electronic Supplementary Material (ESI) for Physical Chemistry Chemical Physics. This journal is © the Owner Societies 2015
7
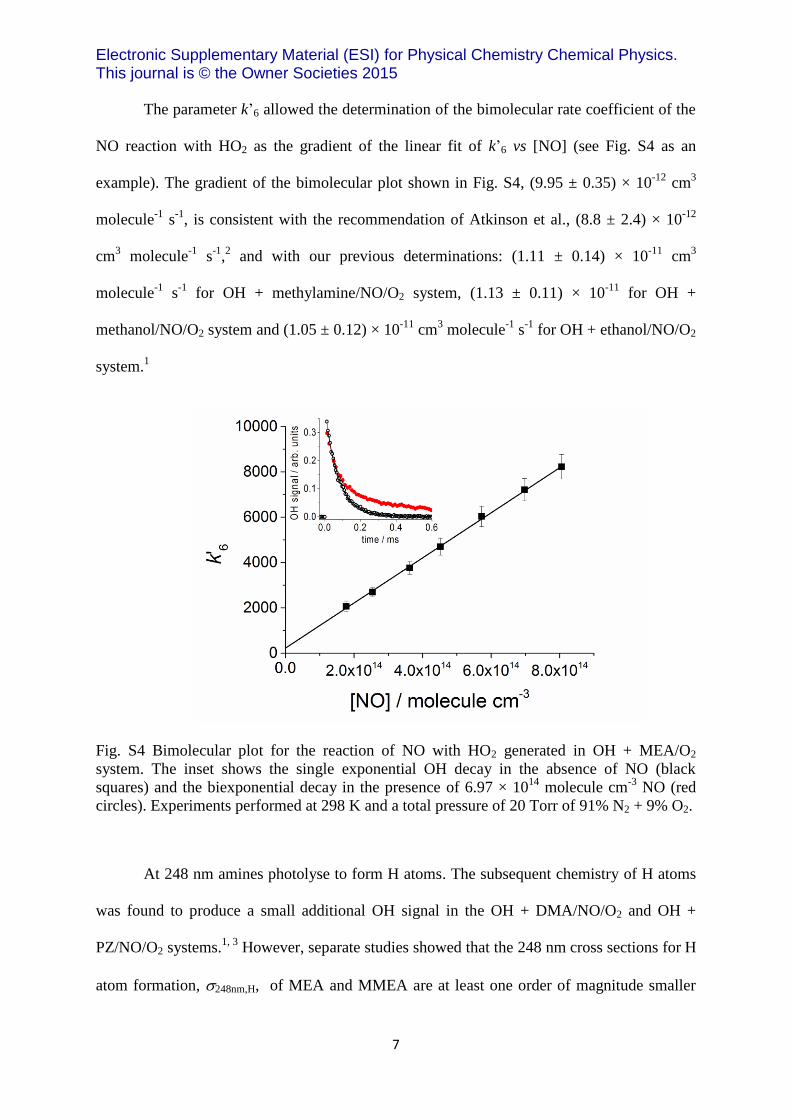
The parameter k’6 allowed the determination of the bimolecular rate coefficient of the
NO reaction with HO2 as the gradient of the linear fit of k’6 vs [NO] (see Fig. S4 as an
example). The gradient of the bimolecular plot shown in Fig. S4, (9.95 ± 0.35) × 10-12
cm3
molecule-1
s-1
, is consistent with the recommendation of Atkinson et al., (8.8 ± 2.4) × 10-12
cm3 molecule
-1 s
-1,2 and with our previous determinations: (1.11 ± 0.14) × 10
-11 cm
3
molecule-1
s-1
for OH + methylamine/NO/O2 system, (1.13 ± 0.11) × 10-11
for OH +
methanol/NO/O2 system and (1.05 ± 0.12) × 10-11
cm3 molecule
-1 s
-1 for OH + ethanol/NO/O2
system.1
Fig. S4 Bimolecular plot for the reaction of NO with HO2 generated in OH + MEA/O2
system. The inset shows the single exponential OH decay in the absence of NO (black
squares) and the biexponential decay in the presence of 6.97 × 10¹⁴
molecule cm-3
NO (red
circles). Experiments performed at 298 K and a total pressure of 20 Torr of 91% N2 + 9% O2.
At 248 nm amines photolyse to form H atoms. The subsequent chemistry of H atoms
was found to produce a small additional OH signal in the OH + DMA/NO/O2 and OH +
PZ/NO/O2 systems.1, 3
However, separate studies showed that the 248 nm cross sections for H
atom formation, 248nm,H, of MEA and MMEA are at least one order of magnitude smaller
Page 8
Electronic Supplementary Material (ESI) for Physical Chemistry Chemical Physics. This journal is © the Owner Societies 2015
8
than 248nm,H of DMA (10-20
cm2 molecule
-1 orders of magnitude), and at least two orders of
magnitude smaller compared to 248nm,H of PZ (10-19
cm2 molecule
-1 orders of magnitude).
4
Therefore, the photolytic generation of H atoms was negligible in our experiments and did
not affect the results obtained for the OH + MEA/MMEA reactions in the presence of NO/O2.
5. Structure Activity Relationship (SAR) calculations
Table S2. Room temperature rate coefficients and branching ratios in the reaction of OH with
MEA and MMEA determined in this work and calculated using SARs
Rate coefficients Branching ratios
10-11
cm3 molecule
-1 s
-1 Calculated
b
kOH
kOHb rC-H rC-H rN-H /
N-attackc
rN-CH3
MEA 7.61 ±
0.765
4.04 0.45 0.08 0.47 -
MMEA 8.26 ±
0.82a
8.45 0.21 0.04 0.74 0.01
DMEA 7.29 ±
0.72a
6.95 0.26 0.05 0.66 0.03
Determined experimentally
MEA 0.62 ±
0.06
0.38 ± 0.06
MMEA 0.48 ±
0.03
0.52 ± 0.06
DMEA ~1.00 -
a This work
b SAR calculations.
6-8 OH rate coefficients and branching ratios were calculated using a
combination of the following parameters: group rate coefficients for H atom abstraction from
C-H bonds and –OH groups (kprim, ksec, ktert and kOH) and substituent group factors (F(X)) are
taken from Ziemann and Atkinson.6 The SAR parameters for abstraction at an N-H site, kRNH2
(MEA) and kR2NH (MMEA), and for the OH attack at the nitrogen atom, kR3N (DMEA), along
with the F(X) values for groups -NH2, >NH and –N< are taken from Nielsen et al.7
c N-attack results in an initial addition of OH through H-bonding to the nitrogen lone-
pair, forming a stable pre-reaction adduct. H-abstraction within the pre-reaction adduct then
leads to H2O and a radical species. Caution is taken when using hydrogen abstraction SARs
for amines for reasons given in Nielsen et al.7 The formation of pre-reaction OH-amine
adducts in which the OH radical is H-bonded to the nitrogen lone-pair results in a negative
Arrhenius activation energy, and low energy barrier or barriers to reaction below the energy
of reactants.
Page 9
Electronic Supplementary Material (ESI) for Physical Chemistry Chemical Physics. This journal is © the Owner Societies 2015
9
6. Master Equation Solver for Multi Energy well Reactions (MESMER) calculations
The yield of HO2 radical in HOCH2CHNH2 + O2 reaction, HO2, has been calculated in the
range of 20 – 150 Torr using the experimental branching ratios r1a for MEA + OH reaction
(Table 2 in main text). The HO2 yield at 20 Torr was assumed equal to unity on average,
, as in our previous MESMER study of the O2 reactions with RCHNHR
radicals.1 This assumption was also supported by the experimental finding that the HO2 yield
in the MEA + OH reaction is practically unchanged over 20 – 150 Torr. HO2 at 60 and 150
Torr was determined as follows:
HO2(p) = r(1a, p) / (equation S2)
where is the mean of the experimental values of r1a at 20 Torr.
G4 potential energy surface calculations9 have been used in a master equation fit of
HO2 calculated using equation S2. The parameter Edown for N2 was fixed to 270 cm-1
as in
our previous calculations for the O2 + RCHNHR reactions and in very good agreement with
various reported values of Edown for N2.10-12
The energy barrier between peroxy radical and
post-reaction imine-HO2 complex was floated starting from the ab initio value, 90.42 kJ mol-
1. The fit found a lower transition state energy, 82.18 ± 0.87 kJ mol
-1. The level of agreement
between the reaction barrier found by fitting and the ab initio result is ~8 kJ mol-1
; a slightly
lower level of agreement between the MESMER result and the ab initio value for
CH3CHNH2 + O2 reaction of ~6 kJ mol-1
was found previously.1 We attribute this lower level
of agreement to the larger uncertainty in the G4 theory computation of the energy of the
transition state for larger HOCH2CHNH2 + O2 system. Typical errors in high level ab initio
calculations of stable species are of the order of 2 – 4 kJ mol-1
; calculations of transition
states will have a higher level of uncertainty and so the observed discrepancy of 6 – 8 kJ mol-
1)Torr20(HO2
)Torr201a,(r
)Torr201a,(r
Page 10
Electronic Supplementary Material (ESI) for Physical Chemistry Chemical Physics. This journal is © the Owner Societies 2015
10
1 between the fitted values and the calculated energy of the transition state is not
unreasonable.
The energy barrier obtained by fitting was used in MESMER numerical simulations to
assign HO2(1 atm) = 0.67 ± 0.18 (Fig. 4). The error limits for HO2(1 atm) reported here were
determined assuming a typical error in the energy barrier calculation of ± 4 kJ mol-1
. Similar
atmospheric pressure yields of HO2 were found for the CH3CHNH2 + O2 reaction: 0.50 ±
0.181 and ~0.60.
10
7. Atmospheric modelling
7.1. MEA chemistry scheme
Table S3. MEA (RCH2NH2, where R = HOCH2) oxidation reactions and phase transfer
processes incorporated in the atmospheric model
Reaction Rate coefficient /
cm3 molecule
-1 s
-1
or s-1
Reference
Gas phase reactions
RCH2NH2 + OH RCHNH2 0.62 × kOHa
This work and Onel et al.5
RCH2NH2 + OH RCH2NH 0.38 × kOHa This work and Onel et al.
5
RCHNH2 + O2 RCHNH + HO2 0.67 × kO2b This work and Rissanen et
al.10
RCHNH2 + O2 RCH(O2)NH2 0.33 × kO2b This work and Rissanen et
al.10
Page 11
Electronic Supplementary Material (ESI) for Physical Chemistry Chemical Physics. This journal is © the Owner Societies 2015
11
RCH(O2)NH2 + HO2 RCH(O2H)NH2
+ O2
5.7 × 10⁻¹² Considered equal to the rate
coefficient for the CH3O2 +
HO2 reaction13
RCH(O2)NH2 + NO RCH(O)NH2 +
NO2
8.0 × 10⁻¹²
Considered equal to the rate
coefficient for the CH3O2 +
NO reaction13
RCH(O)NH2 + O2 RCONH2 + HO2
2.4 × 10⁻¹⁵
Karl et al.14
RCH(O)NH2 HCONH2 + HCHO +
HO2
2.0 × 10⁵
Karl et al.14
HCONH2 + OH HNCO + HO2 4.5 × 10⁻¹²
Estimatedc
RCONH2 + OH HCOCONH2 + HO2 4.6 × 10⁻¹²
Karl et al.14
RCH2NH + NO2 RCH2NHNO2 kNO2d
Lazarou et al.15
RCH2NH + NO2 RCHNH +HONO 0.22 × kNO2d Lindley et al.
16 and Lazarou
et al.15
RCH2NH + NO RCH2NHNO kNOe
Lazarou et al.15
RCH2NH + O2 RCHNH + HO2 3.9 × 10⁻⁷
× kNO2d Lindley et al.
16 and Lazarou
et al.15
RCH2NHNO2 + OH RCONHNO2 3.5 × 10⁻¹² f
Maguta et al.17
RCH2NHNO RCH2NH + NO 0.34 × jNO2 Nielsen et al.7
Page 12
Electronic Supplementary Material (ESI) for Physical Chemistry Chemical Physics. This journal is © the Owner Societies 2015
12
Phase transfer and aqueous reactions with OH
RCH2NH2 (RCH2NH2)aq - This workg
(RCH2NH2)aq RCH2NH2 - This workh
(RCH2NH2)aq + (OH)aq (P1)aq 𝑘aqMEA × [OH]aq
av i
RCH2NHNO2 (RCH2NHNO2)aq - This workg
(RCH2NHNO2)aq RCH2NHNO2 - This workh
(RCH2NHNO2)aq + (OH)aq (P2)aq 𝑘aqRNNO2 × [OH]aq
av i
RCH2NHNO (RCH2NHNO)aq - This workg
(RCH2NHNO)aq RCH2NHNO - This workh
(RCH2NHNO)aq + (OH)aq (P3)aq 𝑘aqRNNO × [OH]aq
av i
a kOH = 7.6 × 10
-11 cm
3 molecule
-1 s
-1 5
b kO2 = 5 × 10
-11 cm
3 molecule
-1 s
-1. Estimated using the profile of the rate coefficient for the
reaction of O2 with CH2NH2 vs pressure reported for N2 by Rissanen et al.10
c Calculated as ten times lower than the rate coefficient for the HCONH2 + Cl reaction based
on the kinetic data reviewed by Nielsen et al. showing that the rate coefficients for the amide
+ OH reactions are one order of magnitude lower than the rate coefficients for the amide + Cl
reactions.7
d kNO2 = 3.2 × 10
-13 cm
3 molecule
-1 s
-1. Determined experimentally for the (CH3)2NH + NO2
(CH3)2NNO2 reaction by Lazarou et al.15
e kNO = 8.5 × 10
-14 cm
3 molecule
-1 s
-1. Determined experimentally for the (CH3)2NH + NO
(CH3)2NNO reaction by Lazarou et al.15
f Equal to the rate coefficient for the OH + (CH3)2NNO2 reaction
17
g Calculated using equation E3 in main text.
h Calculated using equation E4 in main text.
i 𝑘aqMEA = 3 × 10
8 M
-1 s
-1,7 𝑘aqRNNO2 = 5.4 × 10
8 M
-1 s
-1 as measured for the (CH3)2NNO2 + OH
reaction in water by Mezyk et al.18
and 𝑘aqRNNO is equal to the mean of the measurements of
Landsman et al.,19
Wink et al.20
and Lee et al.21
for the (CH3)2NNO + OH reaction in water,
4.0 × 10⁸ M
-1 s
-1. [OH]aq
av is the mean concentration of OH in either wet aerosols, 10-13
M, or
cloud droplets, 2 × 10-12
M, in maritime environment.7
Page 13
Electronic Supplementary Material (ESI) for Physical Chemistry Chemical Physics. This journal is © the Owner Societies 2015
13
7.2. Details on the parametrisation of heterogeneous uptake
The uptake coefficients for MEA, R2N-NO2 and R2N-NO are not currently known. In line
with the parametrisation of the wet deposition included in the chemical transport model used
by Karl et al. to study the environmental impact of carbon capture emissions of MEA,22
we
used HNO3 as a model compound in the parametrisation of heterogeneous uptake. Therefore,
in our work the uptake coefficients for MEA, R2N-NO2 and R2N-NO were considered equal
to the uptake coefficient for HNO3, calculated as the mean of the values at room temperature
reported by Van Doren et al.,23
Ponche et al.24
and Schütze and Herrmann,25
HNO3 = 0.07 ±
0.04.
The gas diffusion coefficient, , in equation E3 (main text) is given by equation S4.
(equation S4)
Here NA is Avogadro’s number, is the diameter of the gas molecule i, air is the density of
air, R is the gas constant, T is the temperature (K), Mair and are the molar masses of air
and the gas i, respectively. The mean molecular speed is given by equation S5.
(equation S5)
7.3. Details on the parametrisation describing the plume dispersion
The plume width at time t, y(t), depends on the width at time zero, y(0), and the horizontal
diffusion coefficient, Ky (equation E7 in main text). Due to less turbulent boundary layer at
g
iD
g
i
air
g
iair
air
2g
iA
g
i2)(8
3
M
MMMTR
dND
g
id
g
iM
g
ic
g
i
g
i
8
M
RTc
Page 14
Electronic Supplementary Material (ESI) for Physical Chemistry Chemical Physics. This journal is © the Owner Societies 2015
14
night than at day, the plume emitted at midnight expands less than the plumes emitted at
day.26
For the emission at day time equation E7 was used to fit the time series of the width of
the Cumberland power plant plume studied by Ryerson et al.27
(Figure S5) in order to
determine the parameter Ky. The plume widths were estimated using profiles of the NOx, O3
and SO2 mixing ratios observed by these authors across the downwind direction. During the
fitting, the parameter y(0) was fixed at 2.5 m and 100 m, respectively, while the parameter Ky
was floated. In both cases, the fit led to Ky = 3034 ± 301 m2 s
-1. Therefore, a value of 3034 m
2
s-1
was used in numerical simulations.
For the emission at night equation E7 was fit to the total width of the plumes emitted
at Oklaunion and Paris power plants vs. transport time to determine Ky. The total width of the
plumes, y(t), was calculated using full-width at half maximum, FWHM(t), of the Gaussian fit
to SO2 plumes,26
as it follows28
2ln22
)()(
tFWHMt ` (equation S6)
y(t) = 6(t) (equation S7)
where (t) is the standard deviation.
The mean of the values of the horizontal diffusion coefficient for the Oklaunion and Parish
plumes, Ky = 573 ± 102 m2 s
-1, was used in the numerical simulations started at midnight.
As the time zero in numerical simulations corresponded to 10 min after emission, for
day time emissions y(0) in the simulations equalled y(10 min) in Fig. S5, 3816 m and for the
midnight emission y(0) in simulations equalled y(10 min) in Fig. S6, 1658 m.
Page 15
Electronic Supplementary Material (ESI) for Physical Chemistry Chemical Physics. This journal is © the Owner Societies 2015
15
Fig. S5 Fit of the plume width emitted at day from Cumberland power plant27
using equation
E7 in main text. The error bars represent standard errors of a series of estimations obtained
using the mixing ratio profiles for NOx, O3 and SO2 reported by Ryerson et al.27
Fig. S6 Fit of the SO2 plume width emitted at night from Oklaunion (black squares and line)
and Parish (red circles and line) power plants.26
Page 16
Electronic Supplementary Material (ESI) for Physical Chemistry Chemical Physics. This journal is © the Owner Societies 2015
16
7.4. Average diurnal cycles of key species measured for the North-westerly wind sector at
Weybourne, September 200229, 30
Fig. S7. Hourly averaged diurnal cycle of NO2. Concentration of NO2 in parts per billion by
volume (ppbv).
Fig. S8. Hourly averaged diurnal cycle of NO. Concentration of NO in parts per billion by
volume (ppbv).
Page 17
Electronic Supplementary Material (ESI) for Physical Chemistry Chemical Physics. This journal is © the Owner Societies 2015
17
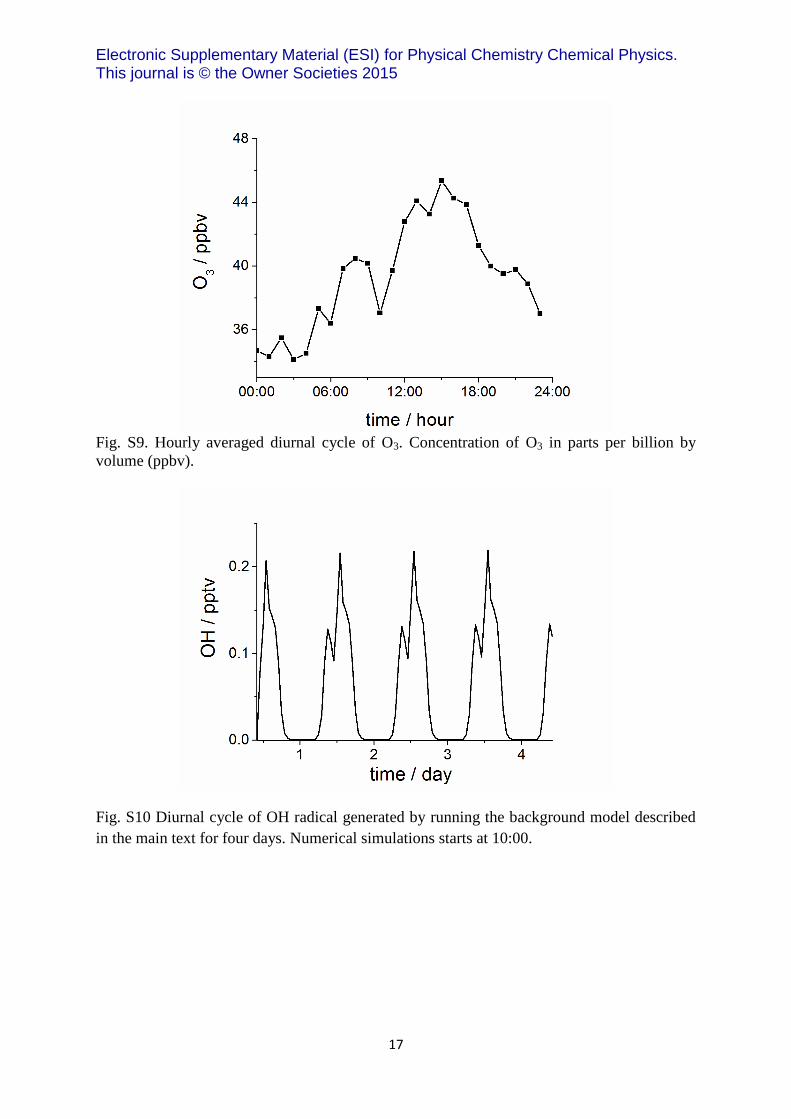
Fig. S9. Hourly averaged diurnal cycle of O3. Concentration of O3 in parts per billion by
volume (ppbv).
Fig. S10 Diurnal cycle of OH radical generated by running the background model described
in the main text for four days. Numerical simulations starts at 10:00.
Page 18
Electronic Supplementary Material (ESI) for Physical Chemistry Chemical Physics. This journal is © the Owner Societies 2015
18
Fig. S11 One minute averaged diurnal cycle of ozone measured at Weybourne from 17 to 29
September 2002 used in the numerical simulations started at 14:00.
Fig. S12 NO concentration generated by numerical simulations (see main text) for emission
at 14:00. Next day after emission, at ~ 07:00 the concentration of NO within the plume equals
the ambient concentration of NO, constrained to the one minute averaged diurnal cycle
measured at Weybourne from 17 to 29 September 2002.
Page 19
Electronic Supplementary Material (ESI) for Physical Chemistry Chemical Physics. This journal is © the Owner Societies 2015
19
7.5. Rates of MEA losses for emission at midnight
Fig. S13 Loss rates of MEA vs. time after emission from PCCC plant at 00:00 under cloud
free conditions: dispersion rate (blue solid line) and rate of the OH + MEA reaction (black
dash line): (a) plot over the first four hours after emission; (b) plot over 04:00 – 10:00. Model
does not include the NO3 + MEA reaction. With the exception of the first minute, when the
uptake rate of MEA is ~ 106 molecule cm
-3 s
-1, almost no uptake of MEA onto aerosols
occurs as Henry’s law is practically fulfilled at almost all the simulation times.
Page 20
Electronic Supplementary Material (ESI) for Physical Chemistry Chemical Physics. This journal is © the Owner Societies 2015
20
1. L. Onel, M. Blitz, M. Dryden, L. Thonger and P. Seakins, Environmental Science & Technology,
2014, 48, 9935-9942. 2. R. Atkinson, D. L. Baulch, R. A. Cox, J. N. Crowley, R. F. Hampson, R. G. Hynes, M. E. Jenkin,
M. J. Rossi and J. Troe, Atmospheric Chemistry and Physics, 2004, 4, 1461-1738. 3. L. Onel, M. Dryden, M. A. Blitz and P. W. Seakins, Environmental Science & Technology
Letters, 2014, 1, 367-371. 4. L. Onel, M. A. Blitz, M. Dryden and P. W. Seakins. 5. L. Onel, M. A. Blitz and P. W. Seakins, J. Phys. Chem. Lett., 2012, 3, 853-856. 6. P. J. Ziemann and R. Atkinson, Chem. Soc. Rev., 2012, 41, 6582-6605. 7. C. J. Nielsen, H. Herrmann and C. Weller, Chem. Soc. Rev., 2012, 41, 6684-6704. 8. E. S. C. Kwok and R. Atkinson, Atmos. Environ., 1995, 29, 1685-1695. 9. C. J. Nielsen, personal communication. 10. M. P. Rissanen, A. J. Eskola, T. L. Nguyen, J. R. Barker, J. Liu, J. Liu, E. Halme and R. S.
Timonen, J. Phys. Chem. A, 2014, 118, 2176-2186. 11. S. A. Carr, D. R. Glowacki, C.-H. Liang, M. T. Baeza-Romero, M. A. Blitz, M. J. Pilling and P. W.
Seakins, Journal of Physical Chemistry A, 2011, 115, 1069-1085. 12. K. W. McKee, M. A. Blitz, P. A. Cleary, D. R. Glowacki, M. J. Pilling, P. W. Seakins and L. Wang,
Journal of Physical Chemistry A, 2007, 111, 4043-4055. 13. http://mcm.leeds.ac.uk/MCM. 14. M. Karl, C. Dye, N. Schmidbauer, A. Wisthaler, T. Mikoviny, B. D'Anna, M. Muller, E. Borras,
E. Clemente, A. Munoz, R. Porras, M. Rodenas, M. Vazquez and T. Brauers, Atmos. Chem. Phys., 2012, 12, 1881-1901.
15. Y. G. Lazarou, K. G. Kambanis and P. Papagiannakopoulos, J. Phys. Chem., 1994, 98, 2110-2115.
16. C. R. C. Lindley, J. G. Calvert and J. H. Shaw, Chemical Physics Letters, 1979, 67, 57-62. 17. M. M. Maguta, M. Aursnes, A. J. C. Bunkan, K. Edelen, T. Mikoviny, C. J. Nielsen, Y.
Stenstrom, Y. Tang and A. Wisthaler, J. Phys. Chem. A, 2014, 118, 3450-3462. 18. S. P. Mezyk, D. B. Ewing, J. J. Kiddle and K. P. Madden, J. Phys. Chem. A, 2006, 110, 4732-
4737. 19. N. A. Landsman, K. L. Swancutt, C. N. Bradford, C. R. Cox, J. J. Kiddle and S. P. Mezyk, Environ.
Sci. Technol., 2007, 41, 5818-5823. 20. D. A. Wink, R. W. Nims, M. F. Desrosiers, P. C. Ford and L. K. Keefer, Chem. Res. Toxicol.,
1991, 4, 510-512. 21. C. Lee, J. Yoon and U. Von Gunten, Water Res., 2007, 41, 581-590. 22. M. Karl, N. Castell, D. Simpson, S. Solberg, J. Starrfelt, T. Svendby, S. E. Walker and R. F.
Wright, Atmos. Chem. Phys., 2014, 14, 8533-8557. 23. J. M. Van Doren, L. R. Watson, P. Davidovits, D. R. Worsnop, M. S. Zahniser and C. E. Kolb, J.
Phys. Chem., 1990, 94, 3265-3269. 24. J. L. Ponche, C. George and P. Mirabel, J. Atmos. Chem., 1993, 16, 1-21. 25. M. Schütze and H. Herrmann, Phys. Chem. Chem. Phys., 2002, 4, 60-67. 26. S. S. Brown, W. P. Dube, P. Karamchandani, G. Yarwood, J. Peischl, T. B. Ryerson, J. A.
Neuman, J. B. Nowak, J. S. Holloway, R. A. Washenfelder, C. A. Brock, G. J. Frost, M. Trainer, D. D. Parrish, F. C. Fehsenfeld and A. R. Ravishankara, J. Geophys. Res. Atmos., 2012, 117.
27. T. B. Ryerson, M. P. Buhr, G. J. Frost, P. D. Goldan, J. S. Holloway, G. Hubler, B. T. Jobson, W. C. Kuster, S. A. McKeen, D. D. Parrish, J. M. Roberts, D. T. Sueper, M. Trainer, J. Williams and F. C. Fehsenfeld, Journal of Geophysical Research-Atmospheres, 1998, 103, 22569-22583.
28. P. R. Bevington and D. K. Robinson, Data reduction and error analysis, McGraw-Hill, New York, 2003.
Page 21
Electronic Supplementary Material (ESI) for Physical Chemistry Chemical Physics. This journal is © the Owner Societies 2015
21
29. Z. L. Fleming, personal communication of diurnal cycles of O3, NO and NO2 measured at Weybourne between 17 and 29 September 2002.
30. Z. L. Fleming, P. S. Monks, A. R. Rickard, B. J. Bandy, N. Brough, T. J. Green, C. E. Reeves and S. A. Penkett, Atmos. Chem. Phys., 2006, 6, 5415-5433.