32
BRANDFINANCE BANKING 500 THE ANNUAL REPORT ON THE WORLD’S MOST VALUABLE BANKING BRANDS | MARCH 2013 Is the global banking crisis nearly over? ®
| Date post: | 29-Mar-2016 |
| Category: |
Documents |
| Upload: | brand-finance |
| View: | 220 times |
| Download: | 4 times |
BRANDFINANCE BANkINg 500
The annual reporT on The world’s mosT valuable banking brands | march 2013
Is the global banking crisis nearly over?
®
2 | brandFinance® banking 500 | MARCH 2013
contents
The BrandFinance® Banking 500 is published by Brand Finance plc and is the only study to rank the top 500 most valuable banks in the world
Brand Finance plc3rd Floor, Finland House, 56 Haymarket, LondonSW1Y 4RN United KingdomTel: +44 (0) 207 389 9400Fax: +44 (0) 207 389 [email protected]
3 Foreword
4 eXecuTive summarYIs the global banking crisis nearly over?
6 The Top 20: proFilesWorthy winnersA run-down of the world’s most valuable banking brands
15 winners and losersEast beats WestAgricultural Bank of China enjoyed the biggest gain in brand value this year, and HSBC suffered the biggest loss
16 regional resulTsA shifting pictureThe overall result masks important regional and country variations
19 secTor resulTs
20 banking Forum 2013Welcome to the age of Apple Bank?Pundits at Brand Finance’s fourth annual Banking Forum in February challenged banks to think outside the banking box when it comes to customer focus.
24 meThodologYHow do we value brands?
25 bespoke reporTs
26 The Top 500 mosT valuable banking brandsFive pages of league table results
Contents
brandFinance® banking 500
Publishing partner
Every year the BrandFinance® Banking 500 is published by The Banker magazine, the world’s premier banking and finance resource
MARCH 2013 | brandFinance® banking 500 | 3
Foreword
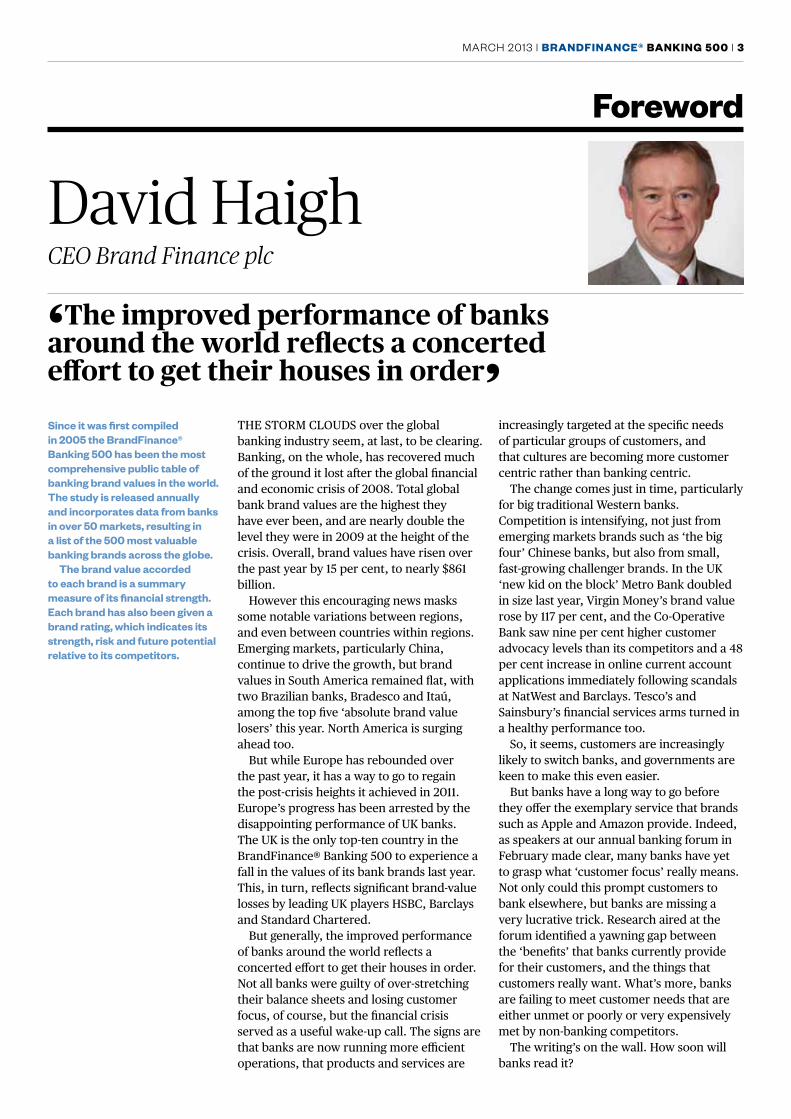
THe STorm CloudS over the global banking industry seem, at last, to be clearing. Banking, on the whole, has recovered much of the ground it lost after the global financial and economic crisis of 2008. Total global bank brand values are the highest they have ever been, and are nearly double the level they were in 2009 at the height of the crisis. overall, brand values have risen over the past year by 15 per cent, to nearly $861 billion.
However this encouraging news masks some notable variations between regions, and even between countries within regions. emerging markets, particularly China, continue to drive the growth, but brand values in South America remained flat, with two Brazilian banks, Bradesco and Itaú, among the top five ‘absolute brand value losers’ this year. North America is surging ahead too.
But while europe has rebounded over the past year, it has a way to go to regain the post-crisis heights it achieved in 2011. europe’s progress has been arrested by the disappointing performance of uK banks. The uK is the only top-ten country in the BrandFinance® Banking 500 to experience a fall in the values of its bank brands last year. This, in turn, reflects significant brand-value losses by leading uK players HSBC, Barclays and Standard Chartered.
But generally, the improved performance of banks around the world reflects a concerted effort to get their houses in order. Not all banks were guilty of over-stretching their balance sheets and losing customer focus, of course, but the financial crisis served as a useful wake-up call. The signs are that banks are now running more efficient operations, that products and services are
increasingly targeted at the specific needs of particular groups of customers, and that cultures are becoming more customer centric rather than banking centric.
The change comes just in time, particularly for big traditional Western banks. Competition is intensifying, not just from emerging markets brands such as ‘the big four’ Chinese banks, but also from small, fast-growing challenger brands. In the uK ‘new kid on the block’ metro Bank doubled in size last year, Virgin money’s brand value rose by 117 per cent, and the Co-operative Bank saw nine per cent higher customer advocacy levels than its competitors and a 48 per cent increase in online current account applications immediately following scandals at NatWest and Barclays. Tesco’s and Sainsbury’s financial services arms turned in a healthy performance too.
So, it seems, customers are increasingly likely to switch banks, and governments are keen to make this even easier.
But banks have a long way to go before they offer the exemplary service that brands such as Apple and Amazon provide. Indeed, as speakers at our annual banking forum in February made clear, many banks have yet to grasp what ‘customer focus’ really means. Not only could this prompt customers to bank elsewhere, but banks are missing a very lucrative trick. research aired at the forum identified a yawning gap between the ‘benefits’ that banks currently provide for their customers, and the things that customers really want. What’s more, banks are failing to meet customer needs that are either unmet or poorly or very expensively met by non-banking competitors.
The writing’s on the wall. How soon will banks read it?
‘The improved performance of banks around the world reflects a concerted effort to get their houses in order’
David Haigh CEO Brand Finance plc
Since it was first compiled in 2005 the BrandFinance® Banking 500 has been the most comprehensive public table of banking brand values in the world. The study is released annually and incorporates data from banks in over 50 markets, resulting in a list of the 500 most valuable banking brands across the globe.
The brand value accorded to each brand is a summary measure of its financial strength. Each brand has also been given a brand rating, which indicates its strength, risk and future potential relative to its competitors.
4 | brandFinance® banking 500 | MARCH 2013
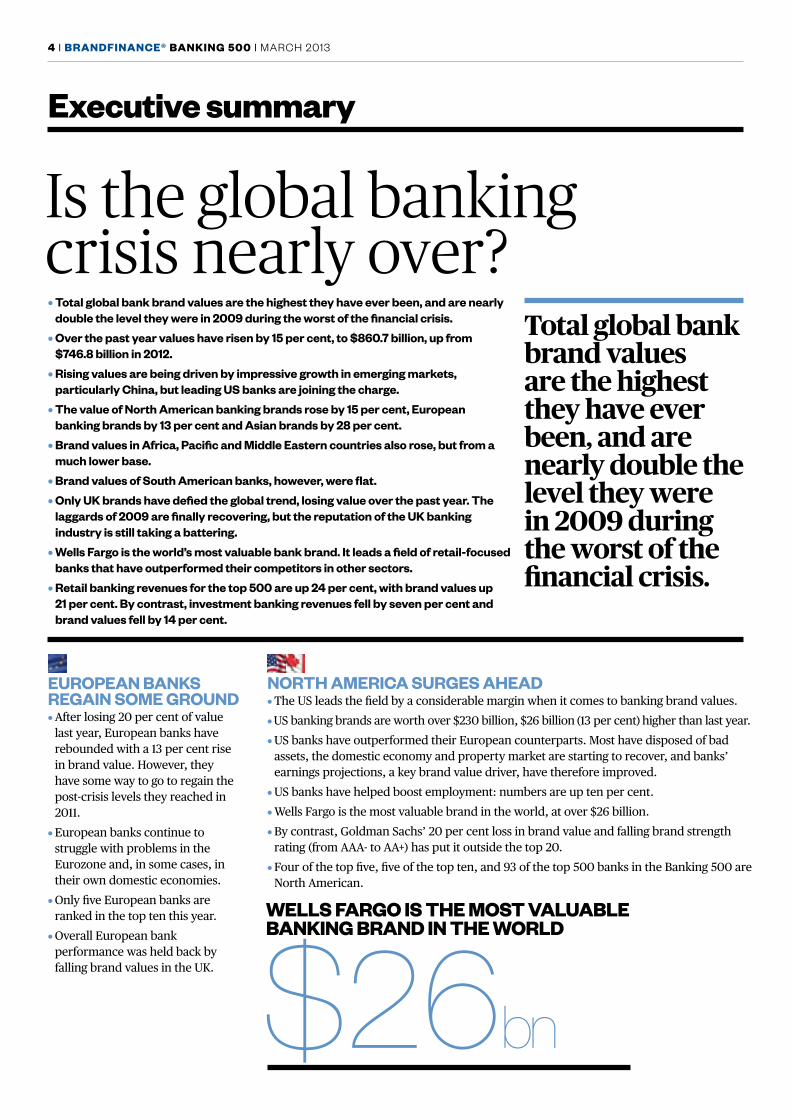
• Total global bank brand values are the highest they have ever been, and are nearly double the level they were in 2009 during the worst of the financial crisis.
• Over the past year values have risen by 15 per cent, to $860.7 billion, up from $746.8 billion in 2012.
• Rising values are being driven by impressive growth in emerging markets, particularly China, but leading US banks are joining the charge.
• The value of North American banking brands rose by 15 per cent, European banking brands by 13 per cent and Asian brands by 28 per cent.
• Brand values in Africa, Pacific and Middle Eastern countries also rose, but from a much lower base.
• Brand values of South American banks, however, were flat.
• Only UK brands have defied the global trend, losing value over the past year. The laggards of 2009 are finally recovering, but the reputation of the UK banking industry is still taking a battering.
• Wells Fargo is the world’s most valuable bank brand. It leads a field of retail-focused banks that have outperformed their competitors in other sectors.
• Retail banking revenues for the top 500 are up 24 per cent, with brand values up 21 per cent. By contrast, investment banking revenues fell by seven per cent and brand values fell by 14 per cent.
Is the global banking crisis nearly over?
EUROPEAN BANKS REgAIN SOME gROUNd • After losing 20 per cent of value
last year, european banks have rebounded with a 13 per cent rise in brand value. However, they have some way to go to regain the post-crisis levels they reached in 2011.
• european banks continue to struggle with problems in the eurozone and, in some cases, in their own domestic economies.
• only five european banks are ranked in the top ten this year.
• overall european bank performance was held back by falling brand values in the uK.
Total global bank brand values are the highest they have ever been, and are nearly double the level they were in 2009 during the worst of the financial crisis.
NORTH AMERICA SURgES AHEAd • The uS leads the field by a considerable margin when it comes to banking brand values.• uS banking brands are worth over $230 billion, $26 billion (13 per cent) higher than last year.• uS banks have outperformed their european counterparts. most have disposed of bad
assets, the domestic economy and property market are starting to recover, and banks’ earnings projections, a key brand value driver, have therefore improved.
• uS banks have helped boost employment: numbers are up ten per cent.• Wells Fargo is the most valuable brand in the world, at over $26 billion.• By contrast, Goldman Sachs’ 20 per cent loss in brand value and falling brand strength
rating (from AAA- to AA+) has put it outside the top 20.• Four of the top five, five of the top ten, and 93 of the top 500 banks in the Banking 500 are
North American.
wells Fargo is The mosT valuable banking brand in The world
$26bn
executive summary
MARCH 2013 | brandFinance® banking 500 | 5
agriculTural bank oF china increased iTs brand value bY over
— The highesT increase oF anY bank
CHINA gROWS INCREASINgLY dOMINANT• Chinese banks are growing increasingly dominant, despite a slowing in
the Chinese economy. Their brand value this year reached $95.7 billion, with Agricultural Bank of China recording the highest leap in brand value by any bank (over $6 billion), catapulting it from 18th to 11th place in the rankings.
• Four Chinese banks, ICBC, Agricultural Bank of China, China Construction Bank and Bank of China, are among the 20 most valuable bank brands worldwide. Their collective value rose by 25 per cent last year.
• Agricultural Bank of China increased its brand value by over $6bn — the highest increase of any bank.
• The big four are becoming increasingly international, making acquisitions in Australia, Africa, europe and the uS. Bank of China and ICBC ran major advertising campaigns during the london 2012 olympics, reflecting their global ambitions.
$6bn
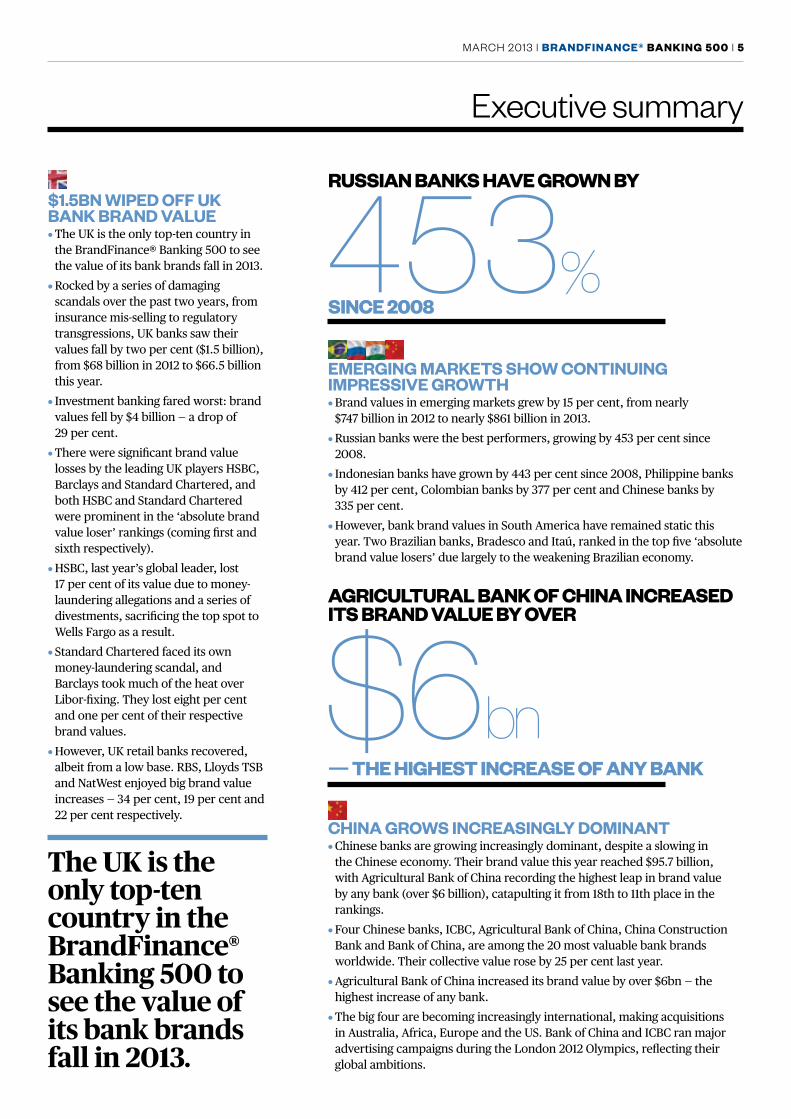
EMERgINg MARKETS SHOW CONTINUINg IMPRESSIvE gROWTH • Brand values in emerging markets grew by 15 per cent, from nearly
$747 billion in 2012 to nearly $861 billion in 2013.• russian banks were the best performers, growing by 453 per cent since
2008.• Indonesian banks have grown by 443 per cent since 2008, Philippine banks
by 412 per cent, Colombian banks by 377 per cent and Chinese banks by 335 per cent.
• However, bank brand values in South America have remained static this year. Two Brazilian banks, Bradesco and Itaú, ranked in the top five ‘absolute brand value losers’ due largely to the weakening Brazilian economy.
$1.5BN WIPEd OFF UK BANK BRANd vALUE• The uK is the only top-ten country in
the BrandFinance® Banking 500 to see the value of its bank brands fall in 2013.
• rocked by a series of damaging scandals over the past two years, from insurance mis-selling to regulatory transgressions, uK banks saw their values fall by two per cent ($1.5 billion), from $68 billion in 2012 to $66.5 billion this year.
• Investment banking fared worst: brand values fell by $4 billion — a drop of 29 per cent.
• There were significant brand value losses by the leading uK players HSBC, Barclays and Standard Chartered, and both HSBC and Standard Chartered were prominent in the ‘absolute brand value loser’ rankings (coming first and sixth respectively).
• HSBC, last year’s global leader, lost 17 per cent of its value due to money-laundering allegations and a series of divestments, sacrificing the top spot to Wells Fargo as a result.
• Standard Chartered faced its own money-laundering scandal, and Barclays took much of the heat over libor-fixing. They lost eight per cent and one per cent of their respective brand values.
• However, uK retail banks recovered, albeit from a low base. rBS, lloyds TSB and NatWest enjoyed big brand value increases — 34 per cent, 19 per cent and 22 per cent respectively.
Executive summary
The UK is the only top-ten country in the BrandFinance® Banking 500 to see the value of its bank brands fall in 2013.
russian banks have grown bY
since 2008453%
6 | brandFinance® banking 500 | MARCH 2013
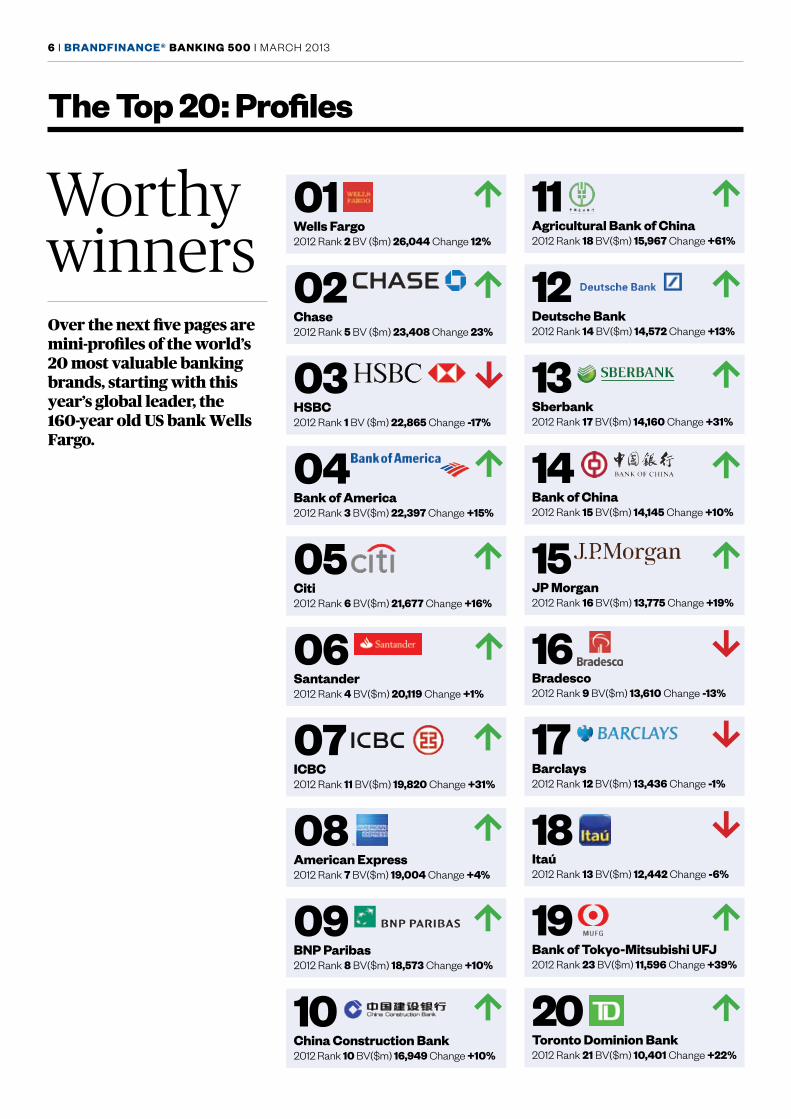
The Top 20: profiles
Worthy winnersOver the next five pages are mini-profiles of the world’s 20 most valuable banking brands, starting with this year’s global leader, the 160-year old US bank Wells Fargo.
01 wells Fargo2012 Rank 2 BV ($m) 26,044 Change 12%
02 chase2012 Rank 5 BV ($m) 23,408 Change 23%
03 hsbc2012 Rank 1 BV ($m) 22,865 Change -17%
04 bank of america2012 Rank 3 BV($m) 22,397 Change +15%
05 citi2012 Rank 6 BV($m) 21,677 Change +16%
06 santander2012 Rank 4 BV($m) 20,119 Change +1%
07 icbc2012 Rank 11 BV($m) 19,820 Change +31%
08 american express2012 Rank 7 BV($m) 19,004 Change +4%
09 bnp paribas2012 Rank 8 BV($m) 18,573 Change +10%
10 china construction bank2012 Rank 10 BV($m) 16,949 Change +10%
11 agricultural bank of china2012 Rank 18 BV($m) 15,967 Change +61%
12 deutsche bank2012 Rank 14 BV($m) 14,572 Change +13%
13 sberbank2012 Rank 17 BV($m) 14,160 Change +31%
14 bank of china2012 Rank 15 BV($m) 14,145 Change +10%
15 Jp morgan2012 Rank 16 BV($m) 13,775 Change +19%
16 bradesco2012 Rank 9 BV($m) 13,610 Change -13%
17 barclays2012 Rank 12 BV($m) 13,436 Change -1%
18 itaú2012 Rank 13 BV($m) 12,442 Change -6%
19 bank of Tokyo-mitsubishi uFJ2012 Rank 23 BV($m) 11,596 Change +39%
20 Toronto dominion bank2012 Rank 21 BV($m) 10,401 Change +22%
MARCH 2013 | brandFinance® banking 500 | 7
The Top 20: Profiles 01
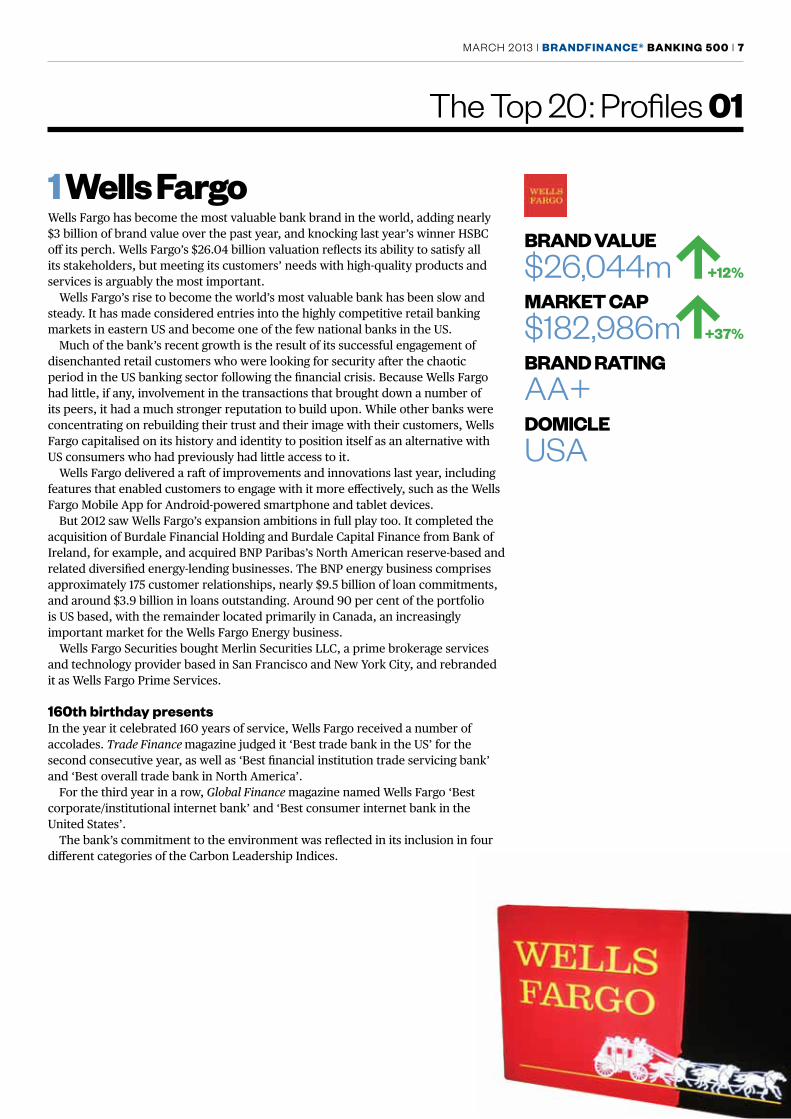
1 wells FargoWells Fargo has become the most valuable bank brand in the world, adding nearly $3 billion of brand value over the past year, and knocking last year’s winner HSBC off its perch. Wells Fargo’s $26.04 billion valuation reflects its ability to satisfy all its stakeholders, but meeting its customers’ needs with high-quality products and services is arguably the most important.
Wells Fargo’s rise to become the world’s most valuable bank has been slow and steady. It has made considered entries into the highly competitive retail banking markets in eastern uS and become one of the few national banks in the uS.
much of the bank’s recent growth is the result of its successful engagement of disenchanted retail customers who were looking for security after the chaotic period in the uS banking sector following the financial crisis. Because Wells Fargo had little, if any, involvement in the transactions that brought down a number of its peers, it had a much stronger reputation to build upon. While other banks were concentrating on rebuilding their trust and their image with their customers, Wells Fargo capitalised on its history and identity to position itself as an alternative with uS consumers who had previously had little access to it.
Wells Fargo delivered a raft of improvements and innovations last year, including features that enabled customers to engage with it more effectively, such as the Wells Fargo mobile App for Android-powered smartphone and tablet devices.
But 2012 saw Wells Fargo’s expansion ambitions in full play too. It completed the acquisition of Burdale Financial Holding and Burdale Capital Finance from Bank of Ireland, for example, and acquired BNP Paribas’s North American reserve-based and related diversified energy-lending businesses. The BNP energy business comprises approximately 175 customer relationships, nearly $9.5 billion of loan commitments, and around $3.9 billion in loans outstanding. Around 90 per cent of the portfolio is uS based, with the remainder located primarily in Canada, an increasingly important market for the Wells Fargo energy business.
Wells Fargo Securities bought merlin Securities llC, a prime brokerage services and technology provider based in San Francisco and New York City, and rebranded it as Wells Fargo Prime Services.
160th birthday presentsIn the year it celebrated 160 years of service, Wells Fargo received a number of accolades. Trade Finance magazine judged it ‘Best trade bank in the uS’ for the second consecutive year, as well as ‘Best financial institution trade servicing bank’ and ‘Best overall trade bank in North America’.
For the third year in a row, Global Finance magazine named Wells Fargo ‘Best corporate/institutional internet bank’ and ‘Best consumer internet bank in the united States’.
The bank’s commitment to the environment was reflected in its inclusion in four different categories of the Carbon leadership Indices.
brand value$26,044m +12%
markeT cap$182,986m +37%
brand raTingAA+domicleUSA
8 | brandFinance® banking 500 | MARCH 2013
The Top 20: Profiles 02, 03, 04
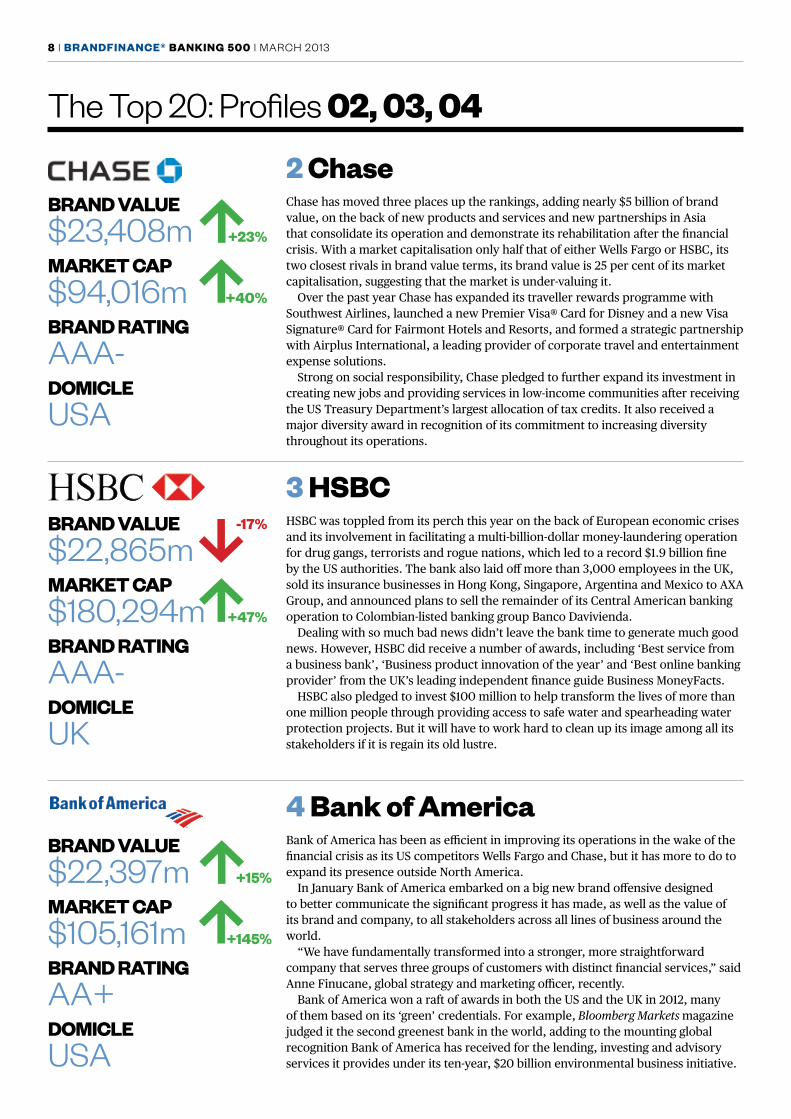
2 chaseChase has moved three places up the rankings, adding nearly $5 billion of brand value, on the back of new products and services and new partnerships in Asia that consolidate its operation and demonstrate its rehabilitation after the financial crisis. With a market capitalisation only half that of either Wells Fargo or HSBC, its two closest rivals in brand value terms, its brand value is 25 per cent of its market capitalisation, suggesting that the market is under-valuing it.
over the past year Chase has expanded its traveller rewards programme with Southwest Airlines, launched a new Premier Visa® Card for disney and a new Visa Signature® Card for Fairmont Hotels and resorts, and formed a strategic partnership with Airplus International, a leading provider of corporate travel and entertainment expense solutions.
Strong on social responsibility, Chase pledged to further expand its investment in creating new jobs and providing services in low-income communities after receiving the uS Treasury department’s largest allocation of tax credits. It also received a major diversity award in recognition of its commitment to increasing diversity throughout its operations.
3 hsbcHSBC was toppled from its perch this year on the back of european economic crises and its involvement in facilitating a multi-billion-dollar money-laundering operation for drug gangs, terrorists and rogue nations, which led to a record $1.9 billion fine by the uS authorities. The bank also laid off more than 3,000 employees in the uK, sold its insurance businesses in Hong Kong, Singapore, Argentina and mexico to AXA Group, and announced plans to sell the remainder of its Central American banking operation to Colombian-listed banking group Banco davivienda.
dealing with so much bad news didn’t leave the bank time to generate much good news. However, HSBC did receive a number of awards, including ‘Best service from a business bank’, ‘Business product innovation of the year’ and ‘Best online banking provider’ from the uK’s leading independent finance guide Business moneyFacts.
HSBC also pledged to invest $100 million to help transform the lives of more than one million people through providing access to safe water and spearheading water protection projects. But it will have to work hard to clean up its image among all its stakeholders if it is regain its old lustre.
4 bank of americaBank of America has been as efficient in improving its operations in the wake of the financial crisis as its uS competitors Wells Fargo and Chase, but it has more to do to expand its presence outside North America.
In January Bank of America embarked on a big new brand offensive designed to better communicate the significant progress it has made, as well as the value of its brand and company, to all stakeholders across all lines of business around the world.
“We have fundamentally transformed into a stronger, more straightforward company that serves three groups of customers with distinct financial services,” said Anne Finucane, global strategy and marketing officer, recently.
Bank of America won a raft of awards in both the uS and the uK in 2012, many of them based on its ‘green’ credentials. For example, Bloomberg Markets magazine judged it the second greenest bank in the world, adding to the mounting global recognition Bank of America has received for the lending, investing and advisory services it provides under its ten-year, $20 billion environmental business initiative.
brand value$23,408m +23%
markeT cap$94,016m +40%
brand raTingAAA-domicleUSA
brand value$22,865m
-17%
markeT cap$180,294m +47%
brand raTingAAA-domicleUK
brand value$22,397m +15%
markeT cap$105,161m +145%
brand raTingAA+domicleUSA
brand value$20,119m +1%
markeT cap$80,346m +35%
brand raTingAAA-domicleSpain
MARCH 2013 | brandFinance® banking 500 | 9
The Top 20: Profiles 05, 06, 07
5 citigroupIts steady progress up the rankings reflects Citigroup’s hard work rebuilding its operational excellence and risk management strategies following the financial crisis. It celebrated its 200th anniversary in 2012 and, having refocused the franchise on the basics of banking, is well-positioned for continued profitability and growth.
employees continue to demonstrate their engagement with Citi: last year a record 100,000 volunteers participated in Global Community day, part of Citi’s commitment to helping communities in 92 countries around the world.
Citi also demonstrated its global citizenship with a new partnership with the uS Agency for International development (uSAId). This was designed to broaden financial inclusion by fostering the rapid adoption of ‘mobile money’ technology in developing countries.
Citi’s sponsorship of the uS olympic and Paralympic teams in the london 2012 games enhanced its brand image.
New Ceo michael Corbat announced actions that will reduce expenses further and improve efficiency, while allowing Citi to continue to serve clients around the world, including in emerging markets.
6 santanderSantander has struggled to sustain its image as a stable bank in the face of both the financial crisis across the eurozone and a stuttering domestic economy and high unemployment. The bank also had to deal with unexpected charges on the provisioning of real-estate assets, and announced a slimmed-down board.
However, it maintained its pole position in retail banking as a result of measures to diversify its operation and reduce risk. For example, it became the only Spanish or latin American bank allowed to deal in the local currency, the renminbi, in China, reinforcing its position as a major player in the growing economic links between China and latin America. It also increased its presence in Poland, one of its ten core markets. Santander has also consolidated its position in Spain though acquisitions and strategic alliances.
Santander won a raft of prestigious awards in 2012, including ‘Bank of the year’ from both Euromoney and The Banker magazines for, among other things, its ability to generate recurrent profits even in a difficult economic climate, and its strong balance sheet.
meanwhile, Santander’s sponsorship of Ferrari continues to serve it well.
7 icbcIndustrial and Commercial Bank of China celebrated its 20th year as a global bank last year by increasing the scale, quality and efficiency of its international operations in order to meet the growing demand from customers for global financial services.
Its acquisition of 80 per cent of the Bank of east Asia (a uS commercial bank) is a first for a Chinese bank and represents a bridgehead for Chinese and uS companies to engage further on an equal basis.
ICBC’s acquisition of 80 per cent of Standard Bank Argentina is the first acquisition of a latin American financial institution by a Chinese bank. ICBC Argentina will be the largest Chinese bank in latin America. ICBC also received approval to set up a branch in Brazil, which will facilitate bilateral trade and investment between China and Brazil.
ICBC won a raft of awards last year from organisations and publications including the China Banking Association, The Asian Banker and Euromoney. Money Week voted ICBC ‘most respected bank in China’ for the third year running in recognition of its outstanding social responsibility practice and good corporate image.
brand value$21,677m +16%
markeT cap$112,395m +78%
brand raTingAA+domicleUSA
brand value$19,820m +31%
markeT cap$242,613m +9%
brand raTingAA+domicleChina
10 | brandFinance® banking 500 | MARCH 2013
8 american expressAmerican express has diversified its business significantly over recent years, switching the focus of its activities from its traditional well-heeled customers to a very different demographic group – the ‘underbanked’ or ‘unbanked’ – judging the potential gains are worth the risk to its gilt-edged brand. The increase in its brand value last year suggests the gamble has paid off.
American express is no longer just a charge-card company; it is now a bank, offering a growing list of services to a wider range of customers.
Bluebird is an account designed to help customers better manage their everyday finances. Similarly, a prepaid reloadable card with no monthly or maintenance fees will soon be available, as will a similar card aimed specifically at college students.
American express communicates its new strategy through typically memorable advertising, augmenting its traditional above-the-line approach with the innovative use of digital and social platforms. It continues to enjoy strong social responsibility credentials, is regularly voted one of the best places to work, and for the sixth consecutive year topped the Jd Power customer satisfaction rankings for uS credit card companies.
9 bnp paribasBNP Paribas is the third largest bank in europe after HSBC and Santander. With more than 15 million individual and business customers and 4,200 branches in europe, BNP Paribas has built up an integrated customer-focused network over the past decade. This is a remarkable achievement given that BNP Paribas has been formed over the years through a fusion of many different banks, most of which were originally founded in the 19th century, mainly to provide finance for business.
last year, BNP Paribas launched a ‘responsibility charter’ highlighting its commitment to all its stakeholders to engage in responsible banking.
It has significant operations in North America and recently finalised a joint venture with leading russian bank Sberbank.
BNP Paribas continues to sponsor roland Garros, which, for 40 years, has been a major plank of its increasingly global sport sponsorship programme. The bank is the top tennis sponsor in the world.
BNP Paribas scooped a number of prestigious awards last year, particularly for its wealth management business.
10 china construction bankChina Construction Bank (CCB) is the only banking brand to have sustained the same position in the Banking 500 ranking for three consecutive years. ranked number ten again this year, it is also the second most valuable banking brand in Asia-Pacific, being ousted from the number one slot last year by ICBC, as the big four Chinese banks jostle for market share. However, while it lost value last year, China Construction Bank increased its brand value this year by $1.5 billion.
CCB is one of the largest and most reputable China-based commercial banks. Its market capitalisation is nearly $209 billion, making it the second most valuable bank in the world, after ICBC, and it provides a comprehensive range of strong and innovative banking services, particularly in the wholesale, retail, and investment banking sectors.
CCB has recently augmented its strategy of delivering steady business growth and consolidating its presence in retail banking, by enhancing its private banking operations with new products and services demanded by the growing number of customers with high-value assets.
brand value$19,004m +4%
markeT cap$66,025m +23%
brand raTingAAA-domicleUSA
brand value$18,573m +10%
markeT cap$61,362m +45%
brand raTingAAA-domicleFrance
brand value$16,949m +10%
markeT cap$208,838m +19%
brand raTingAAdomicleChina
The Top 20: Profiles 08, 09, 10
MARCH 2013 | brandFinance® banking 500 | 11
brand value$14,572m +13%
markeT cap$41,669m +26%
brand raTingAAA-domicleGermany
11 agricultural bank of chinaAgricultural Bank of China (ABC) leapt up the league table this year, adding an impressive $6.04 billion of brand value, making it the ‘absolute brand value’ winner in 2013. Its success comes on the back of its surprisingly consistent operating excellence.
ABC’s operating philosophy is ‘market-driven, customer-oriented and profit-targeted’. It has a large customer base and wide network in both urban and rural areas, and this, combined with restructuring and operational transformation activities over the past year, has contributed to rapid expansion, improved quality and enhanced financial results.
last year it launched a programme aimed at students, including scholarships for foreign study and internships; it opened its first overseas subsidiary — in london, which will serve as a bridgehead for european expansion; and it has seen a positive return from its strategy of integrating ‘green governance’ into its operations.
Its efforts to continually improve its management, product innovation and business structure have netted it a raft of awards, including the coveted ‘Best investment bank’ award from Securities Times for the fourth year in a row.
12 deutsche bankdeutsche Bank climbed two places in the ranking this year, following two consecutive years in 14th position. Its brand value rose by almost $2 billion, though has still to regain the $15 billion value it enjoyed in 2011. deutsche Bank has performed solidly throughout europe, North America, Asia-Pacific and the emerging markets, and its broad offering of products and services for corporate and institutional clients as well as private and business clients, makes it very well positioned for continued success and growth.
Following a period of dialogue with shareholders, clients, employees and other key stakeholders, deutsche Bank has defined its future strategic management approach, operating principles and long-term strategy.
It is strengthening its balanced universal banking model by integrating its existing asset management and wealth management businesses into a new business division called Asset and Wealth management (AWm). AWm will stand alongside the other business divisions: Corporate Banking and Securities, Global Transaction Banking and Private and Business Clients.
13 sberbankSberbank’s jump from 17th to 14th position in the Banking 500 rankings this year, with an additional $3.5 billion of brand value, represents a significant step-change in its history and consolidates its position as russia’s largest universal banking institution. It recently acquired Troika dialog, and the merged business will soon become the undisputed regional market leader.
once integration of these two complementary businesses is complete, Sberbank will be able to offer a new level of client service based on high-quality financial consultation and a broad choice of investment strategies, underpinned by a full range of modern financial instruments – from the bank’s traditional credit products to complex investment banking and global markets products.
Sberbank launched a campaign last year demonstrating its ability to improve its products and services to meet customers’ expectations. Its ‘How Sberbank is changing’ series of videos set a new standard in banking practice in their acknowledgement of customers’ problems and the bank’s commitment to address them. The videos were created with support from Sberbank’s customers.
brand value$15,967m +61%
markeT cap$152,037m +15%
brand raTingAA-domicleChina
brand value$14,160m +31%
markeT cap$65,737m +20%
brand raTingAA+domicleRussia
The Top 20: Profiles 11, 12, 13
12 | brandFinance® banking 500 | MARCH 2013
14 bank of chinaBank of China, which celebrated its centenary last year, is steadily moving up the rankings, progress reflected in the improvement in its brand strength rating from AA- to AA+. It gained over $1 billion of brand value over the past year, based largely on the expansion of its wealth management business and the launch of new private banking services to meet growing demand from the Asia-Pacific marketplace.
Although it has focused its attention on enhancing services to high-net-worth individuals and corporates, Bank of China hasn’t neglected the retail banking market. It has launched a range of new products and solutions for individuals, including swifter mortgage approval processes: customers can now expect an answer within one working day.
Although well-known in China, the country’s oldest bank still has low international awareness. This contributes to its low brand value/market capitalisation rating of 11 per cent — which is fairly typical of Chinese banks. However, stability in the Asian market means that Bank of China now has the opportunity to consolidate and strengthen its brand awareness, as well as extend its business, through acquisition, mergers and strategic partnerships within developed markets.
15 Jp morganAs well as climbing one place to become the 15th most valuable banking brand in the world this year, JP morgan is also the most valuable wholesale/investment banking brand in the world, and the fifth most valuable banking brand in North America. It has more than made up for the 12 per cent loss of brand value it suffered last year, adding over $2 billion this year.
last year the bank launched a series of new products, services and client-focused mandates designed to capitalise on its global footprint, emphasise its understanding of the changing regulatory environment and highlight its innovative approach to issues affecting financial institutions.
For example, the treasury services division launched the next generation JP morgan ACCeSS®, an online electronic banking portal for corporates, financial institutions and commercial banking clients. The portal has been developed for diverse platforms including numerous markets in Asia.
16 bradescoBrazilian bank Bradesco has fallen down the rankings for the third consecutive year, tumbling from ninth to 16th position in the Banking 500 after losing $2 billion of brand value. Bradesco’s fortunes reflect the weakening Brazilian economy: GdP growth is much slower in Brazil than in the other BrIC economies, russia, India and China. However, Bradesco remains the most valuable latin American brand.
Bradesco owes its strong brand awareness in Brazil to its solid presence in the retail banking sector. Its wide branch network allows it to both service customers’ needs effectively and attract new clients. Bradesco also has strong corporate responsibility and environmental policies, and will be a high-profile sponsor of the 2016 olympic Games in rio de Janeiro.
New strategic partnerships being negotiated in developed countries and Asia could strengthen Bradesco’s brand awareness, create new business streams, help to diversify risk and further its global ambitions.
brand value$14,145m +10%
markeT cap$131,926m +10%
brand raTingAA+domicleChina
brand value$13,775m +19%
markeT cap$75,413m +52%
brand raTingAA+domicleUSA
brand value$13,610m
-13%
markeT cap$70,270m +27%
brand raTingAAA-domicleBrazil
The Top 20: Profiles 14, 15, 16
MARCH 2013 | brandFinance® banking 500 | 13
brand value$12,442m
-6%
markeT cap$73,569m 0%
brand raTingAA+domicleBrazil
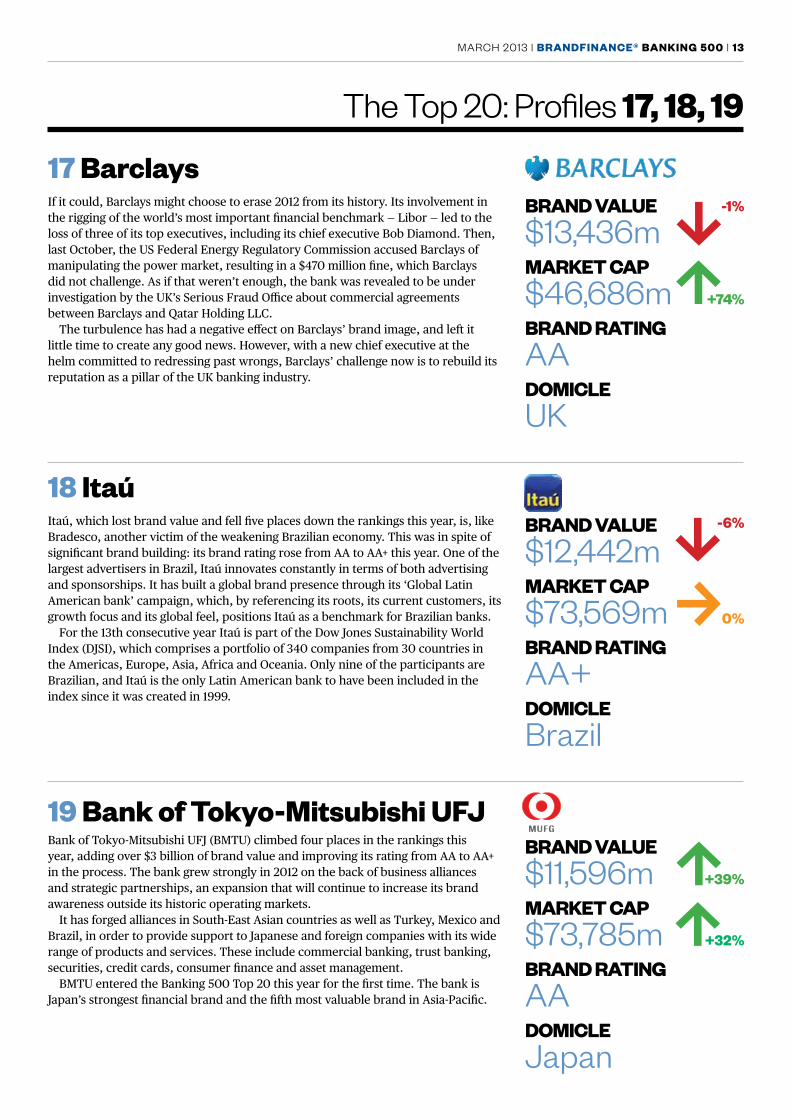
17 barclaysIf it could, Barclays might choose to erase 2012 from its history. Its involvement in the rigging of the world’s most important financial benchmark — libor — led to the loss of three of its top executives, including its chief executive Bob diamond. Then, last october, the uS Federal energy regulatory Commission accused Barclays of manipulating the power market, resulting in a $470 million fine, which Barclays did not challenge. As if that weren’t enough, the bank was revealed to be under investigation by the uK’s Serious Fraud office about commercial agreements between Barclays and Qatar Holding llC.
The turbulence has had a negative effect on Barclays’ brand image, and left it little time to create any good news. However, with a new chief executive at the helm committed to redressing past wrongs, Barclays’ challenge now is to rebuild its reputation as a pillar of the uK banking industry.
18 itaúItaú, which lost brand value and fell five places down the rankings this year, is, like Bradesco, another victim of the weakening Brazilian economy. This was in spite of significant brand building: its brand rating rose from AA to AA+ this year. one of the largest advertisers in Brazil, Itaú innovates constantly in terms of both advertising and sponsorships. It has built a global brand presence through its ‘Global latin American bank’ campaign, which, by referencing its roots, its current customers, its growth focus and its global feel, positions Itaú as a benchmark for Brazilian banks.
For the 13th consecutive year Itaú is part of the dow Jones Sustainability World Index (dJSI), which comprises a portfolio of 340 companies from 30 countries in the Americas, europe, Asia, Africa and oceania. only nine of the participants are Brazilian, and Itaú is the only latin American bank to have been included in the index since it was created in 1999.
19 bank of Tokyo-mitsubishi uFJBank of Tokyo-mitsubishi uFJ (BmTu) climbed four places in the rankings this year, adding over $3 billion of brand value and improving its rating from AA to AA+ in the process. The bank grew strongly in 2012 on the back of business alliances and strategic partnerships, an expansion that will continue to increase its brand awareness outside its historic operating markets.
It has forged alliances in South-east Asian countries as well as Turkey, mexico and Brazil, in order to provide support to Japanese and foreign companies with its wide range of products and services. These include commercial banking, trust banking, securities, credit cards, consumer finance and asset management.
BmTu entered the Banking 500 Top 20 this year for the first time. The bank is Japan’s strongest financial brand and the fifth most valuable brand in Asia-Pacific.
brand value$13,436m
-1%
markeT cap$46,686m +74%
brand raTingAAdomicleUK
brand value$11,596m +39%
markeT cap$73,785m +32%
brand raTingAAdomicleJapan
The Top 20: Profiles 17, 18, 19
14 | brandFinance® banking 500 | MARCH 2013
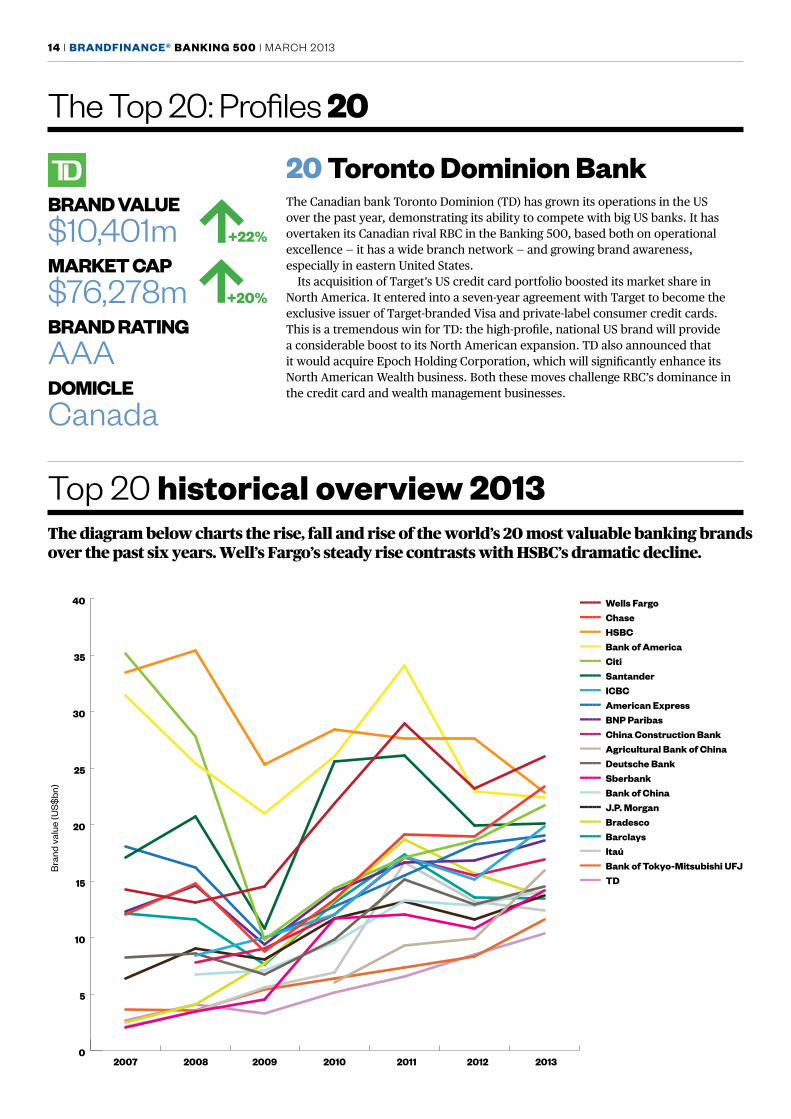
20 Toronto dominion bankThe Canadian bank Toronto dominion (Td) has grown its operations in the uS over the past year, demonstrating its ability to compete with big uS banks. It has overtaken its Canadian rival rBC in the Banking 500, based both on operational excellence — it has a wide branch network — and growing brand awareness, especially in eastern united States.
Its acquisition of Target’s uS credit card portfolio boosted its market share in North America. It entered into a seven-year agreement with Target to become the exclusive issuer of Target-branded Visa and private-label consumer credit cards. This is a tremendous win for Td: the high-profile, national uS brand will provide a considerable boost to its North American expansion. Td also announced that it would acquire epoch Holding Corporation, which will significantly enhance its North American Wealth business. Both these moves challenge rBC’s dominance in the credit card and wealth management businesses.
brand value$10,401m +22%
markeT cap$76,278m +20%
brand raTingAAAdomicleCanada
The Top 20: Profiles 20
Top 20 historical overview 2013The diagram below charts the rise, fall and rise of the world’s 20 most valuable banking brands over the past six years. Well’s Fargo’s steady rise contrasts with HSBC’s dramatic decline.
Wells Fargo 14277 13130 14508 21916 28944 23229 26044 Chase 12083 14798 8747 13400 19150 18964 23408 HSBC 33495 35456 25364 28472 27632 27597 22865 Bank of America 31426 25417 21017 26047 34076 22910 22397 Citi 35148 27817 9810 14362 17133 18639 21677 Santander 17063 20718 10840 25576 26150 19969 20119 ICBC 8427 10031 12083 17194 15164 19820 American Express 18109 16183 9944 12737 15529 18231 19004 BNP Paribas 12278 14637 9360 14060 16643 16809 18573 China Construction Bank 7786 9024 12076 17092 15464 16949 Agricultural Bank of China 6032 9283 9929 15967 Deutsche Bank 8240 8585 6703 9862 15169 12906 14572 Sberbank 2029 3418 4531 11729 12012 10772 14160 Bank of China 6741 7053 9615 13257 12857 14145 J.P. Morgan 6383 9064 8072 11732 13241 11602 13775 Bradesco 2475 4106 7698 13299 18678 15692 13610 Barclays 12182 11582 7583 13134 17358 13552 13436 Itaú 2172 3500 5593 6911 16655 13171 12442 Bank of Tokyo-Mitsubishi UFJ 3656 3540 5445 6393 7336 8315 11596 TD 2663 4041 3257 5179 6604 8499 10401
0
5
10
15
20
25
30
35
40 ----- Wells Fargo----- Chase----- HSBC----- Bank of America----- Citi----- Santander----- ICBC----- American Express----- BNP Paribas----- China Construction Bank----- Agricultural Bank of China----- Deutsche Bank----- Sberbank----- Bank of China----- J.P. Morgan----- Bradesco----- Barclays ----- Itaú----- Bank of Tokyo-Mitsubishi UFJ----- TD
2007 2008 2009 2010 2011 2012 2013
Bra
nd v
alue
(US$
bn)
MARCH 2013 | brandFinance® banking 500 | 15
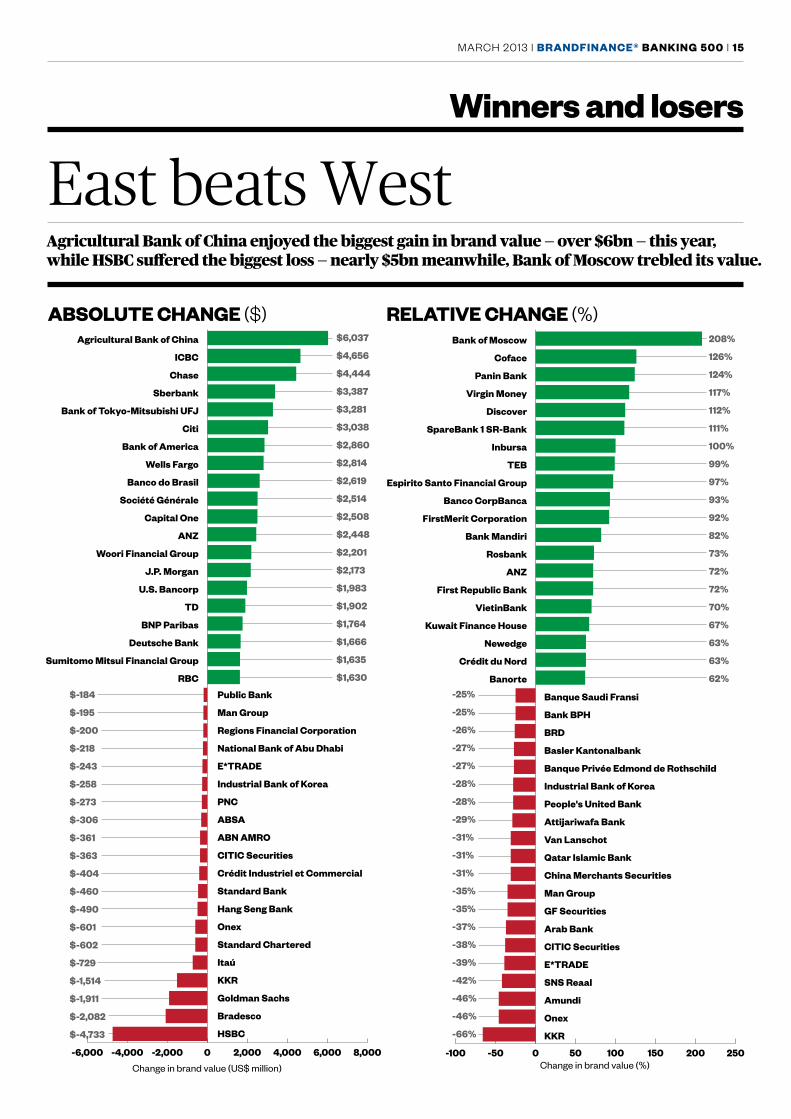
winners and losers
Agricultural Bank of China enjoyed the biggest gain in brand value — over $6bn — this year, while HSBC suffered the biggest loss — nearly $5bn meanwhile, Bank of Moscow trebled its value.
-6,000 -4,000 -2,000 0 2,000 4,000 6,000 8,000
HSBC
Bradesco
Goldman Sachs
KKR
Itaú
Standard Chartered
Onex
Hang Seng Bank
Standard Bank
Crédit Industriel et Commercial
CITIC Securities
ABN AMRO
ABSA
PNC
Industrial Bank of Korea
E*TRADE
National Bank of Abu Dhabi
Regions Financial Corporation
Man Group
Public Bank
RBC
Sumitomo Mitsui Financial Group
Deutsche Bank
BNP Paribas
TD
U.S. Bancorp
J.P. Morgan
Woori Financial Group
ANZ
Capital One
Société Générale
Banco do Brasil
Wells Fargo
Bank of America
Citi
Bank of Tokyo-Mitsubishi UFJ
Sberbank
Chase
ICBC
Agricultural Bank of China $6,037
$4,656
$4,444
$3,387
$3,281
$3,038
$2,860
$2,814
$2,619
$2,514
$2,508
$2,448
$2,201
$2,173
$1,983
$1,902
$1,764
$1,666
$1,635
$1,630
$-184
$-195
$-200
$-218
$-243
$-258
$-273
$-306
$-361
$-363
$-404
$-460
$-490
$-601
$-602
$-729
$-1,514
$-1,911
$-2,082
$-4,733
Change in brand value (US$ million)
absoluTe change ($) relaTive change (%)
-100 -50 0 50 100 150 200 250
KKR
Onex
Amundi
SNS Reaal
E*TRADE
CITIC Securities
Arab Bank
GF Securities
Man Group
China Merchants Securities
Qatar Islamic Bank
Van Lanschot
Attijariwafa Bank
People's United Bank
Industrial Bank of Korea
Banque Privée Edmond de Rothschild
Basler Kantonalbank
BRD
Bank BPH
Banque Saudi Fransi
Banorte
Crédit du Nord
Newedge
Kuwait Finance House
VietinBank
First Republic Bank
ANZ
Rosbank
Bank Mandiri
FirstMerit Corporation
Banco CorpBanca
Espirito Santo Financial Group
TEB
Inbursa
SpareBank 1 SR-Bank
Discover
Virgin Money
Panin Bank
Coface
Bank of Moscow 208%
126%
124%
117%
112%
111%
100%
99%
97%
93%
92%
82%
73%
72%
72%
70%
67%
63%
63%
62%-25%
-25%
-26%
-27%
-27%
-28%
-28%
-29%
-31%
-31%
-31%
-35%
-35%
-37%
-38%
-39%
-42%
-46%
-46%
-66%
Change in brand value (%)
East beats West
16 | brandFinance® banking 500 | MARCH 2013
regional results
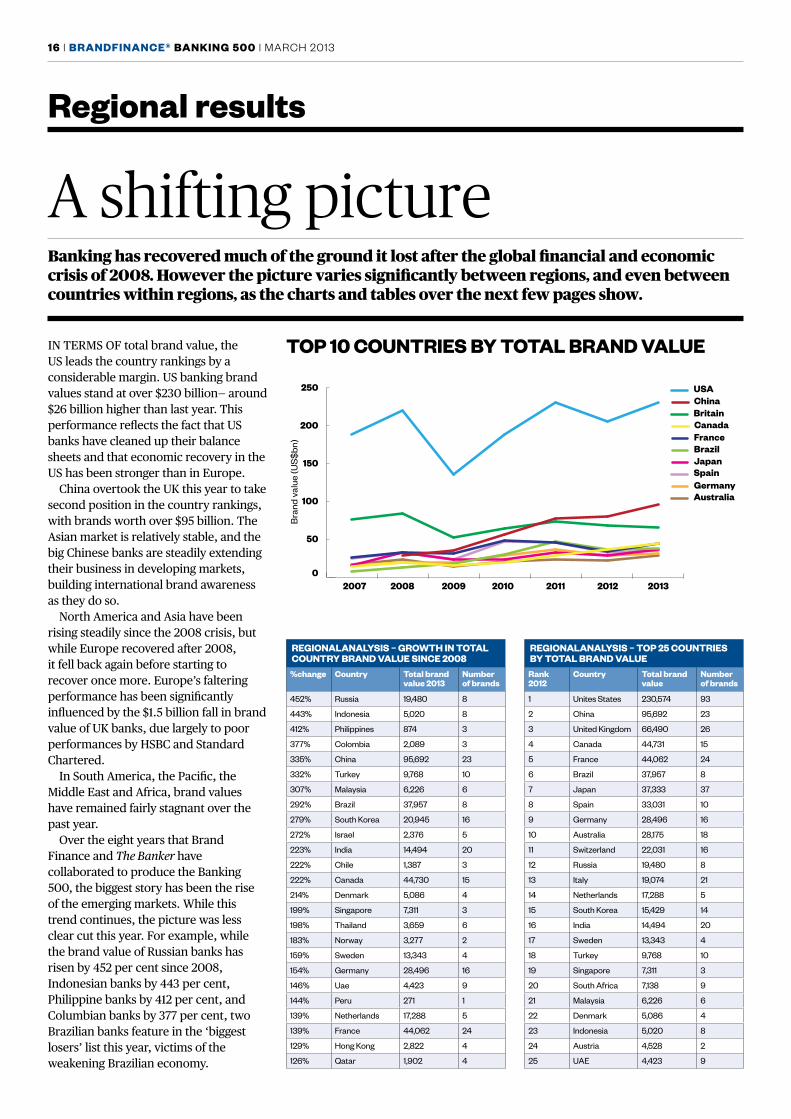
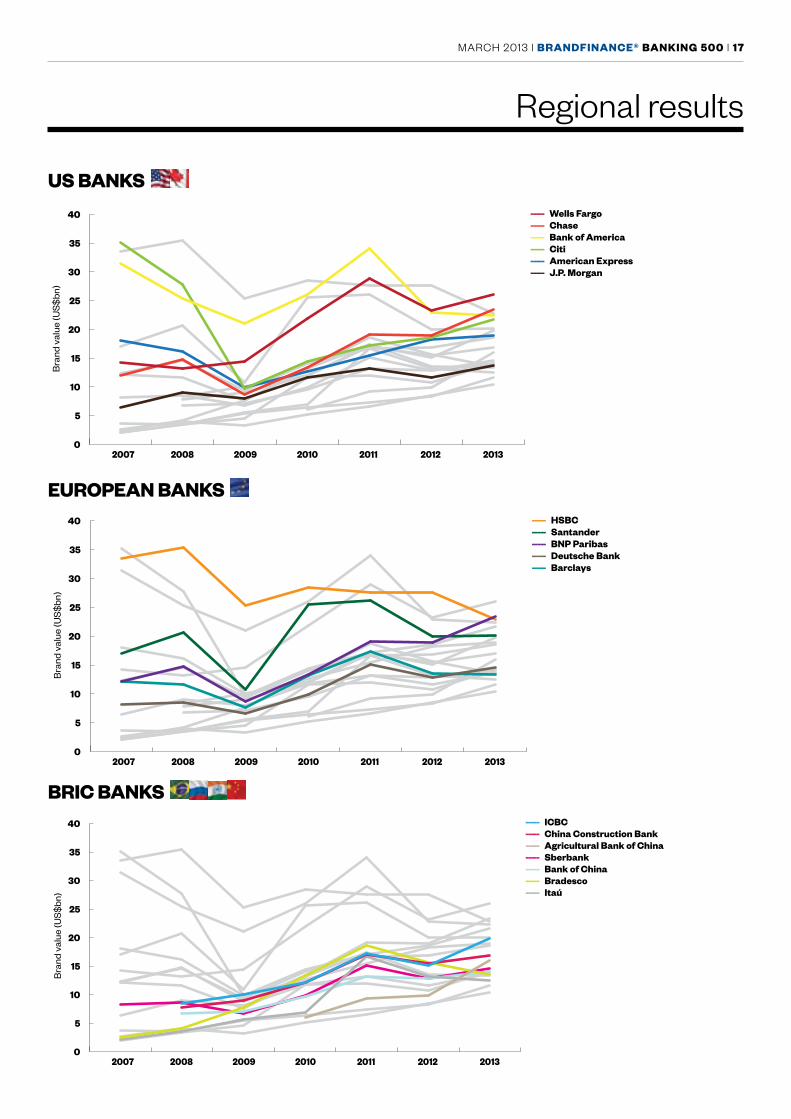
Banking has recovered much of the ground it lost after the global financial and economic crisis of 2008. However the picture varies significantly between regions, and even between countries within regions, as the charts and tables over the next few pages show.
A shifting picture
IN TermS oF total brand value, the uS leads the country rankings by a considerable margin. uS banking brand values stand at over $230 billion— around $26 billion higher than last year. This performance reflects the fact that uS banks have cleaned up their balance sheets and that economic recovery in the uS has been stronger than in europe.
China overtook the uK this year to take second position in the country rankings, with brands worth over $95 billion. The Asian market is relatively stable, and the big Chinese banks are steadily extending their business in developing markets, building international brand awareness as they do so.
North America and Asia have been rising steadily since the 2008 crisis, but while europe recovered after 2008, it fell back again before starting to recover once more. europe’s faltering performance has been significantly influenced by the $1.5 billion fall in brand value of uK banks, due largely to poor performances by HSBC and Standard Chartered.
In South America, the Pacific, the middle east and Africa, brand values have remained fairly stagnant over the past year.
over the eight years that Brand Finance and The Banker have collaborated to produce the Banking 500, the biggest story has been the rise of the emerging markets. While this trend continues, the picture was less clear cut this year. For example, while the brand value of russian banks has risen by 452 per cent since 2008, Indonesian banks by 443 per cent, Philippine banks by 412 per cent, and Columbian banks by 377 per cent, two Brazilian banks feature in the ‘biggest losers’ list this year, victims of the weakening Brazilian economy.
regionalanalYsis – growTh in ToTal counTrY brand value since 2008 %change country Total brand
value 2013number of brands
452% Russia 19,480 8
443% Indonesia 5,020 8
412% Philippines 874 3
377% Colombia 2,089 3
335% China 95,692 23
332% Turkey 9,768 10
307% Malaysia 6,226 6
292% Brazil 37,957 8
279% South Korea 20,945 16
272% Israel 2,376 5
223% India 14,494 20
222% Chile 1,387 3
222% Canada 44,730 15
214% Denmark 5,086 4
199% Singapore 7,311 3
198% Thailand 3,659 6
183% Norway 3,277 2
159% Sweden 13,343 4
154% Germany 28,496 16
146% Uae 4,423 9
144% Peru 271 1
139% Netherlands 17,288 5
139% France 44,062 24
129% Hong Kong 2,822 4
126% Qatar 1,902 4
regionalanalYsis – Top 25 counTries bY ToTal brand value rank 2012
country Total brand value
number of brands
1 Unites States 230,574 93
2 China 95,692 23
3 United Kingdom 66,490 26
4 Canada 44,731 15
5 France 44,062 24
6 Brazil 37,957 8
7 Japan 37,333 37
8 Spain 33,031 10
9 Germany 28,496 16
10 Australia 28,175 18
11 Switzerland 22,031 16
12 Russia 19,480 8
13 Italy 19,074 21
14 Netherlands 17,288 5
15 South Korea 15,429 14
16 India 14,494 20
17 Sweden 13,343 4
18 Turkey 9,768 10
19 Singapore 7,311 3
20 South Africa 7,138 9
21 Malaysia 6,226 6
22 Denmark 5,086 4
23 Indonesia 5,020 8
24 Austria 4,528 2
25 UAE 4,423 9
Top 10 counTries bY ToTal brand value
0
50
100
150
200
250
AustraliaGermanySpainJapanBrazilFranceCanadaBritainChinaUSA
Bra
nd v
alue
(US$
bn)
2007 2008 2009 2010 2011 2012 2013
MARCH 2013 | brandFinance® banking 500 | 17
Regional results
0
5
10
15
20
25
30
35
40
2007 2008 2009 2010 2011 2012 2013
----- Wells Fargo----- Chase----- Bank of America----- Citi----- American Express----- J.P. Morgan
Bra
nd v
alue
(US$
bn)
0
5
10
15
20
25
30
35
40
2007 2008 2009 2010 2011 2012 2013
----- HSBC----- Santander----- BNP Paribas----- Deutsche Bank----- Barclays
Bra
nd v
alue
(US$
bn)
0
5
10
15
20
25
30
35
40
2007 2008 2009 2010 2011 2012 2013
----- ICBC----- China Construction Bank----- Agricultural Bank of China----- Sberbank----- Bank of China----- Bradesco----- Itaú
Bra
nd v
alue
(US$
bn)
us banks
european banks
bric banks
Top 10 counTries bY ToTal brand value
18 | brandFinance® banking 500 | MARCH 2013
Regional results
europe
rank brand 2013 2012
1 BNP Paribas 14,587 12,989
2 Sberbank 14,160 10,772
3 Santander 10,180 10,931
4 Barclays 7,644 10,362
5 HSBC 7,541 9,697
6 Rabobank 7,406 7,328
7 Nordea 6,538 5,205
8 Deutsche Bank 6,316 8,770
9 Société Générale 6,004 3,944
10 ING 4,911 4,962
souTh america
rank brand 2013 2012
1 Bradesco 13,610 15,692
2 Itaú 12,442 13,171
3 Banco do Brasil 9,883 7,264
4 Santander 9,594 9,038
5 Citi 4,408 3,977
6 HSBC 3,174 3,668
7 Morgan Stanley 1,809 2,143
8 BBVA 1,694
9 Goldman Sachs 1,416 2,731
10 Deutsche Bank 1,034 1,251
aFrica
rank brand 2013 2012
1 Standard Bank 1,505 1,911
2 ABSA 1,482 1,784
3 Citi 1,465 1,948
4 Nedbank 1,259 1,049
5 First National Bank 1,045 988
6 American Express 750 1,136
7 Credit Suisse 740 783
8 Goldman Sachs 637 1,224
9 Standard Chartered 528 610
10 Morgan Stanley 429 681
norTh america
rank brand 2013 2012
1 Wells Fargo 26,044 23,229
2 Bank of America 18,219 19,266
3 Chase 17,848 14,456
4 American Express 13,823 13,518
5 J.P. Morgan 10,503 8,845
6 TD 9,378 7,741
7 RBC 8,592 7,379
8 Citi 7,934 6,217
9 Capital One 6,897 4,604
10 U.S. Bancorp 6,497 4,514
middle easT
rank brand 2013 2012
1 QNB 1,307 1,264
2 Al-Rajhi Bank 1,192 1,244
3 National Bank of Abu Dhabi 988 991
4 Emirates NBD 971 1,038
5 Bank Hapoalim 792 774
6 First Gulf Bank 775 713
7 Kuwait Finance House 751 449
8 Bank Leumi 692 545
9 NBK Capital 587 512
10 Samba Financial Group 568 740
asia - paciFic
rank brand 2013 2012
1 ICBC 19,472 14,758
2 China Construction Bank 16,667 15,148
3 Agricultural Bank of China 15,967 9,929
4 Bank of China 13,768 12,537
5 Bank of Tokyo-Mitsubishi UFJ 10,738 6,315
6 HSBC 6,483 7,797
7 ANZ 5,832 3,172
8 State Bank of India 5,729 4,472
9 Bank of Communications 5,587 4,406
10 Sumitomo Mitsui Financial Group 5,206 3,759
2009 2010 2011 2012 2013
0
50
100
150
200
250
300,
Rest of the World / Other
PacificAfrica
Middle East
Asia
South America
Central America
North America
Europe
Bra
nd v
alue
(US$
bn)
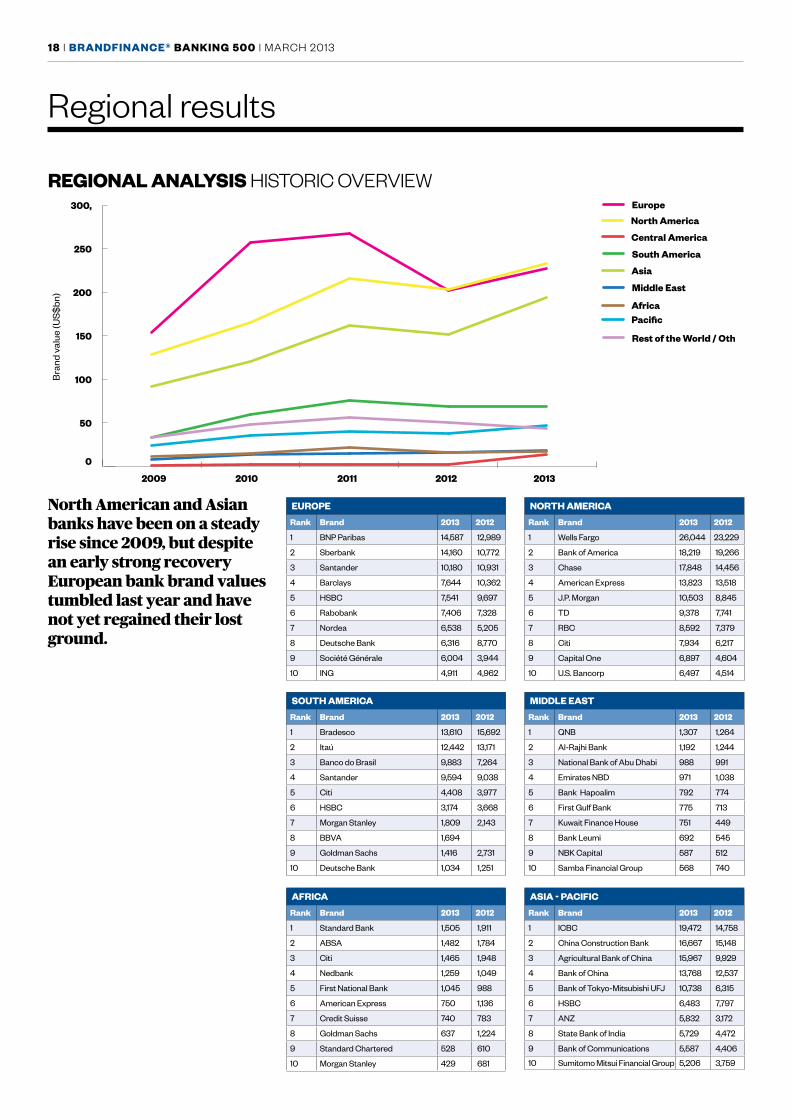
regional analYsis HiSToRiC oVERViEw
North American and Asian banks have been on a steady rise since 2009, but despite an early strong recovery European bank brand values tumbled last year and have not yet regained their lost ground.
MARCH 2013 | brandFinance® banking 500 | 19
sector results
asseT / wealTh managemenT
rank brand 2013 2012
1 Deutsche Bank 5,676 3,668
2 Credit Suisse 4,661 3,375
3 Ubs 3,705 3,099
4 Merrill Lynch 3,702
5 Morgan Stanley 3,196 2,668
6 Wells Fargo 3,188 2,589
7 Blackrock 2,730 2,433
8 State Street 2,626 2,517
9 Rbc 2,214 1,619
10 J.P. Morgan 2,136 1,788
morTgages
rank brand 2013 2012
1 Rabobank 795 868
2 Nationstar Mortgage 782
3 DZ Bank 760 641
4 Eurohypo 555 488
5 HDFC 500 333
6 BB&T 449 438
7 Virgin Money 440 202
8 Wesbank 363
9 PNC 296 339
10 Fannie Mae 295 165
wholesale / commercial banking
rank brand 2013 2012
1 ICBC 11,372 8,936
2 China Construction Bank 9,923 8,725
3 Banco do Brasil 9,883 7,264
4 Agricultural Bank of China 8,495 6,727
5 Bank of China 7,623 5,272
6 Bank of America 6,107 4,611
7 Scotiabank 5,540 4,269
8 Sberbank 5,395 4,140
9 Citi 4,901 4,129
10 Wells Fargo 4,766 4,129
reTail banking
rank brand 2013 2012
1 Santander 18,414 17,032
2 Wells Fargo 18,090 16,511
3 Bradesco 12,961 14,512
4 BNP Paribas 12,570 9,516
5 Chase 12,083 9,036
6 HSBC 11,375 13,949
7 Sberbank 8,765 6,632
8 Citi 8,468 3,730
9 ICBC 8,245 6,097
10 Bank of Tokyo-Mitsubishi UFJ 7,611 5,638
crediT cards
rank brand 2013 2012
1 American Express 17,385 16,791
2 Chase 10,018 8,953
3 Bank of America 9,249 8,407
4 Visa 7,342 6,834
5 Itaú 7,244 7,514
6 Citi 6,647 5,393
7 Mastercard 5,418 5,177
8 Capital One 5,041 3,519
9 Barclays 3,412 3,278
10 Discover 2,668 1,313
invesTmenT banking
rank brand 2013 2012
1 J.P. Morgan 11,639 9,814
2 Deutsche Bank 8,897 9,237
3 HSBC 5,098 7,512
4 Credit Suisse 4,738 4,719
5 Morgan Stanley 4,353 3,679
6 Barclays 3,479 5,762
7 UBS 3,332 2,709
8 BNP Paribas 3,187 2,755
9 BNY Mellon 3,159 3,170
10 Goldman Sachs 2,112 3,881
insurance
rank brand 2013 2012
1 RBC 1,126 1,010
2 Bradesco 649 1,181
3 DZ Bank 640 463
4 W&W 529 484
5 RBS 399 162
6 BNP Paribas 344 271
7 Ameriprise Financial 340 0
8 TD 310 328
9 State Bank of India 257 287
10 ICICI Bank 252 280
Top 10 oTher
rank brand 2013 2012
1 Bank of America 2,985 819
2 Erste Group 2,397 2,476
3 HSBC 2,289 1,479
4 Raiffeisen Bank 2,131 1,882
5 American Express 1,596 1,440
6 CaixaBank 1,549 0
7 U.S. Bancorp 1,430 1,011
8 BBVA 1,258 1,089
9 Nomura 1,251 20
10 China Minsheng Bank 949 456
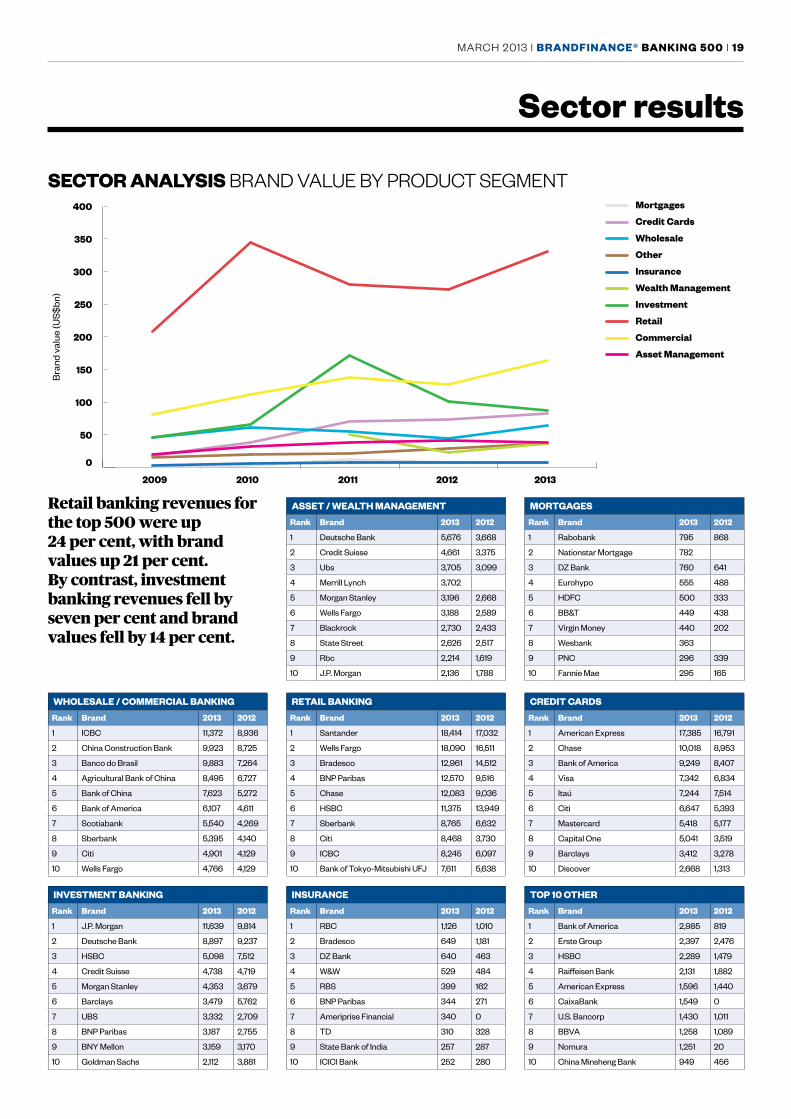
Retail banking revenues for the top 500 were up 24 per cent, with brand values up 21 per cent. By contrast, investment banking revenues fell by seven per cent and brand values fell by 14 per cent.
0
50
100
150
200
250
300
350
400 Mortgages
Credit Cards
Wholesale
Other
Insurance
Wealth Management
Investment
Retail
Commercial
Asset Management
2009 2010 2011 2012 2013
Bra
nd v
alue
(US$
bn)
secTor analYsis BRAnd VAlUE By PRodUCT SEGMEnT
20 | brandFinance® banking 500 | MARCH 2013
banking Forum 2013
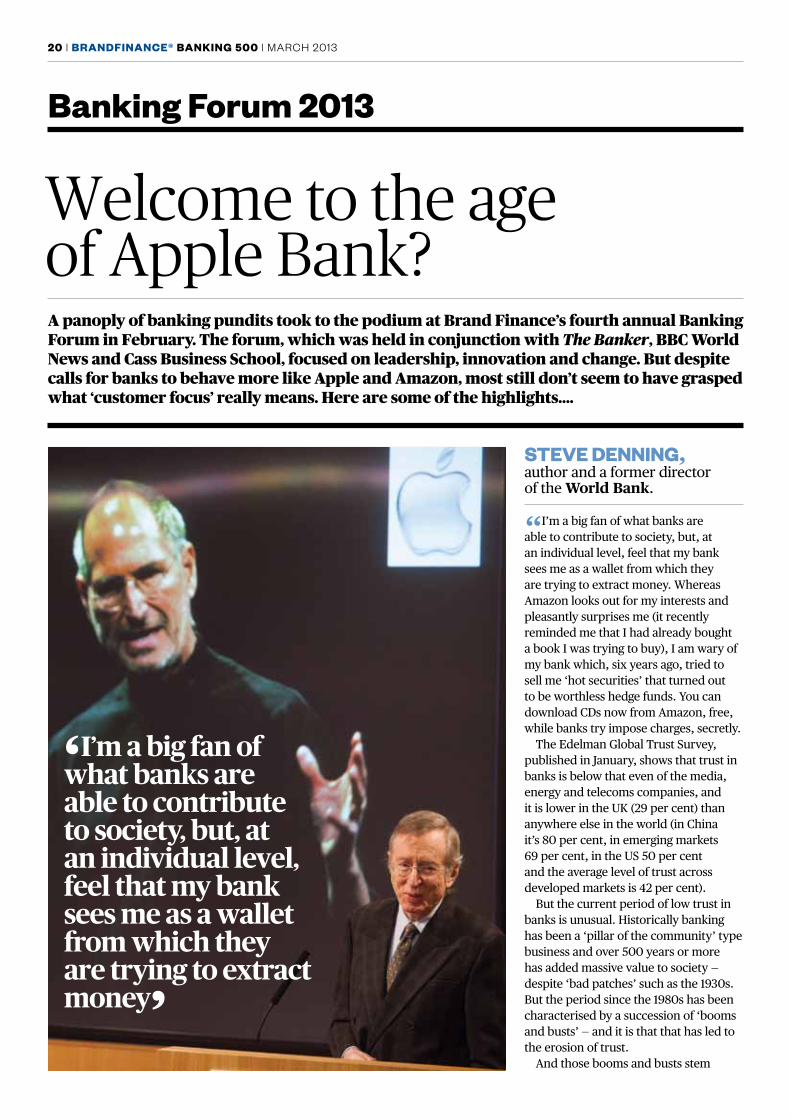
sTeve denning, author and a former director of the World Bank.
“I’m a big fan of what banks are able to contribute to society, but, at an individual level, feel that my bank sees me as a wallet from which they are trying to extract money. Whereas Amazon looks out for my interests and pleasantly surprises me (it recently reminded me that I had already bought a book I was trying to buy), I am wary of my bank which, six years ago, tried to sell me ‘hot securities’ that turned out to be worthless hedge funds. You can download Cds now from Amazon, free, while banks try impose charges, secretly.
The edelman Global Trust Survey, published in January, shows that trust in banks is below that even of the media, energy and telecoms companies, and it is lower in the uK (29 per cent) than anywhere else in the world (in China it’s 80 per cent, in emerging markets 69 per cent, in the uS 50 per cent and the average level of trust across developed markets is 42 per cent).
But the current period of low trust in banks is unusual. Historically banking has been a ‘pillar of the community’ type business and over 500 years or more has added massive value to society — despite ‘bad patches’ such as the 1930s. But the period since the 1980s has been characterised by a succession of ‘booms and busts’ — and it is that that has led to the erosion of trust.
And those booms and busts stem
Welcome to the age of Apple Bank?A panoply of banking pundits took to the podium at Brand Finance’s fourth annual Banking Forum in February. The forum, which was held in conjunction with The Banker, BBC World News and Cass Business School, focused on leadership, innovation and change. But despite calls for banks to behave more like Apple and Amazon, most still don’t seem to have grasped what ‘customer focus’ really means. Here are some of the highlights….
‘I’m a big fan of what banks are able to contribute to society, but, at an individual level, feel that my bank sees me as a wallet from which they are trying to extract money’
MARCH 2013 | brandFinance® banking 500 | 21
Banking Forum 2013
from the new imperative to ‘maximise shareholder value’ — in other words, to make money. Firms pursuing multiple goals were seen as ‘confused’ and advised to focus on a single goal — an attitude that still pervades the Global 1000 and Wall Street.
But the consequences in banking were dire: ‘maximising shareholder value’ led to ‘bad profits’ (derived from activities such as price gouging, gaming the system, toll collection, zero-sum trading and extraordinary compensation) and then ‘illegal profits’ (from fixing libor, foreclosure abuses, money laundering, assisting tax evasion and deceiving clients).
The shareholder value theory has failed, because strategies designed to ‘maximise shareholder value’ have served to reduce shareholder value in the medium term. A study from deloitte shows that return on assets and return on investment capital have been in
steady decline since 1965. Firms are dying faster and faster: life expectancy of the firms in the Fortune 500 has fallen from around 75 years more than half a century ago to less than 15 years today. The study also found that employee engagement is low: only one in five workers is fully engaged in his or her work.
In 2009 Jack Welch, the legendary Ge boss, pointed out the conceptual error in shareholder value: “making money for the shareholders is the result, not the goal….maximising shareholder value is the dumbest idea in the world.”
maximising shareholder value has distracted banks from their true social purpose of creating financial
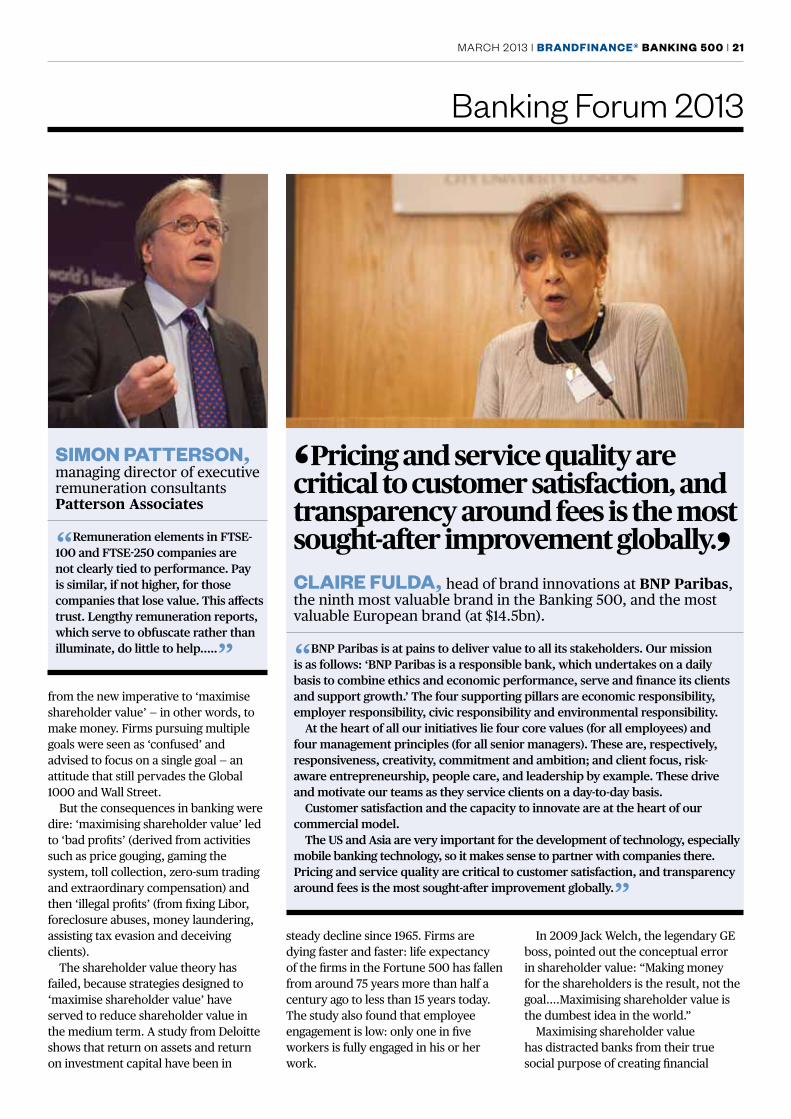
‘Pricing and service quality are critical to customer satisfaction, and transparency around fees is the most sought-after improvement globally.’claire Fulda, head of brand innovations at BNP Paribas, the ninth most valuable brand in the Banking 500, and the most valuable european brand (at $14.5bn).
“BNP Paribas is at pains to deliver value to all its stakeholders. Our mission is as follows: ‘BNP Paribas is a responsible bank, which undertakes on a daily basis to combine ethics and economic performance, serve and finance its clients and support growth.’ The four supporting pillars are economic responsibility, employer responsibility, civic responsibility and environmental responsibility.
At the heart of all our initiatives lie four core values (for all employees) and four management principles (for all senior managers). These are, respectively, responsiveness, creativity, commitment and ambition; and client focus, risk-aware entrepreneurship, people care, and leadership by example. These drive and motivate our teams as they service clients on a day-to-day basis.
Customer satisfaction and the capacity to innovate are at the heart of our commercial model.
The US and Asia are very important for the development of technology, especially mobile banking technology, so it makes sense to partner with companies there.Pricing and service quality are critical to customer satisfaction, and transparency around fees is the most sought-after improvement globally.”
simon paTTerson, managing director of executive remuneration consultants Patterson Associates
“Remuneration elements in FTSE-100 and FTSE-250 companies are not clearly tied to performance. Pay is similar, if not higher, for those companies that lose value. This affects trust. Lengthy remuneration reports, which serve to obfuscate rather than illuminate, do little to help…..”
22 | brandFinance® banking 500 | MARCH 2013
opportunities and reducing financial risk for an ever wider circle of citizens and enterprises.
However, a revolution is underway — even though it might not have reached the banks yet. Firms that are totally customer focused do make money — look at Apple. When Steve Jobs rejoined the almost bankrupt company in 1997 he decided to test the proposition on a large scale. most products clearly weren’t delighting customers and he sacked everyone who wasn’t sure what they were supposed to be doing or who didn’t feel what they did added value to customers. The new focus allowed Apple to reinvent a number of mature industries — music, mobile phones, computers — and create enormous value in the process.
In 2006 marc Benioff, Ceo of Californian business Salesforce (and described by Forbes in 2011 as ‘the most valuable man on the planet’), introduced a new approach: to identify the most important thing they could do to delight their customers and get the best people in the business to work on that exclusively
for a month. He repeated the exercise with the next and the next and the next priorities, and while many managerial positions disappeared in the process, the new approach meant that the firm was working 80 per cent of the time (rather than 20 per cent, as previously) on the most important things.
This approach is spreading to firms including Amazon, Costco, Starbucks, Southwest Airlines and Google, and the results speak for themselves. While the value of the Standard and Poor’s 500 rose by 51 per cent over ten years, Apple’s stock improved by 9,000 per cent, Amazon by 1,200 per cent, Salesforce by 950 per cent, Google by 740 per cent, and so on.
So clearly, the goal for leadership in banking has to move from ‘shareholder value, bad profits and illegal profits’, to ‘adding value to customers, customer-focused innovation and extraordinary sustained profits’.
To do this they need to rediscover their historical purpose and devote themselves totally to creating financial opportunities and reducing financial risk for an ever wider circle of citizens and enterprises. The focus of innovation must shift from finding new (and even unscrupulous) ways of making money for themselves, to helping their customers — and the possibilities of technology have only just begun to be exploited.
The regulators need to look to their leadership laurels too, because the Herculean effort to restore trust and confidence through regulation has failed, massively increasing the costs of banking without making the system any safer. The root cause of the 2008 meltdown was lack of transparency, but on that front nothing has changed. Witness this quote from a december 2012 article in the uS magazine Atlantic, headlined ‘What’s inside America’s banks’: ‘Banks today are bigger and more opaque than ever, and they continue to trade in derivatives in many of the same ways they did before the crash, but on a larger scale and with precisely the same unknown risks.’
You have to prevent derivate trading, not ring-fence it. ring-fencing secret trading is like ring-fencing an unsafe nuclear facility.”
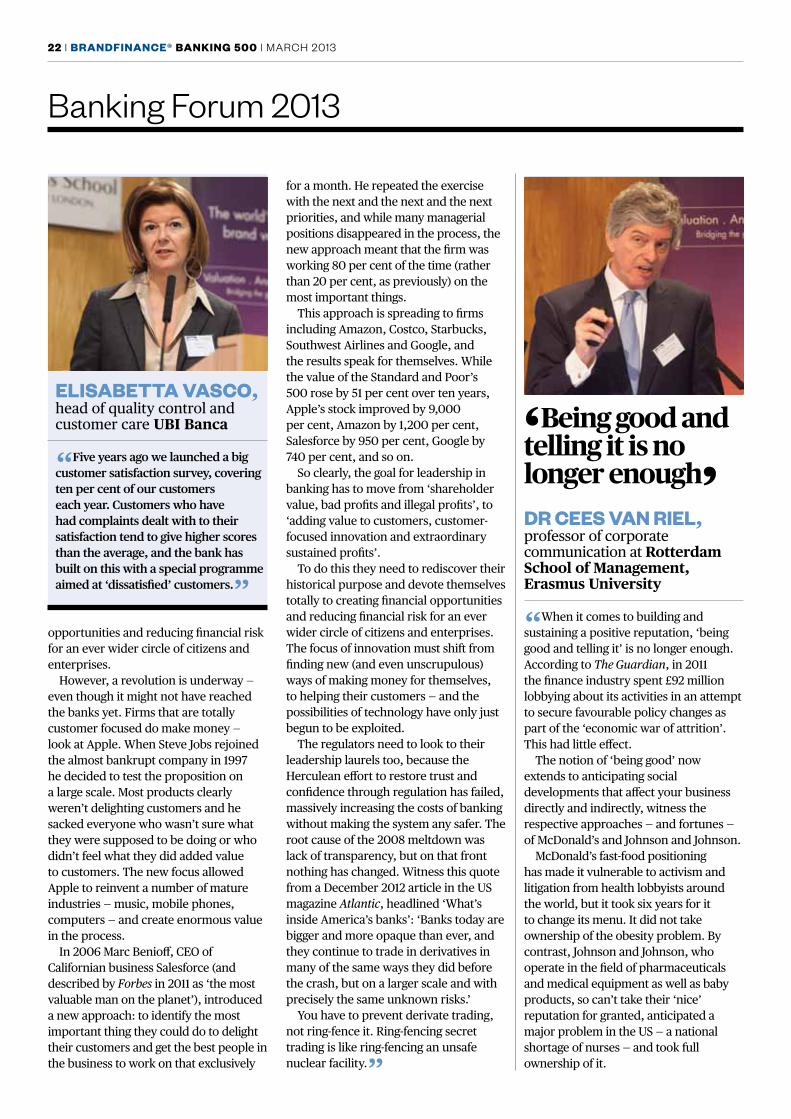
‘Being good and telling it is no longer enough’dr cees van riel, professor of corporate communication at Rotterdam School of Management, Erasmus University
“When it comes to building and sustaining a positive reputation, ‘being good and telling it’ is no longer enough. According to The Guardian, in 2011 the finance industry spent £92 million lobbying about its activities in an attempt to secure favourable policy changes as part of the ‘economic war of attrition’. This had little effect.
The notion of ‘being good’ now extends to anticipating social developments that affect your business directly and indirectly, witness the respective approaches — and fortunes — of mcdonald’s and Johnson and Johnson.
mcdonald’s fast-food positioning has made it vulnerable to activism and litigation from health lobbyists around the world, but it took six years for it to change its menu. It did not take ownership of the obesity problem. By contrast, Johnson and Johnson, who operate in the field of pharmaceuticals and medical equipment as well as baby products, so can’t take their ‘nice’ reputation for granted, anticipated a major problem in the uS — a national shortage of nurses — and took full ownership of it.
Banking Forum 2013
elisabeTTa vasco, head of quality control and customer care UBI Banca
“Five years ago we launched a big customer satisfaction survey, covering ten per cent of our customers each year. Customers who have had complaints dealt with to their satisfaction tend to give higher scores than the average, and the bank has built on this with a special programme aimed at ‘dissatisfied’ customers.”
MARCH 2013 | brandFinance® banking 500 | 23
They did a study, created a national database of vacancies, ran a compelling advertising campaign, and within 18 months there was no longer a shortage of nurses. Similarly, they set up a website and text helpline to help address another national problem: teenage pregnancies. These are examples of initiatives that create alignment and engagement inside and outside the organisation, and change society.
Johnson and Johnson’s approach is dramatically different from the dominant approach over recent years of banks (at least the biggest banks) seeking to benefit themselves at the expense of other stakeholders – primarily customers, but, ultimately, shareholders too.
Brands that do align and engage with their internal and external stakeholders build and sustain positive reputations. And brands with a largely positive reputation are much more resilient to reputational crises than those with a more negative reputation.”
Banking Forum 2013
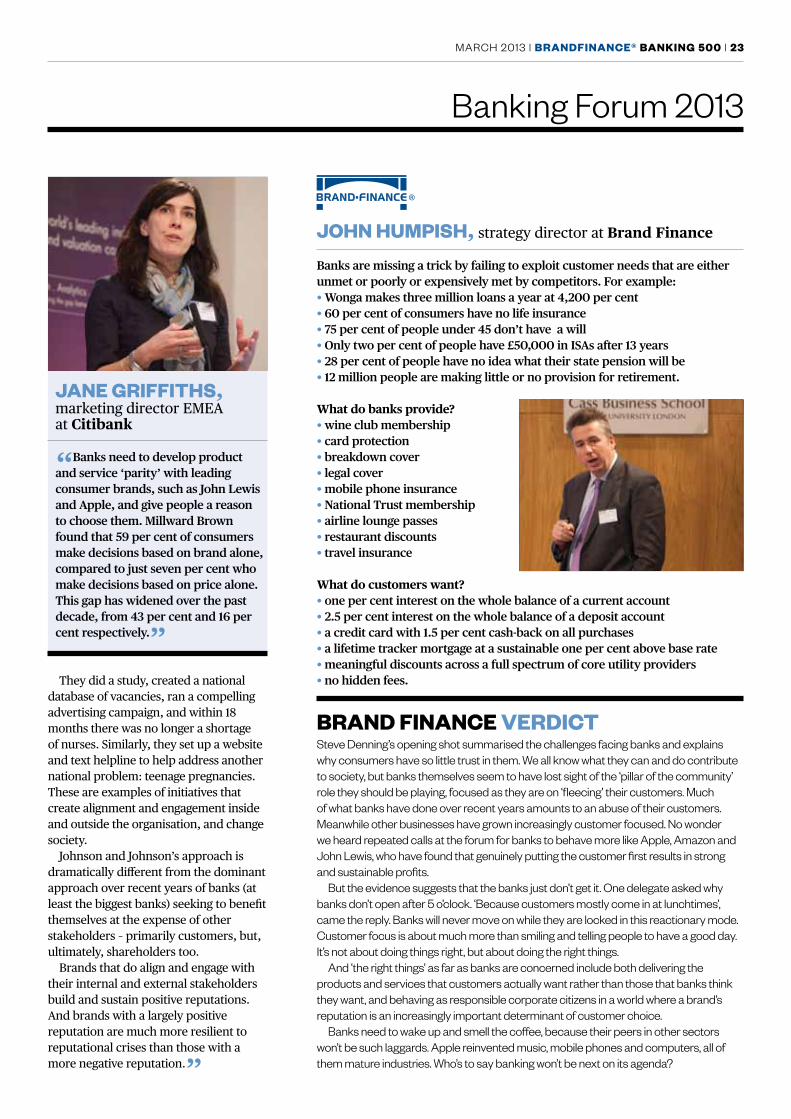
Jane griFFiThs, marketing director emeA at Citibank
“Banks need to develop product and service ‘parity’ with leading consumer brands, such as John Lewis and Apple, and give people a reason to choose them. Millward Brown found that 59 per cent of consumers make decisions based on brand alone, compared to just seven per cent who make decisions based on price alone. This gap has widened over the past decade, from 43 per cent and 16 per cent respectively.”
John humpish, strategy director at Brand Finance
Banks are missing a trick by failing to exploit customer needs that are either unmet or poorly or expensively met by competitors. For example:• Wonga makes three million loans a year at 4,200 per cent• 60 per cent of consumers have no life insurance• 75 per cent of people under 45 don’t have a will• Only two per cent of people have £50,000 in ISAs after 13 years• 28 per cent of people have no idea what their state pension will be• 12 million people are making little or no provision for retirement.
What do banks provide? • wine club membership• card protection• breakdown cover• legal cover• mobile phone insurance• National Trust membership• airline lounge passes• restaurant discounts• travel insurance
What do customers want?• one per cent interest on the whole balance of a current account• 2.5 per cent interest on the whole balance of a deposit account• a credit card with 1.5 per cent cash-back on all purchases• a lifetime tracker mortgage at a sustainable one per cent above base rate• meaningful discounts across a full spectrum of core utility providers• no hidden fees.
brand Finance verdicT Steve denning’s opening shot summarised the challenges facing banks and explains why consumers have so little trust in them. we all know what they can and do contribute to society, but banks themselves seem to have lost sight of the ‘pillar of the community’ role they should be playing, focused as they are on ‘fleecing’ their customers. Much of what banks have done over recent years amounts to an abuse of their customers. Meanwhile other businesses have grown increasingly customer focused. no wonder we heard repeated calls at the forum for banks to behave more like Apple, Amazon and John lewis, who have found that genuinely putting the customer first results in strong and sustainable profits.
But the evidence suggests that the banks just don’t get it. one delegate asked why banks don’t open after 5 o’clock. ‘Because customers mostly come in at lunchtimes’, came the reply. Banks will never move on while they are locked in this reactionary mode. Customer focus is about much more than smiling and telling people to have a good day. it’s not about doing things right, but about doing the right things.
And ‘the right things’ as far as banks are concerned include both delivering the products and services that customers actually want rather than those that banks think they want, and behaving as responsible corporate citizens in a world where a brand’s reputation is an increasingly important determinant of customer choice.
Banks need to wake up and smell the coffee, because their peers in other sectors won’t be such laggards. Apple reinvented music, mobile phones and computers, all of them mature industries. who’s to say banking won’t be next on its agenda?
24 | brandFinance® banking 500 | MARCH 2013
methodology
The steps in this process are:1. obtain brand-specific financial and
revenue data. The revenue is then segmented into the following revenue streams: retail banking, commercial banking, wholesale/investment banking, insurance, asset management and credit cards.
2. model the market to identify market demand and the position of individual banks in the context of all other market competitors.
Three forecast periods are used:• Estimated financial results for 2012
using Institutional Brokers estimate System (IBeS) consensus forecast.
• A five-year forecast period (2013 to 2017) based on three sources: IBeS, historic growth and gross domestic product (GdP) growth.
• Perpetuity growth based on a combination of growth expectations (GdP and IBeS).
3. establish the royalty rate for each bank by:• calculating brand strength on a scale
of zero to 100 according to a number of attributes, including asset strength, emotional connection, market share and profitability
• determining the royalty rate for each revenue stream mentioned in step one
• calculating the future royalty income stream.
4. Calculate the discount rate specific to each bank, taking account of its size, geographical presence, reputation, gearing and brand rating (see below).
5. discount future royalty stream (explicit forecast and perpetuity periods) to a net present value — the brand value.
royalty relief approachBrand Finance uses a ‘relief from royalty’ methodology that determines the value of the brand in relation to the royalty rate that would be payable for its use, were it owned by a third party. The royalty rate is applied to future revenue to determine an earnings stream that is attributable to the brand. The brand earnings stream is then discounted back to a net present value.
This approach is used for three reasons. 1. It is favoured by tax authorities and
the courts because it calculates brand values by reference to documented third-party transactions.
2. It can be done based on publicly available financial information.
3. It is compliant with the requirement under the International Valuation Standards Committee (IVSC) to determine Fair market Value of brands.
brand ratingsThese are calculated using Brand Finance’s ßrandßeta analysis, which benchmarks the strength, risk and potential of a brand relative to its competitors, on a scale from AAA to d. It is conceptually similar to a credit rating.
The data used to calculate the ratings comes from various sources including Bloomberg annual reports and Brand Finance research.
brand ratings definitionsAAA Extremely strongAA Very strongA StrongBBB-B AverageCCC-C Weakddd-d Failing
valuation dateAll brand values in this report are for the end of the year, 31st december 2012.
How do we value brands?Brand Finance employs a discounted cash flow technique to discount estimated future royalties at an appropriate rate to arrive at a net present value of a bank’s trademark and associated intellectual property — its brand value.
MARCH 2013 | brandFinance® banking 500 | 25
bespoke reports
what’s included?• 2013 brand valuation result• Competitive comparison• Brand strength analysis• Brand value calculation and
methodology• Valuation schedules and key
assumptions • Understanding changes in brand value• Trademark registration review• Observations and recommendations• Global results
Understanding the value of your own brandAre you interested in a detailed breakdown of how we have calculated the brand value of your company? Would you like to know where value is being generated within the business, and where you could generate more value? Brand Finance’s bespoke reports for clients provide a great insight into how to maximise the value of their brands.
key benefits• An understanding of how brand value
has been calculated in a simple and clear format that the brand team can digest and present to senior management
• An understanding of where value is being generated within the business
• Slides detailing the valuation schedule and key assumptions
• Year on year changes in brand value, and reasons
• A review of brand value against competitors
• Lots of great charts and tables for internal and external presentations
get in touch To speak to someone about your brand value please contact Vinoth Jayakumar.
+44 (0)20 7389 9400
All of Brand Finance’s league tables are published on brandirectory.com
90% of companies
that buy our reports do so on an annual
basis
26 | brandFinance® banking 500 | MARCH 2013
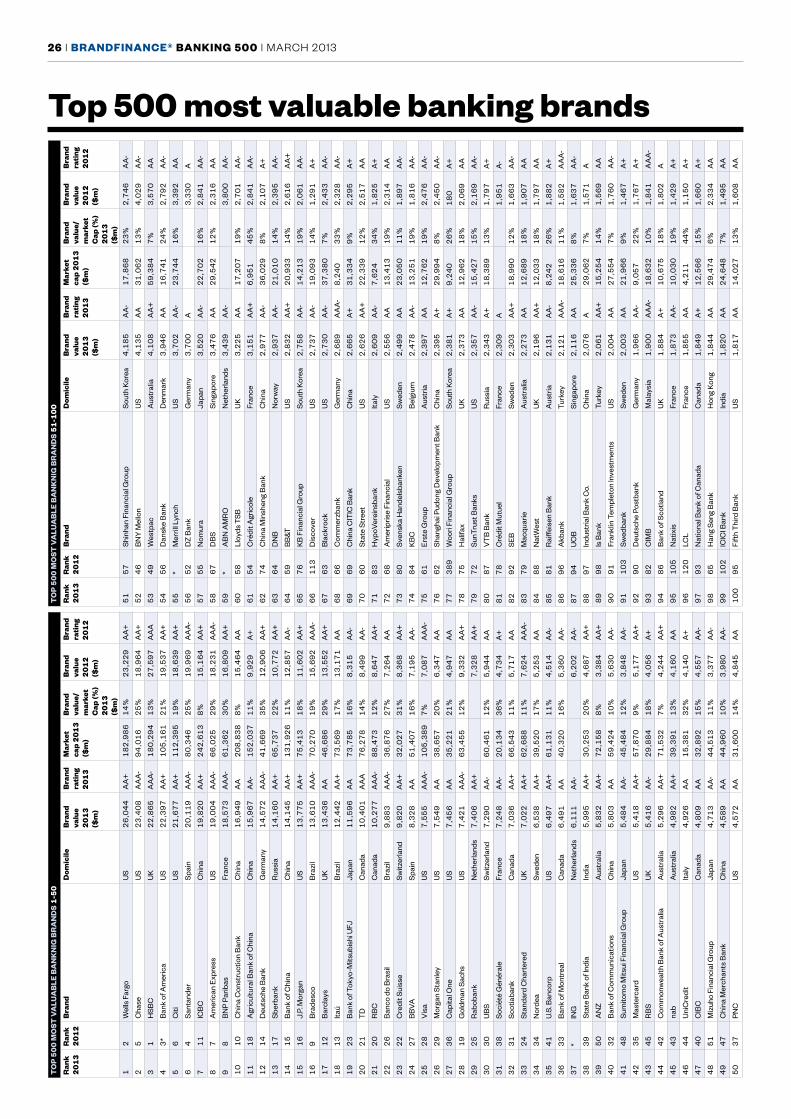
Top 500 most valuable banking brands
To
p 5
00
mo
sT v
alu
ab
le b
an
kn
ig b
ra
nd
s 1
-50
ran
k 2
01
3r
ank
20
12
bra
ndd
omic
ileb
rand
va
lue
20
13
($
m)
bra
nd
rati
ng
20
13
mar
ket
cap
20
13
($
m)
bra
nd
valu
e/
mar
ket
cap
(%)
20
13
($
m)
bra
nd
valu
e 2
01
2
($m
)
bra
nd
rati
ng
20
12
12
Wel
ls F
argo
US
26
,04
4A
A+
18
2,9
86
14
%2
3,2
29
AA
+
25
Cha
seU
S2
3,4
08
AA
A-
94
,01
62
5%
18
,96
4A
A+
31
HSB
CU
K2
2,8
65
AA
A-
18
0,2
94
13
%2
7,5
97
AA
A
43
*B
ank
of A
mer
ica
US
22
,39
7A
A+
10
5,1
61
21
%1
9,5
37
AA
+
56
Citi
US
21
,67
7A
A+
11
2,3
95
19
%1
8,6
39
AA
+
64
Sant
ande
rSp
ain
20
,11
9A
AA
-8
0,3
46
25
%1
9,9
69
AA
A-
71
1IC
BC
Chi
na1
9,8
20
AA
+2
42
,61
38
%1
5,1
64
AA
+
87
Am
eric
an E
xpre
ssU
S1
9,0
04
AA
A-
66
,02
52
9%
18
,23
1A
AA
-
98
BN
P Pa
ribas
Fran
ce1
8,5
73
AA
A-
61
,36
23
0%
16
,80
9A
A+
10
10
Chi
na C
onst
ruct
ion
Ban
kC
hina
16
,94
9A
A2
08
,83
88
%1
5,4
64
AA
11
18
Agr
icul
tura
l Ban
k of
Chi
naC
hina
15
,96
7A
A-
15
2,0
37
11
%9
,92
9A
+
12
14
Deu
tsch
e B
ank
Ger
man
y1
4,5
72
AA
A-
41
,66
93
5%
12
,90
6A
A+
13
17
Sber
bank
Rus
sia
14
,16
0A
A+
65
,73
72
2%
10
,77
2A
A+
14
15
Ban
k of
Chi
naC
hina
14
,14
5A
A+
13
1,9
26
11
%1
2,8
57
AA
-
15
16
J.P.
Mor
gan
US
13
,77
5A
A+
75
,41
31
8%
11
,60
2A
A+
16
9B
rade
sco
Bra
zil
13
,61
0A
AA
-7
0,2
70
19
%1
5,6
92
AA
A-
17
12
Bar
clay
s U
K1
3,4
36
AA
46
,68
62
9%
13
,55
2A
A+
18
13
Itaú
Bra
zil
12
,44
2A
A+
73
,56
91
7%
13
,17
1A
A
19
23
Ban
k of
Tok
yo-M
itsub
ishi
UFJ
Japa
n1
1,5
96
AA
73
,78
51
6%
8,3
15
AA
-
20
21
TD
Can
ada
10
,40
1A
AA
76
,27
81
4%
8,4
99
AA
-
21
20
RB
CC
anad
a1
0,2
77
AA
A-
88
,47
31
2%
8,6
47
AA
+
22
26
Ban
co d
o B
rasi
lB
razi
l9
,88
3A
AA
-3
6,8
76
27
%7
,26
4A
A
23
22
Cre
dit S
uiss
eSw
itzer
land
9,8
20
AA
+3
2,0
27
31
%8
,36
8A
A+
24
27
BB
VA
Spai
n8
,32
8A
A5
1,4
07
16
%7
,19
5A
A-
25
28
Vis
aU
S7
,55
5A
AA
-1
05
,38
97
%7
,08
7A
AA
-
26
29
Mor
gan
Stan
ley
US
7,5
49
AA
38
,65
72
0%
6,3
47
AA
27
36
Cap
ital O
neU
S7
,45
6A
A3
5,2
21
21
%4
,94
7A
A
28
19
Gol
dman
Sac
hsU
S7
,42
1A
AA
-6
3,4
55
12
%9
,33
2A
A+
29
25
Rab
oban
kN
ethe
rland
s7
,40
6A
A+
7,3
28
AA
+
30
30
UB
SSw
itzer
land
7,2
90
AA
-6
0,4
61
12
%5
,94
4A
A
31
38
Soc
iété
Gén
éral
eFr
ance
7,2
48
AA
-2
0,1
34
36
%4
,73
4A
+
32
31
Sco
tiaba
nkC
anad
a7
,03
6A
A+
66
,54
31
1%
5,7
17
AA
33
24
Stan
dard
Cha
rter
edU
K7
,02
2A
A+
62
,68
81
1%
7,6
24
AA
A-
34
34
Nor
dea
Swed
en6
,53
8A
A+
39
,52
01
7%
5,2
53
AA
35
41
U.S
. Ban
corp
US
6,4
97
AA
+6
1,1
31
11
%4
,51
4A
A-
36
33
Ban
k of
Mon
trea
lC
anad
a6
,49
1A
A4
0,3
20
16
%5
,36
0A
A-
37
*IN
GN
ethe
rland
s6
,11
1A
A-
6,2
02
AA
-
38
39
Stat
e B
ank
of In
dia
Indi
a5
,99
5A
A+
30
,25
32
0%
4,6
87
AA
+
39
50
AN
ZA
ustr
alia
5,8
32
AA
+7
2,1
58
8%
3,3
84
AA
+
40
32
Ban
k of
Com
mun
icat
ions
Chi
na5
,80
3A
A5
9,4
24
10
%5
,63
0A
A-
41
48
Sum
itom
o M
itsui
Fin
anci
al G
roup
Japa
n5
,48
4A
A-
45
,48
41
2%
3,8
48
AA
-
42
35
Mas
terc
ard
US
5,4
18
AA
+5
7,8
70
9%
5,1
77
AA
+
43
45
RB
SU
K5
,41
6A
A-
29
,88
41
8%
4,0
56
A+
44
42
Com
mon
wea
lth B
ank
of A
ustr
alia
Aus
tral
ia5
,29
6A
A+
71
,53
27
%4
,24
4A
A+
45
43
nab
Aus
tral
ia4
,98
2A
A+
39
,39
11
3%
4,1
60
AA
46
44
Uni
Cre
dit
Italy
4,9
26
AA
15
,38
13
2%
4,1
40
A+
47
40
CIB
CC
anad
a4
,80
9A
A3
2,8
92
15
%4
,55
7A
A-
48
51
Miz
uho
Fina
ncia
l Gro
upJa
pan
4,7
13
AA
-4
4,5
13
11
%3
,37
7A
A-
49
47
Chi
na M
erch
ants
Ban
k C
hina
4,5
89
AA
44
,96
01
0%
3,9
80
AA
-
50
37
PNC
US
4,5
72
AA
31
,60
01
4%
4,8
45
AA
To
p 5
00
mo
sT v
alu
ab
le b
an
kn
ig b
ra
nd
s 5
1-1
00
ran
k 2
01
3r
ank
20
12
bra
ndd
omic
ileb
rand
va
lue
20
13
($
m)
bra
nd
rati
ng
20
13
mar
ket
cap
20
13
($
m)
bra
nd
valu
e/
mar
ket
cap
(%)
20
13
($
m)
bra
nd
valu
e 2
01
2
($m
)
bra
nd
rati
ng
20
12
51
57
Shin
han
Fina
ncia
l Gro
upS
outh
Kor
ea4
,18
5A
A-
17
,86
82
3%
2,7
46
AA
-
52
46
BN
Y M
ello
nU
S4
,13
5A
A3
1,0
62
13
%4
,02
9A
A-
53
49
Wes
tpac
Aus
tral
ia4
,10
8A
A+
59
,38
47
%3
,57
0A
A
54
56
Dan
ske
Ban
kD
enm
ark
3,9
46
AA
16
,74
12
4%
2,7
92
AA
-
55
*M
erril
l Lyn
chU
S3
,70
2A
A-
23
,74
41
6%
3,3
92
AA
56
52
DZ
Ban
kG
erm
any
3,7
00
A3
,33
0A
57
55
Nom
ura
Japa
n3
,52
0A
A-
22
,70
21
6%
2,8
41
AA
-
58
67
DB
SSi
ngap
ore
3,4
76
AA
29
,54
21
2%
2,3
16
AA
59
*A
BN
AM
RO
Net
herla
nds
3,4
39
AA
-3
,80
0A
A-
60
58
Lloy
ds T
SBU
K3
,22
5A
A1
7,2
07
19
%2
,70
1A
A-
61
54
Cré
dit A
gric
ole
Fran
ce3
,15
1A
A+
6,9
51
45
%2
,84
1A
A-
62
74
Chi
na M
insh
eng
Ban
kC
hina
2,9
77
AA
-3
6,0
29
8%
2,1
07
A+
63
64
DN
BN
orw
ay2
,93
7A
A-
21
,01
01
4%
2,3
95
AA
-
64
59
BB
&TU
S2
,83
2A
A+
20
,93
31
4%
2,6
16
AA
+
65
76
KB
Fin
anci
al G
roup
Sou
th K
orea
2,7
58
AA
-1
4,2
13
19
%2
,06
1A
A-
66
11
3D
isco
ver
US
2,7
37
AA
-1
9,0
93
14
%1
,29
1A
+
67
63
Bla
ckro
ckU
S2
,73
0A
A-
37
,38
07
%2
,43
3A
A-
68
66
Com
mer
zban
kG
erm
any
2,6
89
AA
A-
8,2
40
33
%2
,32
8A
A-
69
69
Chi
na C
ITIC
Ban
kC
hina
2,6
65
A+
31
,33
49
%2
,29
5A
+
70
60
Stat
e St
reet
US
2,6
26
AA
+2
2,3
39
12
%2
,51
7A
A
71
83
Hyp
oVer
eins
bank
Italy
2,6
09
AA
-7
,62
43
4%
1,8
25
A+
72
68
Am
erip
rise
Fina
ncia
lU
S2
,55
6A
A1
3,4
13
19
%2
,31
4A
A
73
80
Sven
ska
Han
dels
bank
enSw
eden
2,4
99
AA
23
,05
01
1%
1,8
97
AA
-
74
84
KB
CB
elgi
um2
,47
8A
A-
13
,25
11
9%
1,8
16
AA
-
75
61
Erst
e G
roup
Aus
tria
2,3
97
AA
12
,76
21
9%
2,4
76
AA
-
76
62
Shan
ghai
Pud
ong
Dev
elop
men
t Ban
kC
hina
2,3
95
A+
29
,99
48
%2
,45
0A
A-
77
38
9W
oori
Fina
ncia
l Gro
upS
outh
Kor
ea2
,38
1A
+9
,24
02
6%
18
0A
+
78
75
Hal
ifax
UK
2,3
73
AA
12
,96
21
8%
2,0
69
AA
79
72
SunT
rust
Ban
ksU
S2
,35
7A
A-
15
,42
71
5%
2,1
69
AA
-
80
87
VT
B B
ank
Rus
sia
2,3
43
A+
18
,38
91
3%
1,7
97
A+
81
78
Cré
dit M
utue
lFr
ance
2,3
09
A1
,95
1A
-
82
92
SEB
Swed
en2
,30
3A
A+
18
,99
01
2%
1,6
63
AA
-
83
79
Mac
quar
ieA
ustr
alia
2,2
73
AA
12
,68
91
8%
1,9
07
AA
84
88
Nat
Wes
tU
K2
,19
6A
A+
12
,03
31
8%
1,7
97
AA
85
81
Rai
ffeis
en B
ank
Aus
tria
2,1
31
AA
-8
,24
22
6%
1,8
82
A+
86
96
Akb
ank
Turk
ey2
,12
1A
AA
-1
8,6
16
11
%1
,58
2A
AA
-
87
94
UO
BSi
ngap
ore
2,1
16
AA
25
,33
68
%1
,63
7A
A-
88
97
Indu
stria
l Ban
k C
o.C
hina
2,0
76
A2
9,0
62
7%
1,5
71
A
89
98
Is B
ank
Turk
ey2
,06
1A
A+
15
,25
41
4%
1,5
69
AA
90
91
Fran
klin
Tem
plet
on In
vest
men
tsU
S2
,00
4A
A2
7,5
54
7%
1,7
60
AA
-
91
10
3Sw
edba
nkSw
eden
2,0
03
AA
21
,96
69
%1
,46
7A
+
92
90
Deu
tsch
e Po
stba
nkG
erm
any
1,9
66
AA
-9
,05
72
2%
1,7
67
A+
93
82
CIM
BM
alay
sia
1,9
00
AA
A-
18
,63
21
0%
1,8
41
AA
A-
94
86
Ban
k of
Sco
tland
UK
1,8
84
A+
10
,67
51
8%
1,8
02
A
95
10
5N
atix
isFr
ance
1,8
73
AA
-1
0,0
30
19
%1
,42
9A
+
96
12
0LC
LFr
ance
1,8
55
AA
4,2
11
44
%1
,15
0A
+
97
93
Nat
iona
l Ban
k of
Can
ada
Can
ada
1,8
49
A+
12
,56
61
5%
1,6
60
A+
98
65
Han
g S
eng
Ban
kH
ong
Kon
g1
,84
4A
A2
9,4
74
6%
2,3
34
AA
99
10
2IC
ICI B
ank
Indi
a1
,82
0A
A2
4,6
48
7%
1,4
95
AA
10
09
5Fi
fth
Thi
rd B
ank
US
1,8
17
AA
14
,02
71
3%
1,6
08
AA
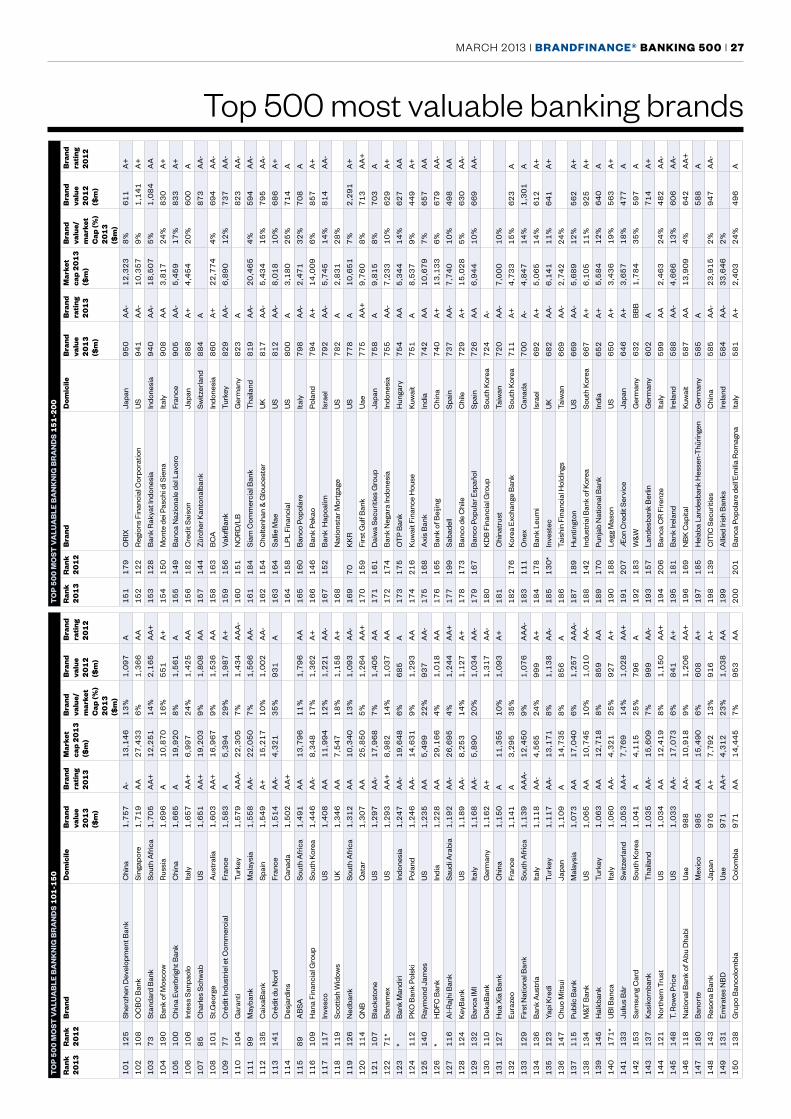
MARCH 2013 | brandFinance® banking 500 | 27
Top 500 most valuable banking brands
To
p 5
00
mo
sT v
alu
ab
le b
an
kn
ig b
ra
nd
s 1
01
-15
0
ran
k 2
01
3r
ank
20
12
bra
ndd
omic
ileb
rand
va
lue
20
13
($
m)
bra
nd
rati
ng
20
13
mar
ket
cap
20
13
($
m)
bra
nd
valu
e/
mar
ket
cap
(%)
20
13
($
m)
bra
nd
valu
e 2
01
2
($m
)
bra
nd
rati
ng
20
12
10
11
25
Shen
zhen
Dev
elop
men
t Ban
kC
hina
1,7
57
A-
13
,14
61
3%
1,0
97
A
10
21
08
OC
BC
Ban
kSi
ngap
ore
1,7
19
AA
27
,43
36
%1
,36
6A
A
10
37
3St
anda
rd B
ank
Sou
th A
fric
a1
,70
5A
A+
12
,25
11
4%
2,1
65
AA
+
10
41
90
Ban
k of
Mos
cow
Rus
sia
1,6
96
A1
0,8
70
16
%5
51
A+
10
51
00
Chi
na E
verb
right
Ban
kC
hina
1,6
65
A1
9,9
20
8%
1,5
61
A
10
61
06
Inte
sa S
anpa
olo
Italy
1,6
57
AA
+6
,99
72
4%
1,4
25
AA
10
78
5C
harle
s S
chw
abU
S1
,65
1A
A+
19
,20
39
%1
,80
8A
A
10
81
01
St.G
eorg
eA
ustr
alia
1,6
03
AA
+1
6,9
67
9%
1,5
36
AA
10
97
7C
rédi
t Ind
ustr
iel e
t Com
mer
cial
Fran
ce1
,58
3A
5,3
94
29
%1
,98
7A
+
11
01
04
Gar
anti
Turk
ey1
,57
9A
AA
-2
2,3
05
7%
1,4
34
AA
A-
11
19
9M
ayba
nkM
alay
sia
1,5
58
AA
-2
2,0
50
7%
1,5
66
AA
-
11
21
35
Cai
xaB
ank
Spai
n1
,54
9A
+1
5,2
17
10
%1
,00
2A
A-
11
31
41
Cré
dit d
u N
ord
Fran
ce1
,51
4A
A-
4,3
21
35
%9
31
A
11
4D
esja
rdin
sC
anad
a1
,50
2A
A+
11
58
9A
BSA
Sou
th A
fric
a1
,49
1A
A1
3,7
96
11
%1
,79
6A
A
11
61
09
Han
a Fi
nanc
ial G
roup
S
outh
Kor
ea1
,44
6A
A-
8,3
48
17
%1
,36
2A
+
11
71
17
Inve
sco
US
1,4
08
AA
11
,99
41
2%
1,2
21
AA
-
11
81
19
Sco
ttis
h W
idow
sU
K1
,34
6A
A7
,54
71
8%
1,1
58
A+
11
91
26
Ned
bank
Sou
th A
fric
a1
,31
2A
A1
0,3
40
13
%1
,09
3A
A-
12
01
14
QN
BQ
atar
1,3
07
AA
25
,85
05
%1
,26
4A
A+
12
11
07
Bla
ckst
one
US
1,2
97
AA
-1
7,9
68
7%
1,4
05
AA
12
27
1*
Ban
amex
US
1,2
93
AA
+8
,98
21
4%
1,0
37
AA
12
3*
Ban
k M
andi
riIn
done
sia
1,2
47
AA
-1
9,6
48
6%
68
5A
12
41
12
PKO
Ban
k Po
lski
Pola
nd1
,24
6A
A-
14
,63
19
%1
,29
3A
A
12
51
40
Ray
mon
d Ja
mes
US
1,2
35
AA
5,4
99
22
%9
37
AA
-
12
6*
HD
FC B
ank
Indi
a1
,22
8A
A2
9,1
66
4%
1,0
18
AA
12
71
16
Al-R
ajhi
Ban
kSa
udi A
rabi
a1
,19
2A
A-
26
,69
54
%1
,24
4A
A+
12
81
24
Key
Ban
kU
S1
,18
9A
A-
8,2
53
14
%1
,12
7A
+
12
91
32
Ban
ca IM
IIta
ly1
,16
8A
A-
5,8
90
20
%1
,03
4A
A-
13
01
10
Dek
aBan
kG
erm
any
1,1
62
A+
1,3
17
AA
-
13
11
27
Hua
Xia
Ban
kC
hina
1,1
50
A1
1,3
55
10
%1
,09
3A
+
13
2Eu
raze
oFr
ance
1,1
41
A3
,29
53
5%
13
31
29
Firs
t Nat
iona
l Ban
kS
outh
Afr
ica
1,1
39
AA
A-
12
,45
09
%1
,07
6A
AA
-
13
41
36
Ban
k A
ustr
iaIta
ly1
,11
8A
A-
4,5
65
24
%9
99
A+
13
51
23
Yapi
Kre
di
Turk
ey1
,11
7A
A-
13
,17
18
%1
,13
8A
A-
13
61
47
Chu
o M
itsui
Japa
n1
,10
9A
14
,73
58
%8
56
A
13
71
15
Publ
ic B
ank
Mal
aysi
a1
,07
3A
A1
7,0
40
6%
1,2
57
AA
A-
13
81
34
M&T
Ban
k U
S1
,06
5A
A1
0,7
45
10
%1
,01
0A
A-
13
91
45
Hal
kban
kTu
rkey
1,0
63
AA
12
,71
88
%8
59
AA
14
01
71
*U
BI B
anca
Italy
1,0
60
AA
-4
,32
12
5%
92
7A
+
14
11
33
Juliu
s B
ärSw
itzer
land
1,0
53
AA
+7
,76
91
4%
1,0
28
AA
+
14
21
53
Sam
sung
Car
dS
outh
Kor
ea1
,04
1A
4,1
15
25
%7
96
A
14
31
37
Kas
ikor
nban
kT
haila
nd1
,03
5A
A-
15
,60
97
%9
99
AA
-
14
41
21
Nor
ther
n Tr
ust
US
1,0
34
AA
12
,41
98
%1
,15
0A
A+
14
51
48
T. R
owe
Pric
eU
S1
,03
3A
A-
17
,07
36
%8
41
A+
14
61
18
Nat
iona
l Ban
k of
Abu
Dha
biU
ae9
88
AA
-1
0,9
18
9%
1,2
06
AA
+
14
71
80
Ban
orte
Mex
ico
98
5A
A1
5,4
90
6%
60
8A
+
14
81
43
Res
ona
Ban
kJa
pan
97
6A
+7
,79
21
3%
91
6A
+
14
91
31
Emira
tes
NB
DU
ae9
71
AA
+4
,31
22
3%
1,0
38
AA
15
01
38
Gru
po B
anco
lom
bia
Col
ombi
a9
71
AA
14
,44
57
%9
53
AA
To
p 5
00
mo
sT v
alu
ab
le b
an
kn
ig b
ra
nd
s 1
51
-20
0
ran
k 2
01
3r
ank
20
12
bra
ndd
omic
ileb
rand
va
lue
20
13
($
m)
bra
nd
rati
ng
20
13
mar
ket
cap
20
13
($
m)
bra
nd
valu
e/
mar
ket
cap
(%)
20
13
($
m)
bra
nd
valu
e 2
01
2
($m
)
bra
nd
rati
ng
20
12
15
11
79
OR
IXJa
pan
95
0A
A-
12
,32
38
%6
11
A+
15
21
22
Reg
ions
Fin
anci
al C
orpo
ratio
nU
S9
41
AA
-1
0,3
57
9%
1,1
41
A+
15
31
28
Ban
k R
akya
t Ind
ones
iaIn
done
sia
94
0A
A-
18
,50
75
%1
,08
4A
A
15
41
50
Mon
te d
ei P
asch
i di S
iena
Italy
90
8A
A3
,81
72
4%
83
0A
+
15
51
49
Ban
ca N
azio
nale
del
Lav
oro
Fran
ce9
05
AA
-5
,45
91
7%
83
3A
+
15
61
82
Cre
dit S
aiso
nJa
pan
88
8A
+4
,45
42
0%
60
0A
15
71
44
Zürc
her K
anto
nalb
ank
Switz
erla
nd8
84
A8
73
AA
-
15
81
63
BC
AIn
done
sia
86
0A
+2
2,7
74
4%
69
4A
A-
15
91
56
Vakı
fBan
kTu
rkey
82
9A
A-
6,8
90
12
%7
37
AA
-
16
01
51
NO
RD
/LB
Ger
man
y8
23
A8
23
AA
-
16
11
84
Siam
Com
mer
cial
Ban
kT
haila
nd8
19
AA
-2
0,4
65
4%
59
4A
A-
16
21
54
Che
ltenh
an &
Glo
uces
ter
UK
81
7A
A-
5,4
34
15
%7
95
AA
-
16
31
64
Salli
e M
aeU
S8
12
AA
-8
,01
81
0%
68
6A
+
16
41
58
LPL
Fina
ncia
lU
S8
00
A3
,18
02
5%
71
4A
16
51
60
Ban
co P
opol
are
Italy
79
8A
A-
2,4
71
32
%7
08
A
16
61
46
Ban
k Pe
kao
Pola
nd7
94
A+
14
,00
96
%8
57
A+
16
71
52
Ban
k H
apoa
limIs
rael
79
2A
A-
5,7
45
14
%8
14
AA
-
16
8N
atio
nsta
r Mor
tgag
eU
S7
82
A2
,83
12
8%
16
97
0K
KR
US
77
8A
10
,65
17
%2
,29
1A
+
17
01
59
Firs
t Gul
f Ban
kU
ae7
75
AA
+9
,76
08
%7
13
AA
+
17
11
61
Dai
wa
Sec
uriti
es G
roup
Japa
n7
58
A9
,81
58
%7
03
A
17
21
74
Ban
k N
egar
a In
done
sia
Indo
nesi
a7
55
AA
-7
,23
31
0%
62
9A
+
17
31
75
OT
P B
ank
Hun
gary
75
4A
A5
,34
41
4%
62
7A
A
17
42
16
Kuw
ait F
inan
ce H
ouse
Kuw
ait
75
1A
8,5
37
9%
44
9A
+
17
51
68
Axi
s B
ank
Indi
a7
42
AA
10
,67
97
%6
57
AA
17
61
65
Ban
k of
Bei
jing
Chi
na7
40
A+
13
,13
36
%6
79
AA
-
17
71
99
Saba
dell
Spai
n7
37
AA
-7
,74
01
0%
49
8A
A
17
81
73
Ban
co d
e C
hile
Chi
le7
29
A+
15
,02
85
%6
30
AA
-
17
91
67
Ban
co P
opul
ar E
spañ
olSp
ain
72
6A
A6
,94
41
0%
66
9A
A-
18
0K
DB
Fin
anci
al G
roup
Sou
th K
orea
72
4A
-
18
1C
hina
trus
tTa
iwan
72
0A
A-
7,0
00
10
%
18
21
76
Kor
ea E
xcha
nge
Ban
kS
outh
Kor
ea7
11
A+
4,7
33
15
%6
23
A
18
31
11
One
x C
anad
a7
00
A-
4,8
47
14
%1
,30
1A
18
41
78
Ban
k Le
umi
Isra
el6
92
A+
5,0
65
14
%6
12
A+
18
51
30
*In
vest
ecU
K6
82
AA
-6
,14
11
1%
64
1A
+
18
6Ta
ishi
n Fi
nanc
ial H
oldi
ngs
Taiw
an6
69
AA
-2
,74
22
4%
18
71
89
Hun
tingt
onU
S6
69
AA
-5
,68
91
2%
56
2A
+
18
81
42
Indu
stria
l Ban
k of
Kor
eaS
outh
Kor
ea6
67
A+
6,1
05
11
%9
25
A+
18
91
70
Punj
ab N
atio
nal B
ank
Indi
a6
52
A+
5,5
84
12
%6
40
A
19
01
88
Legg
Mas
on
US
65
0A
+3
,43
61
9%
56
3A
+
19
12
07
Æon
Cre
dit S
ervi
ceJa
pan
64
6A
+3
,65
71
8%
47
7A
19
21
83
W&
WG
erm
any
63
2B
BB
1,7
84
35
%5
97
A
19
31
57
Land
esba
nk B
erlin
Ger
man
y6
02
A7
14
A+
19
42
06
Ban
ca C
R F
irenz
eIta
ly5
99
AA
2,4
63
24
%4
82
AA
-
19
51
81
Ban
k Ire
land
Irela
nd5
88
AA
-4
,66
61
3%
60
6A
A-
19
61
69
NB
K C
apita
lK
uwai
t5
87
AA
13
,90
94
%6
42
AA
+
19
71
85
Hel
aba
Land
esba
nk H
esse
n-T
hürin
gen
Ger
man
y5
85
A5
88
A
19
81
39
CIT
IC S
ecur
ities
Chi
na5
85
AA
-2
3,9
15
2%
94
7A
A-
19
9A
llied
Iris
h B
anks
Irela
nd5
84
AA
-3
3,6
46
2%
20
02
01
Ban
ca P
opol
are
dell’
Emili
a R
omag
naIta
ly5
81
A+
2,4
03
24
%4
96
A
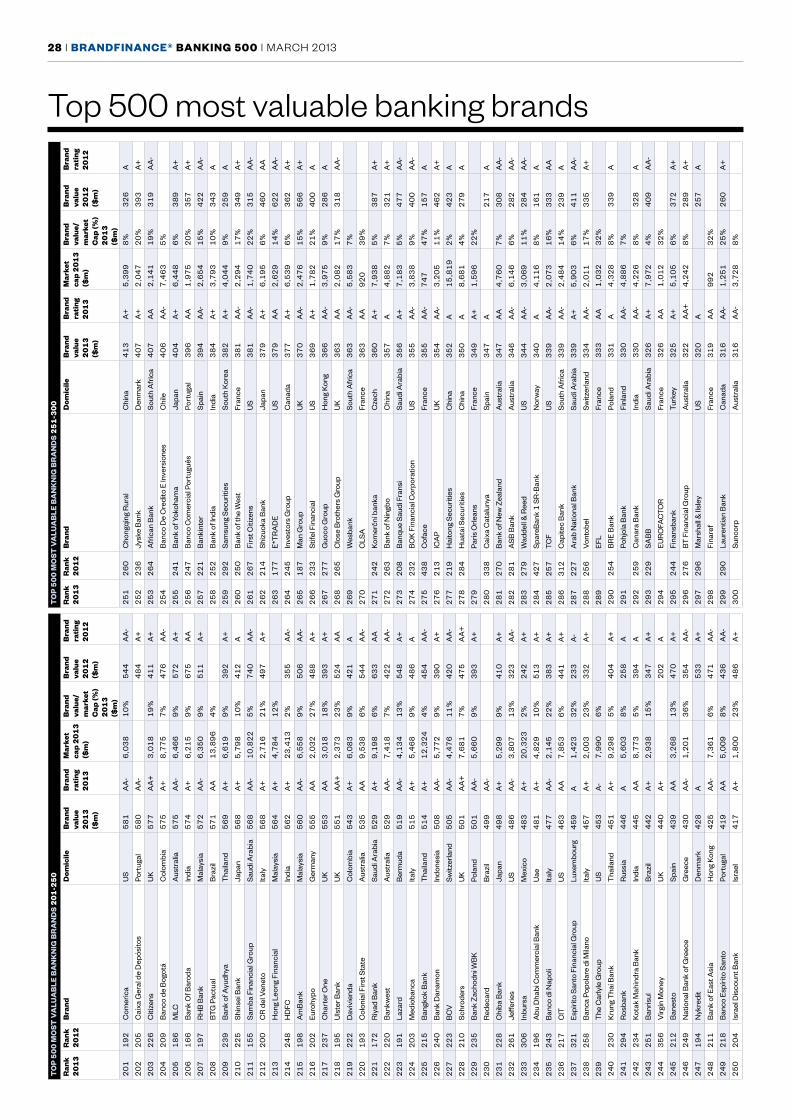
28 | brandFinance® banking 500 | MARCH 2013T
op
50
0 m
osT
va
lua
ble
ba
nk
nig
br
an
ds
20
1-2
50
ran
k 2
01
3r
ank
20
12
bra
ndd
omic
ileb
rand
va
lue
20
13
($
m)
bra
nd
rati
ng
20
13
mar
ket
cap
20
13
($
m)
bra
nd
valu
e/
mar
ket
cap
(%)
20
13
($
m)
bra
nd
valu
e 2
01
2
($m
)
bra
nd
rati
ng
20
12
20
11
92
Com
eric
aU
S5
81
AA
-6
,03
81
0%
54
4A
A-
20
22
05
Cai
xa G
eral
de
Dep
ósito
sPo
rtug
al5
80
AA
-4
84
A+
20
32
26
Citi
zens
UK
57
7A
A+
3,0
18
19
%4
11
A+
20
42
09
Ban
co d
e B
ogot
áC
olom
bia
57
5A
+8
,77
57
%4
76
AA
-
20
51
86
MLC
A
ustr
alia
57
5A
A-
6,4
66
9%
57
2A
+
20
61
66
Ban
k O
f Bar
oda
Indi
a5
74
A+
6,2
15
9%
67
5A
A
20
71
97
RH
B B
ank
Mal
aysi
a5
72
AA
-6
,35
09
%5
11
A+
20
8B
TG P
actu
alB
razi
l5
71
AA
13
,89
64
%
20
92
39
Ban
k of
Ayu
dhya
Tha
iland
56
9A
+6
,61
99
%3
92
A+
21
02
25
Shin
sei B
ank
Japa
n5
68
A+
5,7
98
10
%4
12
A
21
11
55
Sam
ba F
inan
cial
Gro
upSa
udi A
rabi
a5
68
AA
-1
0,8
22
5%
74
0A
A-
21
22
00
CR
del
Ven
eto
Italy
56
8A
+2
,71
62
1%
49
7A
+
21
3H
ong
Leon
g Fi
nanc
ial
Mal
aysi
a5
64
A+
4,7
84
12
%
21
42
48
HD
FCIn
dia
56
2A
+2
3,4
13
2%
35
5A
A-
21
51
98
Am
Ban
kM
alay
sia
56
0A
A-
6,5
58
9%
50
6A
A-
21
62
02
Euro
hypo
Ger
man
y5
55
AA
2,0
32
27
%4
88
A+
21
72
37
Cha
rter
One
UK
55
3A
A3
,01
81
8%
39
3A
+
21
81
95
Uls
ter B
ank
UK
55
1A
A+
2,3
73
23
%5
24
AA
21
92
22
Dav
ivie
nda
Col
ombi
a5
43
A+
6,0
83
9%
42
1A
22
01
93
Col
onia
l Firs
t Sta
teA
ustr
alia
53
5A
A9
,53
86
%5
44
AA
-
22
11
72
Riy
ad B
ank
Saud
i Ara
bia
52
9A
+9
,19
86
%6
33
AA
22
22
20
Ban
kwes
tA
ustr
alia
52
9A
A-
7,4
18
7%
42
2A
A-
22
31
91
Laza
rdB
erm
uda
51
9A
A-
4,1
34
13
%5
48
A+
22
42
03
Med
ioba
nca
Italy
51
5A
+5
,46
89
%4
86
A
22
52
15
Ban
gkok
Ban
kT
haila
nd5
14
A+
12
,32
44
%4
54
AA
-
22
62
40
Ban
k D
anam
onIn
done
sia
50
8A
A-
5,7
72
9%
39
0A
+
22
72
23
BC
VSw
itzer
land
50
5A
A-
4,4
76
11
%4
20
AA
-
22
82
10
Sch
rode
rsU
K5
01
AA
+7
,68
17
%4
75
AA
+
22
92
35
Ban
k Za
chod
ni W
BK
Pola
nd5
01
AA
-5
,66
09
%3
93
A+
23
0R
edec
ard
Bra
zil
49
9A
A-
23
12
28
Chi
ba B
ank
Japa
n4
98
A+
5,2
99
9%
41
0A
+
23
22
61
Jeffe
ries
US
48
6A
A-
3,8
07
13
%3
23
AA
-
23
33
06
Inbu
rsa
Mex
ico
48
3A
+2
0,3
23
2%
24
2A
+
23
41
96
Abu
Dha
bi C
omm
erci
al B
ank
Uae
48
1A
+4
,82
91
0%
51
3A
+
23
52
43
Ban
co d
i Nap
oli
Italy
47
7A
A-
2,1
45
22
%3
83
A+
23
62
17
CIT
US
46
3A
A7
,85
36
%4
41
A+
23
73
21
Espi
rito
Sant
o Fi
nanc
ial G
roup
Luxe
mbo
urg
45
9A
1,4
23
32
%2
33
A-
23
82
58
Ban
ca P
opol
are
di M
ilano
Italy
45
7A
+2
,00
32
3%
33
2A
+
23
9T
he C
arly
le G
roup
US
45
3A
-7
,99
06
%
24
02
30
Kru
ng T
hai B
ank
Tha
iland
45
1A
+9
,29
85
%4
04
A+
24
12
94
Ros
bank
Rus
sia
44
6A
5,6
03
8%
25
8A
24
22
34
Kot
ak M
ahin
dra
Ban
kIn
dia
44
5A
A8
,77
35
%3
94
A
24
32
51
Ban
risul
Bra
zil
44
2A
+2
,93
81
5%
34
7A
+
24
43
56
Virg
in M
oney
UK
44
0A
+2
02
A
24
52
12
Ban
esto
Spai
n4
39
AA
3,2
68
13
%4
70
A+
24
62
49
Nat
iona
l Ban
k of
Gre
ece
Gre
ece
43
0A
A-
1,2
01
36
%3
54
AA
-
24
71
94
Nyk
redi
tD
enm
ark
42
8A
53
3A
+
24
82
11
Ban
k of
Eas
t Asi
aH
ong
Kon
g4
25
AA
-7
,36
16
%4
71
AA
-
24
92
18
Ban
co E
spíri
to S
anto
Port
ugal
41
9A
A5
,00
98
%4
36
AA
-
25
02
04
Isra
el D
isco
unt B
ank
Isra
el4
17
A+
1,8
00
23
%4
86
A+
To
p 5
00
mo
sT v
alu
ab
le b
an
kn
ig b
ra
nd
s 2
51
-30
0
ran
k 2
01
3r
ank
20
12
bra
ndd
omic
ileb
rand
va
lue
20
13
($
m)
bra
nd
rati
ng
20
13
mar
ket
cap
20
13
($
m)
bra
nd
valu
e/
mar
ket
cap
(%)
20
13
($
m)
bra
nd
valu
e 2
01
2
($m
)
bra
nd
rati
ng
20
12
25
12
60
Cho
ngqi
ng R
ural
Chi
na4
13
A+
5,3
99
8%
32
6A
25
22
36
Jysk
e B
ank
Den
mar
k4
07
A+
2,0
47
20
%3
93
A+
25
32
64
Afr
ican
Ban
kS
outh
Afr
ica
40
7A
A2
,14
11
9%
31
9A
A-
25
4B
anco
De
Cre
dito
E In
vers
ione
sC
hile
40
6A
A-
7,4
63
5%
25
52
41
Ban
k of
Yok
oham
aJa
pan
40
4A
+6
,44
86
%3
89
A+
25
62
47
Ban
co C
omer
cial
Por
tugu
êsPo
rtug
al3
96
AA
1,9
75
20
%3
57
A+
25
72
21
Ban
kint
erSp
ain
39
4A
A-
2,6
54
15
%4
22
AA
-
25
82
52
Ban
k of
Indi
aIn
dia
38
4A
+3
,79
31
0%
34
3A
25
92
92
Sam
sung
Sec
uriti
esS
outh
Kor
ea3
82
A+
4,0
44
9%
25
9A
26
02
50
Ban
k of
the
Wes
tFr
ance
38
1A
A-
2,2
94
17
%3
49
A+
26
12
67
Firs
t Citi
zens
US
38
1A
A-
1,7
40
22
%3
15
AA
-
26
22
14
Shiz
uoka
Ban
kJa
pan
37
9A
+6
,19
56
%4
60
AA
26
31
77
E*T
RA
DE
US
37
9A
A2
,62
91
4%
62
2A
A-
26
42
45
Inve
stor
s G
roup
Can
ada
37
7A
+6
,53
96
%3
62
A+
26
51
87
Man
Gro
upU
K3
70
AA
-2
,47
61
5%
56
6A
+
26
62
33
Stife
l Fin
anci
alU
S3
69
A+
1,7
82
21
%4
00
A
26
72
77
Guo
co G
roup
Hon
g K
ong
36
6A
A-
3,9
75
9%
28
6A
26
82
65
Clo
se B
roth
ers
Gro
upU
K3
63
AA
2,0
82
17
%3
18
AA
-
26
9W
esba
nkS
outh
Afr
ica
36
3A
A-
5,5
83
7%
27
0C
LSA
Fran
ce3
63
AA
92
03
9%
27
12
42
Kom
erčn
í ban
kaC
zech
36
0A
+7
,93
85
%3
87
A+
27
22
63
Ban
k of
Nin
gbo
Chi
na3
57
A4
,88
27
%3
21
A+
27
32
08
Ban
que
Saud
i Fra
nsi
Saud
i Ara
bia
35
6A
+7
,18
35
%4
77
AA
-
27
42
32
BO
K F
inan
cial
Cor
pora
tion
US
35
5A
A-
3,8
38
9%
40
0A
A-
27
54
38
Cof
ace
Fran
ce3
55
AA
-7
47
47
%1
57
A
27
62
13
ICA
PU
K3
54
AA
-3
,20
51
1%
46
2A
+
27
72
19
Hai
tong
Sec
uriti
esC
hina
35
2A
15
,81
92
%4
23
A
27
82
84
Hua
tai S
ecur
ities
Chi
na3
50
A8
,68
14
%2
79
A
27
9Pa
ris O
rlean
sFr
ance
34
9A
+1
,59
62
2%
28
03
38
Cai
xa C
atal
unya
Spai
n3
47
A2
17
A
28
12
70
Ban
k of
New
Zea
land
Aus
tral
ia3
47
AA
4,7
60
7%
30
8A
A-
28
22
81
ASB
Ban
kA
ustr
alia
34
6A
A-
6,1
46
6%
28
2A
A-
28
32
79
Wad
dell
& R
eed
US
34
4A
A-
3,0
69
11
%2
84
AA
-
28
44
27
Spar
eBan
k 1
SR
-Ban
kN
orw
ay3
40
A4
,11
68
%1
61
A
28
52
57
TCF
US
33
9A
A-
2,0
73
16
%3
33
AA
28
63
12
Cap
itec
Ban
kS
outh
Afr
ica
33
9A
A-
2,4
84
14
%2
39
A
28
72
27
Ara
b N
atio
nal B
ank
Saud
i Ara
bia
33
9A
+5
,90
36
%4
11
AA
-
28
82
56
Von
tobe
lSw
itzer
land
33
4A
A-
2,0
11
17
%3
35
A+
28
9EF
LFr
ance
33
3A
A1
,03
23
2%
29
02
54
BR
E B
ank
Pola
nd3
31
A4
,32
88
%3
39
A
29
1Po
hjol
a B
ank
Finl
and
33
0A
A-
4,8
86
7%
29
22
59
Can
ara
Ban
kIn
dia
33
0A
A-
4,2
26
8%
32
8A
29
32
29
SAB
BSa
udi A
rabi
a3
26
A+
7,9
72
4%
40
9A
A-
29
4EU
RO
FAC
TOR
Fran
ce3
26
AA
1,0
12
32
%
29
52
44
Fina
nsba
nkTu
rkey
32
5A
+5
,10
56
%3
72
A+
29
62
76
BT
Fin
anci
al G
roup
Aus
tral
ia3
22
AA
+4
,24
28
%2
89
A+
29
72
96
Mar
shal
l & Il
sley
US
32
0A
25
7A
29
8Fi
nare
fFr
ance
31
9A
A9
92
32
%
29
92
90
Laur
entia
n B
ank
Can
ada
31
6A
A-
1,2
51
25
%2
60
A+
30
0Su
ncor
pA
ustr
alia
31
6A
A-
3,7
28
8%
Top 500 most valuable banking brands
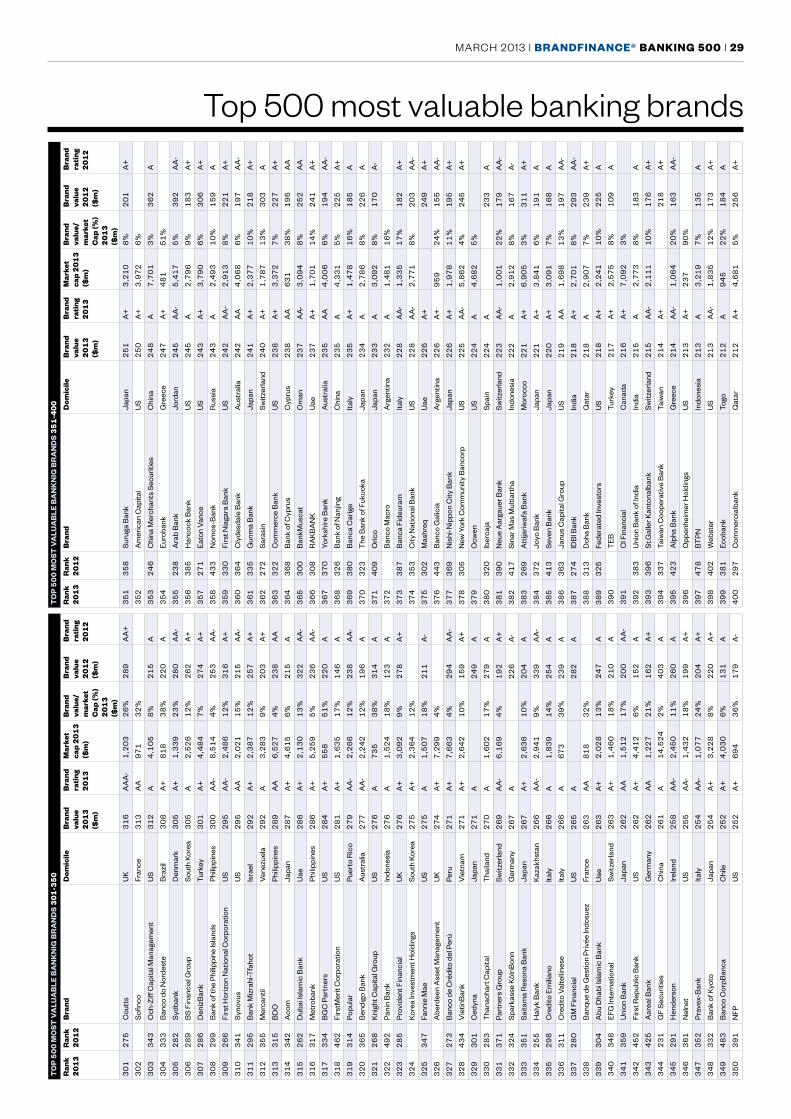
MARCH 2013 | brandFinance® banking 500 | 29T
op
50
0 m
osT
va
lua
ble
ba
nk
nig
br
an
ds
30
1-3
50
ran
k 2
01
3r
ank
20
12
bra
ndd
omic
ileb
rand
va
lue
20
13
($
m)
bra
nd
rati
ng
20
13
mar
ket
cap
20
13
($
m)
bra
nd
valu
e/
mar
ket
cap
(%)
20
13
($
m)
bra
nd
valu
e 2
01
2
($m
)
bra
nd
rati
ng
20
12
30
12
75
Cou
tts
UK
31
6A
AA
-1
,20
32
6%
28
9A
A+
30
2S
ofinc
oFr
ance
31
3A
A9
71
32
%
30
33
43
Och
-Ziff
Cap
ital M
anag
emen
tU
S3
12
A4
,10
58
%2
15
A
30
43
33
Ban
co d
o N
orde
ste
Bra
zil
30
8A
+8
18
38
%2
20
A
30
52
82
Sydb
ank
Den
mar
k3
05
A+
1,3
39
23
%2
80
AA
-
30
62
89
BS
Fina
ncia
l Gro
upS
outh
Kor
ea3
05
A2
,52
61
2%
26
2A
+
30
72
86
Den
izB
ank
Turk
ey3
01
A+
4,4
84
7%
27
4A
+
30
82
99
Ban
k of
the
Phili
ppin
e Is
land
sPh
ilipp
ines
30
0A
A-
8,5
14
4%
25
3A
A-
30
92
66
Firs
t Hor
izon
Nat
iona
l Cor
pora
tion
US
29
5A
A-
2,4
86
12
%3
16
A+
31
03
41
Syno
vus
US
29
5A
A2
,02
11
5%
21
5A
A-
31
12
95
Ban
k M
izra
hi-T
faho
tIs
rael
29
2A
+2
,38
71
2%
25
7A
+
31
23
55
Mer
cant
ilV
enez
uela
29
2A
3,2
83
9%
20
3A
+
31
33
15
BD
OPh
ilipp
ines
28
9A
A6
,52
74
%2
38
AA
31
43
42
Aco
m
Japa
n2
87
A+
4,6
15
6%
21
5A
31
52
62
Dub
ai Is
lam
ic B
ank
Uae
28
6A
+2
,13
01
3%
32
2A
A-
31
63
17
Met
roba
nkPh
ilipp
ines
28
6A
+5
,25
95
%2
36
AA
-
31
73
34
BG
C P
artn
ers
US
28
4A
+5
58
51
%2
20
A
31
84
62
Firs
tMer
it C
orpo
ratio
nU
S2
81
A+
1,6
35
17
%1
46
A
31
93
14
Popu
lar
Puer
to R
ico
27
9A
A-
2,2
66
12
%2
38
AA
-
32
03
65
Ben
digo
Ban
kA
ustr
alia
27
7A
A-
2,2
42
12
%1
96
A
32
12
68
Kni
ght C
apita
l Gro
upU
S2
76
A7
35
38
%3
14
A
32
24
92
Pani
n B
ank
Indo
nesi
a2
76
A1
,52
41
8%
12
3A
32
32
85
Prov
iden
t Fin
anci
alU
K2
76
A+
3,0
92
9%
27
8A
+
32
4K
orea
Inve
stm
ent H
oldi
ngs
Sou
th K
orea
27
5A
+2
,36
41
2%
32
53
47
Fann
ie M
aeU
S2
75
A1
,50
71
8%
21
1A
-
32
6A
berd
een
Ass
et M
anag
emen
tU
K2
74
A+
7,2
99
4%
32
72
73
Ban
co d
e C
rédi
to d
el P
erú
Peru
27
1A
+7
,66
34
%2
94
AA
-
32
84
34
Vie
tinB
ank
Vie
tnam
27
1A
+2
,64
21
0%
15
9A
+
32
93
01
Ced
yna
Japa
n2
71
A2
49
A
33
02
83
Tha
nach
art C
apita
lT
haila
nd2
70
A1
,60
21
7%
27
9A
33
13
71
Part
ners
Gro
upSw
itzer
land
26
9A
A-
6,1
69
4%
19
2A
+
33
23
24
Spar
kass
e K
ölnB
onn
Ger
man
y2
67
A2
26
A-
33
33
51
Saita
ma
Res
ona
Ban
kJa
pan
26
7A
+2
,63
61
0%
20
4A
33
42
55
Hal
yk B
ank
Kaz
akhs
tan
26
6A
A-
2,9
41
9%
33
9A
A-
33
52
98
Cre
dito
Em
ilian
oIta
ly2
66
A1
,83
91
4%
25
4A
33
63
11
Cre
dito
Val
telli
nese
Italy
26
6A
67
33
9%
23
9A
33
72
80
GM
Fin
anci
alU
S2
65
A2
82
A
33
8B
anqu
e de
Ges
tion
Priv
ée In
dosu
ezFr
ance
26
3A
A8
18
32
%
33
93
04
Abu
Dha
bi Is
lam
ic B
ank
Uae
26
3A
+2
,02
81
3%
24
7A
34
03
48
EFG
Inte
rnat
iona
lSw
itzer
land
26
3A
+1
,46
01
8%
21
0A
34
13
59
Uni
on B
ank
Japa
n2
62
AA
1,5
12
17
%2
00
AA
-
34
24
52
Firs
t Rep
ublic
Ban
kU
S2
62
A+
4,4
12
6%
15
2A
34
34
25
Aar
eal B
ank
Ger
man
y2
62
AA
1,2
27
21
%1
62
A+
34
42
31
GF
Sec
uriti
esC
hina
26
1A
14
,52
42
%4
03
A
34
52
91
Hen
ders
onIre
land
25
8A
A-
2,4
50
11
%2
60
A
34
63
61
Nel
net
US
25
5A
A-
1,4
32
18
%1
99
A+
34
73
52
Prav
ex-B
ank
Italy
25
4A
A-
1,0
77
24
%2
04
A+
34
83
32
Ban
k of
Kyo
toJa
pan
25
4A
+3
,22
88
%2
20
A+
34
94
83
Ban
co C
orpB
anca
Chi
le2
52
A+
4,0
30
6%
13
1A
35
03
91
NFP
US
25
2A
+6
94
36
%1
79
A-
To
p 5
00
mo
sT v
alu
ab
le b
an
kn
ig b
ra
nd
s 3
51
-40
0
ran
k 2
01
3r
ank
20
12
bra
ndd
omic
ileb
rand
va
lue
20
13
($
m)
bra
nd
rati
ng
20
13
mar
ket
cap
20
13
($
m)
bra
nd
valu
e/
mar
ket
cap
(%)
20
13
($
m)
bra
nd
valu
e 2
01
2
($m
)
bra
nd
rati
ng
20
12
35
13
58
Suru
ga B
ank
Japa
n2
51
A+
3,2
10
8%
20
1A
+
35
2A
mer
ican
Cap
ital
US
25
0A
+3
,97
26
%
35
32
46
Chi
na M
erch
ants
Sec
uriti
esC
hina
24
8A
7,7
01
3%
36
2A
35
4Eu
roba
nkG
reec
e2
47
A+
48
15
1%
35
52
38
Ara
b B
ank
Jord
an2
45
AA
-5
,41
75
%3
92
AA
-
35
63
85
Han
cock
Ban
kU
S2
45
A2
,79
69
%1
83
A+
35
72
71
Eato
n Va
nce
US
24
3A
+3
,79
06
%3
06
A+
35
84
33
Nom
os-B
ank
Rus
sia
24
3A
2,4
93
10
%1
59
A
35
93
30
Firs
t Nia
gara
Ban
kU
S2
42
AA
-2
,91
38
%2
21
A+
36
03
64
Cly
desd
ale
Ban
kA
ustr
alia
24
2A
A4
,06
86
%1
97
AA
-
36
13
35
Gun
ma
Ban
kJa
pan
24
1A
+2
,37
71
0%
21
8A
+
36
22
72
Sara
sin
Switz
erla
nd2
40
A+
1,7
87
13
%3
03
A
36
33
22
Com
mer
ce B
ank
US
23
8A
+3
,37
27
%2
27
A+
36
43
68
Ban
k of
Cyp
rus
Cyp
rus
23
8A
A6
31
38
%1
95
AA
36
53
00
Ban
kMus
cat
Om
an2
37
AA
-3
,09
48
%2
52
AA
36
63
08
RA
KB
AN
KU
ae2
37
A+
1,7
01
14
%2
41
A+
36
73
70
York
shire
Ban
kA
ustr
alia
23
5A
A4
,00
66
%1
94
AA
-
36
83
26
Ban
k of
Nan
jing
Chi
na2
35
A4
,33
15
%2
25
A+
36
93
80
Ban
ca C
arig
eIta
ly2
35
A+
1,4
78
16
%1
85
A
37
03
23
The
Ban
k of
Fuk
uoka
Japa
n2
34
A2
,78
68
%2
26
A
37
14
09
Oric
oJa
pan
23
3A
3,0
92
8%
17
0A
-
37
2B
anco
Mac
roA
rgen
tina
23
2A
1,4
81
16
%
37
33
87
Ban
ca F
ideu
ram
Italy
22
8A
A-
1,3
35
17
%1
82
A+
37
43
53
City
Nat
iona
l Ban
kU
S2
28
AA
-2
,77
18
%2
03
AA
-
37
53
02
Mas
hreq
Uae
22
6A
+2
49
A+
37
64
43
Ban
co G
alic
iaA
rgen
tina
22
6A
+9
59
24
%1
55
AA
-
37
73
69
Nis
hi-N
ippo
n C
ity B
ank
Japa
n2
26
A+
1,9
78
11
%1
95
A+
37
83
05
New
Yor
k C
omm
unity
Ban
corp
US
22
5A
A-
5,8
62
4%
24
5A
+
37
9O
cwen
US
22
4A
4,6
82
5%
38
03
20
Iber
caja
Spai
n2
24
A2
33
A
38
13
90
Neu
e A
arga
uer B
ank
Switz
erla
nd2
23
AA
-1
,00
12
2%
17
9A
A-
38
24
17
Sina
r Mas
Mul
tiart
haIn
done
sia
22
2A
2,9
12
8%
16
7A
-
38
32
69
Att
ijariw
afa
Ban
kM
oroc
co2
21
A+
6,9
05
3%
31
1A
+
38
43
72
Joyo
Ban
k Ja
pan
22
1A
+3
,84
16
%1
91
A
38
54
13
Sev
en B
ank
Japa
n2
20
A+
3,0
91
7%
16
8A
38
63
63
Janu
s C
apita
l Gro
upU
S2
19
AA
1,6
98
13
%1
97
AA
-
38
72
74
IDB
I Ban
kIn
dia
21
8A
+2
,70
18
%2
93
AA
-
38
83
13
Doh
a B
ank
Qat
ar2
18
A2
,90
77
%2
39
A+
38
93
25
Fede
rate
d In
vest
ors
US
21
8A
+2
,24
11
0%
22
5A
39
0T
EBTu
rkey
21
7A
+2
,57
58
%1
09
A
39
1C
I Fin
anci
alC
anad
a2
16
A+
7,0
92
3%
39
23
83
Uni
on B
ank
of In
dia
Indi
a2
15
A2
,77
38
%1
83
A
39
33
96
St.G
alle
r Kan
tona
lban
kSw
itzer
land
21
5A
A-
2,1
11
10
%1
76
A+
39
43
37
Taiw
an C
oope
rativ
e B
ank
Taiw
an2
14
A+
21
8A
+
39
54
23
Alp
ha B
ank
Gre
ece
21
4A
A-
1,0
64
20
%1
63
AA
-
39
6O
ppen
heim
er H
oldi
ngs
US
21
3A
+2
37
90
%
39
74
78
BT
PNIn
done
sia
21
3A
3,2
19
7%
13
5A
39
84
02
Web
ster
US
21
3A
A-
1,8
35
12
%1
73
A+
39
93
81
Ecob
ank
Togo
21
2A
94
52
2%
18
4A
40
02
97
Com
mer
cial
bank
Qat
ar2
12
A+
4,6
81
5%
25
6A
+
Top 500 most valuable banking brands
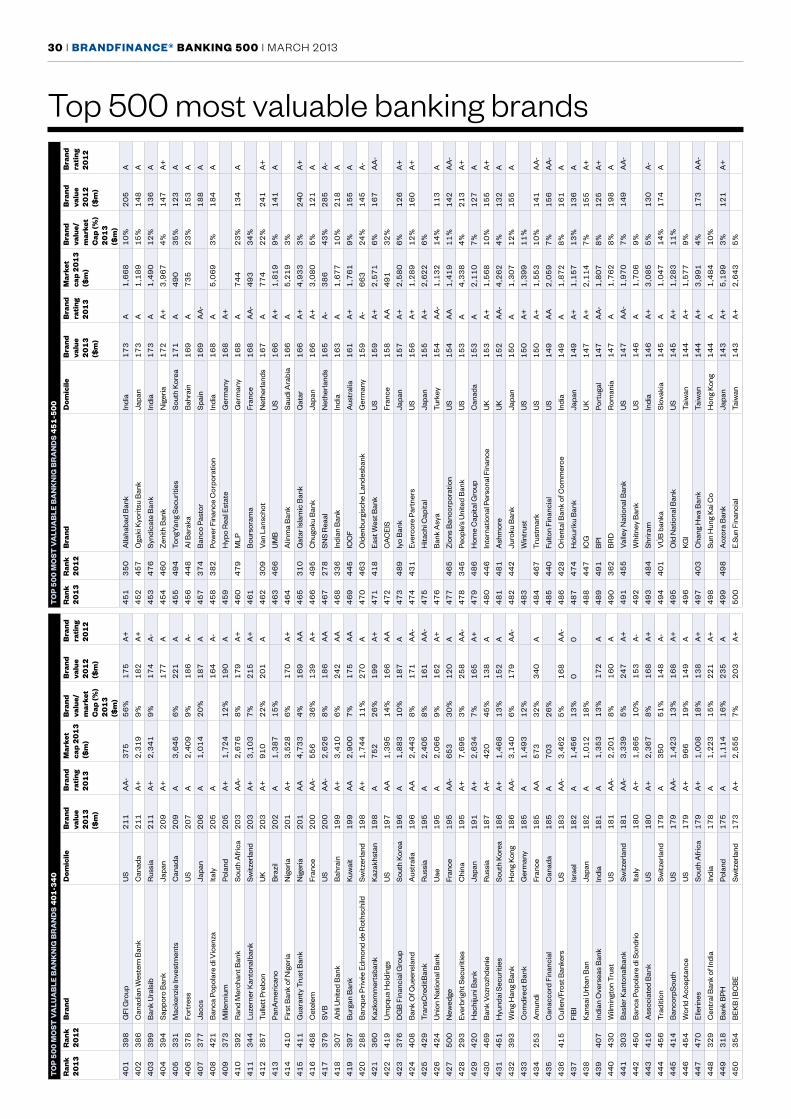
30 | brandFinance® banking 500 | MARCH 2013T
op
50
0 m
osT
va
lua
ble
ba
nk
nig
br
an
ds
40
1-3
40
ran
k 2
01
3r
ank
20
12
bra
ndd
omic
ileb
rand
va
lue
20
13
($
m)
bra
nd
rati
ng
20
13
mar
ket
cap
20
13
($
m)
bra
nd
valu
e/
mar
ket
cap
(%)
20
13
($
m)
bra
nd
valu
e 2
01
2
($m
)
bra
nd
rati
ng
20
12
40
13
98
GFI
Gro
upU
S2
11
AA
-3
75
56
%1
75
A+
40
23
86
Can
adia
n W
este
rn B
ank
Can
ada
21
1A
+2
,31
99
%1
82
A+
40
33
99
Ban
k U
rals
ibR
ussi
a2
11
A+
2,3
41
9%
17
4A
-
40
43
94
Sapp
oro
Ban
kJa
pan
20
9A
+1
77
A
40
53
31
Mac
kenz
ie In
vest
men
tsC
anad
a2
09
A3
,64
56
%2
21
A
40
63
78
Fort
ress
US
20
7A
2,4
09
9%
18
6A
-
40
73
77
Jacc
sJa
pan
20
6A
1,0
14
20
%1
87
A
40
84
21
Ban
ca P
opol
are
di V
icen
zaIta
ly2
05
A1
64
A-
40
93
73
Mill
enni
umPo
land
20
5A
+1
,72
41
2%
19
0A
41
03
92
Ran
d M
erch
ant B
ank
Sou
th A
fric
a2
03
AA
-2
,67
68
%1
79
A+
41
13
44
Luze
rner
Kan
tona
lban
kSw
itzer
land
20
3A
+3
,10
37
%2
15
A+
41
23
57
Tulle
tt P
rebo
nU
K2
03
A+
91
02
2%
20
1A
41
3Pa
nAm
eric
ano
Bra
zil
20
2A
1,3
87
15
%
41
44
10
Firs
t Ban
k of
Nig
eria
Nig
eria
20
1A
+3
,52
86
%1
70
A+
41
54
11
Gua
rant
y Tr
ust B
ank
Nig
eria
20
1A
A4
,73
34
%1
69
AA
41
64
68
Cet
elem
Fran
ce2
00
AA
-5
56
36
%1
39
A+
41
73
79
SVB
US
20
0A
A-
2,6
26
8%
18
6A
A
41
83
07
Ahl
i Uni
ted
Ban
kB
ahra
in1
99
A+
3,4
10
6%
24
2A
A
41
93
97
Bur
gan
Ban
kK
uwai
t1
99
AA
2,9
00
7%
17
5A
A
42
02
88
Ban
que
Priv
ée E
dmon
d de
Rot
hsch
ildSw
itzer
land
19
8A
+1
,74
41
1%
27
0A
42
13
60
Kaz
kom
mer
tsba
nkK
azak
hsta
n1
98
A7
52
26
%1
99
A+
42
24
19
Um
pqua
Hol
ding
sU
S1
97
AA
1,3
95
14
%1
66
AA
42
33
76
DG
B F
inan
cial
Gro
upS
outh
Kor
ea1
96
A1
,88
31
0%
18
7A
42
44
08
Ban
k O
f Que
ensl
and
Aus
tral
ia1
96
AA
2,4
43
8%
17
1A
A-
42
54
29
Tran
sCre
ditB
ank
Rus
sia
19
5A
2,4
05
8%
16
1A
A-
42
64
24
Uni
on N
atio
nal B
ank
Uae
19
5A
2,0
66
9%
16
2A
+
42
75
00
New
edge
Fran
ce1
95
AA
-6
53
30
%1
20
A
42
82
93
Ever
brig
ht S
ecur
ities
Chi
na1
95
A+
7,6
95
3%
25
8A
A-
42
94
20
Hac
hiju
ni B
ank
Japa
n1
91
A+
2,6
34
7%
16
5A
+
43
04
69
Ban
k V
ozro
zhde
nie
Rus
sia
18
7A
+4
20
45
%1
38
A
43
14
51
Hyu
ndai
Sec
uriti
esS
outh
Kor
ea1
86
A+
1,4
68
13
%1
52
A
43
23
93
Win
g H
ang
Ban
kH
ong
Kon
g1
86
AA
-3
,14
06
%1
79
AA
-
43
3C
omdi
rect
Ban
kG
erm
any
18
5A
1,4
93
12
%
43
42
53
Am
undi
Fran
ce1
85
AA
57
33
2%
34
0A
43
5C
anac
cord
Fin
anci
alC
anad
a1
85
A7
03
26
%
43
64
15
Cul
len/
Fros
t Ban
kers
US
18
3A
A-
3,4
62
5%
16
8A
A-
43
7FI
BI
Isra
el1
82
A1
,45
61
3%
00
43
8K
ansa
i Urb
an B
anJa
pan
18
2A
1,0
12
18
%
43
94
07
Indi
an O
vers
eas
Ban
kIn
dia
18
1A
1,3
53
13
%1
72
A
44
04
30
Wilm
ingt
on T
rust
US
18
1A
A-
2,2
01
8%
16
0A
44
13
03
Bas
ler K
anto
nalb
ank
Switz
erla
nd1
81
AA
-3
,33
95
%2
47
A+
44
24
50
Ban
ca P
opol
are
di S
ondr
ioIta
ly1
80
A+
1,8
65
10
%1
53
A-
44
34
16
Ass
ocia
ted
Ban
kU
S1
80
A+
2,3
67
8%
16
8A
+
44
44
56
Trad
ition
Switz
erla
nd1
79
A3
50
51
%1
48
A-
44
54
14
Ban
corp
Sou
thU
S1
79
AA
-1
,42
31
3%
16
8A
+
44
64
54
Wor
ld A
ccep
tanc
eU
S1
79
A+
96
61
9%
14
9A
44
74
70
Elle
rines
Sou
th A
fric
a1
79
A+
1,0
08
18
%1
38
A+
44
83
29
Cen
tral
Ban
k of
Indi
aIn
dia
17
8A
1,2
23
15
%2
21
A+
44
93
18
Ban
k B
PHPo
land
17
5A
1,1
14
16
%2
35
A
45
03
54
BEK
B | B
CB
ESw
itzer
land
17
3A
+2
,55
57
%2
03
A+
To
p 5
00
mo
sT v
alu
ab
le b
an
kn
ig b
ra
nd
s 4
51
-50
0
ran
k 2
01
3r
ank
20
12
bra
ndd
omic
ileb
rand
va
lue
20
13
($
m)
bra
nd
rati
ng
20
13
mar
ket
cap
20
13
($
m)
bra
nd
valu
e/
mar
ket
cap
(%)
20
13
($
m)
bra
nd
valu
e 2
01
2
($m
)
bra
nd
rati
ng
20
12
45
13
50
Alla
haba
d B
ank
Indi
a1
73
A1
,66
81
0%
20
5A
45
24
57
Oga
ki K
yorit
su B
ank
Japa
n1
73
A1
,18
91
5%
14
8A
45
34
76
Synd
icat
e B
ank
Indi
a1
73
A1
,49
01
2%
13
6A
45
44
60
Zeni
th B
ank
Nig
eria
17
2A
+3
,96
74
%1
47
A+
45
54
94
Tong
Yang
Sec
uriti
esS
outh
Kor
ea1
71
A4
90
35
%1
23
A
45
64
48
Al B
arak
aB
ahra
in1
69
A7
35
23
%1
53
A
45
73
74
Ban
co P
asto
rSp
ain
16
9A
A-
18
8A
45
83
82
Pow
er F
inan
ce C
orpo
ratio
nIn
dia
16
8A
5,0
69
3%
18
4A
45
9H
ypo
Rea
l Est
ate
Ger
man
y1
68
A+
46
04
79
MLP
Ger
man
y1
68
A7
44
23
%1
34
A
46
1B
ours
oram
aFr
ance
16
8A
A-
49
33
4%
46
23
09
Van
Lans
chot
Net
herla
nds
16
7A
77
42
2%
24
1A
+
46
34
66
UM
BU
S1
66
A+
1,8
19
9%
14
1A
46
4A
linm
a B
ank
Saud
i Ara
bia
16
6A
5,2
19
3%
46
53
10
Qat
ar Is
lam
ic B
ank
Qat
ar1
66
A+
4,9
33
3%
24
0A
+
46
64
95
Chu
goku
Ban
kJa
pan
16
6A
+3
,08
05
%1
21
A
46
72
78
SNS
Rea
alN
ethe
rland
s1
65
A-
38
64
3%
28
5A
-
46
83
36
Indi
an B
ank
Indi
a1
63
A1
,67
71
0%
21
8A
46
94
45
IOO
FA
ustr
alia
16
1A
+1
,76
19
%1
55
A
47
04
63
Old
enbu
rgis
che
Land
esba
nkG
erm
any
15
9A
-6
63
24
%1
45
A-
47
14
18
East
Wes
t Ban
kU
S1
59
A+
2,5
71
6%
16
7A
A-
47
2C
AC
EIS
Fran
ce1
58
AA
49
13
2%
47
34
89
Iyo
Ban
kJa
pan
15
7A
+2
,58
06
%1
26
A+
47
44
31
Ever
core
Par
tner
sU
S1
56
A+
1,2
89
12
%1
60
A+
47
5H
itach
i Cap
ital
Japa
n1
55
A+
2,6
22
6%
47
6B
ank
Asy
aTu
rkey
15
4A
A-
1,1
32
14
%1
13
A
47
74
65
Zion
s B
anco
rpor
atio
nU
S1
54
AA
1,4
19
11
%1
42
AA
-
47
83
45
Peop
le’s
Uni
ted
Ban
kU
S1
53
A4
,33
84
%2
13
A+
47
94
86
Hom
e C
apita
l Gro
upC
anad
a1
53
A2
,11
07
%1
27
A
48
04
46
Inte
rnat
iona
l Per
sona
l Fin
ance
UK
15
3A
+1
,56
81
0%
15
5A
+
48
14
81
Ash
mor
eU
K1
52
AA
-4
,26
24
%1
32
A
48
24
42
Juro
ku B
ank
Japa
n1
50
A1
,30
71
2%
15
5A
48
3W
intr
ust
US
15
0A
+1
,39
91
1%
48
44
67
Trus
tmar
kU
S1
50
A+
1,5
53
10
%1
41
AA
-
48
54
40
Fulto
n Fi
nanc
ial
US
14
9A
A2
,05
97
%1
56
AA
-
48
64
28
Orie
ntal
Ban
k of
Com
mer
ceIn
dia
14
9A
1,8
72
8%
16
1A
48
74
74
Hok
urik
u B
ank
Japa
n1
49
A+
1,1
57
13
%1
36
A
48
84
47
ICG
UK
14
7A
+2
,11
47
%1
55
A+
48
94
91
BPI
Port
ugal
14
7A
A-
1,8
07
8%
12
5A
+
49
03
62
BR
DR
oman
ia1
47
A1
,76
28
%1
98
A
49
14
55
Valle
y N
atio
nal B
ank
US
14
7A
A-
1,9
70
7%
14
9A
A-
49
2W
hitn
ey B
ank
US
14
6A
1,7
06
9%
49
34
84
Shrir
amIn
dia
14
6A
+3
,08
55
%1
30
A-
49
44
01
VÚ
B b
anka
Slov
akia
14
5A
1,0
47
14
%1
74
A
49
5O
ld N
atio
nal B
ank
US
14
5A
+1
,28
31
1%
49
6KG
ITa
iwan
14
4A
+1
,57
79
%
49
74
03
Cha
ng H
wa
Ban
kTa
iwan
14
4A
+3
,99
14
%1
73
AA
-
49
8Su
n H
ung
Kai
Co
Hon
g K
ong
14
4A
1,4
84
10
%
49
94
98
Aoz
ora
Ban
kJa
pan
14
3A
+5
,19
93
%1
21
A+
50
0E.
Sun
Fina
ncia
lTa
iwan
14
3A
+2
,64
35
%
Top 500 most valuable banking brands
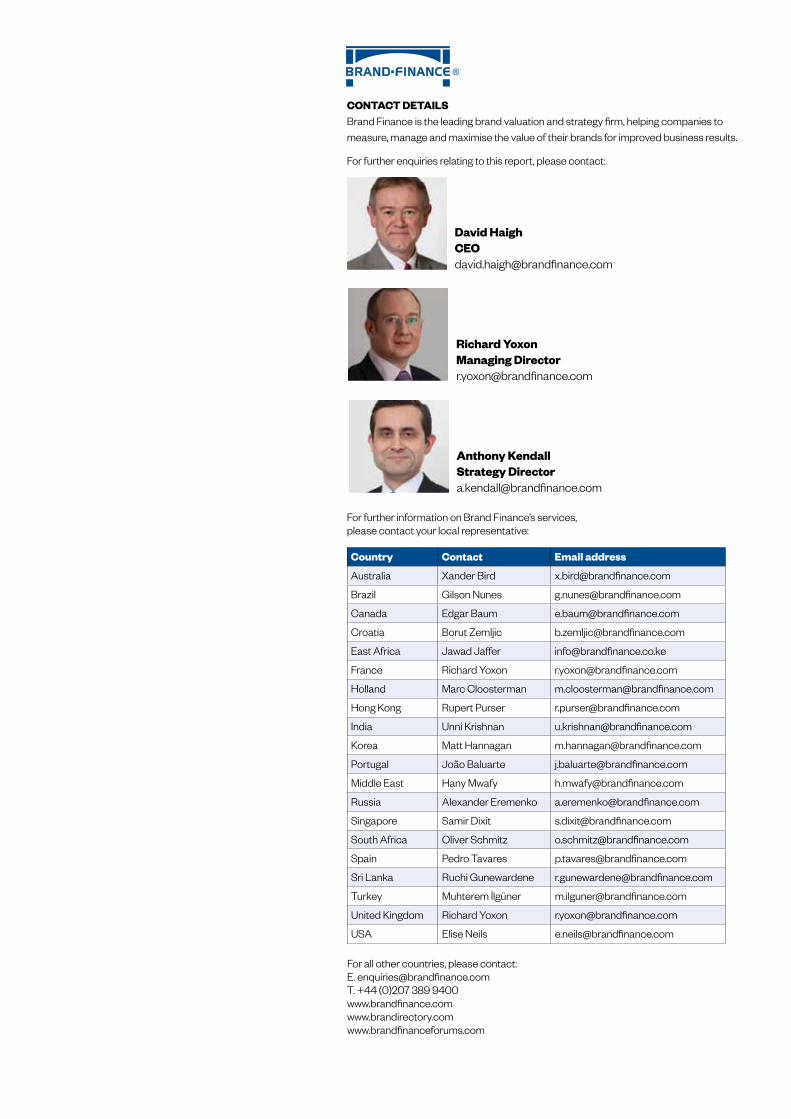
conTacT deTailsBrand Finance is the leading brand valuation and strategy firm, helping companies to measure, manage and maximise the value of their brands for improved business results.
For further enquiries relating to this report, please contact:
david haighceo [email protected]
richard Yoxon managing director
anthony kendall strategy [email protected]
For further information on Brand Finance’s services, please contact your local representative:
country contact email address
Australia Xander Bird [email protected]
Brazil Gilson nunes [email protected]
Canada Edgar Baum [email protected]
Croatia Borut Zemljic [email protected]
East Africa Jawad Jaffer [email protected]
France Richard yoxon [email protected]
Holland Marc Cloosterman [email protected]
Hong Kong Rupert Purser [email protected]
india Unni Krishnan [email protected]
Korea Matt Hannagan [email protected]
Portugal João Baluarte [email protected]
Middle East Hany Mwafy [email protected]
Russia Alexander Eremenko [email protected]
Singapore Samir dixit [email protected]
South Africa oliver Schmitz [email protected]
Spain Pedro Tavares [email protected]
Sri lanka Ruchi Gunewardene [email protected]
Turkey Muhterem İlgüner [email protected]
United Kingdom Richard yoxon [email protected]
USA Elise neils [email protected]
For all other countries, please contact:E. [email protected]. +44 (0)207 389 9400www.brandfinance.comwww.brandirectory.comwww.brandfinanceforums.com