20
Brand presence & portrayal in BALLERS: PILOT & RAISE UP (2015) analyzing Brands’ presence and portrayal in entertainment website: www.concavebt.com featuring, among others:
| Date post: | 12-Apr-2017 |
| Category: |
Business |
| Upload: | dominic-artzrouni |
| View: | 511 times |
| Download: | 0 times |

Brand presence & portrayal
in
BALLERS: PILOT & RAISE UP (2015)
analyzing Brands’ presence and portrayal in entertainment
website: www.concavebt.com
featuring, among others:

introduction
2
Concave Brand Tracking has combed through the first 2 episodes of HBO’s new show, BALLERS
(2015), auditing all recognizable Branded products that appeared. We record all identifiable products
from consumer Brands.
In addition to recording sighted Brands, we observed how visible the products were and how long they
were on screen, as well as an array of contextual data regarding their portrayal.
The following report is divided into 3 main sections looking at Brand exposure, the demographics of
individuals associated with Brands and the context in which the Brands are portrayed.
For more information about our methodology please refer to the appendix.

table of contents
3
1. Brand exposure page 4
Here, we look at how often Brands appeared, how much screen time they received and how visible the products
as well as their logos/names were.
2. Brand demographics page 9
We look at the demographics of individuals associated with Brands. This includes age, gender and ethnicity, as
well as lists of actors who have been associated with many Brands.
3. Brand context page 13
This section analyzes the portrayal created by the elements surrounding Brands. We will see in what locations
Brands were shown, as well as what associations were made with them.
4. appendix page 18
Brand exposure
4
Here, we look at how often Brands appeared, how much screen time they received and how
visible their products as well as their names/logos were.
Brand demographics
Brand context
appendix

5
• 17% of the total Brand visibility
was made up of cars, more
than any other product.
• Polo shirts were the 2nd most visible type of
Branded products. Sunglasses mobile phones
and jerseys follow with between 6% and 9%
of total Branded visibility.
• Other less prominent products included
monitors, TVs, shoes, sweaters,
watches, boats and many more.
Brand exposure – presence – types of products –
% of Brand visibility – BALLERS: PILOT & RAISE UP (2015)
Brand visibility factors in screen time, logo/name visibility and product discernibility.
17%
15%
7%
6%5%
0%
2%
4%
6%
8%
10%
12%
14%
16%
18%
cars polo shirts sunglasses mobile phones jerseys
% o
f to
tal B
ran
d v
isib
ility

Chevrolet34%
Land Rover15%
Ferrari15%
Bentley12%
other26%
6
• 34% of the total car Brand visibility
was made up by Chevrolet, more
than any other Brand.
• Land Rover and Ferrari were
the 2nd and 3rd most visible car
Brands followed by Bentley.
• Other less prominent car Brands
include Cadillac, Mercedes-Benz,
Porsche, Honda and others.
Brand exposure – presence – car Brands –
% of Brand visibility – BALLERS: PILOT & RAISE UP (2015)
Brand visibility factors in screen time, logo/name visibility and product discernibility.

7
Brand exposure – presence – car Brands –
BALLERS: PILOT & RAISE UP (2015)

00:58
01:24
01:04
01:26
01:25
03:24
01:44
02:53
04:49
03:57
00:00 02:00 04:00 06:00
Gatorade
Land Rover
Ralph Lauren
Miami Dolphins
Dallas Cowboys
Apple
NFL
Doctors Hospital
Chevrolet
Nike
66%
62%
7%
50%
2%
53%
22%
0% 25% 50% 75% 100%
8
• Nike was the most visible
Brand throughout the 2
first episodes.
• Chevrolet was only the 2nd most visible Brand despite having
the most total screen time. This is due to appearing
discreetly or in the background in over ½ of its screen time.
• Apple was the 4th most
visible Brand with close to 3
½ minutes of screen time.
Brand exposure – total Brand visibility – top 10 Brands –
% of Brand visibility – BALLERS: PILOT & RAISE UP (2015)
Brand visibility factors in screen time, logo/name visibility and product discernibility.
screen time
(in minutes)
minutes % of screen time total Brand visibility –
indexed to highest
logo/name
visibility background/
discreet subtle
product discernibility total Brand
visibility
59%
10%
67%
100%
100%
14%
84%
100%
71%
91%
0% 25% 50% 75% 100%
0.2
0.2
0.3
0.4
0.4
0.4
0.5
0.8
0.9
1.0
0.0 0.2 0.4 0.6 0.8 1.0
34%
38%
100%
93%
100%
48%
98%
100%
47%
78%
0% 25% 50% 75%100%
Brand exposure
9
Brand demographics
Brand context
appendix
We look at the demographics of individuals associated with Brands. This includes age, gender
and ethnicity, as well as lists of actors who have been associated with many Brands.
10
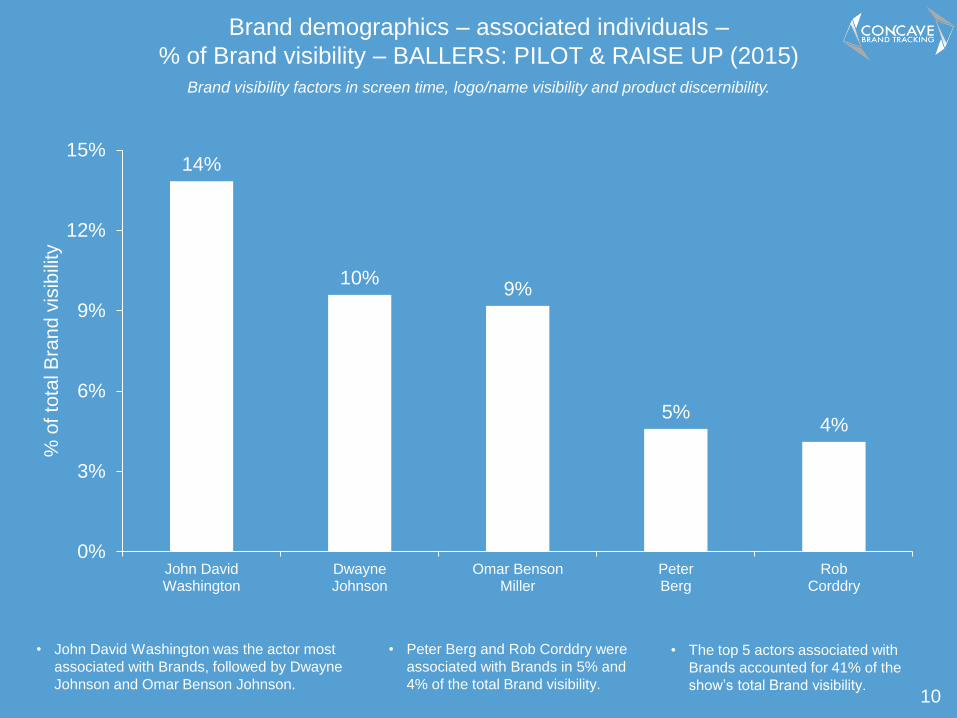
• John David Washington was the actor most
associated with Brands, followed by Dwayne
Johnson and Omar Benson Johnson.
• Peter Berg and Rob Corddry were
associated with Brands in 5% and
4% of the total Brand visibility.
• The top 5 actors associated with
Brands accounted for 41% of the
show’s total Brand visibility.
Brand demographics – associated individuals –
% of Brand visibility – BALLERS: PILOT & RAISE UP (2015)
Brand visibility factors in screen time, logo/name visibility and product discernibility.
14%
10%9%
5%4%
0%
3%
6%
9%
12%
15%
John DavidWashington
DwayneJohnson
Omar BensonMiller
PeterBerg
RobCorddry
% o
f to
tal B
rand v
isib
ility
11
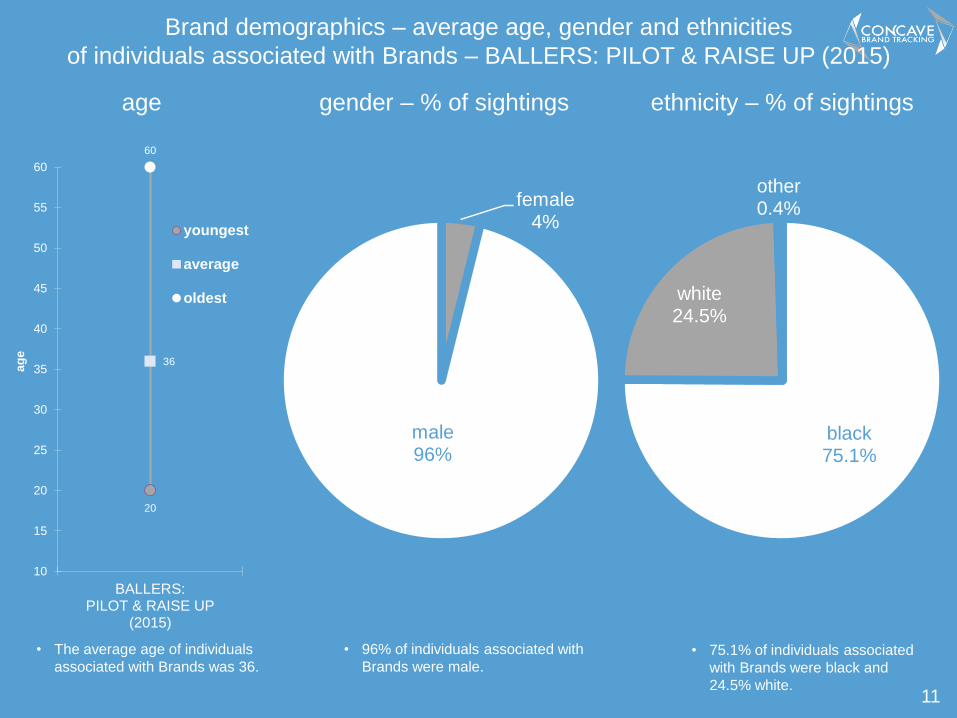
• The average age of individuals
associated with Brands was 36.
• 96% of individuals associated with
Brands were male. • 75.1% of individuals associated
with Brands were black and
24.5% white.
Brand demographics – average age, gender and ethnicities
of individuals associated with Brands – BALLERS: PILOT & RAISE UP (2015)
20
36
60
10
15
20
25
30
35
40
45
50
55
60
BALLERS:PILOT & RAISE UP
(2015)
ag
e
youngest
average
oldest
black75.1%
white24.5%
other0.4%female
4%
male96%
age gender – % of sightings ethnicity – % of sightings

12
• Apple was associated with Dwayne
Johnson in 51% of its visibility.
• Bentley was associated with Laroyce
Hawkins in 94% of its visibility.
• Ferrari was exclusively associated
with John David Washington.
Brand demographics – associated individuals by selected Brands –
% of Brand visibility – BALLERS: PILOT & RAISE UP (2015)
Brand visibility factors in screen time, logo/name visibility and product discernibility.
Apple Ferrari
DeSean Jackson
6%
Laroyce Hawkins
94%
Troy Garity21%
Rob Corddry14%
other13%
Dwayne Johnson51%
John David Washington
100%
Bentley

Brand exposure
13
Brand demographics
Brand context
appendix
This section looks at the portrayal created by the elements surrounding Brands. We will see in
what locations Brands were shown in, as well as what associations were made with them.

14
• Brands were seen on football
fields in 26% of their screen time,
more than any other location.
• Restaurant and city environments followed
as the 2nd and 3rd most common locations
in which Brands were shown.
• Brands were also seen at home, at a car
dealerships, in offices and at the docks
amongst other locations..
Brand context – overall Brand locations –
% of screen time – BALLERS: PILOT & RAISE UP (2015)
football field22%
restaurant22%
city17%
home13%
car dealership 9%
office, 8%
docks, 5%other, 5%
15
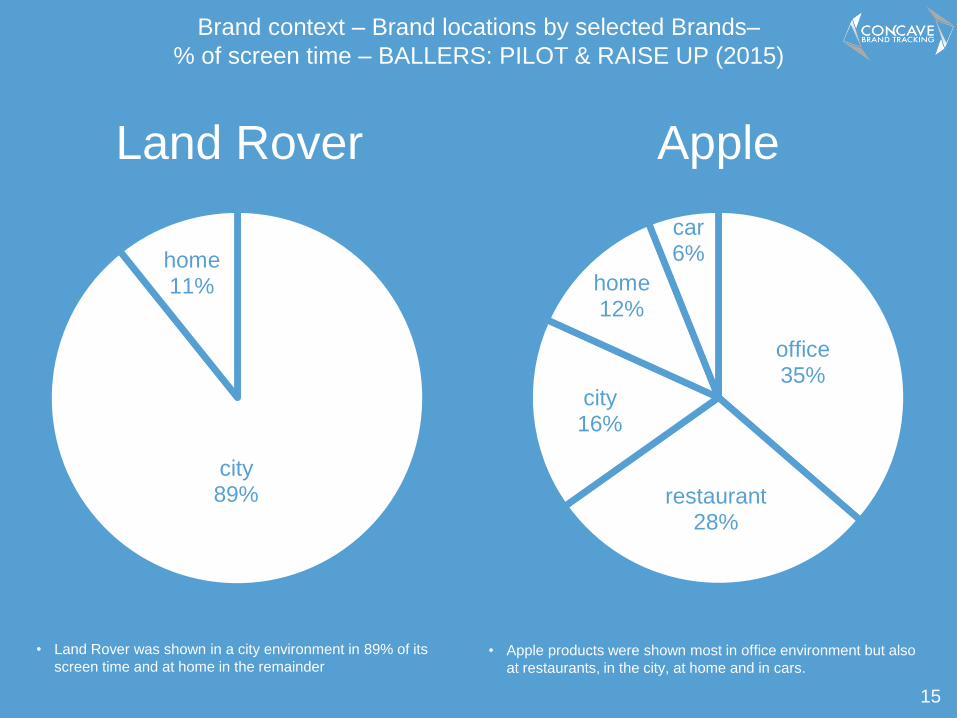
• Land Rover was shown in a city environment in 89% of its
screen time and at home in the remainder • Apple products were shown most in office environment but also
at restaurants, in the city, at home and in cars.
Brand context – Brand locations by selected Brands–
% of screen time – BALLERS: PILOT & RAISE UP (2015)
Land Rover Apple
city89%
home11%
office35%
restaurant28%
city16%
home12%
car6%
16
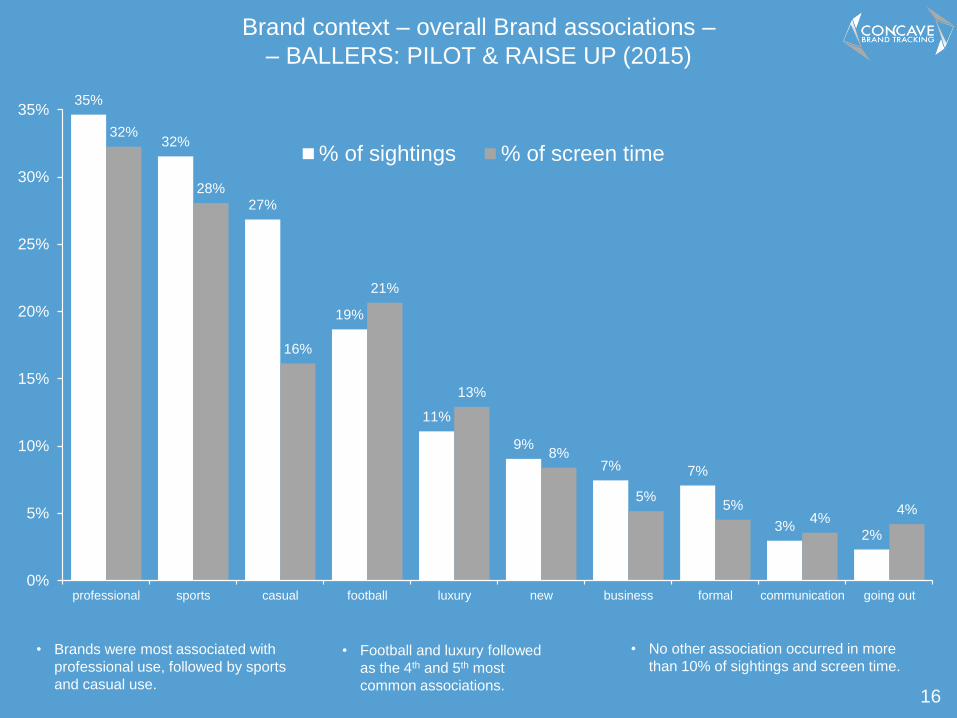
• Brands were most associated with
professional use, followed by sports
and casual use.
• Football and luxury followed
as the 4th and 5th most
common associations.
• No other association occurred in more
than 10% of sightings and screen time.
Brand context – overall Brand associations –
– BALLERS: PILOT & RAISE UP (2015)
35%
32%
27%
19%
11%
9%
7% 7%
3%2%
32%
28%
16%
21%
13%
8%
5%5%
4%4%
0%
5%
10%
15%
20%
25%
30%
35%
professional sports casual football luxury new business formal communication going out
% of sightings % of screen time

17
• Adidas, Under Armour and
Panasonic were always
used professionally.
• Under Armour, Gatorade and
Doctors Hospital were always
associated with sports.
• Gucci, Audemars Piguet, Comme des
Garçons, Ray Ban and Dallas Cowboys
products were always used casually.
Brand context – associations by Brand –
BALLERS: PILOT (2015)
24%
21%
10%10% 9%
8%
7%
6%
3%3%
17%
19%
12%
5%
7%
10%
7%
9%
3%
7%
0%
5%
10%
15%
20%
25%
casual professional luxury business formal new communication going out job sport
% of sightings % of screen time
52%
67%
59%
100%
100%
100%
50%
55%
57%
100%
100%
100%
0% 25% 50% 75% 100%
Nike
Dell
Apple
Panasonic
UnderArmour
Adidas
professional
15%
92%
76%
100%
100%
100%
26%
50%
90%
100%
100%
100%
0% 25% 50% 75% 100%
Ferrari
MiamiDolphins
Nike
DoctorsHospital
Gatorade
UnderArmour
sports
33%
100%
100%
100%
100%
100%
50%
100%
100%
100%
100%
100%
0% 25% 50% 75% 100%
Air Jordan
DallasCowboys
Ray Ban
Comme desGarçons
AudemarsPiguet
Gucci
casual
18
Brand demographics
Brand context
overall conclusion
Brand exposure
appendix

methodology
19
product breadth:
We record all identifiable Branded products from consumer Brands, with the exception of firearms. As a result, Brands such
as Peterbilt or AM General – not considered consumer Brands – are not included in any statistic of this report. Products
such as ambulances, fire trucks, military vehicles are also excluded.
We consider a product identifiable as long as enough of it is visible to differentiate it from competitors. For instance, if a pair
of black Converse Chuck Taylor shoes are seen, but their logo is never seen, we consider it impossible to distinguish them
from a common black canvas shoe which is meant to look like Chuck Taylors.
screen time:
This is the exact time that a Brand’s product spends on screen. In a case where multiple products from one Brand are
shown, if each portrayal is distinct (different associated individual for example) then each product is assigned its own screen
time.
discernibility: [see examples]
background: The product is identifiable but not at the forefront of the shot.
discreet: When it seems likely that people will not see it but the brand is still present at the forefront of the shot. The product
will usually only occupy a small part of the screen and/or only part of the product is visible.
subtle: The product is used at the forefront of a scene but is not being shown in an obvious way.
obvious: The purpose of the shot is clearly to show the product, but it does not occupy ¼ or more of the screen.
close-up: A product occupies ¼ of more of the screen. The exception are big products such as cars or planes. For a sighting
to be close-up it has to also zoom onto an important part of the product such as a logo or distinct features.
logo/name visibility:
If, during a sighting, a Brand’s logo, name or product name is clearly seen, then the sighting is recorded as having the
logo/name visible. It does not mean the logo was visible during the entire sighting, but that is was at one point.
Brand visibility:
This is a score that is calculated by taking into account Brand screen time, discernibility and logo/name visibility.

Thank you for reading.
For any questions or further information please contact:
Dominic Artzrouni at [email protected].
about Concave Brand Tracking:
We are a market research company
highly specialized in recording and
analyzing Brands’ presence and
portrayal in entertainment.
We have the ability to analyze all
aspects of any Brand featured in
music videos, movies or TV series
and compare them with competitors.


