Association for Information Systems AIS Electronic Library (AISeL) ECIS 2014 Proceedings BREAKFAST AT TIFFANY´S: THE STUDY OF A SUCCESSFUL BUSINESS INTELLIGENCE SOLUTION AS AN INFORMATION INFSTRUCTURE Wanda Presthus Norwegian School of Information Technology, Oslo, Norway, [email protected]Follow this and additional works at: hp://aisel.aisnet.org/ecis2014 is material is brought to you by the European Conference on Information Systems (ECIS) at AIS Electronic Library (AISeL). It has been accepted for inclusion in ECIS 2014 Proceedings by an authorized administrator of AIS Electronic Library (AISeL). For more information, please contact [email protected]. Wanda Presthus, 2014, "BREAKFAST AT TIFFANY´S: THE STUDY OF A SUCCESSFUL BUSINESS INTELLIGENCE SOLUTION AS AN INFORMATION INFSTRUCTURE", Proceedings of the European Conference on Information Systems (ECIS) 2014, Tel Aviv, Israel, June 9-11, 2014, ISBN 978-0-9915567-0-0 hp://aisel.aisnet.org/ecis2014/proceedings/track04/9
Transcript
Association for Information SystemsAIS Electronic Library (AISeL)
ECIS 2014 Proceedings
BREAKFAST AT TIFFANY´S: THE STUDY OFA SUCCESSFUL BUSINESS INTELLIGENCESOLUTION AS AN INFORMATIONINFRASTRUCTUREWanda PresthusNorwegian School of Information Technology, Oslo, Norway, [email protected]
Follow this and additional works at: http://aisel.aisnet.org/ecis2014
This material is brought to you by the European Conference on Information Systems (ECIS) at AIS Electronic Library (AISeL). It has been acceptedfor inclusion in ECIS 2014 Proceedings by an authorized administrator of AIS Electronic Library (AISeL). For more information, please [email protected].
Wanda Presthus, 2014, "BREAKFAST AT TIFFANY´S: THE STUDY OF A SUCCESSFUL BUSINESS INTELLIGENCESOLUTION AS AN INFORMATION INFRASTRUCTURE", Proceedings of the European Conference on Information Systems(ECIS) 2014, Tel Aviv, Israel, June 9-11, 2014, ISBN 978-0-9915567-0-0http://aisel.aisnet.org/ecis2014/proceedings/track04/9
BREAKFAST AT TIFFANY’S: THE STUDY OF A SUCCESSFUL BUSINESS INTELLIGENCE SOLUTION AS AN
INFORMATION INFRASTRUCTURE
Complete Research
Presthus, Wanda, Norwegian School of IT, Oslo, Norway, [email protected]
Abstract
Business Intelligence (BI) solutions are complex and abstract. “You can build the solution, but users will not come,” Cindi Howson writes in her famous BI book, indicating that even if it is successfully implemented, a BI solution may not be used to its full intention. Guided by the research question, “How do we bootstrap and adapt a BI solution?” this study investigates a successful BI solution at a large Norwegian company. Based on a case study, this paper argues that it is fruitful to regard a successful BI solution as the growth of an Information Infrastructure rather than the implementation of a certain technology alone. Drawing on the definition by Hanseth and Lyytinen, an Information Infrastructure is a shared, open, heterogeneous, and evolving socio-technical system (which they call an installed base) consisting of users, a set of IT capabilities, operations, and design communities. This paper attempts to describe how the case company is sustaining their successful BI solution and what we can learn. As a practical contribution, it offers three guidelines for BI practitioners. This study should be of interest to both users and managers of Business Intelligence solutions in the industry.
Key words: Business Intelligence, Information Infrastructure, QlikView, Case study
1. Introduction
In the current business world the competitor is only a click away; the customers frequently change their preferences; new products enter the market, as described in Michael Porter’s model Five Forces (Porter 2001). To stay competitive, it is important for businesses to sense and respond (Overby et al. 2006) both quickly and accurately. While technology empowers the customer to browse the Internet for the cheapest goods and services, technology also enables the company to collect huge amounts of data from sales transactions and Internet user behaviour. Such data can be turned into information and provide decision support (Davenport 2006; Davenport 2010). The process and tools for this data exploration go under the umbrella term “Business Intelligence” (Turban et al. 2014).
The problem is that Business Intelligence (BI) systems are not always used as intended. In line with other information systems, BI systems have traditionally been complex, consisting of various types of source data, data warehouse components, and BI products like reports and graphs. “You can build it, and users won’t come” (Howson 2014) (p. 261). Even more simply put: “If the users do not like the technology, they will just not use it” (Hanseth 2001) (p. 87). Research has been conducted on both successful and unsuccessful BI projects. Examples include the types of data warehouse architectures that are most successful (Ariyachandra and Watson 2006) and on Critical Success Factors for BI projects (Presthus et al. 2012). While the conclusions are valuable, a common denominator is that these studies tend to focus on isolated variables and usually from a technical perspective. Examples include type of architecture and programming language. Another study found that most research of BI focused
Presthus/Business Intelligence as Information Infrastructure
Twenty Second European Conference on Information Systems, Tel Aviv 2014 2
more on turning data into information, and less on how to make decisions and act on the information (Shollo and Kautz 2010). Making decisions and acting involves people to a higher degree than turning data into information. However, information is wasted if people do not use it (Davenport et al. 2001).
I will illustrate that by framing BI as an Information Infrastructure, we can gain a better understanding on how to get people to both bootstrap (start to use) the BI solution and adapt it (continue to use it in their own manner and while doing so, adding value to the infrastructure). The research question reads: How do we bootstrap and adapt a Business Intelligence solution?
The rest of this paper is structured as follows. First I present BI and Hanseth’s Information Infrastructure Theory (Hanseth and Lyytinen 2010) and the concepts of bootstrapping and adaptation. Then the case company is described, followed by an analysis and discussion of the case company’s BI solution as an Information Infrastructure and what we can learn from their success. I briefly point to limitations of the study in this section. Finally, a set of three practical guidelines is offered for successful employment and evolution of Business Intelligence.
2. Theoretical background
This section briefly presents the industry discipline of Business Intelligence and the theory of Information Infrastructure. These two fields play an important role in the case company.
2.1 Business Intelligence
The term Business Intelligence appeared for the first time in 1958 in an IBM article A Business Intelligence System by Hans Peter Luhn. He discussed the possibilities and benefits of automatic textual analysis of a company’s many written documents such as letters and manuals (this was before e-mail). Perhaps Luhn was ahead of his time. Nonetheless, Business Intelligence as a term lay dormant until the end of the 1980s when Gartner Group revived the term and made it popular. BI tools had been used in organisations since the 1960s, but under the name Decision Support Systems or Executive Information Systems (Power 2007). As the names indicate, these systems were intended for management, and the systems were stand-alone databases with restricted access. It could take days, or even weeks, for the decision maker to get a report. Significant progress was made in the 1980s and 1990s as the data warehouse technology matured. A data warehouse will allow for multidimensional analysis by means of Online Analytical Process (OLAP) cubes. OLAP is one example of end-user BI tools like reporting, data mining and dashboards, as illustrated on the right hand side in figure 1.
According to Garner Group the largest vendors of BI technology include SAP, IBM, Microsoft, and SAS Institute (Schlegel et al. 2013). Of these four, SAP is German, and the rest are all from the US. Their solutions are known to be trustworthy but rigid. In 1993, something interesting happened. In a rather small town in Sweden called Lund, a new company was founded: QlikTech. The two founders, Björn Berg and Staffan Gestrelius, wanted to create user-friendly BI software, which they called QlikView. They wanted the tool to be intuitive; allowing the user to click and then see the results (http://www.qlikview.com/us/company/history). Today the company counts more than 29000 customers and over 1500 employees worldwide. QlikView does not use OLAP cubes but relies on “in-memory” processing, making the technology more agile than the traditional solutions from SAP, IBM, Microsoft, and SAS Institute.
Presthus/Business Intelligence as Information Infrastructure
Twenty Second European Conference on Information Systems, Tel Aviv 2014 3
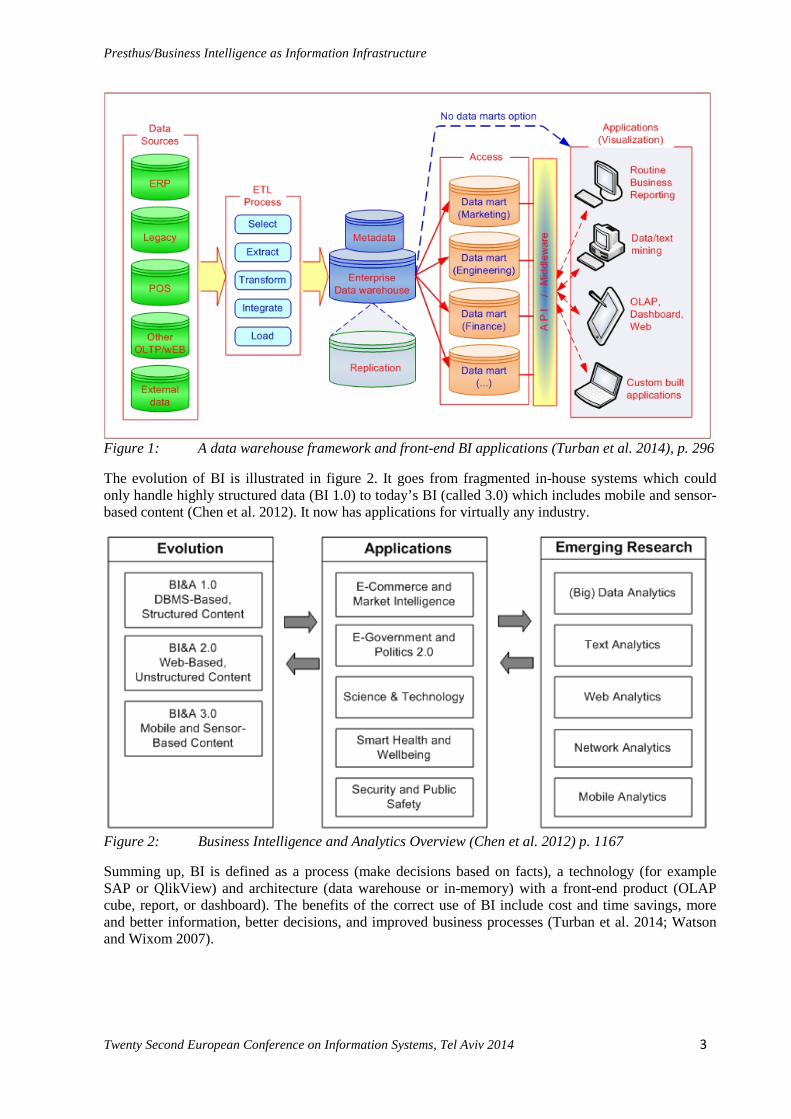
Figure 1: A data warehouse framework and front-end BI applications (Turban et al. 2014), p. 296
The evolution of BI is illustrated in figure 2. It goes from fragmented in-house systems which could only handle highly structured data (BI 1.0) to today’s BI (called 3.0) which includes mobile and sensor-based content (Chen et al. 2012). It now has applications for virtually any industry.
Figure 2: Business Intelligence and Analytics Overview (Chen et al. 2012) p. 1167
Summing up, BI is defined as a process (make decisions based on facts), a technology (for example SAP or QlikView) and architecture (data warehouse or in-memory) with a front-end product (OLAP cube, report, or dashboard). The benefits of the correct use of BI include cost and time savings, more and better information, better decisions, and improved business processes (Turban et al. 2014; Watson and Wixom 2007).
Presthus/Business Intelligence as Information Infrastructure
Twenty Second European Conference on Information Systems, Tel Aviv 2014 4
2.2 Limitations of the traditional view of BI
From the above section, we note that the focus is mainly on (1) implementing technology and (2) regarding the BI process as stepwise and linear with rational stakeholders.
Readers of traditional BI literature might be tempted to ask “what is BI not?” This question has not been frequently addressed. However Cindi Howson includes a few claims in her book, for example having a data warehouse in itself is not BI. Front-end tools are also needed. More interesting for this study is Howson’s belief that BI will fail if the people disregard the information and make decisions based on intuition and previous experience. Based on the brief review in section 2.1, one will note that this socio-technical view is missing from most of the BI literature, with some exceptions like Davenport’s book Information Ecology (Davenport 1997). Also, in a recent study, Henfridsson and Bygstad found that successful Information Infrastructures need to have self-reinforcing processes (Henfridsson and Bygstad 2013). These perspectives will be highlighted in the next section.
2.3 Alternative conceptualisation: BI as Information Infrastructure
An Information Infrastructure is defined as “…a shared, open (and unbounded), heterogeneous and evolving socio-technical system (which we call installed base) consisting of a set of IT capabilities and their user, operations and design communities” (Hanseth and Lyytinen 2010) p. 4. Shared, open (unbounded) means that several actors can access the system and (possibly) make changes. A change made by one actor will influence the work of the other actors, usually in the sense of adding value. Wikipedia is a good example; the value of its infrastructure increases with the number of contributors. Heterogeneous represent that the system has various types of technology and user groups, which are constantly evolving. The final characteristic, the evolving socio-technical system (the installed base), indicates that an Information Infrastructure does not have a clear start. It emerges from something: like the Internet builds on telecommunication, and Harvard’s internal student network (Facebook) turned into a global social media platform for individuals and companies. The installed base consists of technology, people, processes, communities and more. I return to the concept of installed base shortly.
Information Infrastructures face two challenges: bootstrapping and adaptation. Bootstrapping, as defined by Hanseth and Aanestad, is about getting the technology started by no external means; “bootstrapping yourself to the top”, or “lifting yourself by your own hair” (Hanseth and Aanestad 2003). Besides defining what bootstrapping means, perhaps the most interesting contribution of Hanseth and Aanestad’s paper is the focus on individual behaviour. They describe how some people might start to use a technology at an early stage, while others want to wait until a large group has started to use it. They also list aspects of technology which may influence a person’s willingness to use it (p. 390):
Availability: the users should have close contacts with designers Simplicity: the solutions should only provide essential functions and should be easy to learn Costs: the solutions should be cheap Flexibility: improvement should be possible without changing the whole solution Future oriented: low risk of lock-in
Adaption is explained by Hanseth and Lyytinen (2010): When the bandwagon starts rolling, the designers need to guarantee that the Information Infrastructure will grow adaptively and re-organize constantly with new connections between the components (p. 13). As a solution they propose a set of design principles for Information Infrastructure. The first three are for the bootstrap problem, and the last two for the adaptation problem (p. 6):
1. Design initially for usefulness 2. Draw upon existing installed base 3. Expand installed base by persuasive tactics 4. Make each IT capability simple 5. Modularize the Information Infrastructure by building separately its principal functions and sub-infrastructures using layering and gateways
Presthus/Business Intelligence as Information Infrastructure
Twenty Second European Conference on Information Systems, Tel Aviv 2014 5
Simply put; the installed base consists of a number of people using a certain technology (Shapiro and Varian 1999). The installed base from Hanseth’s Information Infrastructure theory builds on Complexity Science, which again has its roots from natural sciences and economics. Key concepts of Complexity Science are the self-reinforcing installed base and the lock-in effect. The self-reinforcing installed base is a cycle driven by positive feedback, as illustrated in figure 3. The figure illustrates standards but I find that it also illustrates the interplay between users and technology: when people use the technology, more functions will be produced, which will provide value to users, causing additional people to use the technology.
Figure 3: Standards reinforcement mechanism (Grindley, 1995, cited in Ciborra et al. (2000), p. 62)
The reinforcement mechanism illustrated in figure 3 above has a positive outcome. When the installed base of users grows, more and more users will want to use the technology. However, such a reinforcement of a technology may lead to a side-effect called lock-in. According to Shapiro and Varian’s book Information Rules, lock-in means that it would cost too much effort or money to change the current technology. The classic example of lock-in is the layout of our computer keyboard. The QWERTY style does not result in faster typing; this is inherited from the typewriter and was originally designed to actually slow the typist down to prevent the typebars from tangling. However, when computers took over for the typewriter, the users were already familiar with QWERTY. It made the switch to a PC easier, but also resulted in lock-in. The QWERTY keyboard is hard to get rid of today; it would result in a high switching cost (Shapiro and Varian 1999).
A loosely coupled architecture (Hanseth et al. 2012) may prevent lock-in. The Internet is an example of a loosely coupled architecture. In Zittrain’s book The Future of the Internet he focuses on how the layered architecture can be extensible by allowing new innovations and add-ons by a large community. By this approach, contradictory of a top-down management driven approach, “Good applications can then be adopted widely while bad ones are ignored” (Zittrain 2008) (p. 67). We can also call a layered architecture for an end-to-end architecture which may entail that “intelligence is in the fringes” (Hanseth and Nielsen 2013).
Summing up this review, I will view a BI solution as (1) an installed base, which must (2) be bootstrapped and (3) endure a continuous adaptation.
3. Method The overall approach is a case study (Yin 1994). Following Yin’s definition, I chose a case study because I have a “how question”; as a researcher I have little control over the events; and my focus is on contemporary phenomenon within a real-life context.
TINE (spelled with capital letters) was chosen as case company due to its relatively large (by Norwegian standards) BI department of six people, and because TINE benefits from successful
Presthus/Business Intelligence as Information Infrastructure
Twenty Second European Conference on Information Systems, Tel Aviv 2014 6
employment of its BI solution. As an example, TINE was a nominee for the BI award by the Norwegian Computer Society (however a Norwegian bank won the first price) in 2010. See logo in picture 4.
Figure 4: Picture and logo from http://www.jarlsberg.com/about-tine
The case company is 132 years old and is the largest producer, distributor, and exporter of dairy products (TINE SA, 2013). As found on their website (www.jarlsberg.com/about-tine):
TINE SA is organised as a cooperative owned by more than 15.000 Norwegian dairy farmers. Each member is a shareholder in the cooperative to which they deliver 1.4 billion litres of cow's milk and about 19 million litres of goat's milk every year. The milk is processed into more than 200 different products which are sold under the TINE trademark. The TINE Group also consists of several wholly owned and partially owned subsidiaries. Outside dairy products the group manufactures products ranging from ice cream, juice to marine products. The dairy cooperative is Norway's largest food manufacturer with a total of 5.485 employees and an annual turnover of NOK 19.7 billion for 2012.
Building on section 2, an interview guide was created which consisted of eight semi-structured questions. Questions 2 and 3 investigated the successful outcome. Key Information Infrastructure terms such as “installed base” were, however, modified into more descriptive, generic questions (please see appendix). Ten interviews were conducted on TINE’s premises, each lasting about thirty minutes (table 1). An assistant was present to type the answers in real-time. After the interview, this transcript was e-mailed to the participant for approval, additional comments, and quality assurance.
Participant# Title Years worked with BI 1 Manager (BI department) (BICC member) 10 in TINE, 15 in total 2 Systems engineer (BI department) 30 3 Systems engineer (BI department) 25 4 Systems engineer (BI department 25 5 Business controller (end-user) 7 6 Manager of branding (end-user) 9 months 7 Market analyst (end-user) 4 8 Business controller (end-user) 1 9 Team leader, Business Analytics (BICC member) 5 in TINE, 9 in total
10 Manager, Analytics (BICC member) 1 in TINE, 8 in total Table 1: Overview of participants in chronological order of interviews In addition to interviews, some of the participants demonstrated QlikView. I was also allowed to study internal documents of TINE’s architecture and business processes including a presentation of their BI solutions from 2005 to this day.
The collected data were analysed by building on the Ladder of Analytical Abstraction framework by Carney, 1990, cited in (Miles and Huberman 1994) p. 92. The Ladder of Analytical Abstraction has three levels. In the first level, I summarized my data (accumulated transcripts, print screens and documents). Level two consisted of arranging the interviews into a matrix, which constitutes a sound base for aggregating data (searching for themes and trends). In the third and final level, I synthesised the findings into explanations and lessons learned from studying TINE’s BI solution as an Information Infrastructure. Table 2 summarises this method section.
Presthus/Business Intelligence as Information Infrastructure
Twenty Second European Conference on Information Systems, Tel Aviv 2014 7
Step Action Outcome 1 Conduct literature review of BI
and Information Infrastructure Basics for semi-structured questions (appendix)
2 Collect data Documentation from TINE (processes, architecture) Interviews and observation at TINE’s premises
3 Analyse data Quotes, illustrations of TINE’s processes and BI architecture 4 Discuss findings Section 4 (How TINE’s BI successful solution can be
understood as an Information Infrastructure) 5 Conclude Section 5 (Lessons from TINE: three guidelines)
Table 2: Summary of method
4. Findings and discussion
Guided by the research question: How do we bootstrap and adapt a BI solution? this section describes the findings from the documentation and interviews. It also discusses how the findings relate to existing literature within Information Infrastructure and Business Intelligence.
4.1 TINE’s BI architecture
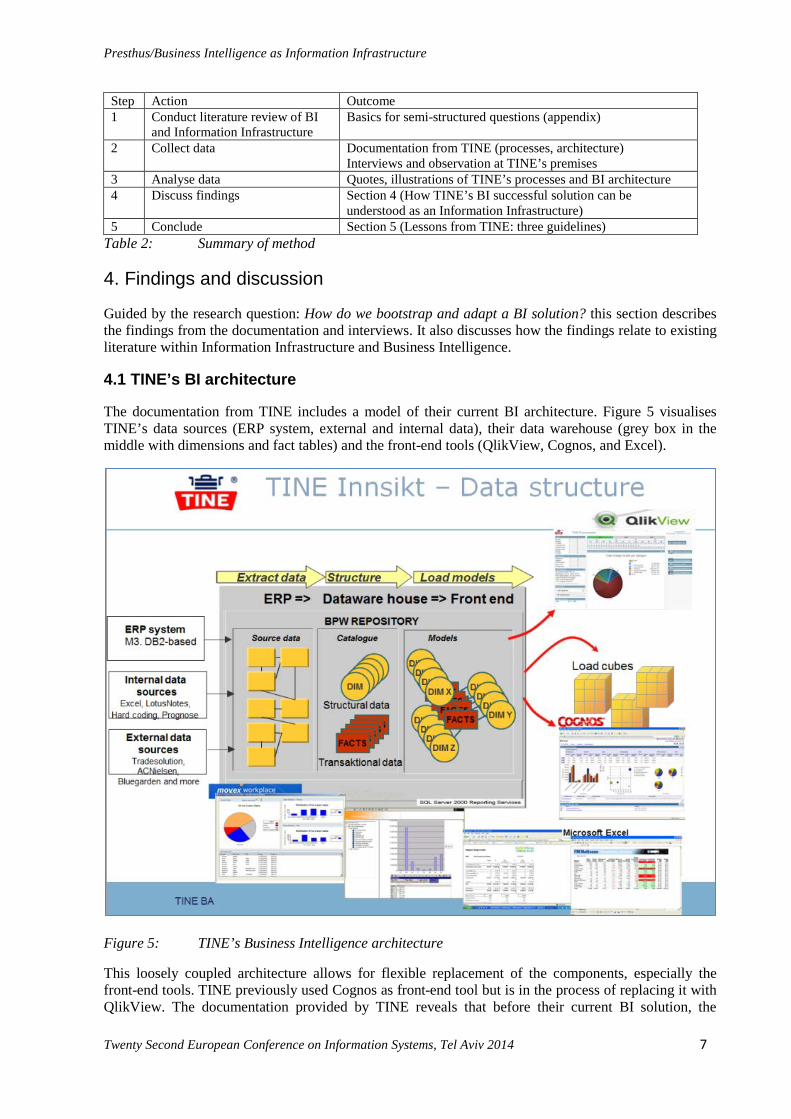
The documentation from TINE includes a model of their current BI architecture. Figure 5 visualises TINE’s data sources (ERP system, external and internal data), their data warehouse (grey box in the middle with dimensions and fact tables) and the front-end tools (QlikView, Cognos, and Excel).
Figure 5: TINE’s Business Intelligence architecture
This loosely coupled architecture allows for flexible replacement of the components, especially the front-end tools. TINE previously used Cognos as front-end tool but is in the process of replacing it with QlikView. The documentation provided by TINE reveals that before their current BI solution, the
Presthus/Business Intelligence as Information Infrastructure
Twenty Second European Conference on Information Systems, Tel Aviv 2014 8
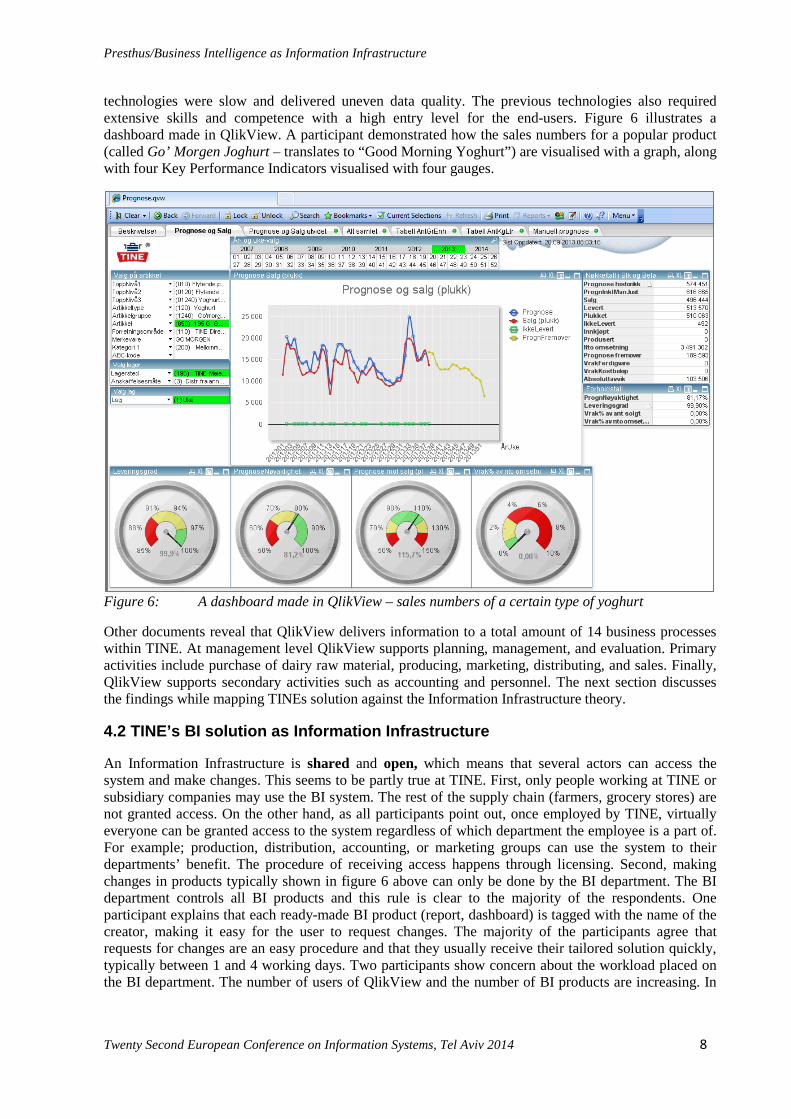
technologies were slow and delivered uneven data quality. The previous technologies also required extensive skills and competence with a high entry level for the end-users. Figure 6 illustrates a dashboard made in QlikView. A participant demonstrated how the sales numbers for a popular product (called Go’ Morgen Joghurt – translates to “Good Morning Yoghurt”) are visualised with a graph, along with four Key Performance Indicators visualised with four gauges.
Figure 6: A dashboard made in QlikView – sales numbers of a certain type of yoghurt
Other documents reveal that QlikView delivers information to a total amount of 14 business processes within TINE. At management level QlikView supports planning, management, and evaluation. Primary activities include purchase of dairy raw material, producing, marketing, distributing, and sales. Finally, QlikView supports secondary activities such as accounting and personnel. The next section discusses the findings while mapping TINEs solution against the Information Infrastructure theory.
4.2 TINE’s BI solution as Information Infrastructure
An Information Infrastructure is shared and open, which means that several actors can access the system and make changes. This seems to be partly true at TINE. First, only people working at TINE or subsidiary companies may use the BI system. The rest of the supply chain (farmers, grocery stores) are not granted access. On the other hand, as all participants point out, once employed by TINE, virtually everyone can be granted access to the system regardless of which department the employee is a part of. For example; production, distribution, accounting, or marketing groups can use the system to their departments’ benefit. The procedure of receiving access happens through licensing. Second, making changes in products typically shown in figure 6 above can only be done by the BI department. The BI department controls all BI products and this rule is clear to the majority of the respondents. One participant explains that each ready-made BI product (report, dashboard) is tagged with the name of the creator, making it easy for the user to request changes. The majority of the participants agree that requests for changes are an easy procedure and that they usually receive their tailored solution quickly, typically between 1 and 4 working days. Two participants show concern about the workload placed on the BI department. The number of users of QlikView and the number of BI products are increasing. In
Presthus/Business Intelligence as Information Infrastructure
Twenty Second European Conference on Information Systems, Tel Aviv 2014 9
September 2013, the number of BI products counted 231. Changes in these 231 BI products have to be handled by one among the six persons in the BI department.
Heterogeneous means that the system has various types of technology and various types of user groups. These characteristics are present at TINE. We recall from figure 5 that the BI technology consists of ERP-systems and other source data, as well as a data warehouse, and end-user tools like QlikView and Excel. Participant 1 informs that the ERP-system has been replaced three times during his/her working time. QlikView is currently replacing Cognos in a seamless manner. The reason for this successful evolvement is probably due to loosely coupled architecture and is further discussed below. Getting rid of Excel (another end-user BI tool) seems to be a more difficult task. This issue will also be discussed below. All participants mention that QlikView is used at all levels and for various business processes in TINE. Participant 10 highlights this fact as one of the reasons for the success in addition to QlikView delivering useful information tailored to various user groups. No official training courses are necessary for any user groups because QlikView is an intuitive tool. Participant 7 explains that the colleagues provide training for new employees and that the problem is more that some users are lazy, meaning that they are quick to ask their colleagues rather than exploring the system themselves. All participants agree that the users group have very different requests. For example, Participant 4 says; the controllers want to see “everything” in one report, so they can choose later. People in sales want only what they need.
The final characteristic of an Information Infrastructure, the evolving socio-technical (the installed base), indicates that an infrastructure will always build on existing technology, peoples’ competence, prior experience, and more. From the interviews at TINE, all participants at the BI department unanimously explain that the existing BI solution is built on Cognos and that their current ERP-system affects the BI solution. When asked whether this was positive or not, the participants have a somewhat different opinion. Participant 1 informs: Our ERP system affected the present solution. We could skip a few steps, but this did not affect us too much. We have replaced the ERP three times since I started, while Participant 2 sees it as an advantage; Cognos was the foundation for our current solution, but QlikView has new opportunities. Best of breed. Finally, Participant 3 from the BI department focuses on the user’s satisfaction: The users were rather satisfied with QlikView from the beginning. It is an intuitive tool. When asking the end-users, they also agree that QlikView is fast and easy to use and that they do not miss Cognos. It is worth mentioning that QlikView is not the only in-memory, intuitive tool on the market. Would TINE endure the same success with another technology with similar characteristics and functionalities as QlikView offers? This study does not answer this question and I briefly return to this in the limitations and further research section.
The fact that the number of users, along with the number of BI products, are increasing also indicates that the installed base is evolving. Participant 9 is concerned about the capacity of the BI department: we should have a stronger regime on important and less important products. Consequently, a Business Intelligence Competence Centre (BICC) was established in the beginning of 2013. The aim is to support the BI department. Currently, BICC counts 9 members from the BI department and managers of other departments. A BICC also constitutes a part of the installed base. Finally, one interesting fact emerged from the collected data: Each interviewed member of BI department has minimum 15 years of BI experience, and some up to 30 years. Unfortunately, my collected data does not reveal whether this is a strategy or a coincidence.
Summing up this section, TINE’s BI solution maps the Information Infrastructure theory as heterogeneous, evolving, socio-technical installed base. It is considered a huge success by all participants. However, TINE’s solution is less open and shared because only users employed TINE can use it, and they also need a licence. Once given a licence, they can only drill down into the reports and graphs; they cannot make changes to QlikView. On the other hand, requests are handled professionally and (usually) quickly by the BI department. According to Participant 2; QlikView is the best that has happened to TINE since the low-fat milk. The next section will investigate this success in more detail using underlying Information Infrastructure literature.
Presthus/Business Intelligence as Information Infrastructure
Twenty Second European Conference on Information Systems, Tel Aviv 2014 10
4.3 Bootstrapping
The Complexity Science Theory is comprehensive, but I focus on the concept of Self-reinforcing Installed Base. As illustrated in figure 3 above, this is not a linear process with a clear start and end, but a perpetual cycle which constantly adds value for the users, which again results in more users. Each new user of the technology will contribute to the value for the existing users (Hanseth and Aanestad 2003). This brings us to the issue of bootstrapping. If the value of the technology depends of the number of users, how do we get the snowball running? It is like a chicken-egg problem. You need users to increase the value of the technology but it may be hard to recruit users if only a few is using it.
From the BI literature, Howson (2014) argues that you may create your BI system, but this does not automate success or value. In other words: people need to use the BI system in order for it to be a success. And when people use the system, more functions and resources will be put back into the system, which again will result in more value for the end-user.
At TINE, this installed base consists of (amongst other) all employees of TINE, who can be granted access to QlikView upon request. In addition to QlikView, there are other technologies such as ERP, Lotus Notes, Excel and more (recall figure 5). The knowledge and skills of each employee is also part of the installed base. My data indicate no trace of bootstrapping problems. The participants all agree that they do not miss Cognos, and that the users like QlikView and were happy to use it from the very beginning. The explanations from the participants are also in unison: the users experienced easy and fast access to data. Another reason could also be that the end-users were already familiar with BI technology such as Cognos.
4.4 Adaptation
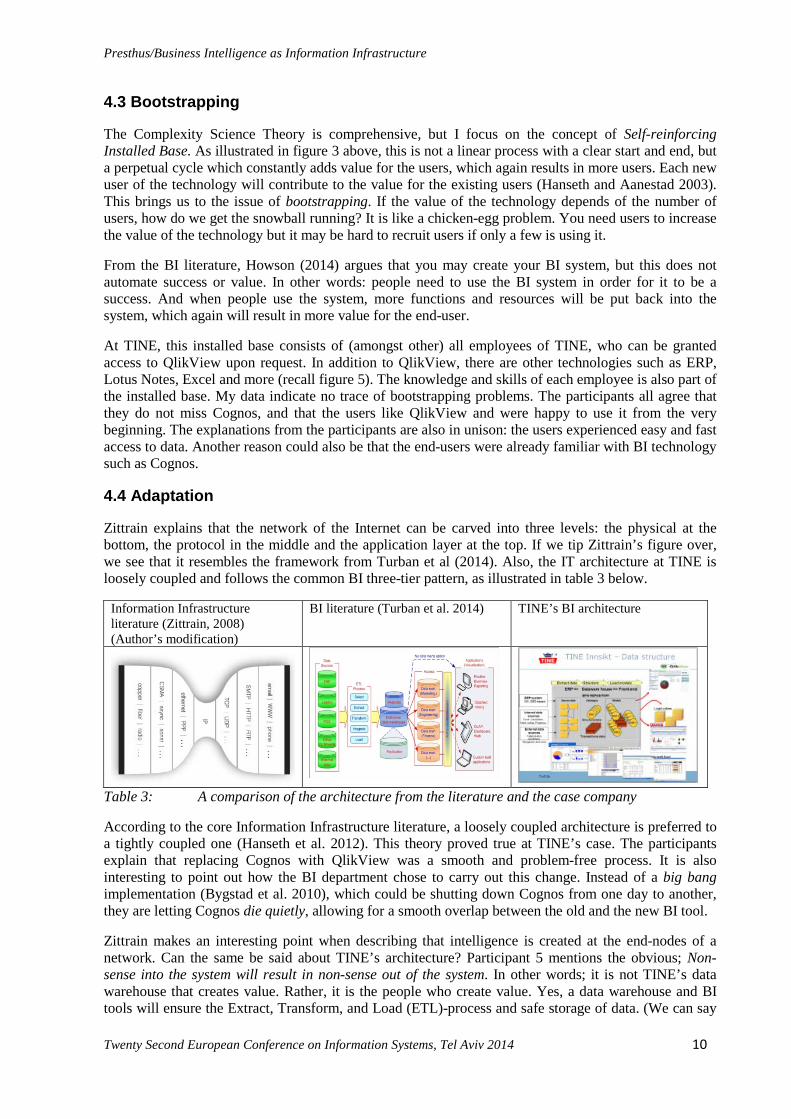
Zittrain explains that the network of the Internet can be carved into three levels: the physical at the bottom, the protocol in the middle and the application layer at the top. If we tip Zittrain’s figure over, we see that it resembles the framework from Turban et al (2014). Also, the IT architecture at TINE is loosely coupled and follows the common BI three-tier pattern, as illustrated in table 3 below.
Information Infrastructure literature (Zittrain, 2008) (Author’s modification)
BI literature (Turban et al. 2014) TINE’s BI architecture
Table 3: A comparison of the architecture from the literature and the case company
According to the core Information Infrastructure literature, a loosely coupled architecture is preferred to a tightly coupled one (Hanseth et al. 2012). This theory proved true at TINE’s case. The participants explain that replacing Cognos with QlikView was a smooth and problem-free process. It is also interesting to point out how the BI department chose to carry out this change. Instead of a big bang implementation (Bygstad et al. 2010), which could be shutting down Cognos from one day to another, they are letting Cognos die quietly, allowing for a smooth overlap between the old and the new BI tool.
Zittrain makes an interesting point when describing that intelligence is created at the end-nodes of a network. Can the same be said about TINE’s architecture? Participant 5 mentions the obvious; Non-sense into the system will result in non-sense out of the system. In other words; it is not TINE’s data warehouse that creates value. Rather, it is the people who create value. Yes, a data warehouse and BI tools will ensure the Extract, Transform, and Load (ETL)-process and safe storage of data. (We can say
Presthus/Business Intelligence as Information Infrastructure
Twenty Second European Conference on Information Systems, Tel Aviv 2014 11
that the ETL-process in BI in a way corresponds with standardisation issue in Information Infrastructure). But it is the people who are the ones providing the information in the source data at the very right of figure 5 as well as making use of the reports and dashboards coming out of the other end.
The Information Infrastructure literature reads that there is a tension between control and innovations. The management needs to control the technology in order to avoid lock-ins and other unwanted consequences such as digital piracy on the Internet. On the other hand, intelligence is found in the fringes of an architecture (Hanseth and Nielsen 2007) meaning that people must be allowed to contribute to create value.
I was curious about the extensive use of Excel when I first started this study. We recall that it is the most common BI end-user tool (Watson 2009). My point of departure was that this was an example of lock-in in the negative sense; in that it would slow down the BI process (like the QWERTY keyboard slows down the typist). The employees at TINE are already experienced with Excel, and the participants also inform that their customers prefer to get reports in the Excel format. Participant simply 9 states; It is impossible to remove Excel. The extensive use of Excel troubles the BI department more than the end-users who “cannot live without it” and “I would miss it if it was taken away from me”.
Having completed this study, I have a new perspective on Excel. Yes, Excel is probably an example of lock-in at TINE. The good news is that it is possible to benefit from a lock-in (Shapiro and Varian 1999). Several researchers (for example Hanseth and Lyytinen, 2010) believe that it is the simple end-to-end architecture of the Internet which has proven critical for its adaptive growth. This is because the “intelligence” is being placed into the end nodes, a point also shared by Zittrain. The end-user participants (5-8) of this study explain that they prefer to transport their data into Excel in order to perform further analysis. This analysis is in fact a type of intelligence, which BI is all about. The drawback is that this individual work does not necessarily contribute to the installed base of TINE. Each user guards her/his own spreadsheet, and it is difficult for others to benefit. The BI department at TINE does have a plan: if they observe employees using Excel, they try to demonstrate that the same tasks can be done in QlikView. One participant tells that one boss in TINE has the mission of becoming the Excel-killer. This plan can be wise, provided that the employees can perform their same data analysis in QlikView. If not, it may be wiser to let the end-users work with Excel and then make sure that they upload it in their shared database called TINE Finn (translates to TINE Find), where all employees may store and share their spread-sheets and other documents.
4.5 Summing up
The collected data from this study illustrates that TINE’s current BI solution is a success. The evidence is shaped in the sense that the solution is both bootstrapped and adapted. Tables 4 and 5 below explain in more detail, comparing TINE’s BI solution to each design principle from Hanseth and Lyytinen’s study (Hanseth and Lyytinen 2010):
The bootstrap problem (p.6) TINE’s successful BI solution 1. Design initially for usefulness
TINE’s users immediately found the new solution useful, mainly because they could access data faster and thus work more effectively.
2. Draw upon existing installed base
TINE had an installed base consisting of technology (Cognos and ERP-system) as well as a highly competent BI department and end-users who were accustomed with Cognos.
3. Expand installed base by persuasive tactics
There was a training session, and online guidelines which can be accessed by any TINE employee. If a user is spotted using Excel, the BI team demonstrates what QlikView can do.
Table 4: Bootstrapping in Information Infrastructure compared to findings at TINE
TINE experienced a positive feed-back loop: the installed base lead to new BI solution which again led to useful information for the users. This positive feed-back loop enabled the bootstrapping of the current BI solution.
Presthus/Business Intelligence as Information Infrastructure
Twenty Second European Conference on Information Systems, Tel Aviv 2014 12
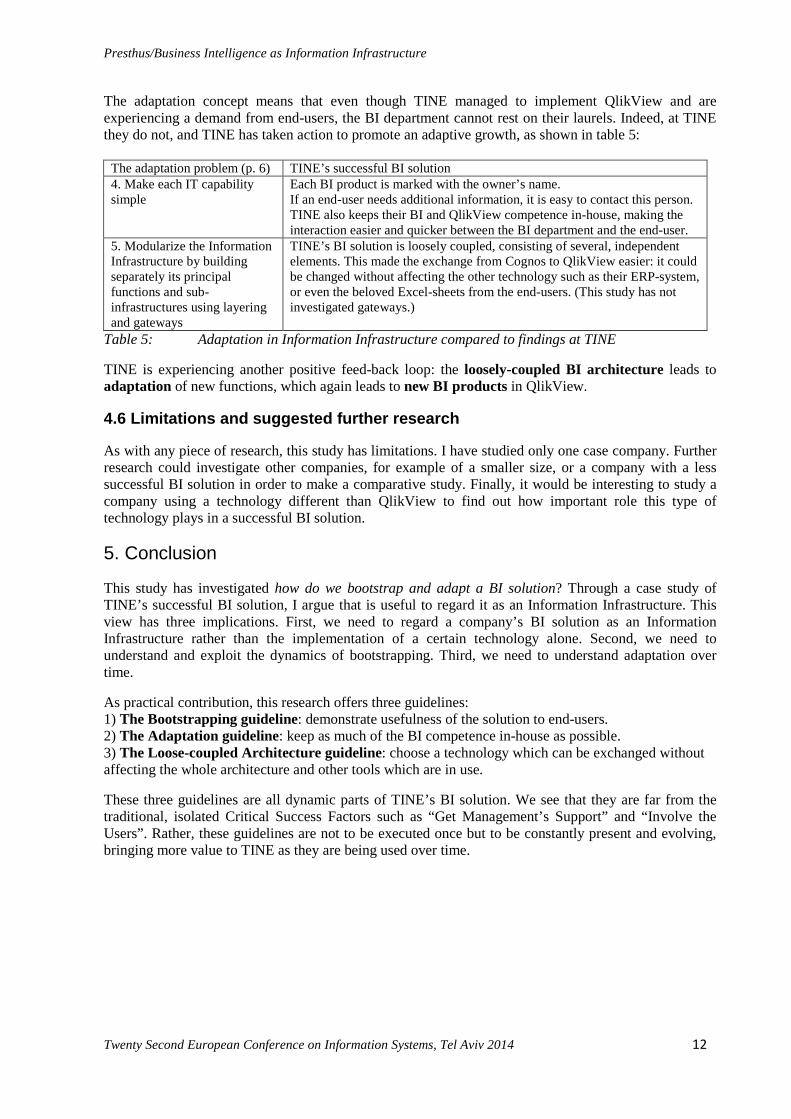
The adaptation concept means that even though TINE managed to implement QlikView and are experiencing a demand from end-users, the BI department cannot rest on their laurels. Indeed, at TINE they do not, and TINE has taken action to promote an adaptive growth, as shown in table 5:
The adaptation problem (p. 6) TINE’s successful BI solution 4. Make each IT capability simple
Each BI product is marked with the owner’s name. If an end-user needs additional information, it is easy to contact this person. TINE also keeps their BI and QlikView competence in-house, making the interaction easier and quicker between the BI department and the end-user.
5. Modularize the Information Infrastructure by building separately its principal functions and sub-infrastructures using layering and gateways
TINE’s BI solution is loosely coupled, consisting of several, independent elements. This made the exchange from Cognos to QlikView easier: it could be changed without affecting the other technology such as their ERP-system, or even the beloved Excel-sheets from the end-users. (This study has not investigated gateways.)
Table 5: Adaptation in Information Infrastructure compared to findings at TINE
TINE is experiencing another positive feed-back loop: the loosely-coupled BI architecture leads to adaptation of new functions, which again leads to new BI products in QlikView.
4.6 Limitations and suggested further research
As with any piece of research, this study has limitations. I have studied only one case company. Further research could investigate other companies, for example of a smaller size, or a company with a less successful BI solution in order to make a comparative study. Finally, it would be interesting to study a company using a technology different than QlikView to find out how important role this type of technology plays in a successful BI solution.
5. Conclusion
This study has investigated how do we bootstrap and adapt a BI solution? Through a case study of TINE’s successful BI solution, I argue that is useful to regard it as an Information Infrastructure. This view has three implications. First, we need to regard a company’s BI solution as an Information Infrastructure rather than the implementation of a certain technology alone. Second, we need to understand and exploit the dynamics of bootstrapping. Third, we need to understand adaptation over time.
As practical contribution, this research offers three guidelines: 1) The Bootstrapping guideline: demonstrate usefulness of the solution to end-users. 2) The Adaptation guideline: keep as much of the BI competence in-house as possible. 3) The Loose-coupled Architecture guideline: choose a technology which can be exchanged without affecting the whole architecture and other tools which are in use.
These three guidelines are all dynamic parts of TINE’s BI solution. We see that they are far from the traditional, isolated Critical Success Factors such as “Get Management’s Support” and “Involve the Users”. Rather, these guidelines are not to be executed once but to be constantly present and evolving, bringing more value to TINE as they are being used over time.
Presthus/Business Intelligence as Information Infrastructure
Twenty Second European Conference on Information Systems, Tel Aviv 2014 13
Acknowledgements
Gratitude goes to the associate editor and the two anonymous reviewers at ECIS for providing thorough and useful reviews. Professor Bendik Bygstad at the University of Oslo contributed throughout the study and I am forever grateful. I thank my two assistants, Bjørnar Mæland and Andreas Biørn-Hansen, who eased the data collection by “typing faster than their own shadows” during the interviews at TINE. Last, but not least, I thank the participants at TINE for granting me time to visit, observe, and interview at their premises.
References
Ariyachandra, T., and Watson, H. J. (2006). Which Data Warehouse Architecture Is Most Successful? Business Intelligence Journal, 11(1), 4-7.
Bygstad, B., Nielsen, P., and Munkvold, B. E. (2010). Four integration patterns: a socio-technical approach to integration in IS development projects. Information Systems Journal, 20(1), 53-80.
Chen, H., Chiang, R. H. L., and Storey, V. C. (2012). Business Intelligence and Analytics: from Big Data to Big Impact. MIS Quarterly, 36(4), 1165-1188.
Ciborra, C., Braa, K., Cordella, A., Dahlbom, B., Failla, A., Hanseth, O., Hepsø, V., Ljungberg, J., Monteiro, E., and Simon, K. A. (2000). From Control to Drift: the Dynamics of Corporate Information Infrastructures: Oxford University Press.
Davenport, T. H. (1997). Information Ecology. Mastering the Information and Knowledge Environment.: Oxford University Press.
Davenport, T. H. (2006). Competing on Analytics. Harvard Business Review (January 2006). Davenport, T. H. (2010). Business intelligence and organizational decisions. International Journal of
Business Intelligence Research, 1(1), 1-12. Davenport, T. H., Harris, J. G., De Long, D. W., and Jacobsen, A. L. (2001). Data to Knowledge to
Results: Building an Analytic Capability. California Management Review, 43(2), 117-138. Hanseth, O. (2001). Gateways - just as important as standards. How the Internet won the "religious war"
about standards in Scandinavia. Knowledge, Technology, & Policy, 14(3), 71 - 89. Hanseth, O., and Aanestad, M. (2003). Design as Bootstrapping. On the Evolution of ICT Networks in
Health Care. Methods Inf Med, 4, 385-391. Hanseth, O., Bygstad, B., and Johannesen, L. K. (2012). Towards a Theory of Generative Architectures.
A Longitudinal Study of eHealth Infrastructures in Norway. Working paper. Hanseth, O., and Lyytinen, K. (2010). Design theory for dynamic complexity in information
infrastructures: the case of building internet. Journal of Information Technology, 25, 1-19. Hanseth, O., and Nielsen, P. (2013). Infrastructural Innovation. Flexibility, Generativity and the Mobile
Internet. International Journal of IT Standards and Standardization Research, 11(1), 27-45.
Henfridsson, O., and Bygstad, B. (2013). The Generative Mechanisms of Digital Infrastructure Evolution. MIS Quarterly, 37(3), 907-931.
Howson, C. (2014). Successful Business Intelligence: Unlock the Value of BI and Big Data: McGraw-Hill Education.
Miles, M. B., and Huberman, A. M. (1994). Qualitative Data Analysis: Sage Publications. Overby, E., Bharadwaj, A., and Sambamurthy, V. (2006). Enterprise agility and the enabling role of
information technology. European Journal of Information Systems, 15, 120–131. Porter, M. E. (2001). Strategy and the Internet. Harvard Business Review, 1-20. Power, D. J. (2007). A Brief History of Decision Support Systems, version 4.0, March 10, 2007. Presthus, W., Ghinea, G., and Utvik, K.-R. (2012). The More, the Merrier? The Interaction of Critical
Success Factors in Business Intelligence Implementations. International Journal of Business Intelligence Research, 3(2).
Schlegel, K., Sallam, R. L., Yuen, D., and Tapadinhas, J. (2013). Magic Quadrant for Business Intelligence and Analytics Platforms, Gartner Group, pp. 1-57.
Presthus/Business Intelligence as Information Infrastructure
Twenty Second European Conference on Information Systems, Tel Aviv 2014 14
Shapiro, C., and Varian, H. R. (1999). Information rules: a strategic guide to the network economy: Harvard Business Press.
Shollo, A., and Kautz, K. (2010). Towards an Understanding of Business Intelligence. ACIS 2010 Proceedings. Paper 86. 21st Australasian Conference on Information Systems, Brisbane, Australia
Turban, E., Sharda, R., and Delen, D. (2014). Decision Support and Business Intelligence Systems: Pearson New International Edition.
Watson, H. J. (2009). Tutorial: Business Intelligence – Past, Present, and Future. Communications of the AIS, 25(1), Article 39.
Watson, H. J., and Wixom, B. H. (2007). The Current State of Business Intelligence. IEEE Computer Society (September 2007), 96-99.
Yin, R. K. (1994). Case study research. Design and Methods 2nd ed.: Sage Publications, Inc. Zittrain, J. L. (2008). The Future of the Internet - and How to Stop it: Yale University Press.
Appendix: semi-structured interview at TINE
For the BI department:
1. How do you define BI? 2. To what extent do you think that your BI solution is successful? (Ex: provides reliable data, saves
costs, more satisfied customers) 3. Why do you think it is a success (or less successful)? 4. Who uses the BI solution? (Can anyone use it? Can the user tailor the solution to her/his needs?) 5. Who can make changes in the BI solution? 6. The users from question 6: how do they differ? 7. Was the solution built from scratch? (What kind of training did the users get? What solutions did
you have prior to your current BI solution? Are there any old habits/procedures you do not get rid of?)
8. Do you still use Excel in TINE?
For the end-users of BI products question 7 was changed:
7. What kind of training did you receive for the current BI solution (Do you miss the old solution)?
For the members of BICC question 9 was added:
9. You are a member of BICC. Why was it established? What is the role of BICC?