41
The Current State of the Capital Markets Breakfast Forum September 2015
| Date post: | 12-Apr-2017 |
| Category: |
Business |
| Upload: | boyarmiller |
| View: | 439 times |
| Download: | 2 times |

The Current Stateof the Capital Markets
Breakfast Forum
September 2015

May 3, 2023
Drew KanalyChairman
Protect,
Perform
Preserve,
Investment Management | Financial and Estate Planning | Trustee Services
September 15, 2015

Copyright 2015 Kanaly Trust. All rights reserved.
Deeper Dive Into the DDM
Dividend Discount Model (DDM) A DCF model that states the estimated value of a stock is the discounted value of all future dividends
THE DDM EQUATION The Dividend Discount Model (DDM) states that the estimated value (per share) of a stock today is the discounted value of all future dividends:
Estimated Value of a stock today
= v — D1 + D2 + D3 + • + D. ° (1 + h) (1 + V (1+h)3 (1 + kr
= ' D N---% t
(1 + 10`
(10-2)
= Dividend discount model
where: D1, D2, .. = the dividends expected to be received in each future period h = the required rate of return for this stock, which is the discount rate applicable for an investment with this degree of riskiness (the opportunity cost of a comparable risk alternative)
Where D does not equal “The Donald”

Copyright 2015 Kanaly Trust. All rights reserved.
Exploring the Efficient Frontier
Coffee Cans to Warp Drive…
Copyright 2015 Kanaly Trust. All rights reserved.
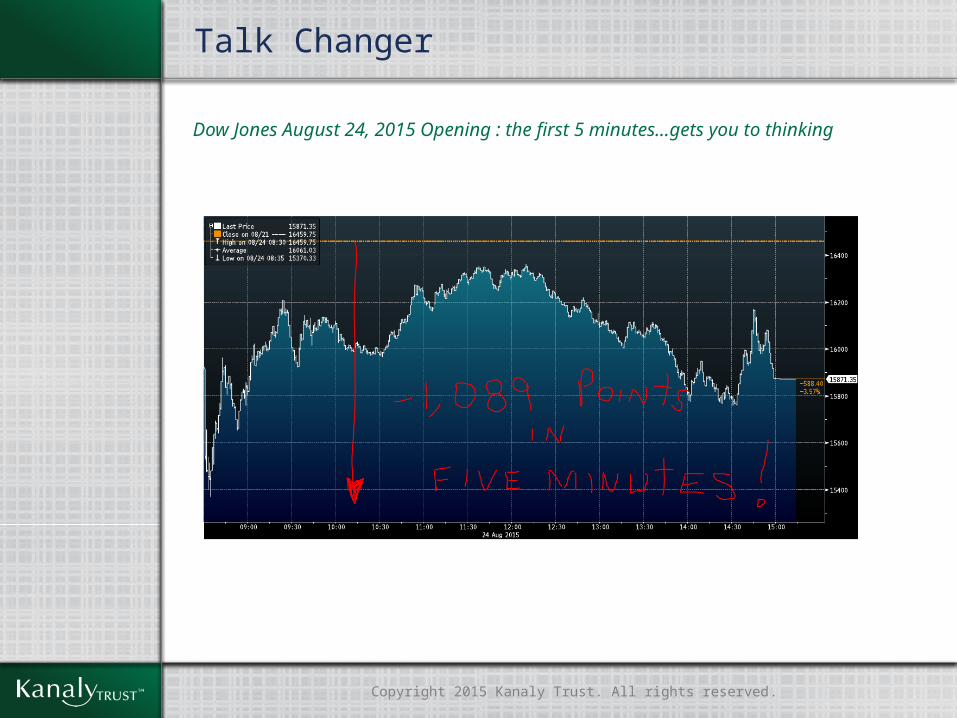
Talk Changer
Dow Jones August 24, 2015 Opening : the first 5 minutes…gets you to thinking

Copyright 2015 Kanaly Trust. All rights reserved.
Equity Market Correction First significant market correction in 46 months (3rd longest without a 10% decline in history)

Copyright 2015 Kanaly Trust. All rights reserved.
Spike in Equity Market Volatility
Copyright 2015 Kanaly Trust. All rights reserved.
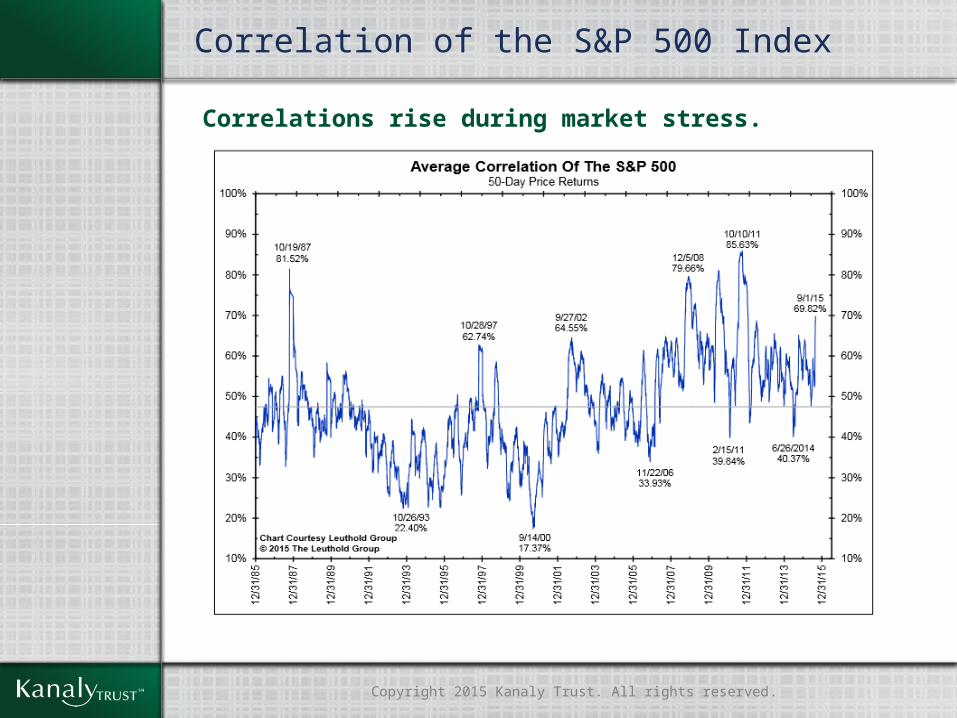
Correlation of the S&P 500 Index
Correlations rise during market stress.
Copyright 2015 Kanaly Trust. All rights reserved.
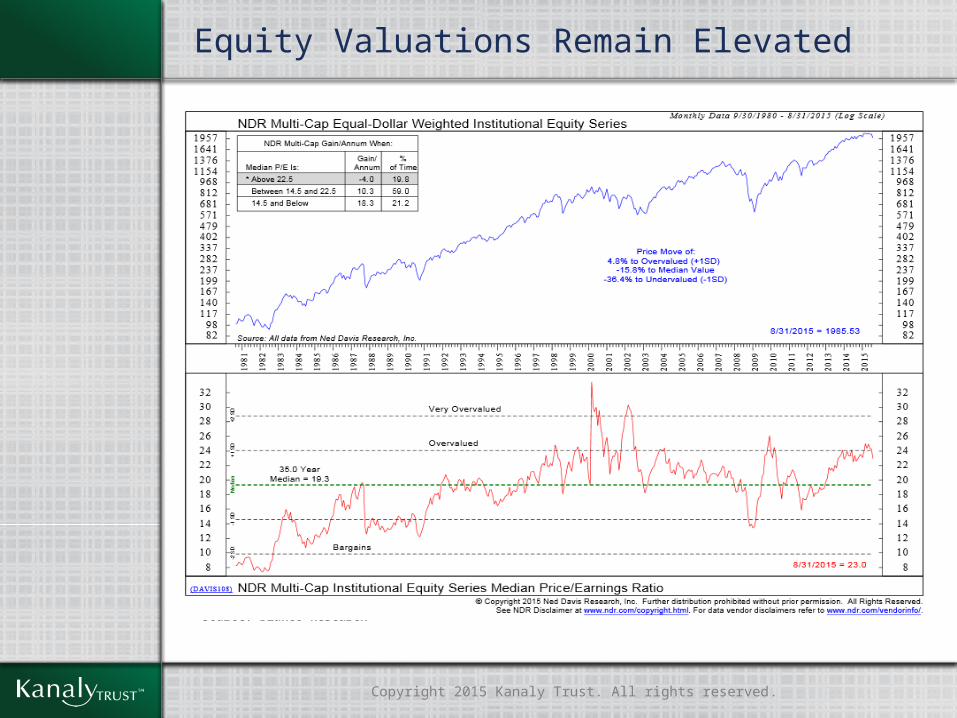
Equity Valuations Remain Elevated
Source: Bianco Research

Copyright 2015 Kanaly Trust. All rights reserved.
Little Earnings Growth in 2015One year ago, consensus called for 10% growth in S&P 500 earnings; now revised down to no growth.
Source: Bianco Research

Copyright 2015 Kanaly Trust. All rights reserved.
Credit Leads StocksCredit spread widening was a warning to equity investors.

Copyright 2015 Kanaly Trust. All rights reserved.
Commodity Super Cycle is Over

13
THE CURRENT STATE OF THE CAPITAL MARKETSMIDDLE MARKET M&A + PRIVATE EQUITY
UPDATE
COLT LUEDDE | MANAGING DIRECTOR | SEPTEMBER 2015

14
What Was Expected in 2015?Corporate Buyers Private Equity Groups
M&A Activity and Pricing Equal To or Higher than Prior Year
2015 2014
85% 84%
2015 2014
94% 89%
Source: Deloitte 2015 M&A Trend Report; KPMG 2015 M&A Outlook Survey Report
Increased Pursuit of Divestitures or Exits 2015 2014
39% 32%
2015 2014
74% 68%
Expect to Pursue Foreign Acquisitions 2015 2014
74% 59%
2015 2014
73%
85%
Expected Foreign Markets
Deloitte KPMG
29.2% 28.1%
24.7% 15.9%
20.4% 20.4%
84.0% 62.0%
36.0%

15
Less than $250 million 77%
$250 million to $499 million 12% $500 million to $999 million 5% $1 billion to $5 billion 3% Don't know 2% Greater than $5 billion 1%
Lower Middle Market Interest Continues
AVERAGE ENTERPRISE VALUE PER ACQUISITION 2014
AVERAGE ENTERPRISE VALUE PER ACQUISITION 2015
Less than $250 million 50%
$250 million to $499 million 27% $500 million to $999 million 16% $1 billion to $5 billion 6% Don't know 0% Greater than $5 billion 1%
Source: KPMG 2015 M&A Outlook Survey Report

16
2015 M&A Activity and Value Drivers
Large Cash Balances / Commitments Opportunities in Emerging Markets Robust Credit Market Consumer Confidence Improving Equity Markets Other
40%
19%
16%
13%
8%
4%
64% = Capital Availability
Source: KPMG 2015 M&A Outlook Survey Report; Golub Capital Middle Market Report
17
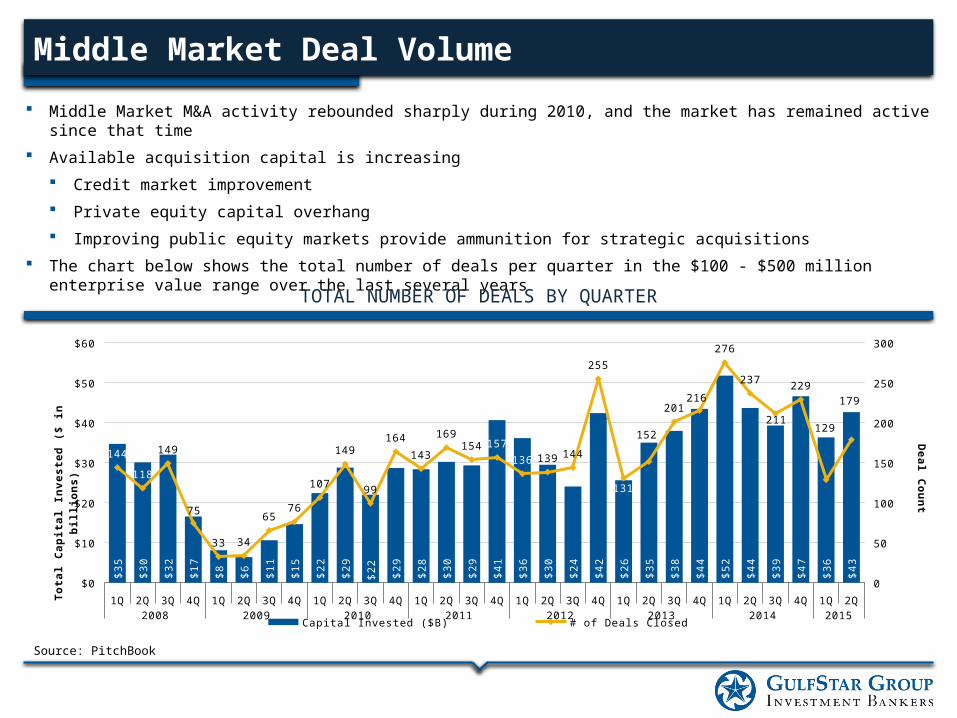
Middle Market M&A activity rebounded sharply during 2010, and the market has remained active since that time Available acquisition capital is increasing
Credit market improvement Private equity capital overhang Improving public equity markets provide ammunition for strategic acquisitions
The chart below shows the total number of deals per quarter in the $100 - $500 million enterprise value range over the last several years
Middle Market Deal Volume
TOTAL NUMBER OF DEALS BY QUARTER
Source: PitchBook
1Q 2Q 3Q 4Q 1Q 2Q 3Q 4Q 1Q 2Q 3Q 4Q 1Q 2Q 3Q 4Q 1Q 2Q 3Q 4Q 1Q 2Q 3Q 4Q 1Q 2Q 3Q 4Q 1Q 2Q2008 2009 2010 2011 2012 2013 2014 2015
$0
$10
$20
$30
$40
$50
$60
0
50
100
150
200
250
300
$35
$30
$32
$17
$8 $6 $11
$15
$22
$29
$22
$29
$28
$30
$29
$41
$36
$30
$24
$42
$26
$35
$38
$44
$52
$44
$39
$47
$36
$43
144
118
149
75
33 34
6576
107
149
99
164
143
169154 157
136 139 144
255
131
152
201216
276
237
211
229
129
179
Capital Invested ($B) # of Deals Closed
Tota
l Cap
ital
Inve
sted
($ in
bill
ions
)D
eal Count
18
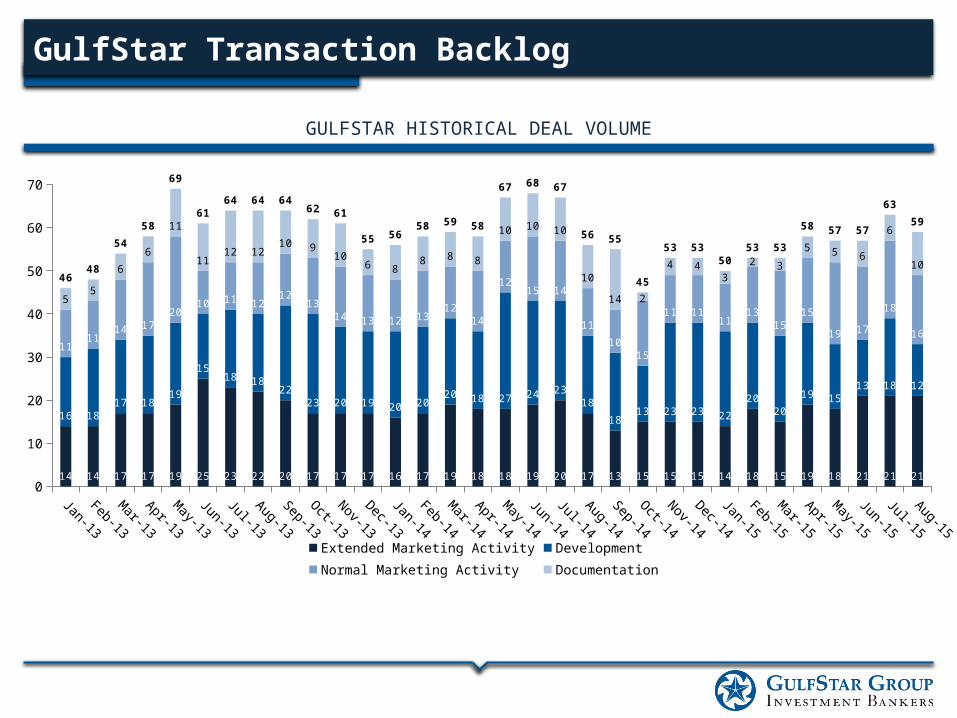
GulfStar Transaction Backlog
GULFSTAR HISTORICAL DEAL VOLUME
Jan-13Feb-13
Mar-13
Apr-13
May-13
Jun-13Jul-13
Aug-13
Sep-13Oct-13
Nov-13
Dec-13Jan-14
Feb-14Mar-14
Apr-14
May-14
Jun-14Jul-14
Aug-14
Sep-14Oct-14
Nov-14
Dec-14Jan-15
Feb-15Mar-15
Apr-15
May-15
Jun-15Jul-15
Aug-15
0
10
20
30
40
50
60
70
14 14 17 17 19 25 23 22 20 17 17 17 16 17 19 18 18 19 20 17 13 15 15 15 14 18 15 19 18 21 21 21
16 1817 18
19
1518 18
2223 20 19 20 20
20 18 27 24 2318
1813 23 23 22
2020
19 1513 18 12
1111
14 1720
10 11 1212
1314 13 12 13
1214
1215 14
11
1015
11 1111
1315
15
19 17
18
16
55
6
6
11
1112 12
10 910
6 88 8 8
10 10 10
10
14 2
4 43
2 35 5 6
6
1046
48
54
58
69
6164 64 64
62 61
55 5658 59 58
67 68 67
56 55
45
53 5350
53 53
58 57 57
63
59
Extended Marketing Activity Development Normal Marketing Activity Documentation
19
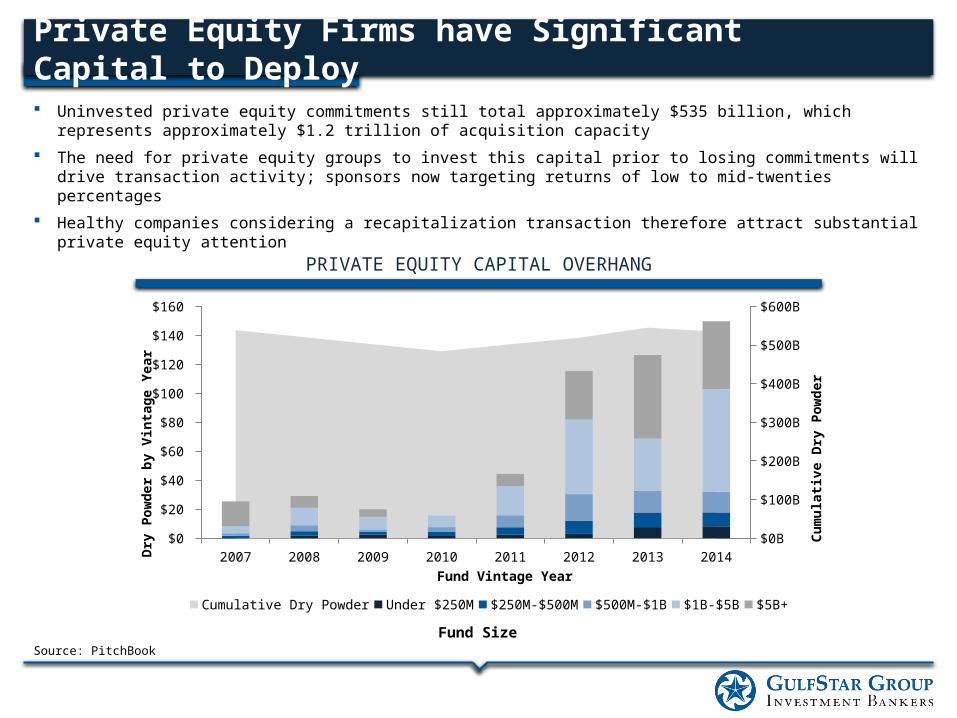
Private Equity Firms have Significant Capital to Deploy
PRIVATE EQUITY CAPITAL OVERHANG
Uninvested private equity commitments still total approximately $535 billion, which represents approximately $1.2 trillion of acquisition capacity
The need for private equity groups to invest this capital prior to losing commitments will drive transaction activity; sponsors now targeting returns of low to mid-twenties percentages
Healthy companies considering a recapitalization transaction therefore attract substantial private equity attention
Source: PitchBook
2007 2008 2009 2010 2011 2012 2013 2014$0
$20
$40
$60
$80
$100
$120
$140
$160
$0B
$100B
$200B
$300B
$400B
$500B
$600B
Cumulative Dry Powder Under $250M $250M-$500M $500M-$1B $1B-$5B $5B+
Dry
Pow
der b
y Vi
ntag
e Ye
ar
Fund Vintage Year
Cum
ulati
ve D
ry P
owde
r
Fund Size

20
S&P 500 Dry Powder Analysis
QUARTERLY CASH & SHORT-TERM INVESTMENTS S&P 500 (EX-FINANCIALS)
Source: FactSet Cash & Investment Quarterly
Aggregate Cash Grew 7%: The S&P 500 (ex-Financials) cash and marketable securities balance grew 6.6% year-over-year to a balance of $1.34 trillion at the end of Q1. However, cash declined sequentially by 4.7%, primarily as a result of Verizon Communications closing its acquisition of the remaining stake of Verizon Wireless. This marked the first sequential decline since Q2 2012.
Free Cash Flow Grew 9%: Cash flows from operations amounted to $282.0 billion in Q1, which marked an increase of 7.4% year-over-year. Free cash flow to equity increased by 8.7%.
Capital Expenditures Grew 6%: Capital expenditures (“CapEx”) accelerated growth to 6.2% in Q1. In the past four quarters, growth had not exceeded 1.5%. Analysts project that the 2014 growth rate for CapEx will be 6.7%, but also predict it will turn negative in 2015 (-1.2%)
Net Debt Issuance Positive for Fifteenth Straight Quarter: Cash inflows from net debt issuance were positive for the fifteenth straight quarter. Inflows of $74.1 billion were the second highest quarterly amount over that period.
Net Shareholder Distributions Grow 46%: Shareholder distributions in the form of dividends and net repurchase of stock ($193.8 billion) increased 45.8% year-over-year in Q1. Individually, gross share repurchases grew over 50% in Q1.
21
All $10-25 M $25-50 M $50-100 M $100-250 M0%
10%
20%
30%
40%
50%
60%
70%
80%
90%
100%
46.5% 41.7%47.5% 51.4%
45.8%
14.7%18.0%
15.5% 12.0%12.2%
38.4% 40.3% 37.0% 36.5%41.9%
Equity Sub Debt Senior Debt
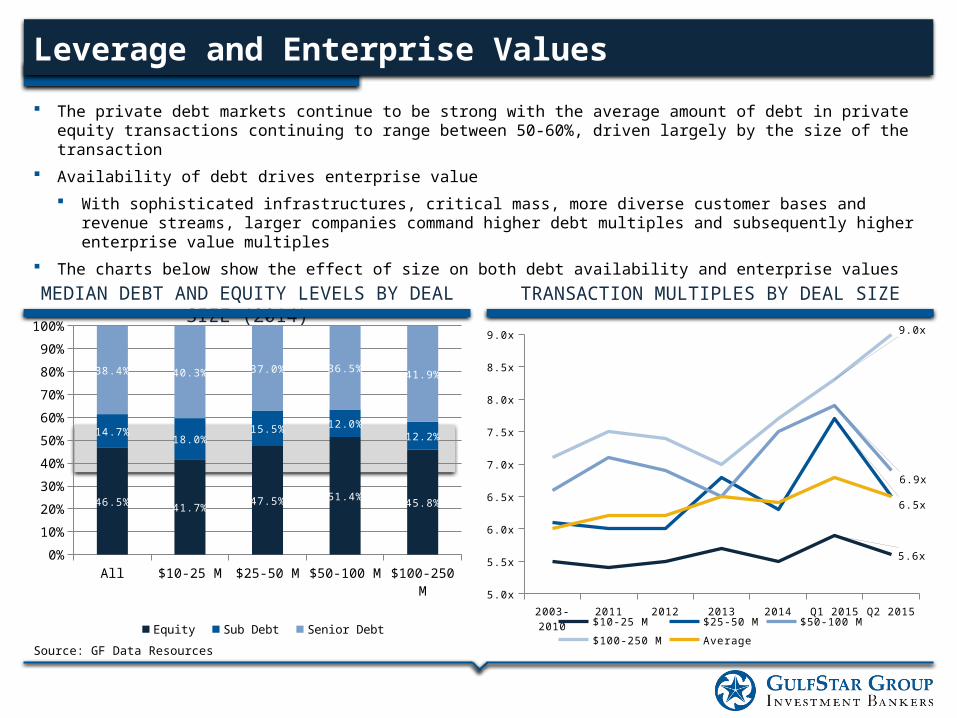
Leverage and Enterprise Values The private debt markets continue to be strong with the average amount of debt in private equity transactions continuing to range
between 50-60%, driven largely by the size of the transaction Availability of debt drives enterprise value
With sophisticated infrastructures, critical mass, more diverse customer bases and revenue streams, larger companies command higher debt multiples and subsequently higher enterprise value multiples
The charts below show the effect of size on both debt availability and enterprise values
MEDIAN DEBT AND EQUITY LEVELS BY DEAL SIZE (2014)
TRANSACTION MULTIPLES BY DEAL SIZE
Source: GF Data Resources
2003-2010 2011 2012 2013 2014 Q1 2015 Q2 20155.0x
5.5x
6.0x
6.5x
7.0x
7.5x
8.0x
8.5x
9.0x
5.6x
6.5x
6.9x
9.0x
$10-25 M $25-50 M $50-100 M$100-250 M Average
22
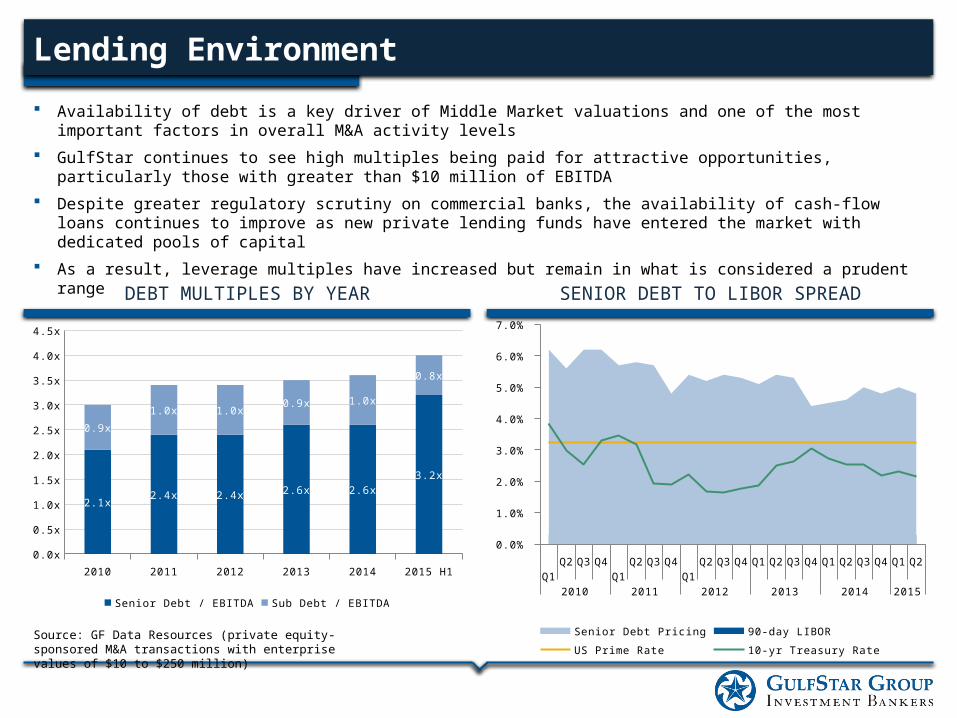
Lending Environment Availability of debt is a key driver of Middle Market valuations and one of the most important factors in overall M&A activity levels GulfStar continues to see high multiples being paid for attractive opportunities, particularly those with greater than $10 million of
EBITDA Despite greater regulatory scrutiny on commercial banks, the availability of cash-flow loans continues to improve as new private
lending funds have entered the market with dedicated pools of capital As a result, leverage multiples have increased but remain in what is considered a prudent range
DEBT MULTIPLES BY YEAR SENIOR DEBT TO LIBOR SPREAD
Source: GF Data Resources (private equity-sponsored M&A transactions with enterprise values of $10 to $250 million)
Q1 Q2 Q3 Q4 Q1 Q2 Q3 Q4 Q1 Q2 Q3 Q4 Q1 Q2 Q3 Q4 Q1 Q2 Q3 Q4 Q1 Q22010 2011 2012 2013 2014 2015
0.0%
1.0%
2.0%
3.0%
4.0%
5.0%
6.0%
7.0%
Senior Debt Pricing 90-day LIBORUS Prime Rate 10-yr Treasury Rate
2010 2011 2012 2013 2014 2015 H10.0x
0.5x
1.0x
1.5x
2.0x
2.5x
3.0x
3.5x
4.0x
4.5x
2.1x 2.4x 2.4x 2.6x 2.6x3.2x
0.9x1.0x 1.0x 0.9x 1.0x
0.8x
Senior Debt / EBITDA Sub Debt / EBITDA
23
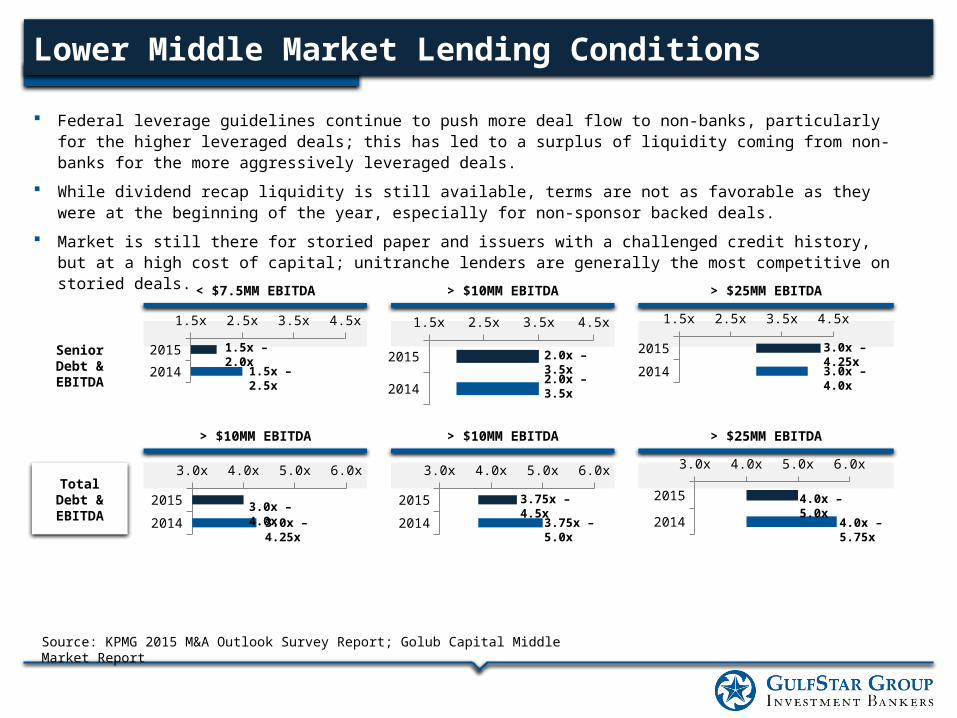
Lower Middle Market Lending Conditions
Federal leverage guidelines continue to push more deal flow to non-banks, particularly for the higher leveraged deals; this has led to a surplus of liquidity coming from non-banks for the more aggressively leveraged deals.
While dividend recap liquidity is still available, terms are not as favorable as they were at the beginning of the year, especially for non-sponsor backed deals.
Market is still there for storied paper and issuers with a challenged credit history, but at a high cost of capital; unitranche lenders are generally the most competitive on storied deals.
Source: KPMG 2015 M&A Outlook Survey Report; Golub Capital Middle Market Report
1.5x – 2.0x
1.5x – 2.5x2.0x – 3.5x
2.0x – 3.5x
3.0x – 4.25x
3.0x – 4.0x
Senior Debt & EBITDA
< $7.5MM EBITDA > $10MM EBITDA > $25MM EBITDA
2014
2015
1.5x 2.0x 2.5x 3.0x 3.5x 4.0x 4.5x
2014
2015
1.5x 2.0x 2.5x 3.0x 3.5x 4.0x 4.5x
2014
2015
1.5x 2.0x 2.5x 3.0x 3.5x 4.0x 4.5x
Total Debt & EBITDA 2014
2015
3.0x 3.5x 4.0x 4.5x 5.0x 5.5x 6.0x
3.0x – 4.0x3.0x – 4.25x 2014
2015
3.0x 3.5x 4.0x 4.5x 5.0x 5.5x 6.0x
3.75x – 4.5x
3.75x –5.0x 2014
2015
3.0x 3.5x 4.0x 4.5x 5.0x 5.5x 6.0x
4.0x – 5.0x
4.0x –5.75x
> $25MM EBITDA> $10MM EBITDA> $10MM EBITDA

24
Lower Middle Market Lending Conditions (cont’d)
Source: KPMG 2015 M&A Outlook Survey Report; Golub Capital Middle Market Report
Senior Cash Flow Pricing
No Libor Floor
L + 2.0% – 3.5%
L + 3.5% – 4.5%2014
2015
2.0% 3.0% 4.0% 5.0% 6.0% 7.0%
1.0% Libor Floor
L + 4.0% – 6.0%
L + 4.5% – 6.5%2014
2015
2.0% 3.0% 4.0% 5.0% 6.0% 7.0%
BANK NON-BANK
Unitraunch Pricing
2014
2015
6.0% 8.0% 10.0% 12.0%
2014
2015
6.0% 8.0% 10.0% 12.0%
L + 8.0% – 11.0%
L + 8.0% – 11.0%
1.0% Libor Floor 1.0% Libor Floor1.0% Libor Floor
2014
2015
6.0% 8.0% 10.0% 12.0%
L + 6.5% – 8.5%
L + 6.0% – 8.0%
L + 6.0% – 7.5%
> $25MM EBITDA< $7.5MM EBITDA > $15MM EBITDA

25
Covenant-Lite UpdateWith aggressive credit market conditions persisting, despite the recent uptick in new-issue yields, covenant-lite deals continue to be pervasive in loan structures. Covenant-lite loans with two or less covenants have grown considerably since 2010, with 88% market share. Meanwhile, covenant-lite loans with more than three covenants are virtually non-existence, only comprising 1% of the loan market.
2005 2006 2007 2008 2009 2010 2011 2012 2013 2014 Q1'LTM –
20%
40%
60%
80%
100%
≤ 2 3 ≥ 4
2007 2008 2009 2010 2011 2012 2013 2014 1Q14 1Q15$0B
$50B
$100B
$150B
$200B
$250B
$300B
0%
10%
20%
30%
40%
50%
60%
70%
Volume % of Institutional Volume
New-Issue First-Lien Covenant-Lite Volume Distributed by Number of Covenants
26
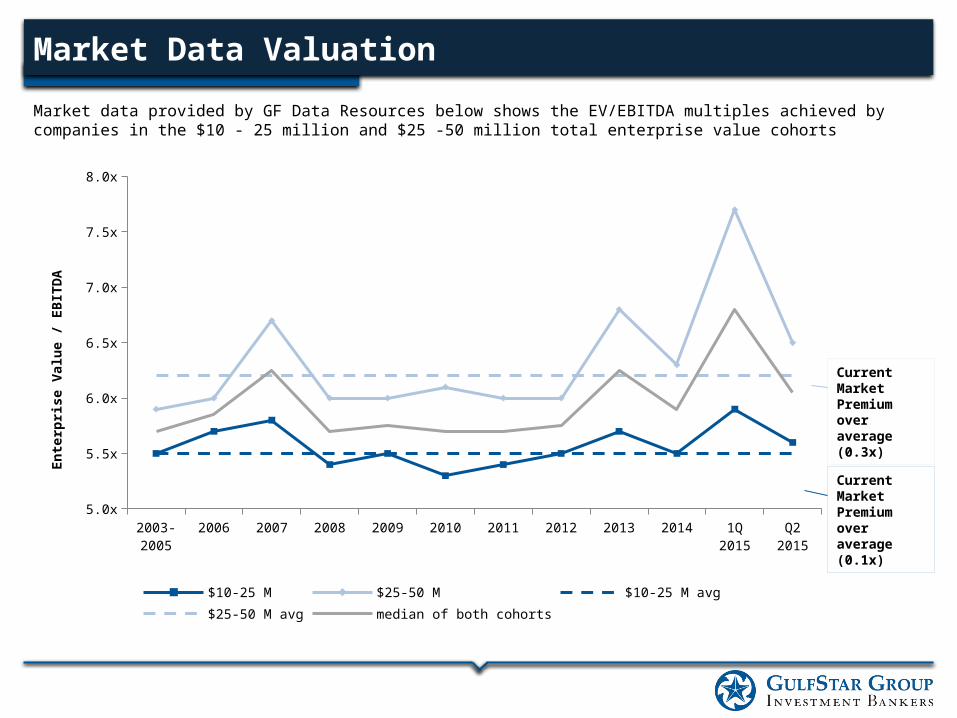
Current Market Premium over average (0.3x)
Current Market Premium over average (0.1x)
Market data provided by GF Data Resources below shows the EV/EBITDA multiples achieved by companies in the $10 - 25 million and $25 -50 million total enterprise value cohorts
Market Data Valuation
2003-2005
2006 2007 2008 2009 2010 2011 2012 2013 2014 1Q 2015 Q2 20155.0x
5.5x
6.0x
6.5x
7.0x
7.5x
8.0x
$10-25 M $25-50 M $10-25 M avg$25-50 M avg median of both cohorts
Ente
rpris
e Va
lue
/ EB
ITDA

27
Market Data Valuation
2003-2005 2006 2007 2008 2009 2010 2011 2012 2013 2014 1Q 2015 Q2 20155.0x
5.5x
6.0x
6.5x
7.0x
7.5x
8.0x
5.6
6.5
6.1
7.3
$10-25 M $25-50 M $10-25 M avg$25-50 M avg median of both cohorts $100-250 M avg
Ente
rpris
e Va
lue
/ EB
ITDA
28
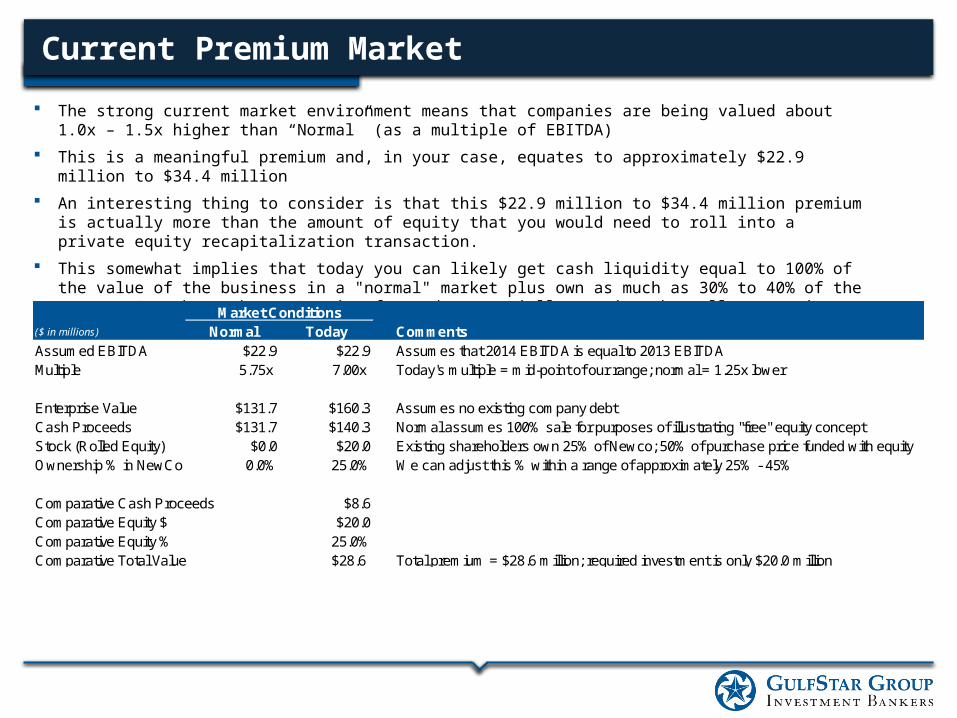
The strong current market environment means that companies are being valued about 1.0x – 1.5x higher than “Normal” (as a multiple of EBITDA)
This is a meaningful premium and, in your case, equates to approximately $22.9 million to $34.4 million An interesting thing to consider is that this $22.9 million to $34.4 million premium is actually more than the amount of
equity that you would need to roll into a private equity recapitalization transaction. This somewhat implies that today you can likely get cash liquidity equal to 100% of the value of the business in a "normal"
market plus own as much as 30% to 40% of the company (as chosen by you) going forward; essentially getting the rollover equity for free in today's market versus a "normal" market (see example calculation below).
Market Conditions($ in millions) Normal Today CommentsAssumed EBITDA $22.9 $22.9 Assumes that 2014 EBITDA is equal to 2013 EBITDAMultiple 5.75x 7.00x Today's multiple = mid-point of our range; normal = 1.25x lower
Enterprise Value $131.7 $160.3 Assumes no existing company debtCash Proceeds $131.7 $140.3 Normal assumes 100% sale for purposes of illustrating "free" equity conceptStock (Rolled Equity) $0.0 $20.0 Existing shareholders own 25% of Newco; 50% of purchase price funded with equityOwnership % in NewCo 0.0% 25.0% We can adjust this % within a range of approximately 25% - 45%
Comparative Cash Proceeds $8.6Comparative Equity $ $20.0Comparative Equity % 25.0%Comparative Total Value $28.6 Total premium = $28.6 million; required investment is only $20.0 million
Current Premium Market

29
Timing is Everything
MULTIPLE COMPARISON FOR TRANSACTIONS $100-$250 MILLION
Source: Historical Data (1988-2002) – Standard & Poors LCDSource: Historical Data (2003-2014) – GF Data Resources
Purchase Price Multiples Leverage Multiples
Theoretical Downturn &
Recovery
1988
1989
1990
1991
1992
1993
1994
1995
1996
1997
1998
1999
2000
2001
2002
2003
2004
2005
2006
2007
2008
2009
2010
2011
2012
2013
2014
2015
2016
2017
2018
2019
0.0x
1.0x
2.0x
3.0x
4.0x
5.0x
6.0x
7.0x
8.0x
0.0x
1.0x
2.0x
3.0x
4.0x
5.0x
6.0x
7.0x
8.0x
3.7x 3.4x 3.4x2.6x 2.7x 2.7x 2.8x
3.3x 3.5x 3.6x 3.5x 3.3x2.9x
2.2x 2.4x
4.2x 3.9x3.1x
4.1x4.7x
3.4x 3.7x3.3x
4.0x 4.3x3.8x 3.8x 3.8x
3.3x2.6x
3.0x3.5x
8.1x
7.1x
4.5x 4.2x
4.0x
5.5x
6.0x 6.0x
6.6x 6.7x 6.9x
6.6x 6.3x
5.8x 5.8x
6.4x 6.3x
7.4x
6.3x
7.5x 7.2x 7.2x
6.5x
7.5x 7.4x 7.1x 7.1x 7.1x
6.6x
5.2x
6.0x
7.0x
Purc
ahse
Pri
ce /
EBIT
DA D
ebt / EBITDA

30
Valuation Implications: Project Breakaway Company Overview – Project Breakaway is a provider of supply chain management services to global aerospace and defense
industries
Shareholder Objectives
Maximize value by capitalizing on strong recent performance and positive market trends
Realize substantial liquidity and diversify net worth
Manage different objectives of shareholders
Identify a proper strategic or financial partner to help achieve growth objectives
EBITDA – As calculated on financial statements; Applied to multiple for financial buyers
Synergy Adjusted EBITDA – Potential synergies are estimated and added back to EBITDA; Applied to multiple for strategic buyers
Period Dec-08 Dec-09 Dec-10 Dec-11 Dec-12 Dec-13 Dec-14Months 12 12 12 12 12 12 12(in $000s) A A A A A P P
Revenues $21,405 $19,816 $21,591 $24,131 $26,064 $29,563 $32,202
Gross Profit 7,863 6,715 7,358 8,308 10,137 10,991 11,972 Gross Margin 36.7% 33.9% 34.1% 34.4% 38.9% 37.2% 37.2%
EBITDA 5,613 4,393 5,210 6,276 7,717 8,007 8,807EBITDA Margin 26.2% 22.2% 24.1% 26.0% 29.6% 27.1% 27.4%
Synergy Adj. EBITDA 6,002 4,856 5,735 6,839 8,318 8,473 9,264Synergy Adj. EBITDA Margin 28.0% 24.5% 26.6% 28.3% 31.9% 28.7% 28.8%
Financial Buyers
Strategic Buyers
PROJECT BREAKAWAY SUMMARY FINANCIALS

31
Valuation Implications: Project Breakaway
$40.0
$50.0
$60.0
$70.0
$80.0
Dec-11 A Dec-12 A Dec-13 P Dec-14 P
Synergy Adjusted Value Baseline ValueDiscounted Projections Discounted MultipleDiscounted Projections & Discounted Multiple
Assumptions to GulfStar Analysis Current Projections & Multiple – EBITDA growth based on discussions with management; an 8.0x EBITDA multiple is applied Discounted Projections – A downward 10% discount was applied to EBITDA to account for a potential miss of projections Discounted Multiple – A downward market adjustment of 1.0x was utilized to represent a modest market decline Discounted Projections & Discounted Multiple – Both a 1.0x multiple reduction and a 10% discount to EBITDA to account for
potential market decline and a miss of projections
GulfStar Valuation Range: Sale based on Dec 2012 TTM
Current Multiple & Projections
Discounted Multiple
Discounted Projections& Discounted Multiple
Discounted Projections
ENTERPRISE VALUE OVER TIME ($ IN MILLIONS)

32
Valuation Implications: Project Cyclone
Assumptions to GulfStar Analysis
Current Projections & Multiple – EBITDA growth based on discussions with management; an 8.5x EBITDA multiple is applied
Discounted Projections – A downward 9.2% discount was applied to EBITDA to account for a potential miss of projections, which represents one-half of the decline experienced by the company in the 2009 downturn
Discounted Multiple – A downward market adjustment of 1.0x was utilized to represent a modest market decline
Discounted Projections & Discounted Multiple – Both a 1.0x multiple reduction and a 9.2% discount to EBITDA to account for potential market decline and a miss of projections
GulfStar Valuation Range: Sale based on Dec 2012 TTM
Current Multiple & Projections
Discounted Multiple
Discounted Projections& Discounted Multiple
Discounted Projections
$115.0
$135.0
$155.0
$175.0
$195.0
$215.0
$235.0
Dec-11 A Dec-12 A Dec-13 P Dec-14 P
Synergy Adjusted Value Baseline ValueDiscounted Projections Discounted MultipleDiscounted Projections & Discounted Multiple
ENTERPRISE VALUE OVER TIME ($ IN MILLIONS)

33
Valuation Implications: Project Wilhelm
Assumptions to GulfStar Analysis
Current Projections & Multiple – EBITDA growth based on discussions with management; an 6.0x EBITDA multiple is applied
Discounted Projections – A downward 10% discount was applied to EBITDA to account for a potential miss of projections
Discounted Multiple – A downward market adjustment of 1.0x was utilized to represent a modest market decline
Discounted Projections & Multiple – Both a 1.0x multiple reduction and a 10% discount to EBITDA to account for potential market decline and a miss of projections
GulfStar Valuation Range: Sale based on Dec 2012 TTM
Current Multiple & Projections
Discounted Multiple
Discounted Projections& Discounted Multiple
Discounted Projections
$6.0
$16.0
$26.0
$36.0
Dec-11 A Dec-12 A Dec-13 P Dec-14 P
Baseline Value Discounted Projections
Discounted Multiple Discounted Projections & Discounted Multiple
ENTERPRISE VALUE OVER TIME ($ IN MILLIONS)

34
www.gulfstargroup.com

State of Commercial Lending Markets
September 15, 2015

Texas Capital Bank
Macroeconomic Outlook
36
U.S. GDP growth rates have slowed
Domestic unemployment of 5.3%; lowest since “great recession”
The U.S. dollar gaining strength against major world currencies
Material improvement in oil prices not forecasted in the near term
Volatility in global markets related to negative economic indicators out of China
Banks have devoted substantial human and financial resources towards regulatory compliance
‒ Dodd-Frank‒ Consumer Financial Protection Bureau

Texas Capital Bank
Real Estate Lending Market
37
Low vacancy rates and an expanding economy have driven real estate activity across all sectors
Over the last three years, 22% of national banks experienced over 50% growth in total commercial real estate assets
‒ A robust pipeline of new supply is beginning to temper lender activity towards new projects
Office leasing slowing in energy-correlated markets such as Houston
The bank lending market is open to well structured transactions in favorable locations

Texas Capital Bank
State of Energy Lending
38
Oil prices remain low due to record high Saudi oil production‒ Forecasts see minimal improvement in prices through mid-2016
Top line revenue and margin declines are steepening for energy service providers
As a result of oil price declines, M&A activity has been sluggish‒ M&A opportunities are expected to increase as producers’
hedging contracts expire and require additional capital
Bank regulators have increased their focus on E&P lending
Lenders with expertise in the energy sector remain active

Texas Capital Bank
Commercial & Industrial Lending Activity
39
Competition amongst banks is fierce for higher quality loans‒ Pricing and net interest margins are under pressure
M&A activity down as purchase multiples have risen to historic levels
Dividend recapitalizations have increased in lieu of M&A
Refinancings are down approximately 25% year-over-year‒ Many issuers have already refinanced on favorable market terms
For most industry sectors, the lending market is expected to remain aggressive with abundant liquidity and competitive terms

Texas Capital Bank
Leveraged Lending Activity
40
Bank regulatory oversight has dampened risk appetite for more levered transactions
U.S. leveraged loan issuance is down 35% from same period last year
Despite liquidity and heightened competition, middle market leverage multiples are lower
‒ Bank regulatory guidance of 3x senior and 4x total leverage
Equity now a higher percentage of capital for leveraged transactions
The non-bank lending universe continues to increase