23
CORPORATE UPDATE APRIL 2018

CORPORATE UPDATEAPRIL 2018
Certain statements contained in this presentation, including all statements that are not historical facts, contain forward-looking statements and forward-looking information within the meaning of applicable securities laws (“forward-looking information”). Such forward-looking information includes, but is not limited to, statements or information with the respect to the overall objectives and strategic plans, work programs, exploration budgets and targets and mineral resource estimates of Pure Energy Minerals Limited (“Pure Energy” or the “Company”) . Readers should review all of the Company’s public disclosure including its most recent Annual Information Form and the risk factors contained therein, the technical reports on its properties, and its audited financial statements and Management's Discussion and Analysis (MD&A), all as filed on www.sedar.com from time to time.
Forward-looking information includes, but is not limited to, statements related to activities, events or developments that the Company expects or anticipates will or may occur in the future, including, without limitation; statements related to the Company's release of the PEA Technical Report (“PEA”) for the Clayton Valley Lithium Project (“Project”); the economic analysis of the Project; the mineral resource estimate for the Project; the estimated annual production of LiOH-H2O and LCE; the availability and development of more sustainable technologies for use at the Project; the expected mine life; the estimated NPV of the Project; the estimated IRR of the Project; estimated average operating costs; estimated capital costs; estimated EBITDA; the estimated payback period for the Project; the estimated timeline for construction of the Project; the estimated production schedule at the Project; anticipated chemistry of brines at the Project; expected growth in the market for lithium hydroxide; anticipated changes in battery formulation technologies; estimated market prices for lithium hydroxide; anticipated lithium recovery levels at the Project; expected pilot plant testing at the Project; design work at the Project; and the development of a timeline for completion of a feasibility study for the Project. Forward-looking information is often identified by the use of words such as "plans", "planning", "planned", "expects" or "looking forward", "does not expect", "continues", "scheduled", "estimates", "forecasts", "intends", "potential", "anticipates", "does not anticipate", or "belief", or describes a "goal", or variation of such words and phrases or states that certain actions, events or results "may", "could", "would", "might" or "will" be taken, occur or be achieved. Forward-looking information is based on a number of factors and assumptions made by management and considered reasonable at the time such information is provided. Forward-looking information involves known and unknown risks, uncertainties and other factors that may cause the actual results, performance, or achievements to be materially different from those expressed or implied by the forward-looking information.
A number of other factors may adversely impact Pure Energy and the Project, including: the Company’s inability to complete further mineral resource and mineral reserve estimates; the inability to complete a subsequent feasibility study; the inability to anticipate changes in brine volume or grade due a number of factors; changes to the economic analysis; the failure to obtain necessary permits to explore and develop the Project; environmental issues or delays; inability to successfully complete additional drilling at the Project; and inability to obtain financing for future exploration and development work and construction of a plant at the Project. Although Pure Energy has attempted to identify important factors that could cause actual actions, events, or results to differ materially from those described in the forward-looking information, there may be other factors that cause actions, events, or results not to be as anticipated, estimated, or intended. There can be no assurance that forward-looking information will prove to be accurate. The forward-looking information contained herein is presented for the purpose of assisting investors in understanding the Company's plan, objectives, and goals and may not be appropriate for other purposes. Accordingly, readers should not place undue reliance on forward-looking information. Pure Energy does not undertake to update any forward-looking information, except in accordance with applicable securities laws.
CAUTIONARY STATEMENT
2Mineral resources which are not mineral reserves do not have demonstrated economic viability. The category of inferred resource is the least reliable resource category and is subject to the most variability. Until mineral reserves and resources are actually mined and processed, the quantity of mineral reserve and resource grades must be considered as estimates only. Patrick Highsmith MSc., CPG., is a qualified person as defined by NI 43-101, and has supervised the preparation of the scientific and technical information that forms the basis for this presentation. Mr. Highsmith is not independent of the Company as he is a director.

The PEA is based upon a process flow sheet that may change, which would impact all costs and estimates. Operating costs for the Project were based upon assumptions including future energy costs, water costs, labor, regulatory costs and other variables that are likely to change. Capital costs were based upon plant equipment and other items thought to be necessary for production. Lithium hydroxide monohydrate price forecasts were based upon third-party estimates and management assumptions that may change due to market dynamics. Changes in estimated costs to acquire, construct, install, or operate the equipment, or changes in projected pricing, may adversely impact Project economics.
The economic analysis included in the PEA is based upon inferred mineral resources only. Mineral resources that are not mineral reserves do not have demonstrated economic viability. The PEA is preliminary in nature and includes inferred mineral resources that are considered too speculative geologically to have the economic considerations applied to them that would enable them to be categorized as mineral reserves. There is no certainty that the Project envisioned by this PEA will be realized. The mineral resource estimates, upon which the PEA is based, rely upon assumptions outlined in the “Resource Estimate” section of the technical report relating to the PEA. Some figures in the resource estimate may have been calculated using a factor to convert short tons to metric tonnes.
CAUTIONARY STATEMENT (cont.)
3Mineral resources which are not mineral reserves do not have demonstrated economic viability. The category of inferred resource is the least reliable resource category and is subject to the most variability. Until mineral reserves and resources are actually mined and processed, the quantity of mineral reserve and resource grades must be considered as estimates only. Patrick Highsmith MSc., CPG., is a qualified person as defined by NI 43-101, and has supervised the preparation of the scientific and technical information that forms the basis for this presentation. Mr. Highsmith is not independent of the Company as he is a director.
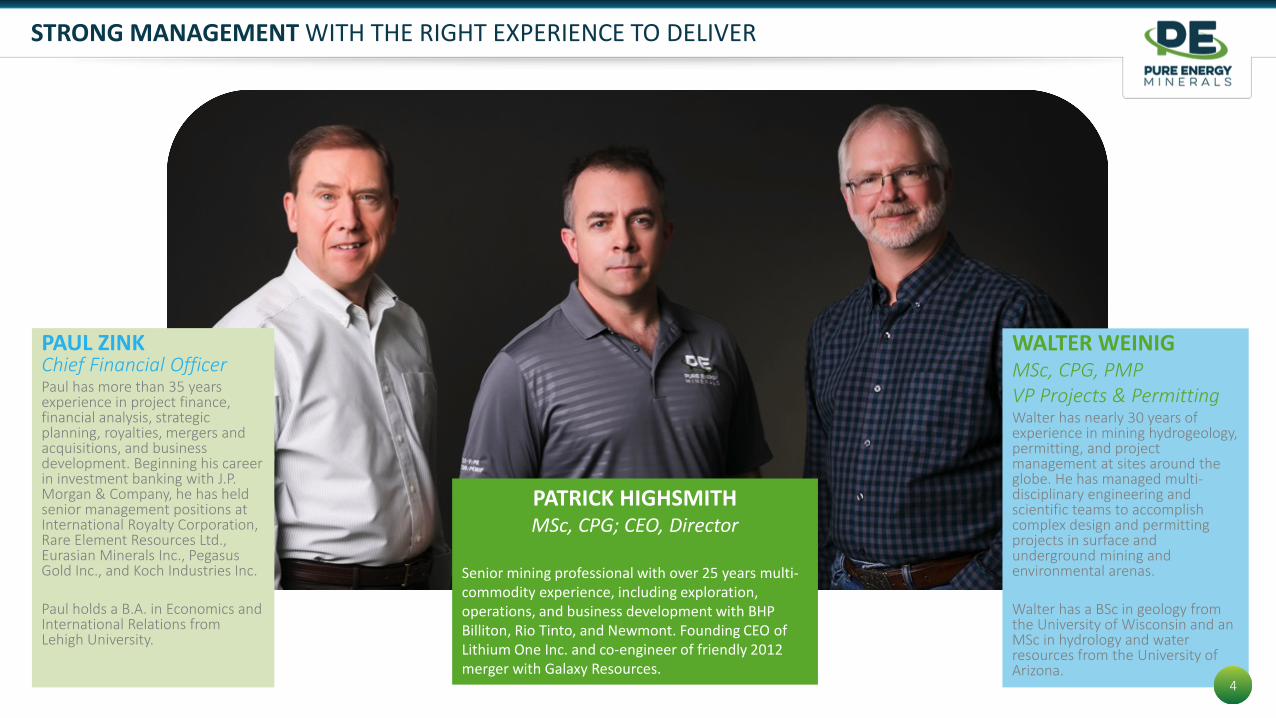
STRONG MANAGEMENT WITH THE RIGHT EXPERIENCE TO DELIVER
PAUL ZINKChief Financial OfficerPaul has more than 35 years experience in project finance, financial analysis, strategic planning, royalties, mergers and acquisitions, and business development. Beginning his career in investment banking with J.P. Morgan & Company, he has held senior management positions at International Royalty Corporation, Rare Element Resources Ltd., Eurasian Minerals Inc., Pegasus Gold Inc., and Koch Industries Inc.
Paul holds a B.A. in Economics and International Relations from Lehigh University.
WALTER WEINIGMSc, CPG, PMPVP Projects & PermittingWalter has nearly 30 years of experience in mining hydrogeology, permitting, and project management at sites around the globe. He has managed multi-disciplinary engineering and scientific teams to accomplish complex design and permitting projects in surface and underground mining and environmental arenas.
Walter has a BSc in geology from the University of Wisconsin and an MSc in hydrology and water resources from the University of Arizona.
PATRICK HIGHSMITHMSc, CPG; CEO, Director
Senior mining professional with over 25 years multi-commodity experience, including exploration, operations, and business development with BHP Billiton, Rio Tinto, and Newmont. Founding CEO of Lithium One Inc. and co-engineer of friendly 2012 merger with Galaxy Resources.
44

DEMAND IS REAL. CONSENSUS IS GATHERING – AROUND 580K TPA BY 2025
55Benchmark Mineral Intelligence, Lithium Hydroxide Market Forecast, April, 2017
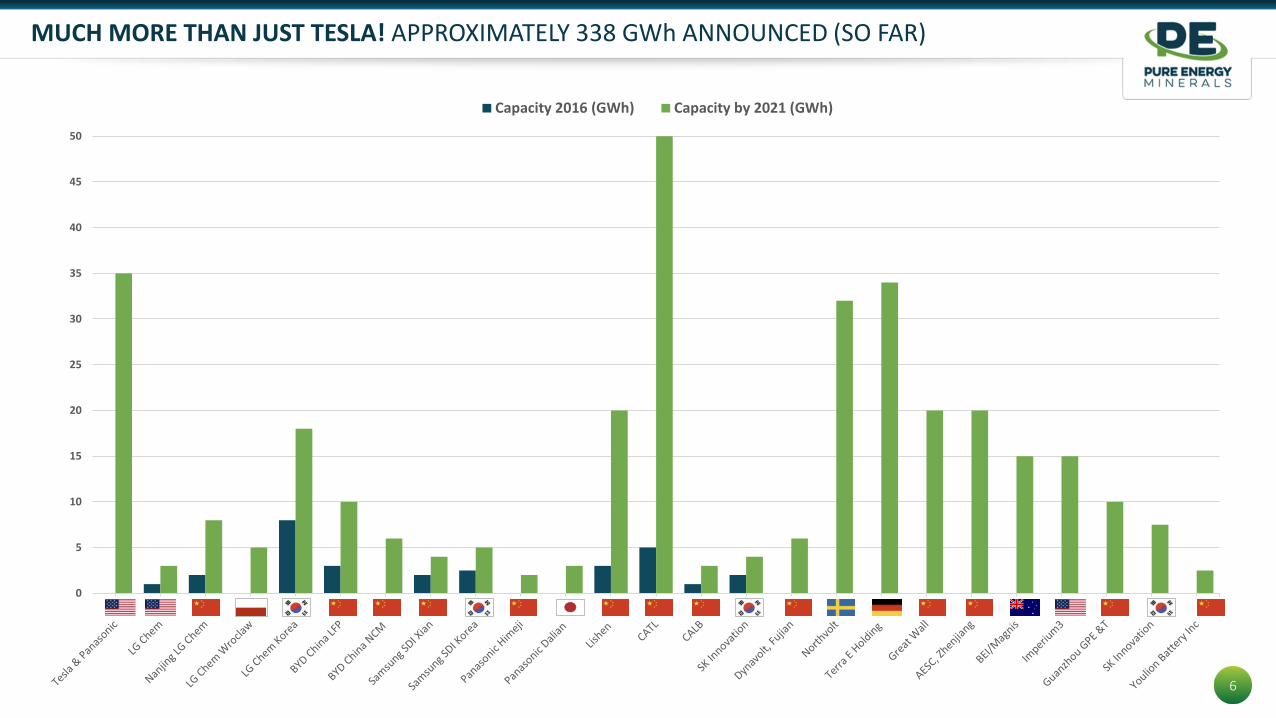
MUCH MORE THAN JUST TESLA! APPROXIMATELY 338 GWh ANNOUNCED (SO FAR)
6
0
5
10
15
20
25
30
35
40
45
50
Capacity 2016 (GWh) Capacity by 2021 (GWh)

WHAT ABOUT THE DOOMSDAY SCENARIO FROM MORGAN STANLEY? NOT LIKELY!
MORGAN STANLEY FORECASTS HUGE RAPID GROWTH IN SUPPLY… WHAT IF HISTORY REPEATS ITSELF?
Morgan Stanley Forecast Lithium Supply (2017-2021)
Historical Lithium Supply Forecast vs. Actual (2012-2016)*
155kTONNES
205kTONNES
224kTONNES
565kTONNES
2017
2012
2016(ACTUAL)
(FORECAST)
300 - 350kTONNES
2021
ACTUAL SUPPLY IN 2021 AND BEYOND MAY FALL WELL SHORT OF FORECASTS
415kTONNES
(FORECAST)
7
MORE LIKELY RANGE
* - Orocobre corporate presentation, May 2017
88

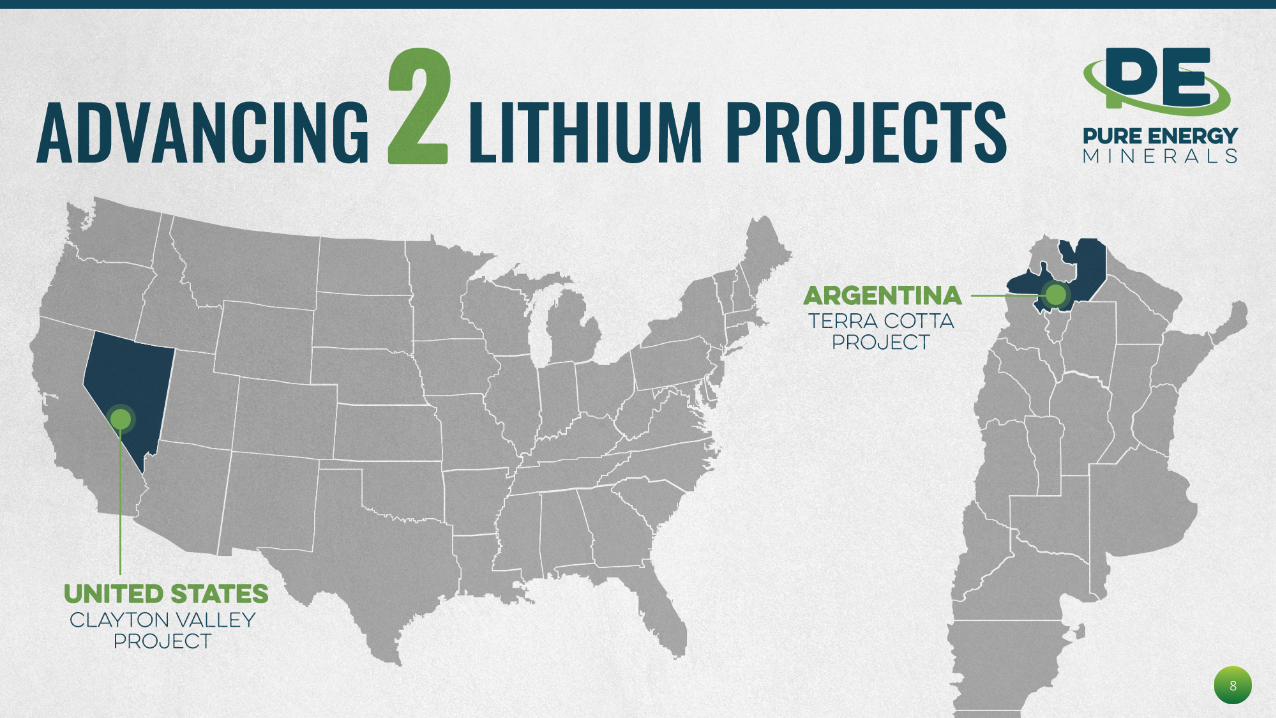
World-Class InfrastructurePower Lines, Roads, and North America’s Only Lithium Producer…
CLAYTON VALLEY NEVADA – A PRODUCTIVE DISTRICTCLAYTON VALLEY, NEVADA – HOME TO AN OLD PRODUCER AND NEW POTENTIAL
9

CONSOLIDATION: THE CLAYTON VALLEY PROJECT CONTINUES TO GROW
EXPANDED PURE ENERGY CLAIMS:
Existing Claims: 24,600 ACRES
Acquired Nov ‘17: 1,450 ACRES
TOTAL: 26,050 ACRES(10,550 HECTARES)
Existing Claims
Albemarle Silver Peak Mine
Newly Acquired Claims - Nov ’17
Wells
CLAYTON NE CLAIM BLOCK6 EXPLORATION HOLESAVG LITHIUM GRADE: 204 mg/L
AREAS OF EXPLORATIONFOCUS IN 2018
10
INFERRED RESOURCE AREA
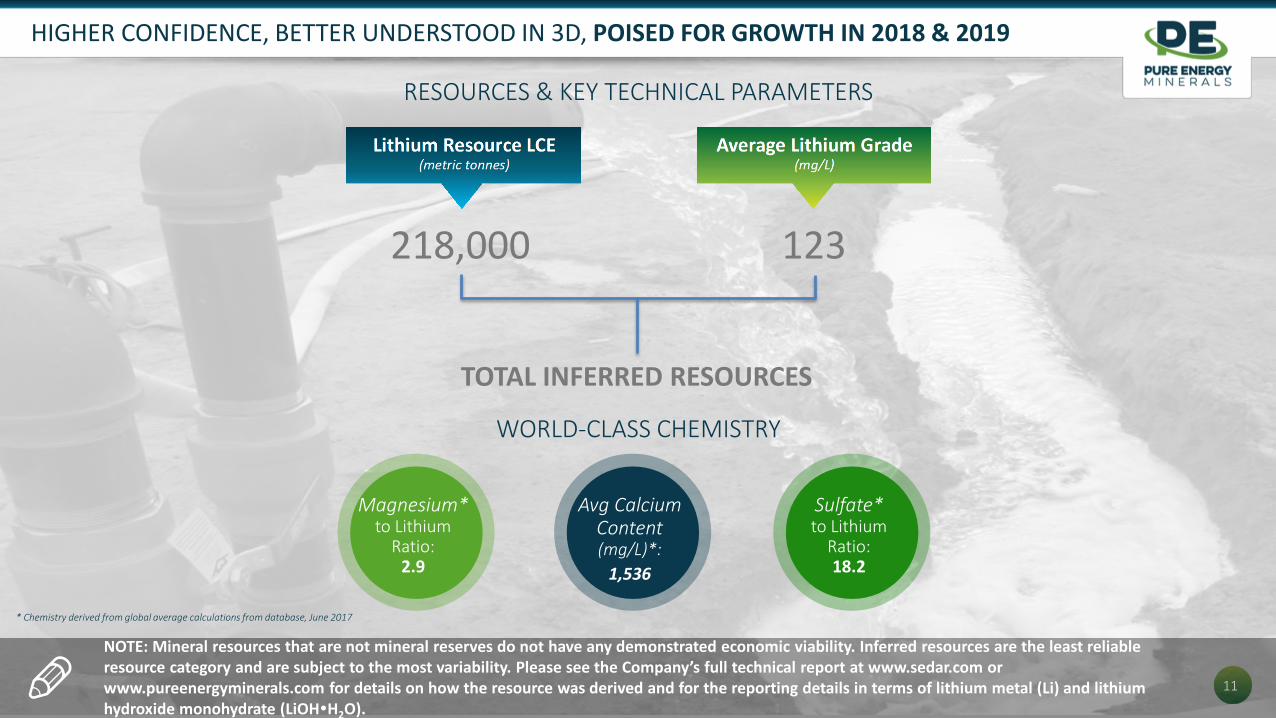
11
Magnesium*to Lithium
Ratio:2.9
Avg Calcium Content (mg/L)*:
1,536
Sulfate*to Lithium
Ratio:18.2
WORLD-CLASS CHEMISTRY
RESOURCES & KEY TECHNICAL PARAMETERS
NOTE: Mineral resources that are not mineral reserves do not have any demonstrated economic viability. Inferred resources are the least reliable resource category and are subject to the most variability. Please see the Company’s full technical report at www.sedar.com orwww.pureenergyminerals.com for details on how the resource was derived and for the reporting details in terms of lithium metal (Li) and lithium hydroxide monohydrate (LiOHH2O).
HIGHER CONFIDENCE, BETTER UNDERSTOOD IN 3D, POISED FOR GROWTH IN 2018 & 2019
TOTAL INFERRED RESOURCES
218,000 123
* Chemistry derived from global average calculations from database, June 2017
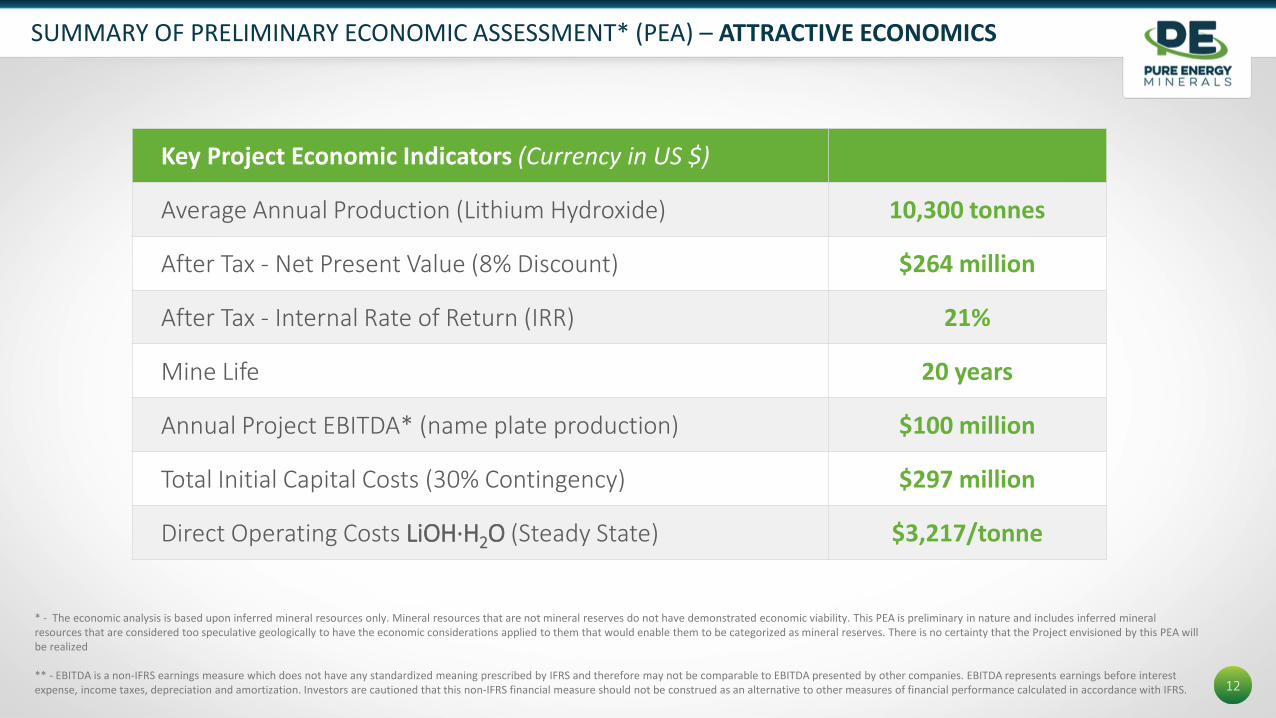
SUMMARY OF PRELIMINARY ECONOMIC ASSESSMENT* (PEA) – ATTRACTIVE ECONOMICS
Key Project Economic Indicators (Currency in US $)
Average Annual Production (Lithium Hydroxide) 10,300 tonnes
After Tax - Net Present Value (8% Discount) $264 million
After Tax - Internal Rate of Return (IRR) 21%
Mine Life 20 years
Annual Project EBITDA* (name plate production) $100 million
Total Initial Capital Costs (30% Contingency) $297 million
Direct Operating Costs LiOH∙H2O (Steady State) $3,217/tonne
* - The economic analysis is based upon inferred mineral resources only. Mineral resources that are not mineral reserves do not have demonstrated economic viability. This PEA is preliminary in nature and includes inferred mineral resources that are considered too speculative geologically to have the economic considerations applied to them that would enable them to be categorized as mineral reserves. There is no certainty that the Project envisioned by this PEA will be realized
** - EBITDA is a non-IFRS earnings measure which does not have any standardized meaning prescribed by IFRS and therefore may not be comparable to EBITDA presented by other companies. EBITDA represents earnings before interest expense, income taxes, depreciation and amortization. Investors are cautioned that this non-IFRS financial measure should not be construed as an alternative to other measures of financial performance calculated in accordance with IFRS. 1212
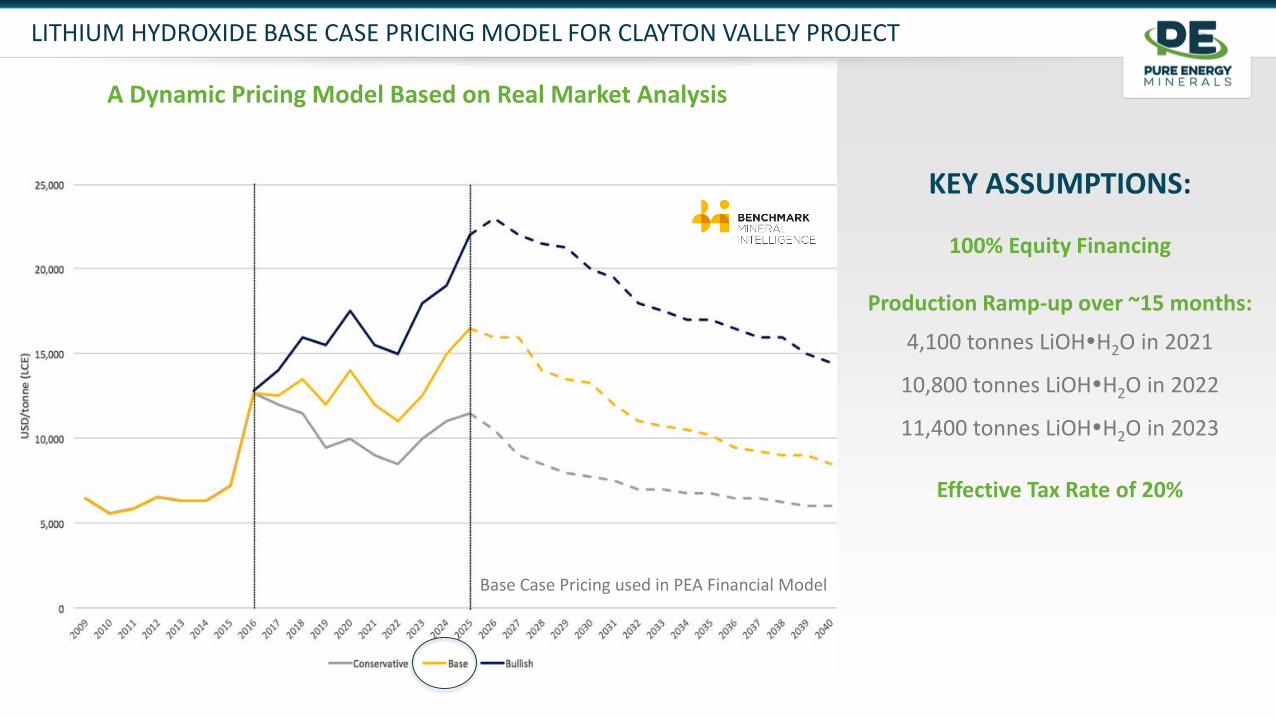
A Dynamic Pricing Model Based on Real Market Analysis
13
Base Case Pricing used in PEA Financial Model
KEY ASSUMPTIONS:
100% Equity Financing
Production Ramp-up over ~15 months:
4,100 tonnes LiOHH2O in 2021
10,800 tonnes LiOHH2O in 2022
11,400 tonnes LiOHH2O in 2023
Effective Tax Rate of 20%
LITHIUM HYDROXIDE BASE CASE PRICING MODEL FOR CLAYTON VALLEY PROJECT
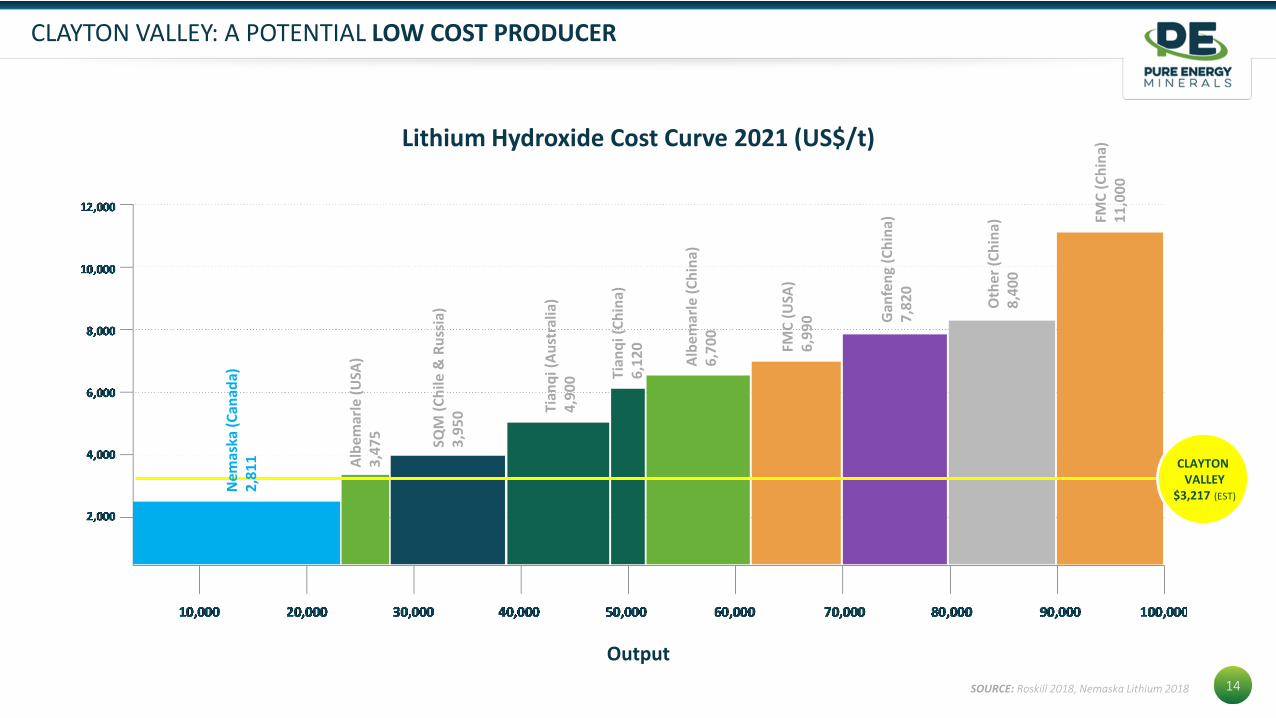
CLAYTON VALLEY: A POTENTIAL LOW COST PRODUCER
14
Lithium Hydroxide Cost Curve 2021 (US$/t)
Output
Albe
mar
le (U
SA)
3,47
5 SQM
(Chi
le &
Rus
sia)
3,95
0 Tian
qi(A
ustr
alia
)4,
900 Ti
anqi
(Chi
na)
6,12
0
Albe
mar
le (C
hina
)6,
700
FMC
(USA
)6,
990 G
anfe
ng(C
hina
)7,
820
Oth
er (C
hina
)8,
400
FMC
(Chi
na)
11,0
00
SOURCE: Roskill 2018, Nemaska Lithium 2018
Nem
aska
(Can
ada)
2,81
1 CLAYTON VALLEY
$3,217 (EST)
15
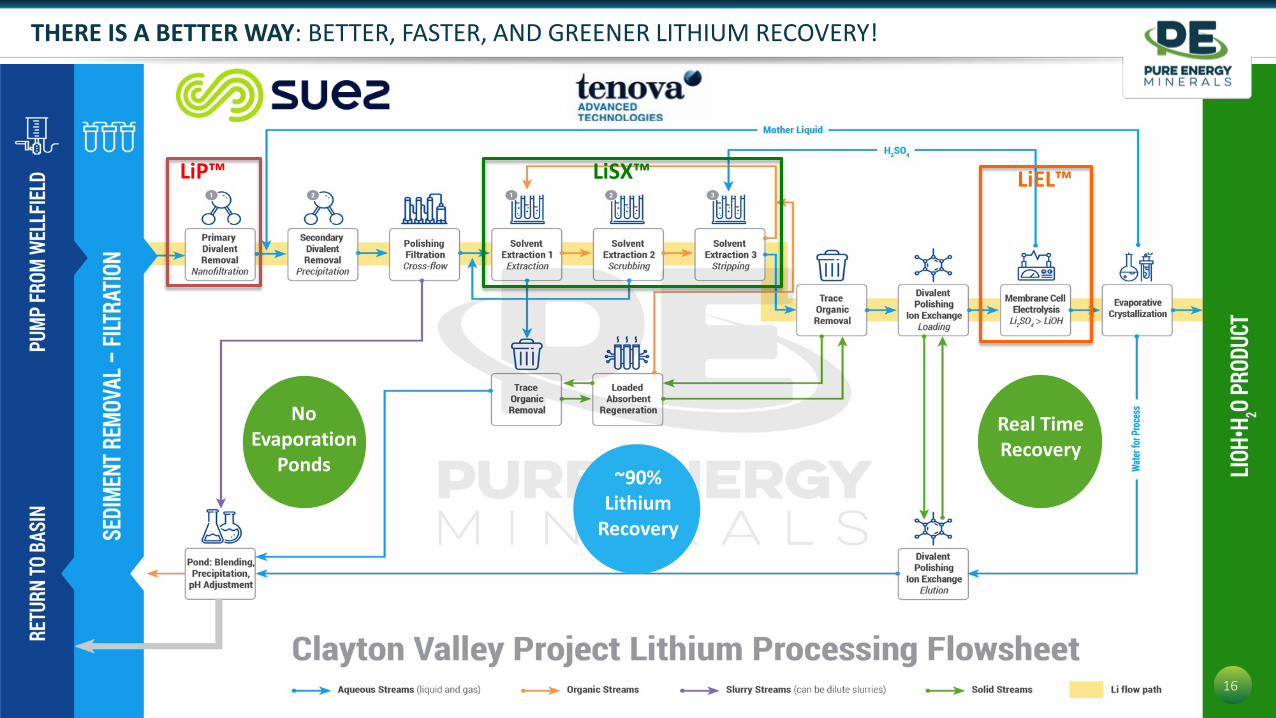
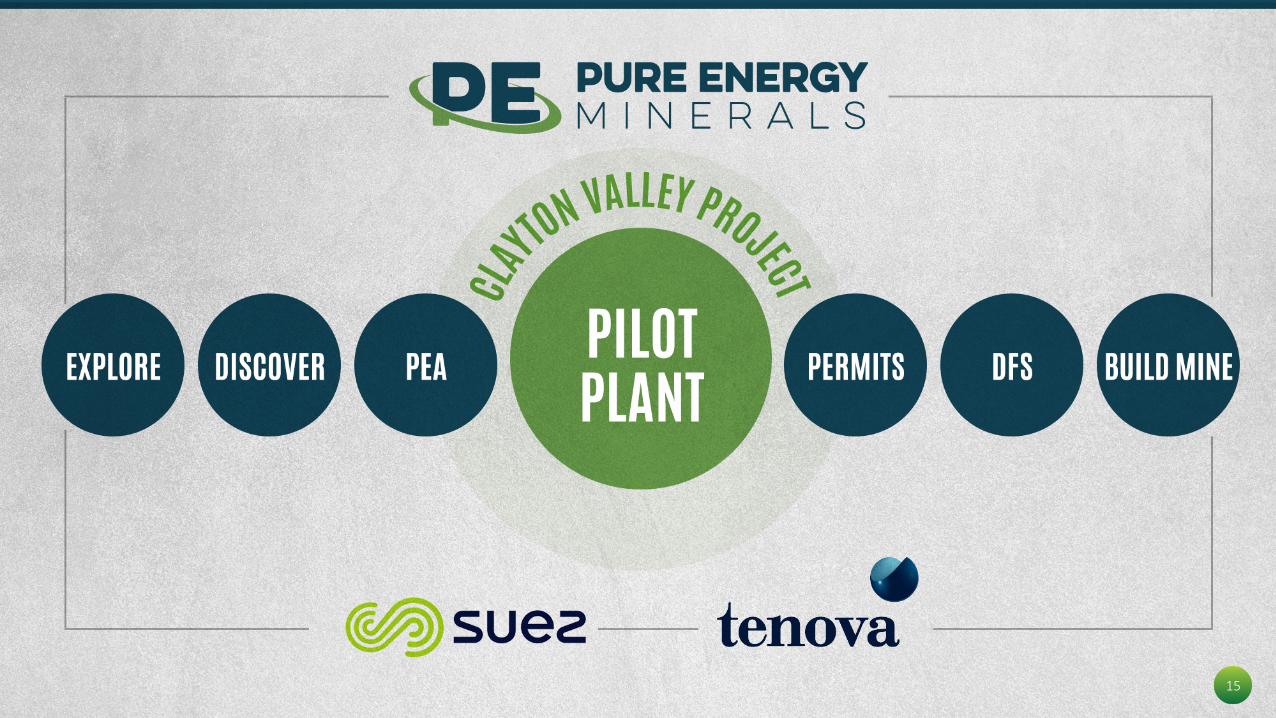
LiP™ LiSX™ LiEL™
No Evaporation
Ponds
Real Time Recovery
16
THERE IS A BETTER WAY: BETTER, FASTER, AND GREENER LITHIUM RECOVERY!
~90% Lithium
Recovery

CLAYTON VALLEY PILOT PLANT DESIGN - PROOF IS ON THE WAY!
17
Stripping
Tenova Pulsed Column Extraction
ScrubbingLiELTM
LiPTM Polishing & pH Control
LiSXTM

CLAYTON VALLEY EXECUTION SCHEDULE
Clayton Valley South Execution Schedule 2017 2018 2019 2020 2021 2022
Project Activity Duration Q3 Q4 Q1 Q2 Q3 Q4 Q1 Q2 Q3 Q4 Q1 Q2 Q3 Q4 Q1 Q2 Q3 Q4 Q1 Q2 Q3 Q4Environmental Baseline Studies 18 months
Permitting for Pilot Plant 12 months
Design of Pilot Plant 12 months
Procurement of Pilot Plant 9 months
Construction of Pilot Plant 6 months
Operation of Pilot Plant 6 months
Environmental Impact Assessment or Study 12 months
Permitting for Project Execution 12 months
Feasibility Study - Basin Activities 15 months
Feasibility Study - Plant Activities & Feasibility Report 9 months
Project Financing 3 months
Design & Engineering- Project Execution 9 months
Procurement & Delivery - Project Execution 12 months
Construction 15 months
Commissioning 6 months
Ramp-Up 9 months
Realistic and Aggressive - It’s all about the Pilot Plant
18
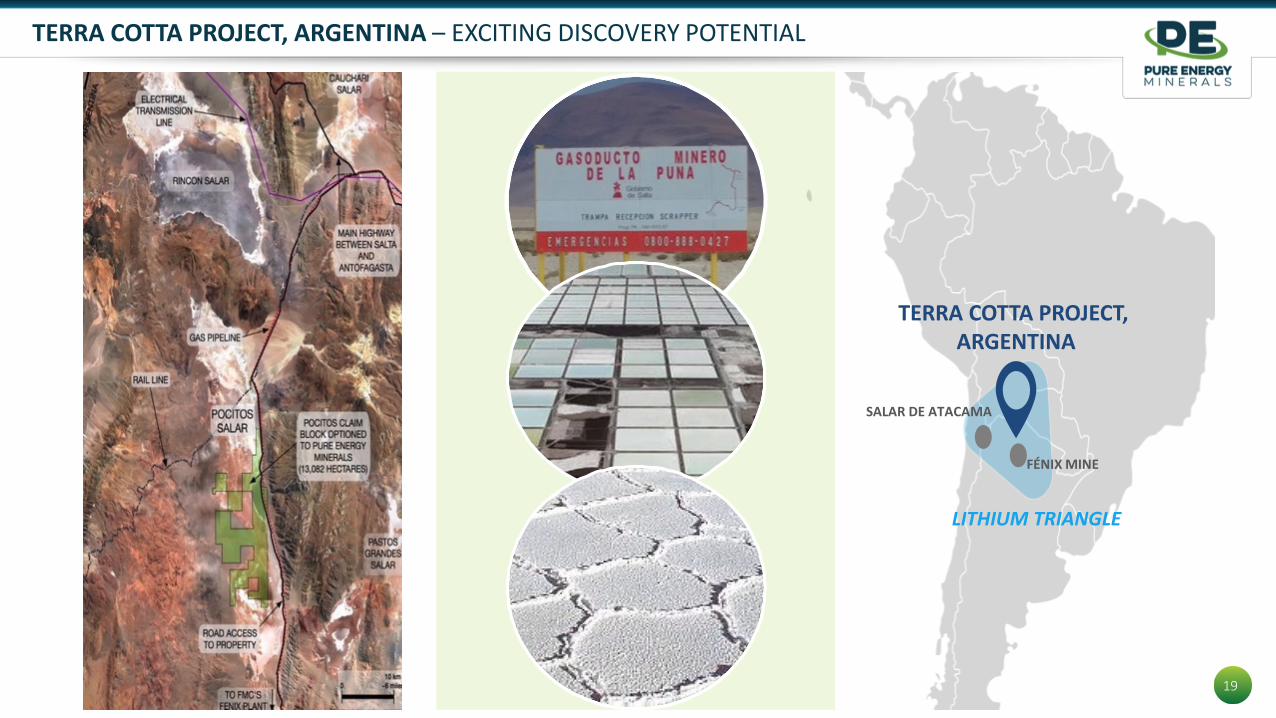
FÉNIX MINE
SALAR DE ATACAMA
LITHIUM TRIANGLE
TERRA COTTA PROJECT, ARGENTINA
LITHIUM TRIANGLE
TERRA COTTA PROJECT, ARGENTINA – EXCITING DISCOVERY POTENTIAL
19
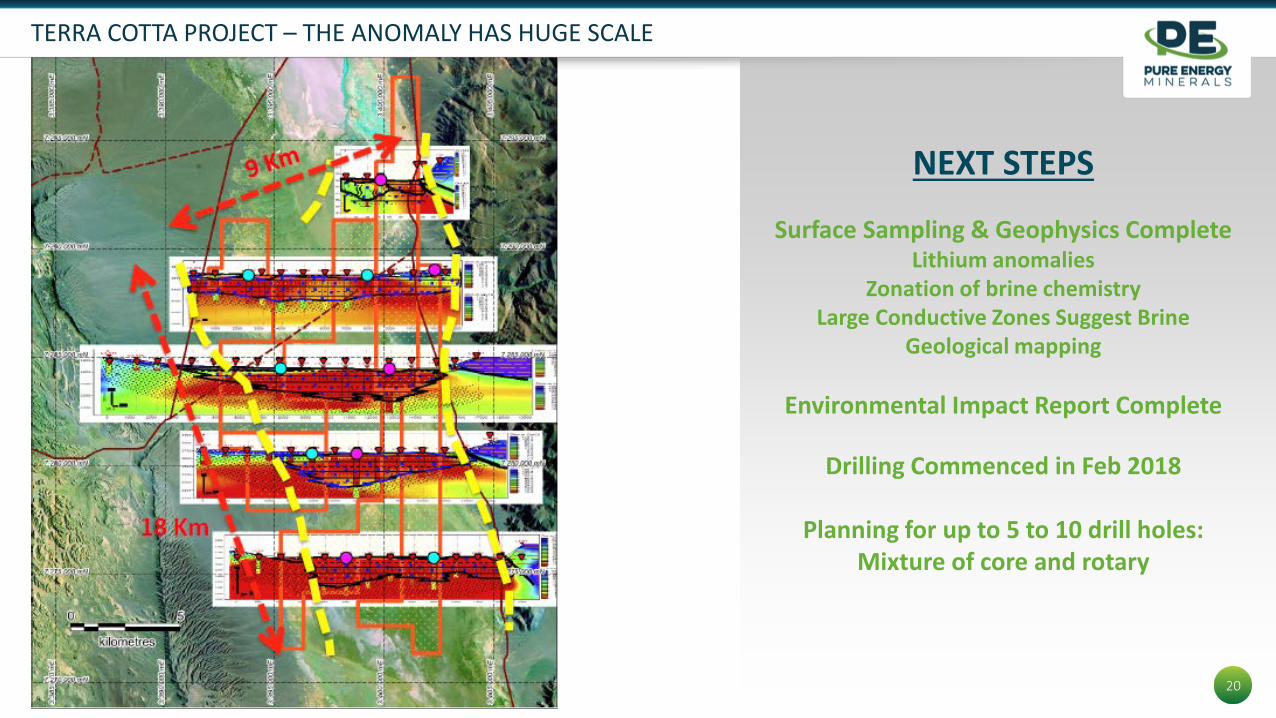
NEXT STEPS
Surface Sampling & Geophysics CompleteLithium anomalies
Zonation of brine chemistryLarge Conductive Zones Suggest Brine
Geological mapping
Environmental Impact Report Complete
Drilling Commenced in Feb 2018
Planning for up to 5 to 10 drill holes:Mixture of core and rotary
TERRA COTTA PROJECT – THE ANOMALY HAS HUGE SCALE
20
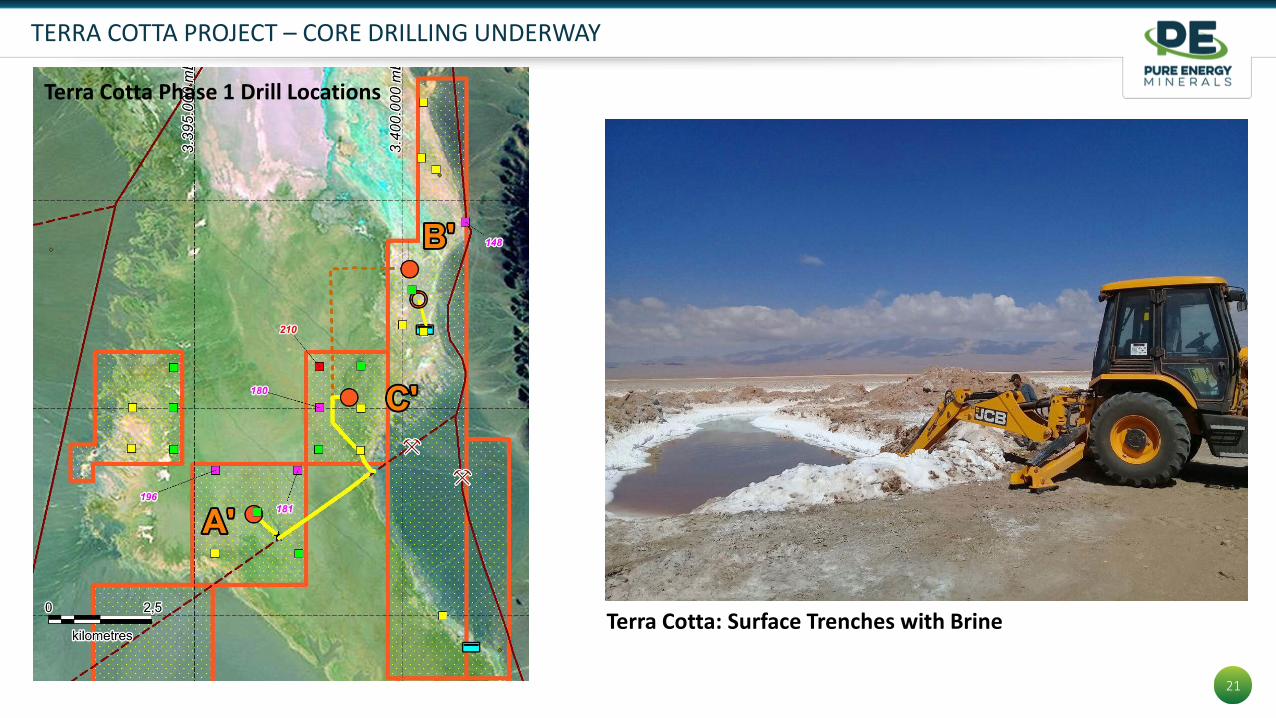
TERRA COTTA PROJECT – CORE DRILLING UNDERWAY
Terra Cotta Phase 1 Drill Locations
Terra Cotta: Surface Trenches with Brine
21
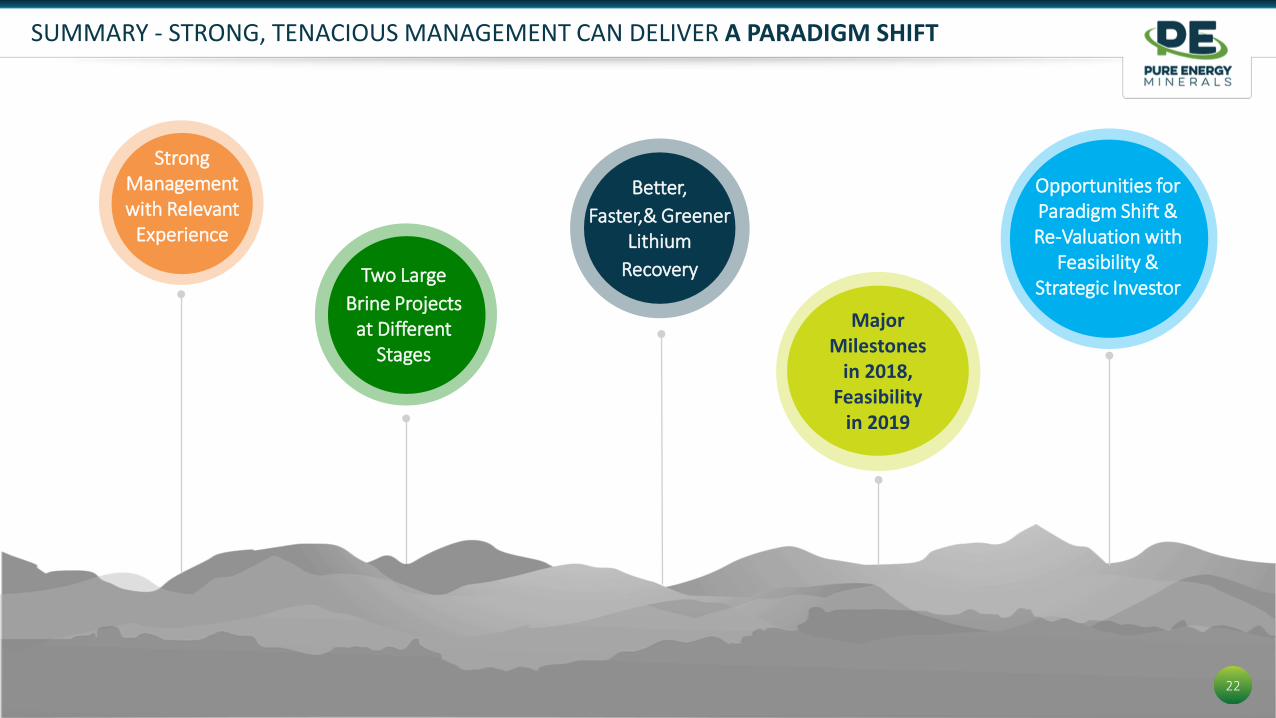
SUMMARY - STRONG, TENACIOUS MANAGEMENT CAN DELIVER A PARADIGM SHIFT
Better,Faster,& Greener
LithiumRecovery
Opportunities for Paradigm Shift & Re-Valuation with
Feasibility & Strategic Investor
Major Milestones
in 2018, Feasibility
in 2019
22
Two Large Brine Projects
at Different Stages
Strong Management with Relevant
Experience
www.PureEnergyMinerals.com
Patrick Highsmith, President & Chief Executive Officer [email protected]
303.317.6857
OTCQB:PEMIFTSXV:PE
23


![Research Article CrystalStructureofL-Histidinium2 ...chloride monohydrate [2], L-histidine tetrafluoroborate [3], L-histidine hydrochloride monohydrate [4], L-histidine hydrofluoride](https://static.documents.pub/doc/80x56/60b51c180636315681384205/research-article-crystalstructureofl-histidinium2-chloride-monohydrate-2.jpg)