Natural Ventilation with Heat Recycling (NVHR ® ) is the latest product from Breathing Buildings. The units are designed for offices and school classrooms, and are changing the way the industry thinks about Natural Ventilation. Breathing Buildings NVHR ® Issue 2.0/Sept 15 The mixing ventilation system allows single sided, natural ventilation in deep plan spaces whilst making the most of internal heat gains to deliver superb thermal comfort. It is designed to meet the Department for Education “Guidance on ventilation, thermal comfort and indoor air quality in schools” and the Facilities Output Specification (FOS) for the Priority Schools Building Programme (PSBP). The unit can be used with a grille or ducted arrangement to supply air. • Can work individually or as multiples (typically a pair for a standard school classroom) • System directs air to the back of the space to provide a quasi-cross-flow system • Mounted horizontally • Manual control with 4-position switch or fully automatic with override • BMS interface option to report T/CO 2 or allow set-point changes and enable / disable • Automatic units switch between winter mixing, natural and summer boost modes and include night cooling • Integrates with manual windows when it is above 16 o C outside (see indicator light on illustration of user interface in Appendix G) or can control actuators on windows or dampers • In winter the units use internal gains to temper incoming ventilation air, rather than a dedicated pre-heater, which has a significant impact in reducing heater sizing and energy consumption • In a modern, well insulated building be it a classroom or well-occupied office environment, there is an abundance of heat when ventilation demand is at its highest, and these units capitalise on this • Can be used on noisy sites – a standard unit provides 26dB D new attenuation as independently verified by SRL • Units can be exposed in a room or installed in a ceiling void • Very low energy consumption - typical specific fan power 0.13W/l/s in winter mode for unit with grille Air Flow Strategies Natural Mode • Damper opens • Single sided ventilation • Works with other openings in the space Winter Mixing • Draught mitigation strategy • Mixes warm room air with fresh external air • Natural exhaust through the unit Summer Boost • Damper opens fully • Air delivered to rear of the space • Natural exhaust through the unit • Night cooling 1
Transcript
1
Natural Ventilation with Heat Recycling (NVHR®) is the latest product from Breathing Buildings. The units are designed for offices and school classrooms, and are changing the way the industry thinks about Natural Ventilation.
Breathing Buildings NVHR®
Issue 2.0/Sept 15
The mixing ventilation system allows single sided, natural ventilation in deep plan spaces whilst making the most of internal heat gains to deliver superb thermal comfort. It is designed to meet the Department for Education “Guidance on ventilation, thermal comfort and indoor air quality in schools” and the Facilities Output Specification (FOS) for the Priority Schools Building Programme (PSBP). The unit can be used with a grille or ducted arrangement to supply air.
• Can work individually or as multiples (typically a pair for a standard school classroom)
• System directs air to the back of the space to provide a quasi-cross-flow system
• Mounted horizontally
• Manual control with 4-position switch or fully automatic with override
• BMS interface option to report T/CO2 or allow set-point changes and enable / disable
• Automatic units switch between winter mixing, natural and summer boost modes and include night cooling
• Integrates with manual windows when it is above 16oC outside (see indicator light on illustration of user interface in Appendix G) or can control actuators on windows or dampers
• In winter the units use internal gains to temper incoming ventilation air, rather than a dedicated pre-heater, which has a significant impact in reducing heater sizing and energy consumption
• In a modern, well insulated building be it a classroom or well-occupied office environment, there is an abundance of heat when ventilation demand is at its highest, and these units capitalise on this
• Can be used on noisy sites – a standard unit provides 26dB Dnew attenuation as independently verified by SRL
• Units can be exposed in a room or installed in a ceiling void
• Very low energy consumption - typical specific fan power 0.13W/l/s in winter mode for unit with grille
Air Flow Strategies
Natural Mode• Damper opens• Single sided ventilation• Works with other openings in the space
Winter Mixing• Draught mitigation strategy• Mixes warm room air with fresh external air• Natural exhaust through the unit
Summer Boost• Damper opens fully• Air delivered to rear of the space• Natural exhaust through the unit• Night cooling
1
2
Installation and Control:
The units are designed so that they can be exposed or enclosed in a bulkhead or ceiling void. The slimline nature of the units was part of the design which was undertaken in collaboration with Nicholas Hare Architects. When the units are exposed in the room or mounted in a bulkhead a grille is usually provided to direct air towards the ceiling and back of the room. The grille arrangement complies with the PSBP FOS. Exposed NVHR units can also be supplied with a fabric duct or solid duct.
See Figures 1-4
Product Information
Features
• Lightweight, plastic construction
• Low energy mixing fans to mitigate against cold draughts in winter
• Summer boost mode
• Night cooling mode
• Room temperature sensor with integrated CO2 sensor
• Internal mixed air temperature sensor
• External temperature sensor
• Ready fitted mounting brackets
• Key switch for automatic operation; time override; long term off; test
Options
• Manual or automatic control which responds to environmental conditions
• Weather louvre
• Additional sound attenuation for noisy sites through combination of acoustic louvres and internal baffles depending on site specific requirements
• Control signal for automated actuation of low level windows or dampers
• Traffic light indicator panel for window opening
• Modbus link for integration into wider Building Management Systems (BMS)
• Heater coil for space heating (1.5kW per unit)
Figure 1 Exposed NVHR unit with a grille
Figure 2 Exposed NVHR with a solid duct
Figure 4 Diffuser grille arrangement above a suspended ceiling
Figure 3 Exposed NVHR with a fabric duct
When NVHR units are located in a ceiling void the units are coupled to a duct with a plenum box and a diffuser.
3
Control Options:
The standard unit comes with manual control which is operated by a 4 position switch provided with the system. For automatic control the system includes an in room temperature and CO2 sensor which responds automatically to the internal conditions using our NV Smart control system with additional functionality available through our NV Smart+ and NV Smart+ Connected controllers.
NV Manual 4 Position key switch operation Winter Mixing and draught mitigation
NV Smart Room temperature / CO2 sensorExternal temperature sensor
Secure night coolSummer boost
Winter mixing and draught mitigation
NV Smart+ As above plus:Heating interlock functionality
Window signal LEDHeating Control *
Purge (in excess of summer boost)*
NV Smart+ Connected
As above plus:BMS Interface
*Additional charges
Appendix A NVHR with Integral Grille – Laboratory Test Data for Designers
All of the acoustic information given in Appendix A is measured at Sound Research Laboratories. All acoustic tests were conducted with a weather louvre.
Frequency (Hz)Dnew
(C;Ctr) dB63 125 250 500 1K 2K 4K 8K
22 20 21 26 25 27 28 29 26 (-1; -2)
Table A1 Element normalised level difference (attenuation from outside to inside)
Aerodynamic data for the NVHR with integral rectangular grille
Figure A1 NVHR with integral rectangular grille. Fresh air fan pressure curves (summer mode). Colours of lines denote different fan control voltages
Figure A2 NVHR with integral rectangular grille. Unit overall specific fan powers in summer mode (to be used in conjunction with Figure A1). Colours of lines denote different fan control voltages
NVHR
0
50
100
150
200
250
300
0 10 20 30 40 50 60 70
8V
7V
6V
5V
4V
3V
Air F
low Rate [l/s]
External Sta5c Pressure [Pa]
0
0.1
0.2
0.3
0.4
0.5
0.6
0 10 20 30 40 50 60 70
8V
7V
6V
5V
4V
3V
Unit O
verall Specific Fan Po
wer [W
/l/s]
External Sta;c Pressure [Pa]
4
Total flow rate (fresh air fan only)
[l/s]
Frequency3 (Hz)Sound
Power Level Lw dB(A)
Free Field dB(A) @ 3m (Spherical Radiation)
Predicted1 Room Sound
Pressure Level dB(A) (with 1 unit)
Predicted1 Room Sound
Pressure Level dB(A)
(with 2 units)63 125 250 500 1K 2K 4K 8K
46 28 32 29 26 17 13 18 24 28 8 18 21
75 35 41 42 37 31 25 23 24 38 18 27 29
90 38 45 45 40 33 31 27 22 41 21 30 33
100 41 47 44 41 38 33 31 26 43 23 32 35
110 44 50 47 44 36 38 34 23 45 25 34 37
115 46 51 47 45 37 40 36 30 46 26 36 38
120 48 52 49 47 37 42 38 32 47 27 37 39
125 49 53 50 48 38 44 39 33 49 29 38 41
130 51 54 52 49 38 46 40 35 50 30 40 42
135 53 55 50 48 46 43 43 37 51 31 40 42
1502 51 58 55 52 49 47 47 43 55 36 44 47
Figure A3 NVHR with integral rectangular grille. Winter mode 160 l/s total flow rate with 1 to 1 mixing, fan control voltages and overall specific fan powers at varying pressures
Figure A3 and Figure A4 can be used to check commissioning voltages and the overall specific fan power of the unit with integral grille when an additional pressure drop is introduced upstream (i.e. an attenuator between the weather louvre and the unit to increase overall sound reduction between the exterior and the room).
Acoustic data for the NVHR with integral grille
Summer mode (fresh air fan operation only):
Table A2 Summer mode acoustic data for NVHR with integral grille and no ducting
Notes:Noise levels are measured at an external static pressure of 6 Pa (after the grille) unless otherwise stated. 1See assumptions for room sound pressure calculations at the end of Appendix A. 2Recorded at an external static pressure of 20 Pa (after the grille). 3Unweighted casing radiated and outlet noise octave band sound power level (dB).
0
0.05
0.1
0.15
0.2
0.25
0.3
0.35
0
1
2
3
4
5
6
7
8
0 5 10 15 20 25 30 35 40
130 l/s Fresh air fan control voltages (le= axis)
130 l/s recirculaAng air fan control voltages (le= axis)
Unit overall SFP @ 260 l/s (right axis)
External Sta+c Pressure [Pa]
Fan
Cont
rol V
olta
ge [V
]
Ove
rall
Spec
ific
Fan
Pow
er (W
/l/s
)
0
0.05
0.1
0.15
0.2
0.25
0
1
2
3
4
5
6
0 5 10 15 20 25 30 35 40
80 l/s Fresh air fan control voltages (le< axis)
80 l/s recircula@ng air fan control voltages (le< axis)
Unit overall SFP @ 160 l/s (right axis)
External Sta+c Pressure [Pa]
Fan
Cont
rol V
olta
ge [V
]
Ove
rall
Spec
ific
Fan
Pow
er (W
/l/s
)
Figure A4 NVHR with integral rectangular grille. Winter mode 260 l/s total flow rate with 1 to 1 mixing, fan control voltages and overall specific fan powers at varying pressures
5
Total flow rate per unit
[l/s]
External Static
Pressure [Pa]
Frequency3 (Hz) Sound Power Level Lw
dB(A)
Free Field dB(A) @ 3m (Spherical Radiation)
Predicted1 Room Sound
Pressure Level dB(A) (with 1 unit)
Predicted1 Room Sound
Pressure Level dB(A)
(with 2 units)63 125 250 500 1K 2K 4K 8K
160 6 39 44 43 38 35 28 25 24 40 20 29 32
160 30 43 51 46 42 35 33 32 28 43 23 32 35
260 6 47 55 50 44 40 39 39 34 48 28 372 382
Winter mode (both fans in operation):
Table A3 Winter mode acoustic data for NVHR with integral grille and no ducting
Notes:In this mode 50% of the volume of supplied air indicated above is fresh, and the remaining is recirculated room air for mitigating cold draughts via mixing.1See assumptions for room sound pressure calculations at the end of Appendix A. 2The higher flow rates are typically needed in larger rooms such as science labs, therefore the sound pressure predictions are based on a room volume of 270 m3 as opposed to 180 m3 for the typical classrooms.
3Unweighted casing radiated and outlet noise octave band sound power level (dB).
Acoustic data for the NVHR with LPHW heater for space heating and integral grille
Air flow rate per unit [l/s]
ExternalStatic
Pressure[Pa]
Frequency2 (Hz)Sound Power Level Lw
dB(A)
Free Field dB(A) @ 3m (Spherical Radiation)
Predicted1 Room Sound
Pressure Level dB(A) (with 1 unit)
Predicted1 Room Sound
Pressure Level dB(A)
(with 2 units)63 125 250 500 1K 2K 4K 8K
160 6 40 47 42 37 31 27 25 25 39 19 28 31
Table A4 Winter mode acoustic data for NVHR with heater and integral grille
Notes:In this mode 50% of the volume of supplied air indicated above is fresh, and the remaining is recirculated room air for mitigating cold draughts via mixing.1See assumptions for room sound pressure calculations at the end of Appendix A. 2Unweighted casing radiated and outlet noise octave band sound power level (dB).
NVHR
Figure A5 Acoustic test arrangement at SRL for NVHR with integral grille
External noise
source
Measurement of sound power
levels
6
1) The discharge arrangement for the ducted unit (with circular spigot) is assumed to be consisting of a lined duct, lined diffuser plenum and a diffuser with an overall insertion loss of:
In-duct discharge noise quoted within the above tables (for the ducted unit) is corrected for end reflection by applying the following (for a 250mm diameter spigot):
2) The reverberation time Tmf is taken as 0.6 seconds, which equates to an approximate reduction of 3 dB across the frequency range.
3) Room volume is taken as 180 m3, resulting in a reduction of 9 dB across the frequency range.
4) Distance to listener is taken as 3 and 8 metres respectively for each of the units, 3 metres for the single unit calculation.
5) Units are assumed to be exposed with no sound reduction applied for false ceilings.
6) The following adjustment is made for directivity for both case radiated, discharge noise (ducted) and the total (applicable only for un-ducted with integral grille) sound power levels:
Breathing Buildings would recommend that advice is taken from an acoustic consultant to verify actual project noise levels. If there are acoustically sensitive areas on the project then these should be identified and looked at separately.
Frequency (Hz) 63 125 250 500 1k 2k 4k 8k
Insertion loss (dB) -2 -4 -5 -10 -12 -11 -10 -9
Frequency (Hz) 63 125 250 500 1k 2k 4k 8k
End reflection correction (dB) 12 8 4 1 0 0 0 0
Frequency (Hz) 63 125 250 500 1k 2k 4k 8k
Directivity adjustment (dB) 6 7 7 7 8 8 9 9
Breathing Buildings’ acoustic assumptions for room sound pressure calculations:
As part of the selection process for NVHR units, Breathing Buildings provide guide dB(A) values for sound pressure levels in typical classrooms which are based on a series of assumptions. Because each project and each room is different, it is not practical to give anything other than a guide prediction. These values have been confirmed to be fairly representative of classroom conditions via tests conducted in real room mock-ups. Actual room sound pressure levels can be calculated by a qualified acoustician.
The predicted sound pressure levels in dB(A) are given for guidance only and are based on a typical classroom layout with 1 or 2 no. NVHR units ventilating the space for an occupancy of up to 16 or 32 people respectively:
Table A5 Insertion loss Please note that there no reductions associated with ducting or diffusers assumed for the unit with the integral grille.
Table A6 End reflection correction
Table A7 Directivity adjustment
7
Appendix B NVHR with Circular Spigot for Duct – Laboratory Test Data for Designers
The acoustic attenuation through the unit between the exterior and interior is the same as for the unit with a grille. See Table A1 in Appendix A.
Aerodynamic data for the NVHR with circular spigot for ducting
Figure B1 NVHR with circular spigot for ducted systems. Fresh air fan pressure curves (summer mode). Colours of lines denote different fan control voltages
NVHR
Figure B2 NVHR with circular spigot for ducted systems. Unit overall specific fan powers in summer mode (to be used in conjunction with Figure B1). Colours of lines denote different fan control voltages
Figure B3 NVHR with circular spigot for ducted systems. Winter mode 160 l/s total flow rate with 1 to 1 mixing, fan control voltages and overall specific fan powers at varying pressures
Figure B4 NVHR with circular spigot for ducted systems. Winter mode 260 l/s total flow rate with 1 to 1 mixing, fan control voltages and overall specific fan powers at varying pressures
0
0.05
0.1
0.15
0.2
0.25
0.3
0.35
0
1
2
3
4
5
6
0 10 20 30 40 50 60
80 l/s Fresh air fan control voltages le; axis
80 l/s recircula>ng air fan control voltages le; axis
Unit overall SFP @ 160 l/s right axis
External Sta+c Pressure [Pa]
Fan
Cont
rol V
olta
ge [V
]
Uni
t Ove
rall
Spec
ific
Fan
Pow
er (W
/l/s
)
0
0.1
0.2
0.3
0.4
0.5
0.6
0.7
0.8
0 10 20 30 40 50 60 70 80
9V 8V
7V 6V
5V 4V Unit o
verall Specific Fan Po
wer [W
/l/s]
External Sta:c Pressure [Pa]
0
50
100
150
200
250
300
0 10 20 30 40 50 60 70 80
9V
8V
7V
6V
5V
4V
Air F
low Rate [l/s]
External Sta5c Pressure [Pa]
0
0.05
0.1
0.15
0.2
0.25
0.3
0.35
0.4
0.45
0.5
0
1
2
3
4
5
6
7
8
9
0 10 20 30 40 50 60
130 l/s Fresh air fan control voltages le= axis
130 l/s RecirculaAng air fan control voltages le= axis
Unit overall SFP @ 260 l/s right axis
External Sta+c Pressure [Pa]
Fan
Cont
rol V
olta
ge [V
]
Uni
t Ove
rall
Spec
ific Fa
n Po
wer
[W/l
/s]
8
Total flow rate per unit (fresh air fan only)
[l/s]
Frequency (Hz)Sound Power Level Lw
dB(A)
Free Field dB(A) @ 3m (Spherical Radiation)
Predicted3 Room Sound
Pressure Level dB(A) (with 1 unit)
Predicted3 Room Sound
Pressure Level dB(A)
(with 2 units)
63 125 250 500 1K 2K 4K 8K
130
1 45 50 41 34 31 24 22 24 38 1932 35
2 43 48 43 39 40 39 38 32 45 25
134
1 45 51 42 34 31 25 23 24 39 1933 35
2 43 48 43 39 41 40 39 33 45 26
140
1 46 52 42 35 32 26 24 25 40 2034 36
2 44 49 44 40 42 41 40 34 46 26
145
1 46 52 43 36 33 26 25 26 41 2134 37
2 45 50 45 41 42 42 41 35 47 27
155
1 47 54 44 37 34 28 26 28 42 2236 38
2 46 51 46 42 44 43 42 37 49 29
160
1 48 54 45 38 35 29 27 29 42 2336 39
2 47 52 47 43 45 44 43 38 49 30
165
1 49 55 46 38 35 29 28 29 43 2337 40
2 48 52 48 43 45 45 44 39 50 30
175
1 50 56 47 39 37 31 29 31 44 2438 41
2 49 54 49 44 47 46 45 41 52 32
185
1 51 57 48 40 38 32 31 32 45 2640 42
2 50 55 50 46 48 48 47 43 53 33
263
1 58 65 55 48 46 41 40 40 53 3348 50
2 57 64 57 53 56 57 55 54 62 42
Acoustic data for the NVHR with circular spigot for ducting
Summer mode (fresh air fan operation only):
Table B1 Summer mode acoustic data for NVHR with circular spigot for ducting
Notes:Noise levels are measured at an external static pressure of 20 Pa.1Unweighted casing radiated octave band sound power levels (dB).2Unweighted in-duct discharge sound power levels (dB).3See assumptions for room sound pressure calculations at the end of Appendix A.
9
Winter mode (1 to 1 mixing with both fans running):
Total flow rate per unit
[l/s]
ExternalStatic
Pressure[Pa]
Frequency (Hz) Sound Power Level Lw
dB(A)
Free Field dB(A) @ 3m
(Spherical Radiation)
Predicted3 Room Sound
Pressure Level dB(A) (with 1 unit)
Predicted3 Room Sound
Pressure Level dB(A)
(with 2 units)
63 125 250 500 1K 2K 4K 8K
160 20
1 46 51 43 36 30 25 23 25 40 2033 35
2 45 47 44 40 40 39 39 33 46 26
160 30
1 47 51 45 36 31 26 24 26 41 2134 37
2 46 48 46 41 41 41 40 34 47 28
260 20
1 55 59 53 45 40 36 35 38 49 30424 444
2 54 57 55 50 50 52 53 48 58 38
260 30
1 53 59 54 46 40 37 36 39 50 30434 454
2 54 57 55 51 51 52 53 49 59 39
260 50
1 55 61 55 48 42 39 38 41 52 32444 464
2 55 58 57 52 52 54 55 51 61 41
Acoustic data for the NVHR with circular spigot for ducting
Table B2 Winter mode acoustic data for NVHR with circular spigot for ducting
Notes:In this mode 50% of the volume of supplied air indicated above is fresh, and the remaining is recirculated room air for mitigating cold draughts via mixing. 1Unweighted casing radiated octave band sound power levels (dB).2Unweighted in-duct discharge sound power levels (dB).3See assumptions for room sound pressure calculations at the end of Appendix A. 4The higher flow rates are typically needed in larger rooms such as science labs, therefore the sound pressure predictions are based on a room volume of 270m3 as opposed to 180m3 for the typical classrooms.
NVHR
Figure B5 Acoustic test arrangement at SRL for NVHR with circular spigot
External noise
source Measurement of casing radiated sound power levels
Measurement of in-duct sound power levels
10
SummaryTemperatures and flow velocities from two NVHR units were recorded across a section through a test classroom of 7m depth on 13th February 2015. Two different flow distribution options from the NVHR units were assessed; a fabric duct and a single grille mounted directly on the back of the NVHR unit. It was found that temperatures and flow velocities in the occupied zone were well within the limits set by the PSBP FOS for both solutions. Experiments with the fabric duct in place were also conducted on 7th January 2015 with SRL present to record sound pressure levels. The sound pressure levels were confirmed to be acceptable, less than 35dB (A) and hence compliant with BB93, with the units providing the design flow rates of 160 l/s of fresh air and pre-mixed by 1:1 before entry to the fabric duct. Further experiments were conducted on 18th May 2015 confirming that the acoustic performance is also compliant with no fabric duct.
Breathing Buildings equipmentThe classroom has a pair of NVHR units, each with two fans, exposed within the space.
Set-upEach unit was supplying a total air flow of 160l/s. In the 13th February 2015 experiments a grille was attached to the spigot of one of the units. The other unit had a fabric duct attached. Temperature and flow velocity measurements were taken using a hot-wire anemometer, across a section through the centre of the spigot of the NVHR unit with the circular grille attached to the spigot. The external air temperature was approximately 8°C. The temperatures at the occupied level were also measured beneath the fabric duct and in line beneath the unit with the circular grille.
Test resultsThe results measured are shown in Figure C1 and Figure C2.
Appendix C Flow Performance in a Test Classroom
Figure C1 Section through classroom showing temperature and flow velocities in line with the grille
Figure C2 Section through classroom showing temperature and flow velocities in line with fabric duct
It can be seen from Figure C1 that the air supplied to the room was approximately 50% fresh air and 50% recirc. (24oC high level recirc, 8oC fresh air). The supplied mixed air warms rapidly to room temperature even without the fabric duct. Temperatures in the occupied zone are very close to room temperature and flow velocities are at or below 0.15m/s. Room temperature at the occupied zone was measured to be between 21.6 and 22.0oC. The room was observed to be stratified, with temperatures up to 24.2oC in the room at ceiling height.
The temperatures at the occupied height 1.4m from the floor beneath the fabric duct were found to be between 21.6 and 22.0oC i.e. at room temperature – the amount of mixing achieved by the cold fresh air being pre-mixed by the NVHR unit and then mixed further in the space as it descended from the duct was such that the air caused no draughts. The air speeds measured at this height were all less than 0.15m/s.
Using test results for room designThese results can be extended to review the condition on a -5oC day. In this case, for the same room temperature as in the test (occupied level of 22oC and high level 24oC due to stratification), the mixed air delivery temperature leaving the NVHR unit would be 10oC if the same degree of pre-mixing is used by the NVHR unit. However, it is known from the results of the air tests that an overall dilution ratio of at least 1:4 will be achieved by the time the fresh air reaches the occupied level; in other words, 1 part fresh to 4 parts room. Applying these results to a -5oC day we achieve the following:
1 part at -5oC + 4 parts at 24oC = 18oC air at the occupied zone. With the occupied zone at 22oC the ∆T is 4oC, and hence the requirement of being within 5oC is easily achieved.
24oC
21.6 – 22.0oC, <0.15m/s
•
• •
24oC •
• 21.6 – 22.0oC, <0.15m/s 21.6 – 22.0oC, <0.15m/s
11
If the room is stratified by only 0.5oC (very unlikely and significantly less than this test, and hence this is conservative), then the following will apply:
1 part at -5oC + 4 parts at 22.5oC = 17oC air at the occupied zone. With the occupied zone at 22oC the ∆T is 5oC, and hence the requirement of being within 5oC is just achieved.
In order to illustrate the implications of this, we consider the Glasgow Test Reference Year and the month of January. The temperature results are shown below in Figure C3 for a classroom at temperature 22oC, with 0.5oC stratification.
It can be seen that the temperatures at the occupied level only fall below the target minimum level for short periods when the external temperature is below -5oC. These temperatures are at night, outside of the occupied period, in the Glasgow TRY weather file for January and hence the system complies with the design requirements.
Plume modellingLine plume modelling can be used to assess the degree of additional mixing achieved by air as it exits from a linear source. The theory of Prof Malcolm Cook (Loughborough University) may be used to model entrainment in a line plume. Supply conditions and design parameters for a typical classroom with two NVHR units are as follows for each NVHR unit; a fabric duct of length 2m, distance of diffuser from floor 2.7m, total flow through the duct 160l/s, room temperature 22oC.
Figure C3 Temperatures in classroom during January based on 1:4 mixing ratio
The results of the modelling are as follows:
The red line in Figure C4 denotes the temperature at which the air entering the room from the duct needs to achieve by the time the air gets to 1.4m from the floor. The blue line denotes the temperature of the mixed air at this height as a function of the temperature at which it is exhausted from the NVHR unit. It can be seen that when the mixed air temperature is at or above 9oC, the conditions are satisfied, in accordance with the air flow test results above.
Flow visualisationsFlow test visualisations have also been recorded, as shown in the videos available from Dropbox. Please note that the smoke tests were conducted in March 2015, with outside temperatures varying between 4-8oC.
AcousticsThe in-situ acoustic tests for the NVHR unit were undertaken and recorded by SRL. The results of these tests are in Appendices D and E.
Figure C4 Temperature at occupied level as a function of supply temperature
NVHR
0
2
4
6
8
10
12
14
16
18
20
-‐3 0 3 6 9 12 15 18
Tempe
rature at o
ccup
ied level (
o C)
Supply Temperature (oC)
Temperature 1.4m from floor
Minimum temperature allowed
-‐10
-‐5
0
5
10
15
20
25
01/01 06/01 11/01 16/01 21/01 26/01 31/01
Tempe
rature (oC)
Ext T
Occupied Level
Target Occupied Level Minimum
12
In-use data from St Raphael’s Primary School, LondonBreathing Buildings designed a low-energy ventilation solution for a new teaching block at St Raphael’s Primary School in North-West London. The building, completed in January 2015, includes a double-height dance/activity hall (ventilated with e-stack S1500 units), three ground floor classrooms (ventilated with NVHR units) and three first floor classrooms (ventilated with e-stack R-Series units).
In order to monitor the performance of the NVHR system, data logging was performed in one newly completed ground floor classroom. The room is thermally “lightweight” with conventional plasterboard walls, screed floor with 5mm carpet and suspended ceiling tiles. The North-facing façade, as shown in Figure C5, is entirely glazed, with total glazing area of 11m2.
Temperature data was recorded at 15 minutes intervals, 24 hours a day between 14th March and 18th July 2015: a continuous 18 week period of normal classroom use.
• Internal temperature was logged in four locations within the room: three in the occupied zone and one in the mixed air delivery duct of the NVHR unit
• External temperature was recorded on a shaded, North-facing external wall
Table C1 compares the external temperature recorded at St Raphael’s with comparable data recorded by the UK met office at their London Heathrow weather station; the school is approximately 5 miles directly North of Heathrow. The two data sets show very good agreement in both Daily Max and Daily Min temperature, effectively validating the St Raphael’s data.
NVHR External Louvres (pair)
NVHR Internal Grille (single)
Figure C5 External and internal views of the monitored classroom
Average of Daily Maximum (°C) Average of Daily Minimum (°C)
BB data, St Raphael's
Met Office data, Heathrow
BB data, St Raphael's
Met Office data, Heathrow
March 12.35 11.6 4.02 4.1
April 16.36 16.3 5.08 6
May 18.55 17.6 8.27 8.8
June 23.51 22.2 11.36 11.4
July 25.70 23.7 14.38 13.8
Table C1 Comparison of external temperature at St Raphael's with Met Office data from Heathrow Airport
13
Overall performance – March to JulyThe three internal temperature readings (typically within 1°C of each other) were averaged at each time step to produce a single representative room temperature trace.
Figure C6 shows a plot of the internal and external temperatures over the entire recording period, March-July 2015. External temperatures were as low as -1°C in March and as high as +36°C in July, with an observable increasing trend over the Spring-Summer recording period.
The target daytime set-point for the NVHR system is typically 21°C (although this does vary based on internal and external conditions). As shown by Figure C6, this target is well matched over the entire range of external temperatures – through cold periods and hot.
We note that the classroom was unoccupied 30th March – 10th April, 25th – 29th May and 29th June – 3rd July due to school holidays.
The control logic in use on the NVHR pair installed enables passive natural ventilation, winter mixing ventilation, ‘hybrid’ summer boost ventilation and secure, automated night cool. Night cool is activated on days when the maximum day temperature exceeds 24°C.
Comparing this real data with standard summertime overheating measures:
Figure C6 External and internal temperature data for the entire recording period, March-July 2015
TM52 overheating criteria:
1.# Hours when T_room
> T_acc = 0 *
2.Weighted Exceedance
= 0
3.T_max exceeded =
Never
PSBP Performance in Use Criteria:
•ΔT never
exceeds 4°C
* The measured room temperature is assumed to represent the operative temperature. This effectively assumes that the mean radiant temperature of surfaces is equal to the air temperature and that air velocity within the occupied zone is less than approximately 0.1m/s
Cold weather performanceWe begin with the first occupied week in the data set, Mon 16th – Fri 20th March 2015.
The external temperature during this week is regularly below 10°C. Figure C7 shows clearly that, despite the cold external temperature, the ventilation system maintains comfortable internal conditions, with the average room temperature in the range of 22-23°C on all occupied days.
Draught mitigation is a key priority for all Breathing Buildings systems. The purple line in Figure C6 is the temperature of air being supplied to the room from the NVHR unit. As intended in the control programming, this supply air temperature never falls below 14°C.
A horizontal green line is used to show the daily mean room temperature during occupied hours, 8am-4pm.
Hot weather performanceThe hot week presented is the warmest occupied week in the entire dataset, Mon 22nd – Fri 26th June 2015.
Despite external air temperatures in excess of 27°C, the internal room temperature is maintained below 24°C on most days, only reaching 26°C on the Friday afternoon of a consistently warm week.
Figure C7 Cold weather performance. Internal and external temperatures with daily mean temperature during the occupied period 8am-4pm
Figure C8 Hot weather performance. Internal and external temperatures with daily mean temperature during the occupied period 8am-4pm
NVHR
14
Two NVHR units were installed into the façade of a purpose built classroom. The acoustic tests were undertaken with fabric ducts mounted to the back of each NVHR unit.
SRL Technical Services limited were appointed to undertake acoustic tests of the two installed NVHR units on 7th January 2015.
The following operating points were commissioned to replicate the actual operating conditions of the NVHR unit as per the intended design:
Test 1: 112 litres /second per unit with the fresh air fan running only. Test 2: 124 litres /second per unit with the fresh air fan running only. This is circa 7.8 l/s/person for occupancy of
32 people. Test 3: 162 litres/second per unit with both the fresh air and the recirculating air fan running. This was commissioned to simulate the winter mixing mode.
Results confirmed by SRL:
Table D1 demonstrates that the NVHR system is able to operate within the ≤35 dB (A) sound pressure level in all of the proposed operating modes as part of the intended design.
We observed that the mock up had an exposed concrete slab, and three rows of suspended lighting rafts.
Measurement Position
Noise Level and Operating Mode, Sound Pressure Level dB(A)
Background onlyTest 1
(112 l/s with fresh air fan only)
Test 2 ( 124 l/s with fresh air
fan only)
Test 3 (162 l/s with both fans
running to provide mixing in winter)
A 29.8 32.9 35.5 34.8
B 26.3 33.3 35 34.7
C 27.5 34.3 35 34.6
D - 32.2 - 33.9
E 27.2 32.2 34 33.1
F - - 35 -
G - - 34.6 -
H 27.8 32.2 34.4 34.2
I 27 33.7 33.3 33.5
AVERAGE 27.7 33.0 34.6 34.2
Appendix D Acoustic Performance for NVHR with Fabric Duct in a Classroom
Table D1 Measured noise levels at various NVHR flow rates
15
Third Octave Band Centre Frequency (Hz)
63 125 250 500 1k 2k 4k
T (secs) 1.3 1.23 0.94 0.61 0.52 0.47 0.43
Table D2 Reverberation time measured in Classroom
Table D2 above shows the reverberation time measured on site by SRL.
An overall reverberation time of 0.53s (Tmf) is calculated from the above, and SRL confirmed that this is suitable for most educational spaces; the only exception could be SEN type areas where more absorption will be required for similar size rooms.
Break-in via NVHRThe SRL engineer placed a loudspeaker externally to the classroom and generated noise at levels of 85-90 dB 3m external to the façade. Noise levels were then measured inside the classroom while the external noise source was still on.
SRL reported a level difference between external and internal measurements to be 26 dB Dnew. We confirm that this is representative of the Dnew measurements undertaken in the SRL laboratory during the development of the product.
Figure D1 Approximate layout of classroom and the measurement positions
NVHR
I F C
BEH
ADGDoor
Fabric Duct
NVHR
Win
dow
NVHR
Fabric Duct
Raft
Raft
Raft
16
Two NVHR units were installed into the façade of a purpose built classroom. The acoustic tests were undertaken with fabric ducts removed to see if there is any measurable difference to the resultant sound pressure levels.
Following various air distribution tests carried out by Breathing Buildings to visualise discharge patterns and showing these to be acceptable without the use of fabric duct diffusers, it was decided that Breathing Buildings demonstrate the acoustic performance of the NVHR units without fabric ducts to be still compliant with the PSBP FOS. Breathing Buildings attended the site on 18th May 2015.
When the fabric ducts are removed, the external static pressure that the unit has to operate at is reduced; therefore at the same commissioned voltages, the total flow rates generated by the fans will be higher. This was confirmed by a traverse of measurements taken at the spigot face, and a total flow rate calculated from the average of these velocity readings. However due to tolerances associated with this method, and with the view to assess the acoustic performance as conservatively as possible, the fans weren’t turned down, and the un-ducted units were operated at the higher flow rates than those achieved with fabric ducts. The velocity readings across the spigot face were as follows:
Hot wire anemometer:4, 7, 3 and 5 m/s: Average = 4.75m/sCalculated flow rates for a 250 mm diameter spigot vary between approximately 180 to 230l/s depending on the physical free area correction applied.
Results:During the first phase of testing, one unit was left with a fabric duct diffuser, whereas the other one had a plain spigot with no ducting. Each unit was individually operated at the same voltages. The unit with fabric duct was delivering a little over 160 l/s as per the commissioning tests, with the other unit running at a higher flow rate due to a reduced system pressure as confirmed by averaged velocity readings taken at the spigot face.
Table E1 below shows the summary of acoustic readings taken at locations shown in Figure E1. The unit with fabric duct is referenced as FD; the unit with a plain end spigot with the fabric duct removed is referenced as SP. The unit with the fabric duct removed was also tested with a louvre mounted onto the spigot which is referred to within the table as CD. Background noise if recorded following a test is given immediately after the results within the same table. Background noise is referred to as BG.
Appendix E Acoustic Performance for NVHR with Grille in a Classroom
Tested Unit(s)
Measurement location
Sound pressure level measured at each octave frequencydB(A)
63 125 250 500 1K 2K 4K 8K
FD only A 34.4 32.4 30.8 32.7 30.2 29 22.8 15.2 34
BG for the above
A 25.7 26.7 27.3 29.8 29.1 28.8 23 15.6 33
FD only A 26.8 30.3 29.8 33.6 30 29.4 24.9 15.7 35
SP only B 31.6 35.4 36.1 33 33.5 31.7 25.2 17.5 37
BG for the above
B 31.1 34.4 33.4 34.4 37.6 35.1 27.8 18.3 40
SP only B 28.8 33.6 31.5 31.4 31.1 28.7 23.2 16.2 35
BG for the above
B 30.8 28.1 28.7 29.8 29.8 28.5 22.7 16.7 33
SP only B 34.9 35.5 32 34.1 31.1 30.8 26.8 16.5 36
CD only B 40 30.9 29.7 30.1 29.7 28.4 21.9 15.8 33
Table E1 Measured noise levels with units in operation alternating
17
Table E1 demonstrates that there is no measurable difference in noise levels when the fabric duct diffuser is removed. In other words, the fabric duct is acoustically transparent. Although on average the noise levels recorded for the plain end spigot unit are shown to be 1-2 dB higher, this is mainly due to the background noise being higher at the time of recording. This is clearly demonstrated in the above table. In addition to this, when a louvre faced diffuser was mounted onto the spigot, there was no measurable increase in noise; on the contrary, noise levels were lower but this was primarily due to a reduced background noise at the time of recording.
In addition to the individual tests summarised in Table E1, both units with plain end spigots running together were also recorded. Neither unit had any duct or diffuser attached to the spigot, and they were operated at the commissioned voltages used for the testing summarised in Table E1 (operating at higher flow rates than the design). The findings are summarised in Table E2 below.
Measurement location
Sound pressure level measured at each octave frequency (dB)
dB(A)63 125 250 500 1K 2K 4K 8K
A 28 33.6 34 34.9 32.5 30.8 27.2 19.4 37
B 31.6 32.6 32.6 32.5 31.4 29.6 23.9 17 35
C 24.4 32.9 32.9 33.1 31.2 30.3 24.7 17.2 36
D 27.2 31.4 32.7 33.2 31.1 28.8 24.3 16.5 35
E 25.3 31.9 31.2 32.9 30.7 28.3 24.6 17.2 35
Average 27.3 32.4 32.6 33.3 31.4 29.5 24.9 17.5 35
Table E2 Measured noise levels at various locations: both NVHR units running with no fabric ducts
NVHR
18
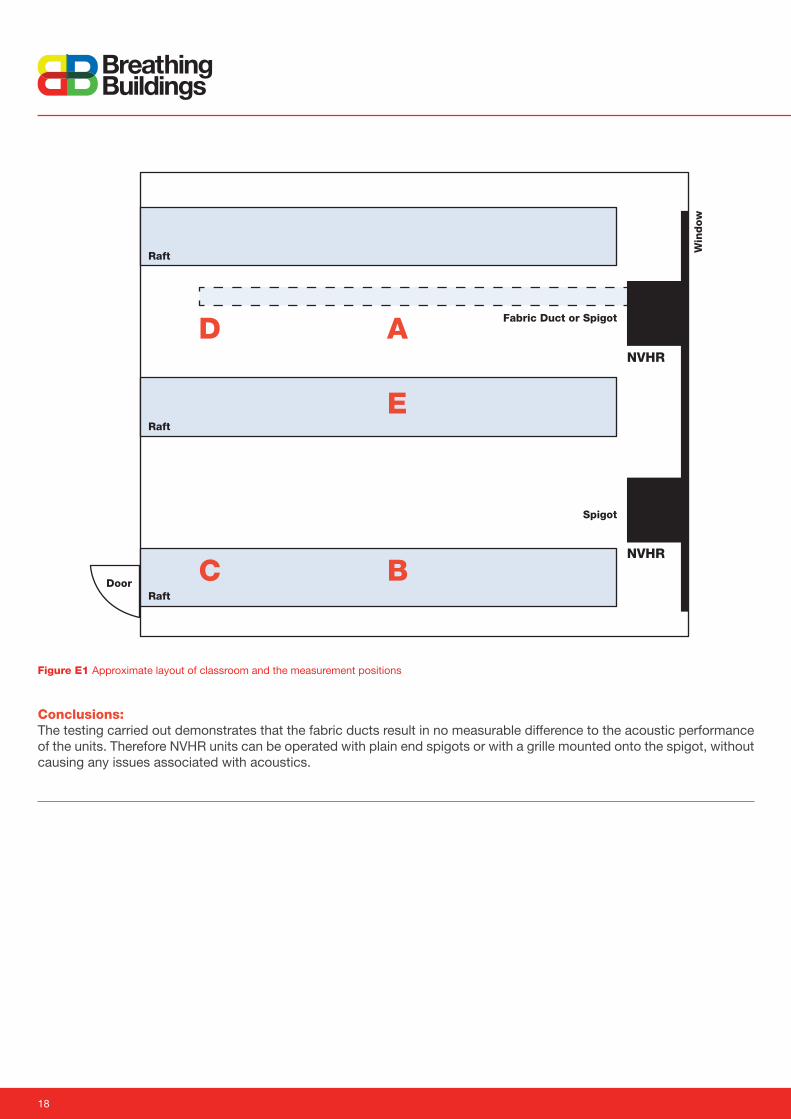
Figure E1 Approximate layout of classroom and the measurement positions
Conclusions:The testing carried out demonstrates that the fabric ducts result in no measurable difference to the acoustic performance of the units. Therefore NVHR units can be operated with plain end spigots or with a grille mounted onto the spigot, without causing any issues associated with acoustics.
C B
E
AD
Door
Fabric Duct or Spigot
NVHR
Win
dow
NVHR
Spigot
Raft
Raft
Raft
19
NVHR
Select an NVHR unit with integral grille, delivering 120 l/s fresh air in summer mode. In winter the unit will provide 80 l/s fresh air with an equal amount of recirculated air, delivering a total flow rate of 160 l/s. • What is the specific fan power of the unit?
• What voltages should be used for the fans?
• What are the predicted noise levels?
Using Figure A1: The commissioning voltage for the fresh air fan to generate 120 l/s at an external static pressure of 6 Pa (an estimate on required pressure for the exhaust grille) is approximately 4 Volts.
Using Figure A2: The specific fan power at 4 Volts and a pressure of 6 Pa is approximately 0.16 W/l/s.
0
0.1
0.2
0.3
0.4
0.5
0.6
0 10 20 30 40 50 60 70
8V
7V
6V
5V
4V
3V
Unit o
verall Specific Fan Po
wer [W
/l/s]
External Sta:c Pressure [Pa]
In winter mode:The fresh air fan voltage is 3.3 Volts, the recirculating fan voltage is 2.6 Volts, and the unit specific fan power with both fans running is 0.15 W/l/s.
From Table A2 and Table A3 room sound pressure levels for a single unit are predicted as 37 dB(A) and 29 dB(A) for summer and winter modes respectively.
0
50
100
150
200
250
300
0 10 20 30 40 50 60 70
8V
7V
6V
5V
4V
3V
Air F
low Rate [l/s]
External Sta5c Pressure [Pa]
0
0.05
0.1
0.15
0.2
0.25
0
1
2
3
4
5
6
0 5 10 15 20 25 30 35 40
80 l/s Fresh air fan control voltages (le< axis)
80 l/s recircula@ng air fan control voltages (le< axis)
Unit overall SFP @ 160 l/s (right axis)
External Sta+c Pressure [Pa]
Fan
Cont
rol V
olta
ge [V
]
Ove
rall
Spec
ific
Fan
Pow
er (W
/l/s
)
3.3
2.6
0.15
Appendix F Example Selection Method
20
900 WIDTH
ROOM SIDE
CL
900
CL 960
1000
941
305
14
1310 LENGTH
300
H
EIG
HT
DAMPER BLADES(SHOWN OPEN)
ISOMETRIC
FIXING BRACKETS
450
5
80 REMOVABLE
PANELS
REVERSE ISOMETRIC
GRILLE
Appendix G NVHR Dimensioned Drawing
Appendix H Illustrative System Schematic and Wiring
NVHR
Issue 2.0/Sept 15
Type 1 room interface
Dimensions
H 300 mm
D 1,200 mm
W 900 mm
Weight 45 Kg
Ident Device Cable Description Power RatingD Internal temperature/CO2 sensor 5 core shielded (24V DC, 0V, 10V DC signal 1, 10 V DC signal 2, shield) or Trend cable TP/2/2/22/HF/200 3W at 24V DCE External temp sensor 4 core shielded (24V DC, 0V, 10V DC , shield) or Trend cable TP/2/2/22/HF/200 3W at 24V DC
F Fire healthy signal FP200 (24 V DC switch supply, fire signal, earth) Nom
I User interface - Type 1 (for Type 2 see notes)
4 core (24V DC, 0V, 24V DC switch position Auto, 24V DC switch position Test) or Trend cable AND 4 core (24V DC switch position Max Vent, 24V DC switch position Disable, 24V DC signal Window Indicator, earth) or Trend cable
3W at 24V DC
L Single phase mains power 3 core (230V AC, N, PE) 10A at 230V AC N+PEM Modbus Cat 5 with RJ45 straight through N/AN1 NVHR Slave damper 3 core (24V DC, 0V, 24V DC signal 1) 3W at 24V DCN2 NVHR Slave fans 4 core (10V DC signal 1, 0V signal 1, 10V DC signal 2, 0V signal 2) 3W at 24V DC