Brüel & Kj ær Sound Level Meter Calibration System B&K 3630 CERTIFICATE OF CALIBRATION ***DRAFT*** Certificate No: 19/ Page 1 of 23 CALIBRATION OF: Sound Level Meter 2238-4188-BZ7126 No: 2246375 Microphone: 4188 No: 2231305 Identification: Date of receipt: 05/03/2012 Certificate No: 19/12 CLIENT: fakulta, z xy, 093 00 z Order No: 319264 CALIBRATION CONDITIONS: Preconditioning: 12 hours at 23 °C Environment conditions Air temperature: 24 °C ± 3°C Air pressure: 99.8 kPa ± 3 kPa Relative Humidity: 40 %RH ± 20 %RH SPECIFICATIONS: The Sound Level Meter has been calibrated in accordance with the requirements as specified in IEC 651 and IEC 804 type 1234, and vendor specific procedures. PROCEDURE: The measurements have been performed with the assistance of: Brüel & Kjær Sound Level Meter Calibration System B&K 3630 RESULTS: The reported expanded uncertainty is based on the standard uncertainty multiplied by a coverage factor k = 2 providing a level of confidence of approximately 95 %. The uncertainty evaluation has been carried out in accordance with EA-4/02 from elements originating from the standards, calibration method, effect of environmental conditions and any short time contribution from the device under calibration. Date of Calibration: 5/3/2012 Certificate issued: 5/3/2012 _____________________________________ _____________________________________ JAROMIR KUPCOK JAROMIR KUPCOK Calibration Technician Approved signatory Reproduction of the complete certificate is allowed. Parts of the certificate may only be reproduced after written permission.
Transcript
Brüel & Kjær
Sound Level Meter Calibration System
B&K 3630
CERTIFICATE OF CALIBRATION
***DRAFT*** Certificate No: 19/ Page 1 of 23
CALIBRATION OF: Sound Level Meter 2238-4188-BZ7126 No: 2246375 Microphone: 4188 No: 2231305 Identification: Date of receipt: 05/03/2012 Certificate No: 19/12
CLIENT: fakulta, z xy, 093 00 z Order No: 319264
CALIBRATION CONDITIONS: Preconditioning: 12 hours at 23 °C Environment conditions Air temperature: 24 °C ± 3°C
SPECIFICATIONS: The Sound Level Meter has been calibrated in accordance with the requirements as specified in IEC 651 and IEC 804 type 1234, and vendor specific procedures.
PROCEDURE: The measurements have been performed with the assistance of: Brüel & Kjær Sound Level Meter Calibration System B&K 3630
RESULTS: The reported expanded uncertainty is based on the standard uncertainty multiplied by a coverage factor k = 2 providing a level of confidence of approximately 95 %. The uncertainty evaluation has been carried out in accordance with EA-4/02 from elements originating from the standards, calibration method, effect of environmental conditions and any short time contribution from the device under calibration.
Date of Calibration: 5/3/2012 Certificate issued: 5/3/2012 _____________________________________ _____________________________________ JAROMIR KUPCOK JAROMIR KUPCOK Calibration Technician Approved signatory Reproduction of the complete certificate is allowed. Parts of the certificate may only be reproduced after written permission.
The Calibration Laboratory
CERTIFICATE OF CALIBRATION
***DRAFT*** Certificate No: 19/ Page 2 of 23
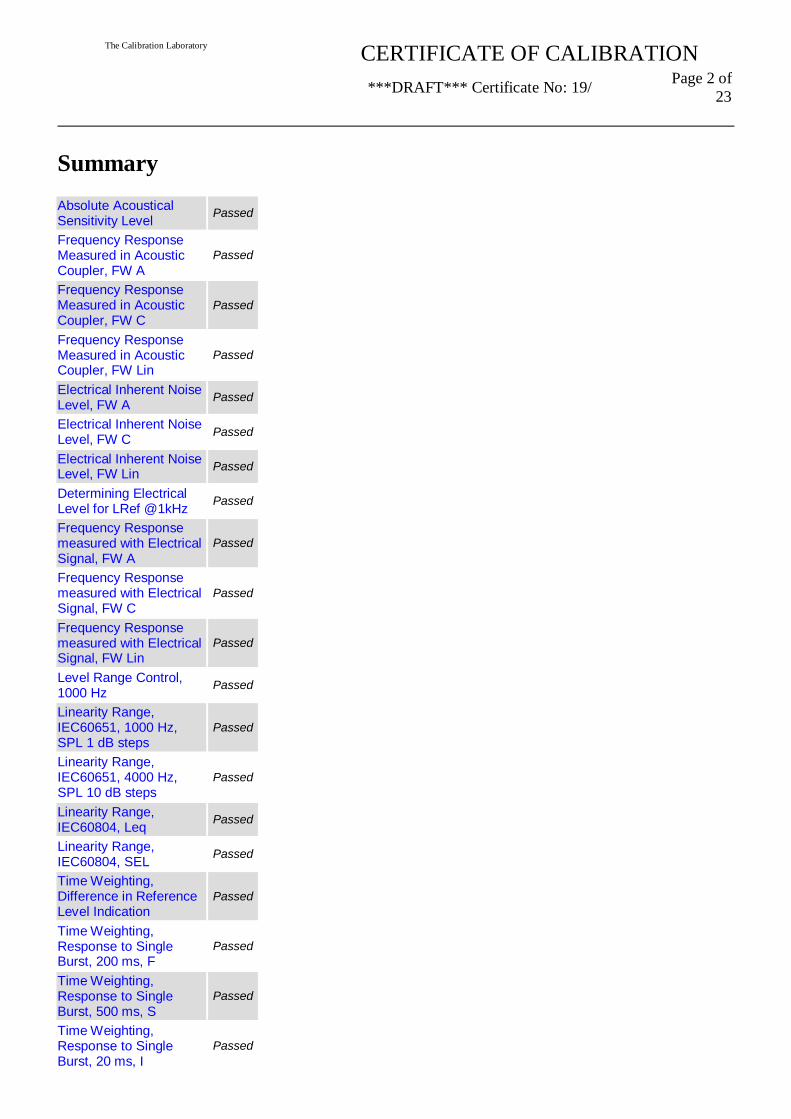
Summary Absolute Acoustical Sensitivity Level
Passed
Frequency Response Measured in Acoustic Coupler, FW A
Passed
Frequency Response Measured in Acoustic Coupler, FW C
Passed
Frequency Response Measured in Acoustic Coupler, FW Lin
Passed
Electrical Inherent Noise Level, FW A
Passed
Electrical Inherent Noise Level, FW C
Passed
Electrical Inherent Noise Level, FW Lin
Passed
Determining Electrical Level for LRef @1kHz
Passed
Frequency Response measured with Electrical Signal, FW A
Passed
Frequency Response measured with Electrical Signal, FW C
Passed
Frequency Response measured with Electrical Signal, FW Lin
Passed
Level Range Control, 1000 Hz
Passed
Linearity Range, IEC60651, 1000 Hz, SPL 1 dB steps
Passed
Linearity Range, IEC60651, 4000 Hz, SPL 10 dB steps
Passed
Linearity Range, IEC60804, Leq
Passed
Linearity Range, IEC60804, SEL
Passed
Time Weighting, Difference in Reference Level Indication
Passed
Time Weighting, Response to Single Burst, 200 ms, F
Passed
Time Weighting, Response to Single Burst, 500 ms, S
Passed
Time Weighting, Response to Single Burst, 20 ms, I
Passed
The Calibration Laboratory
CERTIFICATE OF CALIBRATION
***DRAFT*** Certificate No: 19/ Page 3 of 23
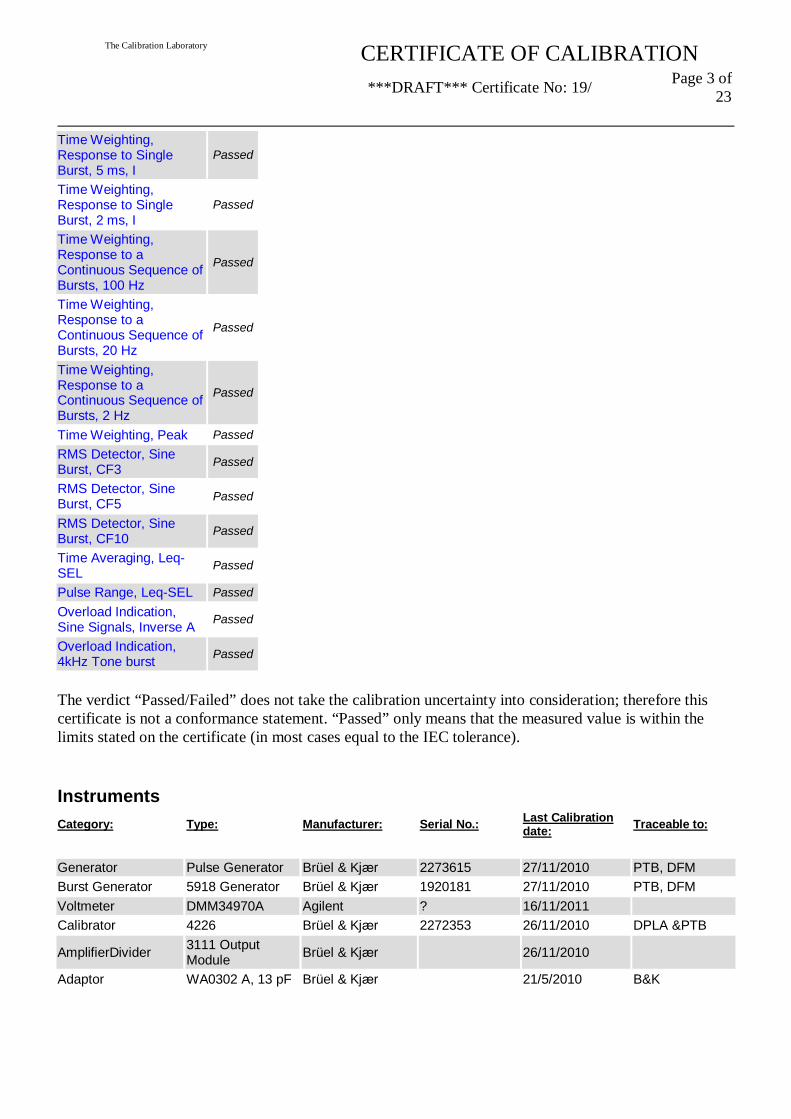
Time Weighting, Response to Single Burst, 5 ms, I
Passed
Time Weighting, Response to Single Burst, 2 ms, I
Passed
Time Weighting, Response to a Continuous Sequence of Bursts, 100 Hz
Passed
Time Weighting, Response to a Continuous Sequence of Bursts, 20 Hz
Passed
Time Weighting, Response to a Continuous Sequence of Bursts, 2 Hz
Passed
Time Weighting, Peak Passed
RMS Detector, Sine Burst, CF3
Passed
RMS Detector, Sine Burst, CF5
Passed
RMS Detector, Sine Burst, CF10
Passed
Time Averaging, Leq-SEL
Passed
Pulse Range, Leq-SEL Passed Overload Indication, Sine Signals, Inverse A
Passed
Overload Indication, 4kHz Tone burst
Passed
The verdict “Passed/Failed” does not take the calibration uncertainty into consideration; therefore this certificate is not a conformance statement. “Passed” only means that the measured value is within the limits stated on the certificate (in most cases equal to the IEC tolerance).
Instruments
Category: Type: Manufacturer: Serial No.: Last Calibration date: Traceable to:
Adaptor WA0302 A, 13 pF Brüel & Kjær 21/5/2010 B&K
The Calibration Laboratory
CERTIFICATE OF CALIBRATION
***DRAFT*** Certificate No: 19/ Page 4 of 23
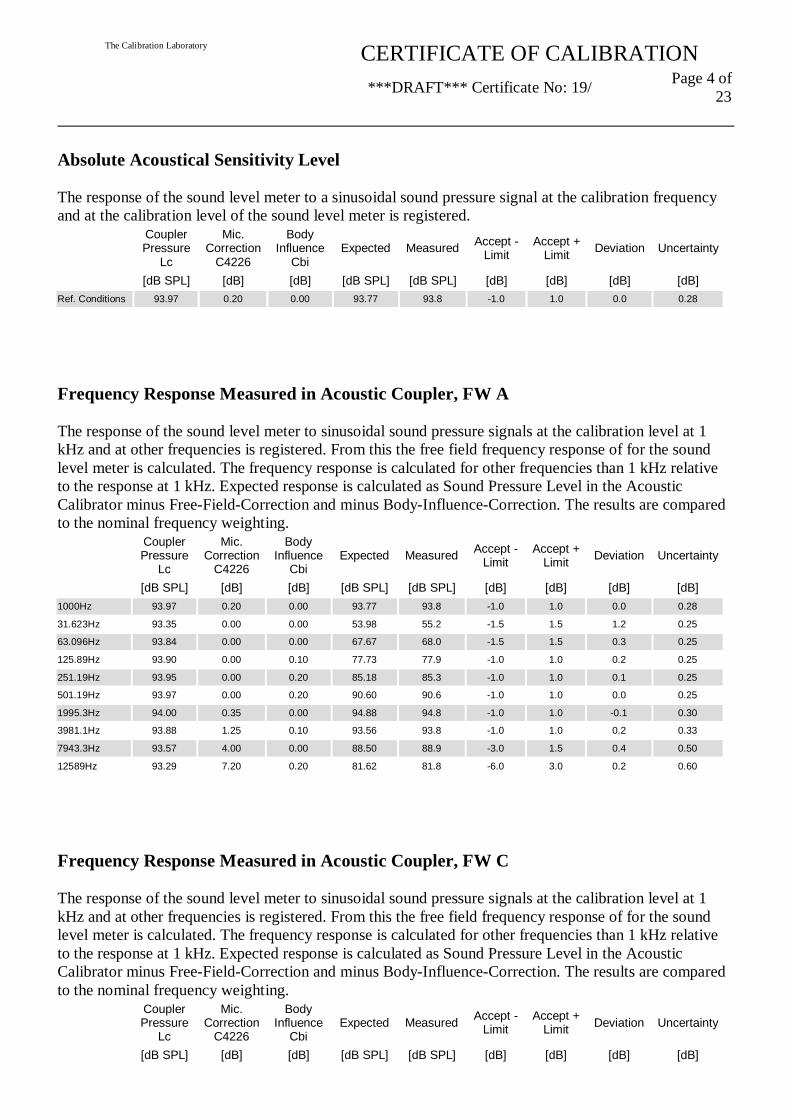
Absolute Acoustical Sensitivity Level
The response of the sound level meter to a sinusoidal sound pressure signal at the calibration frequency and at the calibration level of the sound level meter is registered.
Frequency Response Measured in Acoustic Coupler, FW A
The response of the sound level meter to sinusoidal sound pressure signals at the calibration level at 1 kHz and at other frequencies is registered. From this the free field frequency response of for the sound level meter is calculated. The frequency response is calculated for other frequencies than 1 kHz relative to the response at 1 kHz. Expected response is calculated as Sound Pressure Level in the Acoustic Calibrator minus Free-Field-Correction and minus Body-Influence-Correction. The results are compared to the nominal frequency weighting.
Frequency Response Measured in Acoustic Coupler, FW C
The response of the sound level meter to sinusoidal sound pressure signals at the calibration level at 1 kHz and at other frequencies is registered. From this the free field frequency response of for the sound level meter is calculated. The frequency response is calculated for other frequencies than 1 kHz relative to the response at 1 kHz. Expected response is calculated as Sound Pressure Level in the Acoustic Calibrator minus Free-Field-Correction and minus Body-Influence-Correction. The results are compared to the nominal frequency weighting.
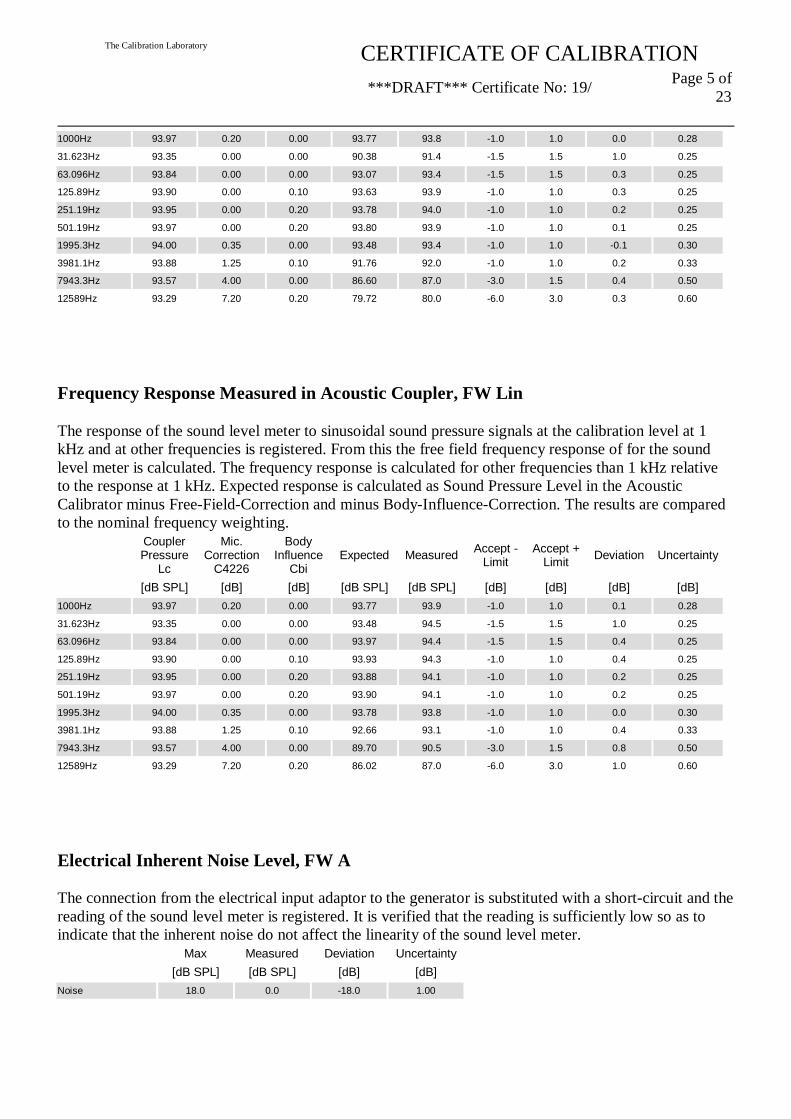
Frequency Response Measured in Acoustic Coupler, FW Lin
The response of the sound level meter to sinusoidal sound pressure signals at the calibration level at 1 kHz and at other frequencies is registered. From this the free field frequency response of for the sound level meter is calculated. The frequency response is calculated for other frequencies than 1 kHz relative to the response at 1 kHz. Expected response is calculated as Sound Pressure Level in the Acoustic Calibrator minus Free-Field-Correction and minus Body-Influence-Correction. The results are compared to the nominal frequency weighting.
The connection from the electrical input adaptor to the generator is substituted with a short-circuit and the reading of the sound level meter is registered. It is verified that the reading is sufficiently low so as to indicate that the inherent noise do not affect the linearity of the sound level meter. Max Measured Deviation Uncertainty [dB SPL] [dB SPL] [dB] [dB] Noise 18.0 0.0 -18.0 1.00
The Calibration Laboratory
CERTIFICATE OF CALIBRATION
***DRAFT*** Certificate No: 19/ Page 6 of 23
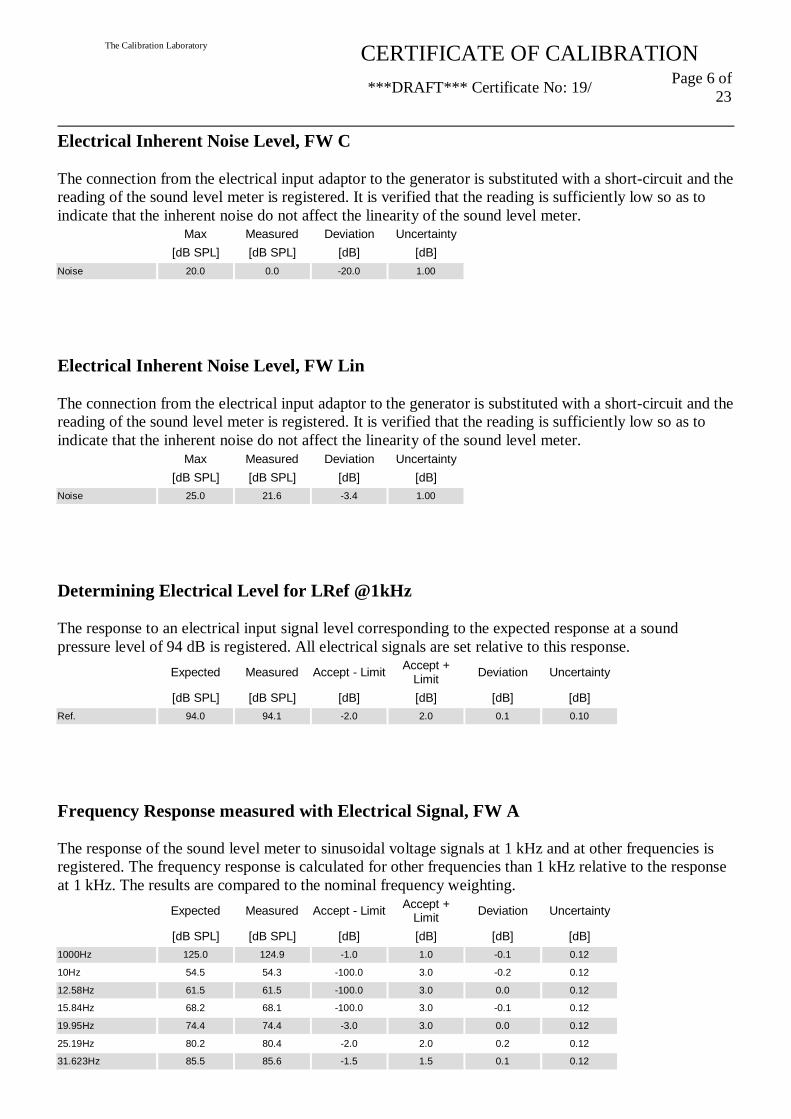
Electrical Inherent Noise Level, FW C
The connection from the electrical input adaptor to the generator is substituted with a short-circuit and the reading of the sound level meter is registered. It is verified that the reading is sufficiently low so as to indicate that the inherent noise do not affect the linearity of the sound level meter. Max Measured Deviation Uncertainty [dB SPL] [dB SPL] [dB] [dB] Noise 20.0 0.0 -20.0 1.00
Electrical Inherent Noise Level, FW Lin
The connection from the electrical input adaptor to the generator is substituted with a short-circuit and the reading of the sound level meter is registered. It is verified that the reading is sufficiently low so as to indicate that the inherent noise do not affect the linearity of the sound level meter. Max Measured Deviation Uncertainty [dB SPL] [dB SPL] [dB] [dB] Noise 25.0 21.6 -3.4 1.00
Determining Electrical Level for LRef @1kHz
The response to an electrical input signal level corresponding to the expected response at a sound pressure level of 94 dB is registered. All electrical signals are set relative to this response. Expected Measured Accept - Limit Accept +
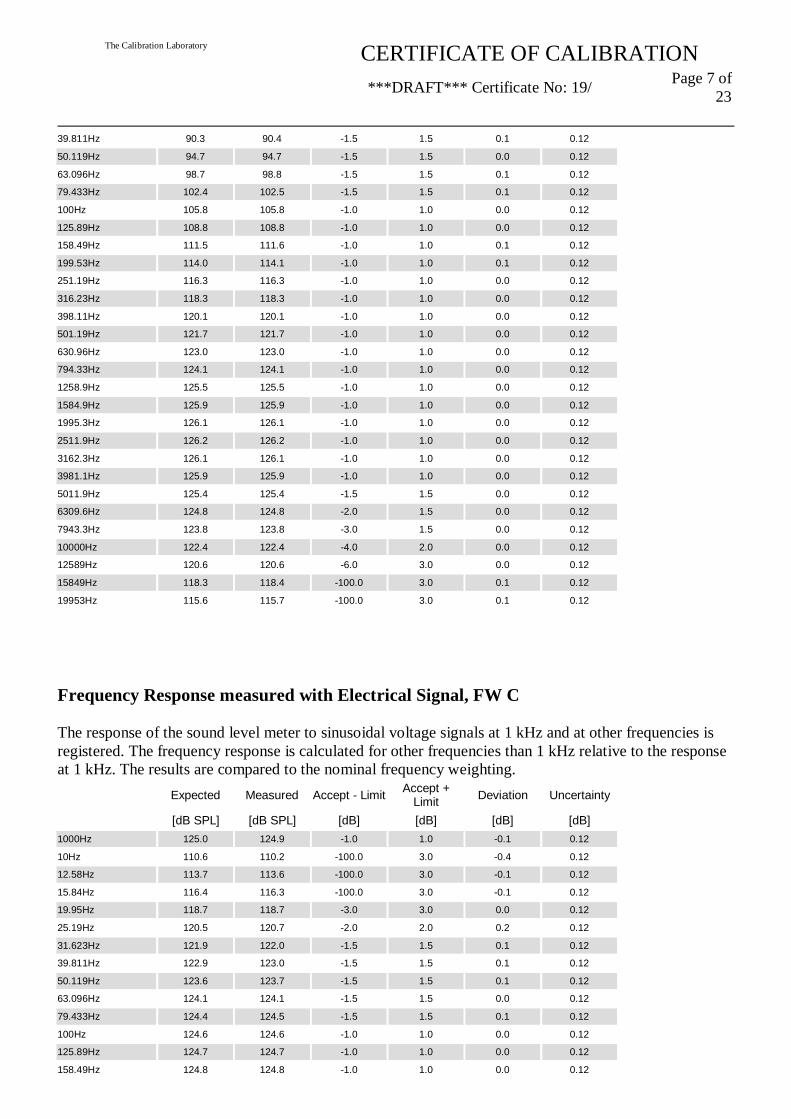
Frequency Response measured with Electrical Signal, FW A
The response of the sound level meter to sinusoidal voltage signals at 1 kHz and at other frequencies is registered. The frequency response is calculated for other frequencies than 1 kHz relative to the response at 1 kHz. The results are compared to the nominal frequency weighting. Expected Measured Accept - Limit Accept +
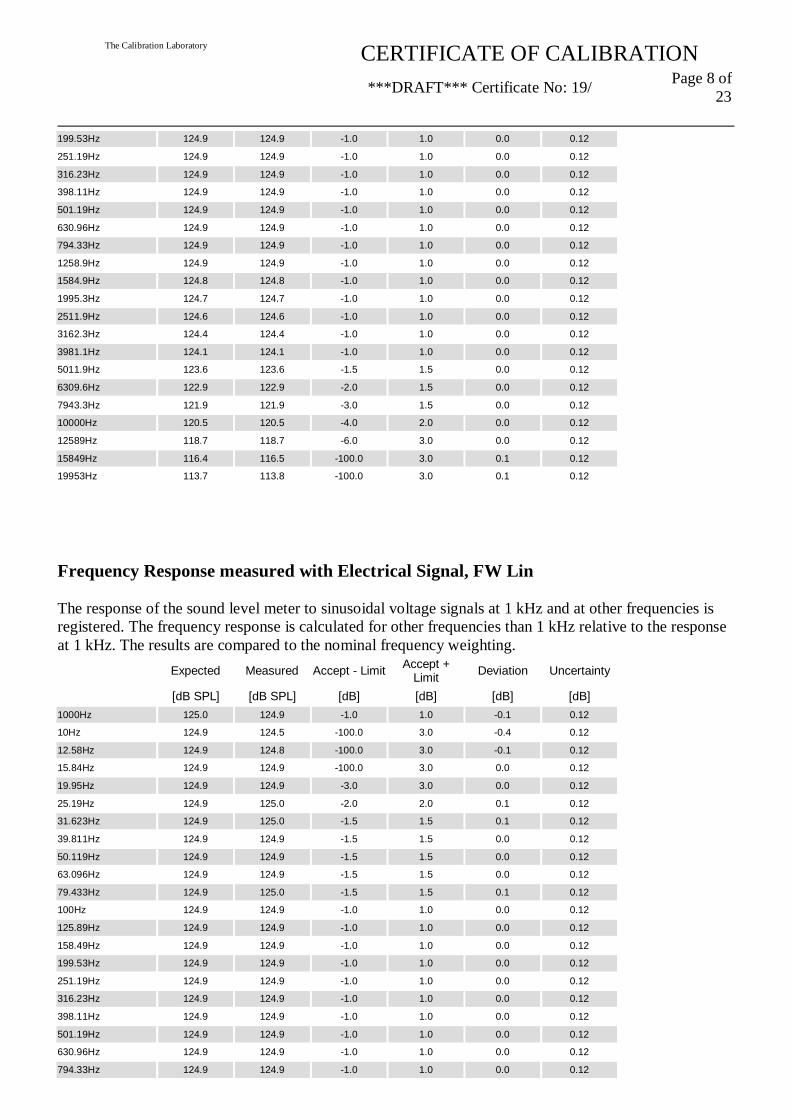
Frequency Response measured with Electrical Signal, FW C
The response of the sound level meter to sinusoidal voltage signals at 1 kHz and at other frequencies is registered. The frequency response is calculated for other frequencies than 1 kHz relative to the response at 1 kHz. The results are compared to the nominal frequency weighting. Expected Measured Accept - Limit Accept +
Frequency Response measured with Electrical Signal, FW Lin
The response of the sound level meter to sinusoidal voltage signals at 1 kHz and at other frequencies is registered. The frequency response is calculated for other frequencies than 1 kHz relative to the response at 1 kHz. The results are compared to the nominal frequency weighting. Expected Measured Accept - Limit Accept +
The response of the sound level meter to a sinosoidal voltage signal is registered in each of the level ranges of the sound level meter. The relative response to the response in the reference level range is calculated for each level range, and the relative response is compared to the anticipated relative response. Expected Measured Accept - Limit Accept +
Limit Deviation Uncertainty
[dB SPL] [dB SPL] [dB] [dB] [dB] [dB] Ref. 94.0 94.0 -1.0 1.0 0.0 0.12 Meas. in range 140 104.0 104.0 -0.5 0.5 0.0 0.12 Meas. in range 120 84.0 84.0 -0.5 0.5 0.0 0.12 Meas. in range 110 74.0 74.0 -0.5 0.5 0.0 0.12 Meas. in range 100 64.0 64.0 -0.5 0.5 0.0 0.12
Linearity Range, IEC60651, 1000 Hz, SPL 1 dB steps
The response of the sound level meter to sinusoidal voltage signals is registered for various levels covering the reference level range, including a level nominally corresponding to Lref at the measurement frequency. From this the response at the other levels is calculated relative to the response at the level corresponding to Lref. The relative response is compared to the anticipated relative response. For each level the difference between the responses at the level and at the previous level is also calculated in order to determine differential level linearity. Expected Measured Accept - Limit Accept +
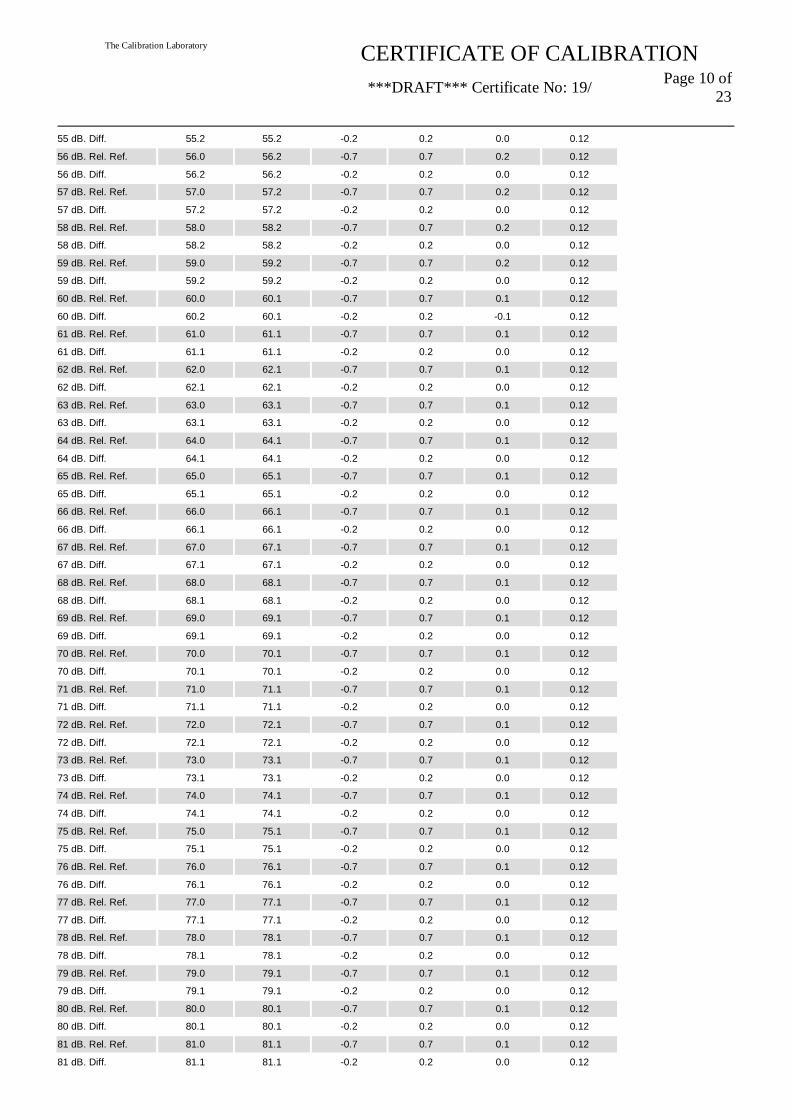
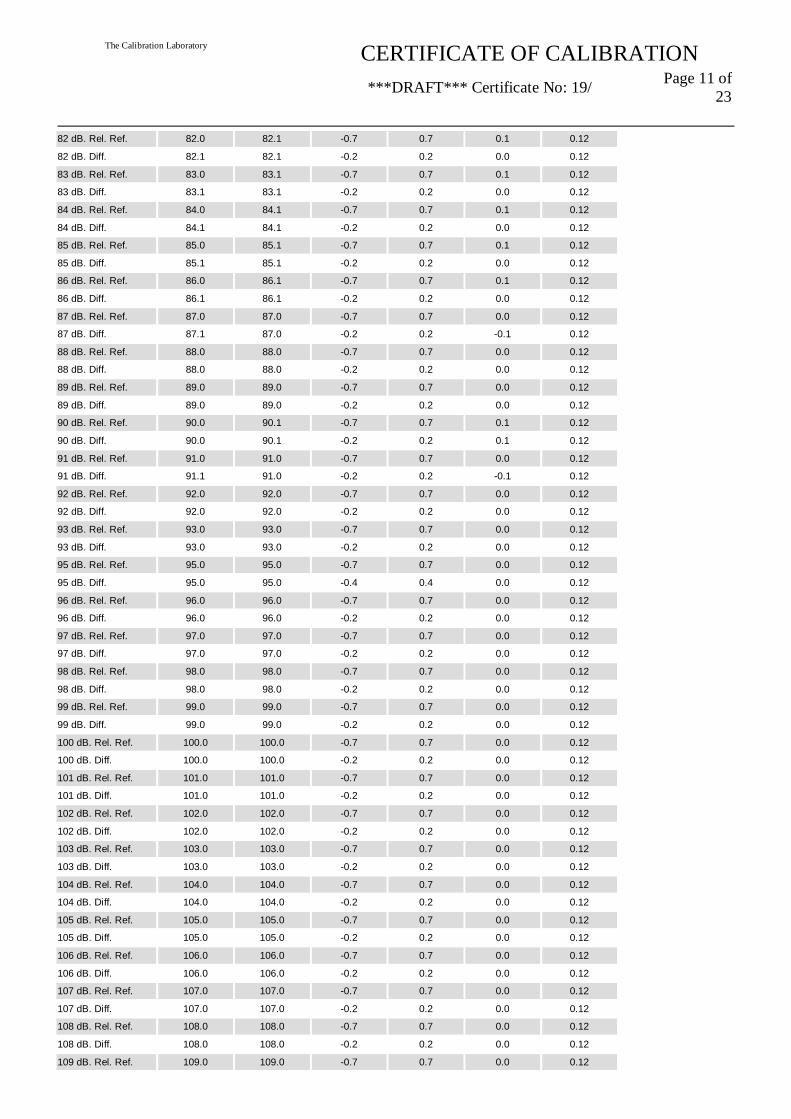
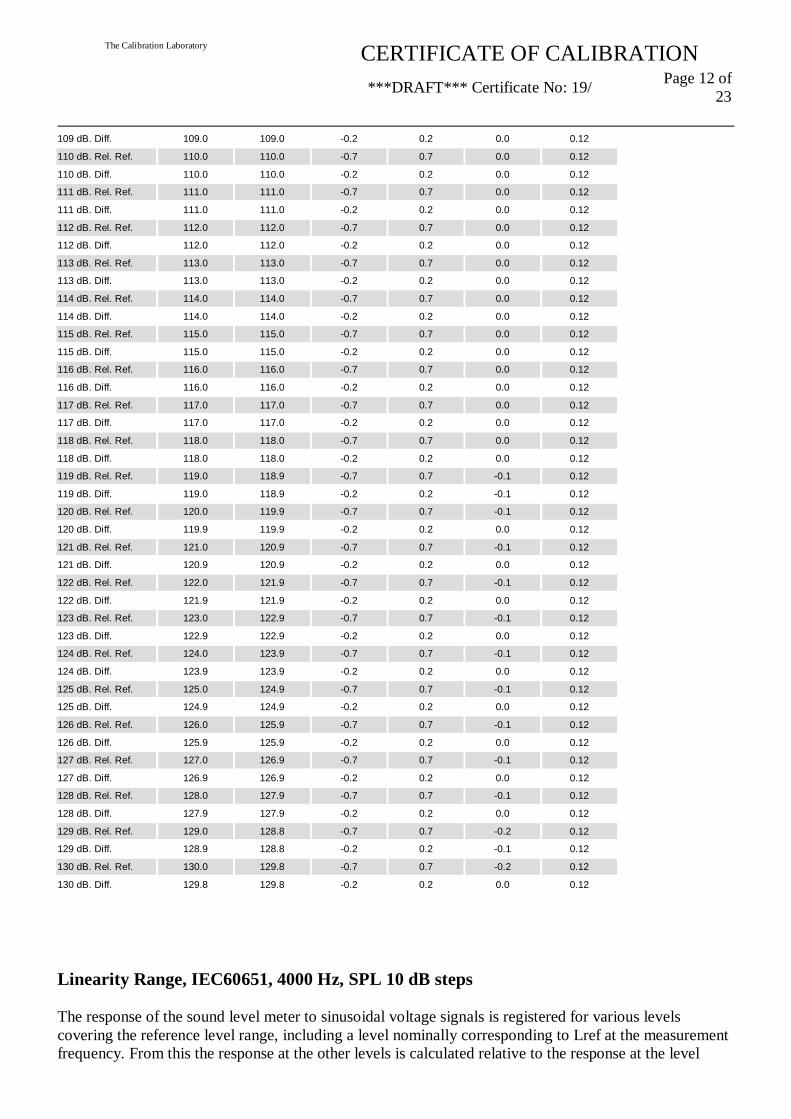
Linearity Range, IEC60651, 4000 Hz, SPL 10 dB steps
The response of the sound level meter to sinusoidal voltage signals is registered for various levels covering the reference level range, including a level nominally corresponding to Lref at the measurement frequency. From this the response at the other levels is calculated relative to the response at the level
The Calibration Laboratory
CERTIFICATE OF CALIBRATION
***DRAFT*** Certificate No: 19/ Page 13 of 23
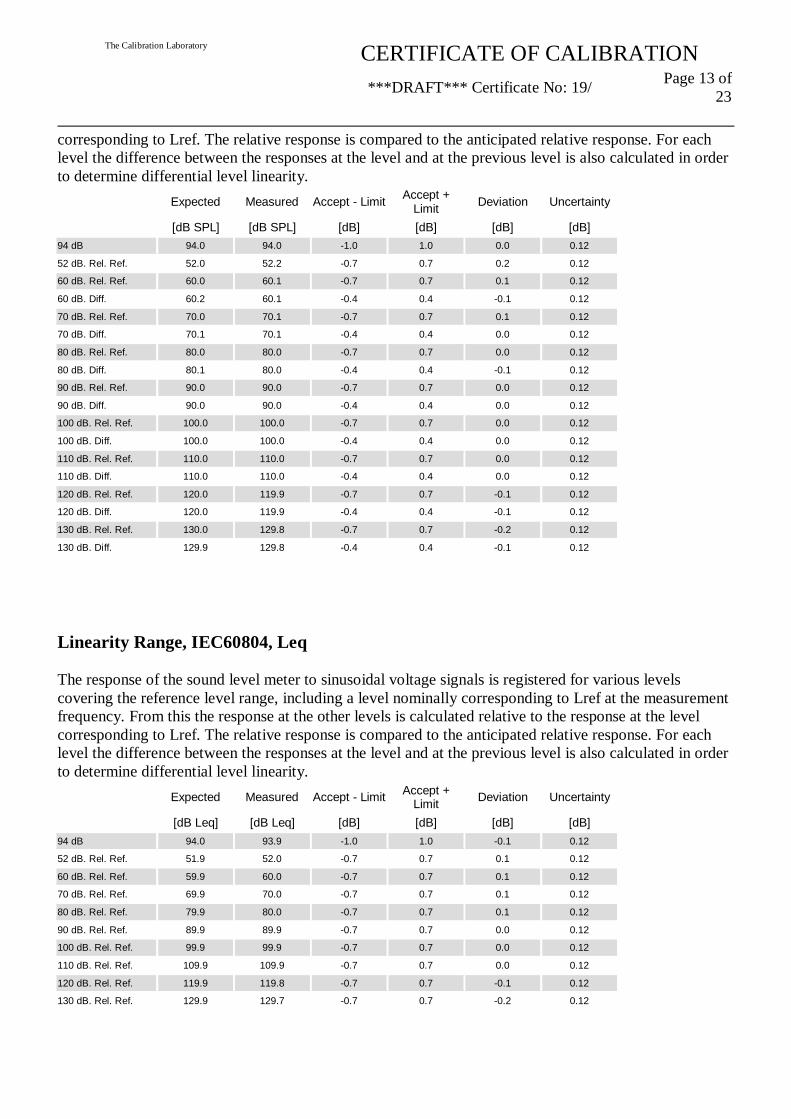
corresponding to Lref. The relative response is compared to the anticipated relative response. For each level the difference between the responses at the level and at the previous level is also calculated in order to determine differential level linearity. Expected Measured Accept - Limit Accept +
The response of the sound level meter to sinusoidal voltage signals is registered for various levels covering the reference level range, including a level nominally corresponding to Lref at the measurement frequency. From this the response at the other levels is calculated relative to the response at the level corresponding to Lref. The relative response is compared to the anticipated relative response. For each level the difference between the responses at the level and at the previous level is also calculated in order to determine differential level linearity. Expected Measured Accept - Limit Accept +
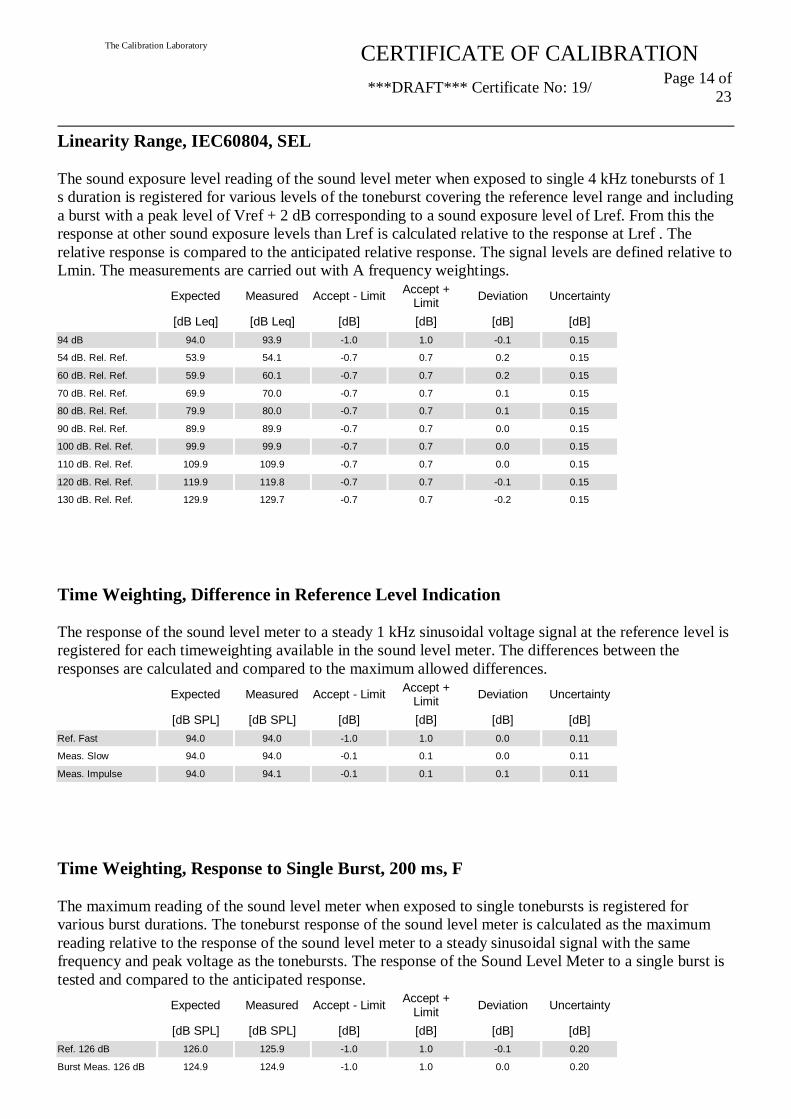
The sound exposure level reading of the sound level meter when exposed to single 4 kHz tonebursts of 1 s duration is registered for various levels of the toneburst covering the reference level range and including a burst with a peak level of Vref + 2 dB corresponding to a sound exposure level of Lref. From this the response at other sound exposure levels than Lref is calculated relative to the response at Lref . The relative response is compared to the anticipated relative response. The signal levels are defined relative to Lmin. The measurements are carried out with A frequency weightings. Expected Measured Accept - Limit Accept +
Time Weighting, Difference in Reference Level Indication
The response of the sound level meter to a steady 1 kHz sinusoidal voltage signal at the reference level is registered for each timeweighting available in the sound level meter. The differences between the responses are calculated and compared to the maximum allowed differences. Expected Measured Accept - Limit Accept +
Time Weighting, Response to Single Burst, 200 ms, F
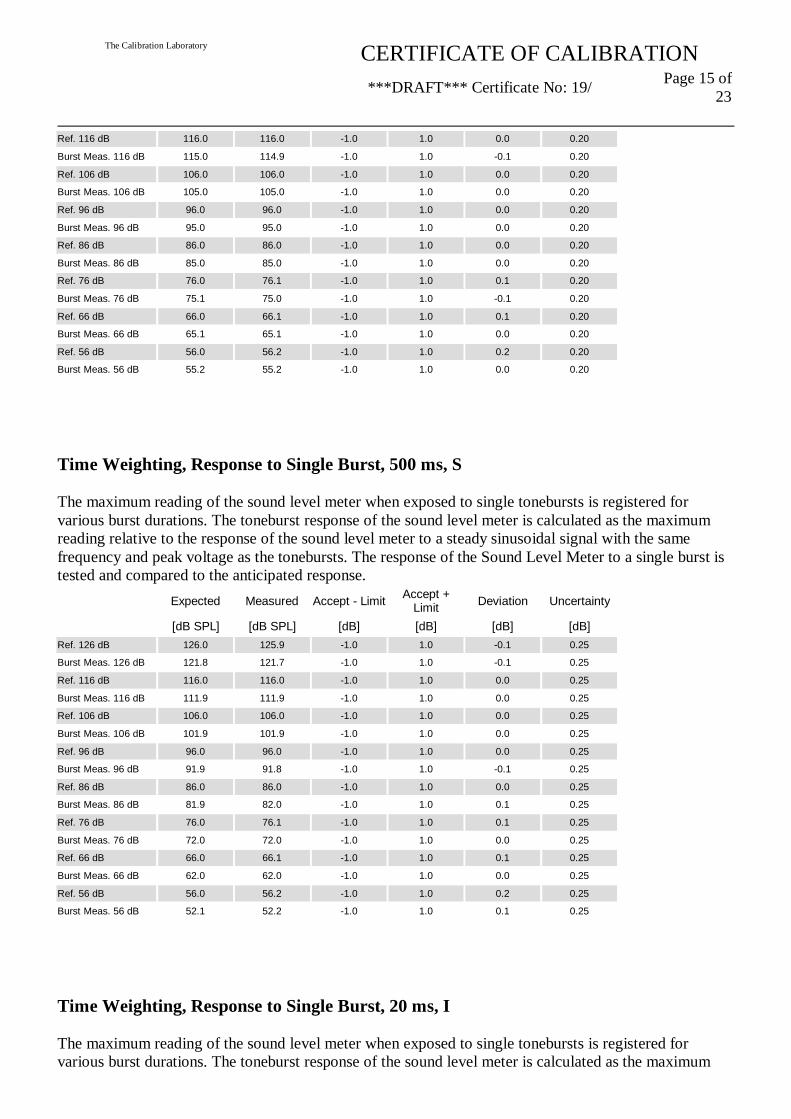
The maximum reading of the sound level meter when exposed to single tonebursts is registered for various burst durations. The toneburst response of the sound level meter is calculated as the maximum reading relative to the response of the sound level meter to a steady sinusoidal signal with the same frequency and peak voltage as the tonebursts. The response of the Sound Level Meter to a single burst is tested and compared to the anticipated response. Expected Measured Accept - Limit Accept +
Ref. 116 dB 116.0 116.0 -1.0 1.0 0.0 0.20 Burst Meas. 116 dB 115.0 114.9 -1.0 1.0 -0.1 0.20 Ref. 106 dB 106.0 106.0 -1.0 1.0 0.0 0.20 Burst Meas. 106 dB 105.0 105.0 -1.0 1.0 0.0 0.20 Ref. 96 dB 96.0 96.0 -1.0 1.0 0.0 0.20 Burst Meas. 96 dB 95.0 95.0 -1.0 1.0 0.0 0.20 Ref. 86 dB 86.0 86.0 -1.0 1.0 0.0 0.20 Burst Meas. 86 dB 85.0 85.0 -1.0 1.0 0.0 0.20 Ref. 76 dB 76.0 76.1 -1.0 1.0 0.1 0.20 Burst Meas. 76 dB 75.1 75.0 -1.0 1.0 -0.1 0.20 Ref. 66 dB 66.0 66.1 -1.0 1.0 0.1 0.20 Burst Meas. 66 dB 65.1 65.1 -1.0 1.0 0.0 0.20 Ref. 56 dB 56.0 56.2 -1.0 1.0 0.2 0.20 Burst Meas. 56 dB 55.2 55.2 -1.0 1.0 0.0 0.20
Time Weighting, Response to Single Burst, 500 ms, S
The maximum reading of the sound level meter when exposed to single tonebursts is registered for various burst durations. The toneburst response of the sound level meter is calculated as the maximum reading relative to the response of the sound level meter to a steady sinusoidal signal with the same frequency and peak voltage as the tonebursts. The response of the Sound Level Meter to a single burst is tested and compared to the anticipated response. Expected Measured Accept - Limit Accept +
Limit Deviation Uncertainty
[dB SPL] [dB SPL] [dB] [dB] [dB] [dB] Ref. 126 dB 126.0 125.9 -1.0 1.0 -0.1 0.25 Burst Meas. 126 dB 121.8 121.7 -1.0 1.0 -0.1 0.25 Ref. 116 dB 116.0 116.0 -1.0 1.0 0.0 0.25 Burst Meas. 116 dB 111.9 111.9 -1.0 1.0 0.0 0.25 Ref. 106 dB 106.0 106.0 -1.0 1.0 0.0 0.25 Burst Meas. 106 dB 101.9 101.9 -1.0 1.0 0.0 0.25 Ref. 96 dB 96.0 96.0 -1.0 1.0 0.0 0.25 Burst Meas. 96 dB 91.9 91.8 -1.0 1.0 -0.1 0.25 Ref. 86 dB 86.0 86.0 -1.0 1.0 0.0 0.25 Burst Meas. 86 dB 81.9 82.0 -1.0 1.0 0.1 0.25 Ref. 76 dB 76.0 76.1 -1.0 1.0 0.1 0.25 Burst Meas. 76 dB 72.0 72.0 -1.0 1.0 0.0 0.25 Ref. 66 dB 66.0 66.1 -1.0 1.0 0.1 0.25 Burst Meas. 66 dB 62.0 62.0 -1.0 1.0 0.0 0.25 Ref. 56 dB 56.0 56.2 -1.0 1.0 0.2 0.25 Burst Meas. 56 dB 52.1 52.2 -1.0 1.0 0.1 0.25
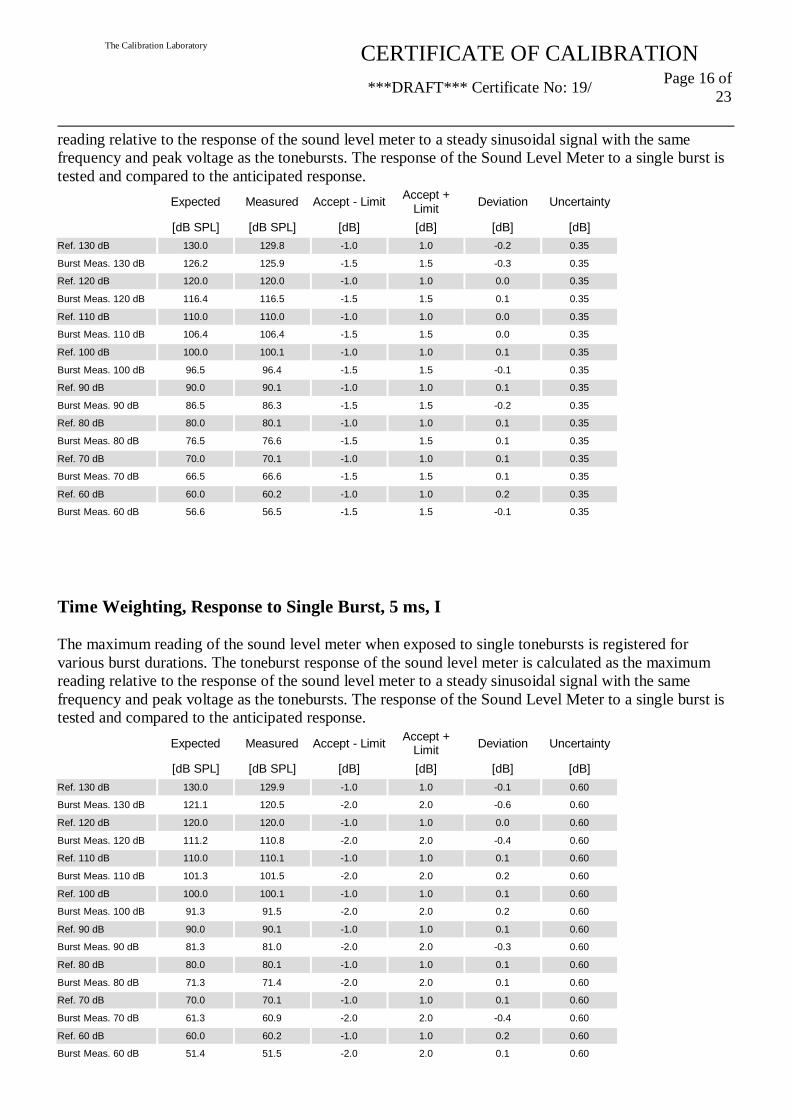
Time Weighting, Response to Single Burst, 20 ms, I
The maximum reading of the sound level meter when exposed to single tonebursts is registered for various burst durations. The toneburst response of the sound level meter is calculated as the maximum
The Calibration Laboratory
CERTIFICATE OF CALIBRATION
***DRAFT*** Certificate No: 19/ Page 16 of 23
reading relative to the response of the sound level meter to a steady sinusoidal signal with the same frequency and peak voltage as the tonebursts. The response of the Sound Level Meter to a single burst is tested and compared to the anticipated response. Expected Measured Accept - Limit Accept +
Limit Deviation Uncertainty
[dB SPL] [dB SPL] [dB] [dB] [dB] [dB] Ref. 130 dB 130.0 129.8 -1.0 1.0 -0.2 0.35 Burst Meas. 130 dB 126.2 125.9 -1.5 1.5 -0.3 0.35 Ref. 120 dB 120.0 120.0 -1.0 1.0 0.0 0.35 Burst Meas. 120 dB 116.4 116.5 -1.5 1.5 0.1 0.35 Ref. 110 dB 110.0 110.0 -1.0 1.0 0.0 0.35 Burst Meas. 110 dB 106.4 106.4 -1.5 1.5 0.0 0.35 Ref. 100 dB 100.0 100.1 -1.0 1.0 0.1 0.35 Burst Meas. 100 dB 96.5 96.4 -1.5 1.5 -0.1 0.35 Ref. 90 dB 90.0 90.1 -1.0 1.0 0.1 0.35 Burst Meas. 90 dB 86.5 86.3 -1.5 1.5 -0.2 0.35 Ref. 80 dB 80.0 80.1 -1.0 1.0 0.1 0.35 Burst Meas. 80 dB 76.5 76.6 -1.5 1.5 0.1 0.35 Ref. 70 dB 70.0 70.1 -1.0 1.0 0.1 0.35 Burst Meas. 70 dB 66.5 66.6 -1.5 1.5 0.1 0.35 Ref. 60 dB 60.0 60.2 -1.0 1.0 0.2 0.35 Burst Meas. 60 dB 56.6 56.5 -1.5 1.5 -0.1 0.35
Time Weighting, Response to Single Burst, 5 ms, I
The maximum reading of the sound level meter when exposed to single tonebursts is registered for various burst durations. The toneburst response of the sound level meter is calculated as the maximum reading relative to the response of the sound level meter to a steady sinusoidal signal with the same frequency and peak voltage as the tonebursts. The response of the Sound Level Meter to a single burst is tested and compared to the anticipated response. Expected Measured Accept - Limit Accept +
Limit Deviation Uncertainty
[dB SPL] [dB SPL] [dB] [dB] [dB] [dB] Ref. 130 dB 130.0 129.9 -1.0 1.0 -0.1 0.60 Burst Meas. 130 dB 121.1 120.5 -2.0 2.0 -0.6 0.60 Ref. 120 dB 120.0 120.0 -1.0 1.0 0.0 0.60 Burst Meas. 120 dB 111.2 110.8 -2.0 2.0 -0.4 0.60 Ref. 110 dB 110.0 110.1 -1.0 1.0 0.1 0.60 Burst Meas. 110 dB 101.3 101.5 -2.0 2.0 0.2 0.60 Ref. 100 dB 100.0 100.1 -1.0 1.0 0.1 0.60 Burst Meas. 100 dB 91.3 91.5 -2.0 2.0 0.2 0.60 Ref. 90 dB 90.0 90.1 -1.0 1.0 0.1 0.60 Burst Meas. 90 dB 81.3 81.0 -2.0 2.0 -0.3 0.60 Ref. 80 dB 80.0 80.1 -1.0 1.0 0.1 0.60 Burst Meas. 80 dB 71.3 71.4 -2.0 2.0 0.1 0.60 Ref. 70 dB 70.0 70.1 -1.0 1.0 0.1 0.60 Burst Meas. 70 dB 61.3 60.9 -2.0 2.0 -0.4 0.60 Ref. 60 dB 60.0 60.2 -1.0 1.0 0.2 0.60 Burst Meas. 60 dB 51.4 51.5 -2.0 2.0 0.1 0.60
The Calibration Laboratory
CERTIFICATE OF CALIBRATION
***DRAFT*** Certificate No: 19/ Page 17 of 23
Time Weighting, Response to Single Burst, 2 ms, I
The maximum reading of the sound level meter when exposed to single tonebursts is registered for various burst durations. The toneburst response of the sound level meter is calculated as the maximum reading relative to the response of the sound level meter to a steady sinusoidal signal with the same frequency and peak voltage as the tonebursts. The response of the Sound Level Meter to a single burst is tested and compared to the anticipated response. Expected Measured Accept - Limit Accept +
Time Weighting, Response to a Continuous Sequence of Bursts, 100 Hz
The response of the sound level meter to sequences of repeated tonebursts when measuring time-weighted sound level is registered for various toneburst repetition frequencies. The peak level of the tonebursts is held constant for all the signals, and the toneburst response of the sound level meter is calculated as the maximum reading relative to the response of the sound level meter to a steady sinusoidal signal with the same peak voltage as the tonebursts. The responses are compared to the anticipated responses. Expected Measured Accept - Limit Accept +
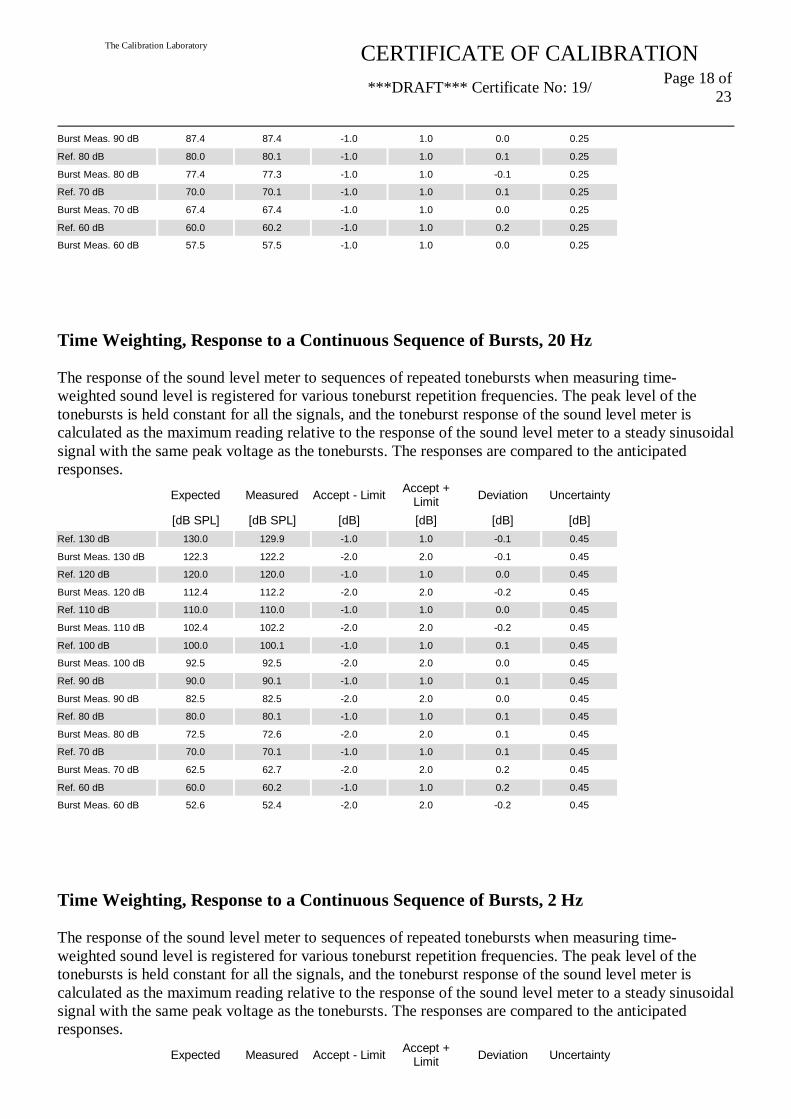
Burst Meas. 90 dB 87.4 87.4 -1.0 1.0 0.0 0.25 Ref. 80 dB 80.0 80.1 -1.0 1.0 0.1 0.25 Burst Meas. 80 dB 77.4 77.3 -1.0 1.0 -0.1 0.25 Ref. 70 dB 70.0 70.1 -1.0 1.0 0.1 0.25 Burst Meas. 70 dB 67.4 67.4 -1.0 1.0 0.0 0.25 Ref. 60 dB 60.0 60.2 -1.0 1.0 0.2 0.25 Burst Meas. 60 dB 57.5 57.5 -1.0 1.0 0.0 0.25
Time Weighting, Response to a Continuous Sequence of Bursts, 20 Hz
The response of the sound level meter to sequences of repeated tonebursts when measuring time-weighted sound level is registered for various toneburst repetition frequencies. The peak level of the tonebursts is held constant for all the signals, and the toneburst response of the sound level meter is calculated as the maximum reading relative to the response of the sound level meter to a steady sinusoidal signal with the same peak voltage as the tonebursts. The responses are compared to the anticipated responses. Expected Measured Accept - Limit Accept +
Limit Deviation Uncertainty
[dB SPL] [dB SPL] [dB] [dB] [dB] [dB] Ref. 130 dB 130.0 129.9 -1.0 1.0 -0.1 0.45 Burst Meas. 130 dB 122.3 122.2 -2.0 2.0 -0.1 0.45 Ref. 120 dB 120.0 120.0 -1.0 1.0 0.0 0.45 Burst Meas. 120 dB 112.4 112.2 -2.0 2.0 -0.2 0.45 Ref. 110 dB 110.0 110.0 -1.0 1.0 0.0 0.45 Burst Meas. 110 dB 102.4 102.2 -2.0 2.0 -0.2 0.45 Ref. 100 dB 100.0 100.1 -1.0 1.0 0.1 0.45 Burst Meas. 100 dB 92.5 92.5 -2.0 2.0 0.0 0.45 Ref. 90 dB 90.0 90.1 -1.0 1.0 0.1 0.45 Burst Meas. 90 dB 82.5 82.5 -2.0 2.0 0.0 0.45 Ref. 80 dB 80.0 80.1 -1.0 1.0 0.1 0.45 Burst Meas. 80 dB 72.5 72.6 -2.0 2.0 0.1 0.45 Ref. 70 dB 70.0 70.1 -1.0 1.0 0.1 0.45 Burst Meas. 70 dB 62.5 62.7 -2.0 2.0 0.2 0.45 Ref. 60 dB 60.0 60.2 -1.0 1.0 0.2 0.45 Burst Meas. 60 dB 52.6 52.4 -2.0 2.0 -0.2 0.45
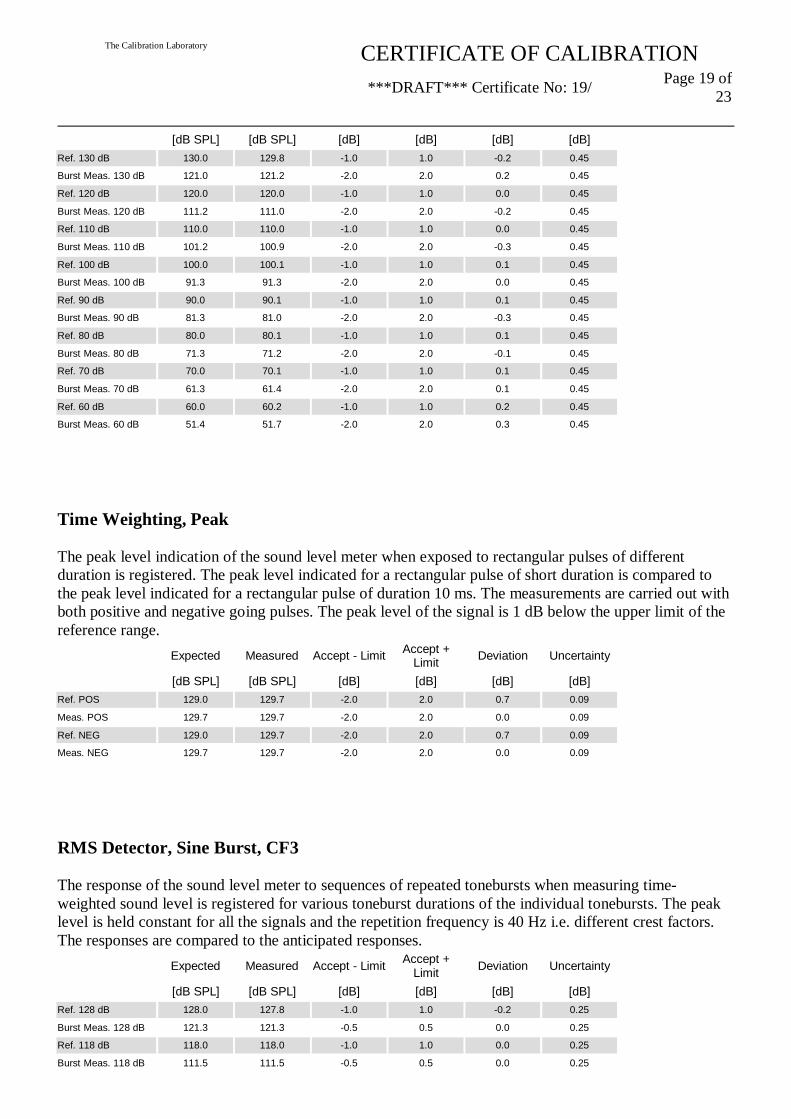
Time Weighting, Response to a Continuous Sequence of Bursts, 2 Hz
The response of the sound level meter to sequences of repeated tonebursts when measuring time-weighted sound level is registered for various toneburst repetition frequencies. The peak level of the tonebursts is held constant for all the signals, and the toneburst response of the sound level meter is calculated as the maximum reading relative to the response of the sound level meter to a steady sinusoidal signal with the same peak voltage as the tonebursts. The responses are compared to the anticipated responses. Expected Measured Accept - Limit Accept +
Limit Deviation Uncertainty
The Calibration Laboratory
CERTIFICATE OF CALIBRATION
***DRAFT*** Certificate No: 19/ Page 19 of 23
[dB SPL] [dB SPL] [dB] [dB] [dB] [dB] Ref. 130 dB 130.0 129.8 -1.0 1.0 -0.2 0.45 Burst Meas. 130 dB 121.0 121.2 -2.0 2.0 0.2 0.45 Ref. 120 dB 120.0 120.0 -1.0 1.0 0.0 0.45 Burst Meas. 120 dB 111.2 111.0 -2.0 2.0 -0.2 0.45 Ref. 110 dB 110.0 110.0 -1.0 1.0 0.0 0.45 Burst Meas. 110 dB 101.2 100.9 -2.0 2.0 -0.3 0.45 Ref. 100 dB 100.0 100.1 -1.0 1.0 0.1 0.45 Burst Meas. 100 dB 91.3 91.3 -2.0 2.0 0.0 0.45 Ref. 90 dB 90.0 90.1 -1.0 1.0 0.1 0.45 Burst Meas. 90 dB 81.3 81.0 -2.0 2.0 -0.3 0.45 Ref. 80 dB 80.0 80.1 -1.0 1.0 0.1 0.45 Burst Meas. 80 dB 71.3 71.2 -2.0 2.0 -0.1 0.45 Ref. 70 dB 70.0 70.1 -1.0 1.0 0.1 0.45 Burst Meas. 70 dB 61.3 61.4 -2.0 2.0 0.1 0.45 Ref. 60 dB 60.0 60.2 -1.0 1.0 0.2 0.45 Burst Meas. 60 dB 51.4 51.7 -2.0 2.0 0.3 0.45
Time Weighting, Peak
The peak level indication of the sound level meter when exposed to rectangular pulses of different duration is registered. The peak level indicated for a rectangular pulse of short duration is compared to the peak level indicated for a rectangular pulse of duration 10 ms. The measurements are carried out with both positive and negative going pulses. The peak level of the signal is 1 dB below the upper limit of the reference range. Expected Measured Accept - Limit Accept +
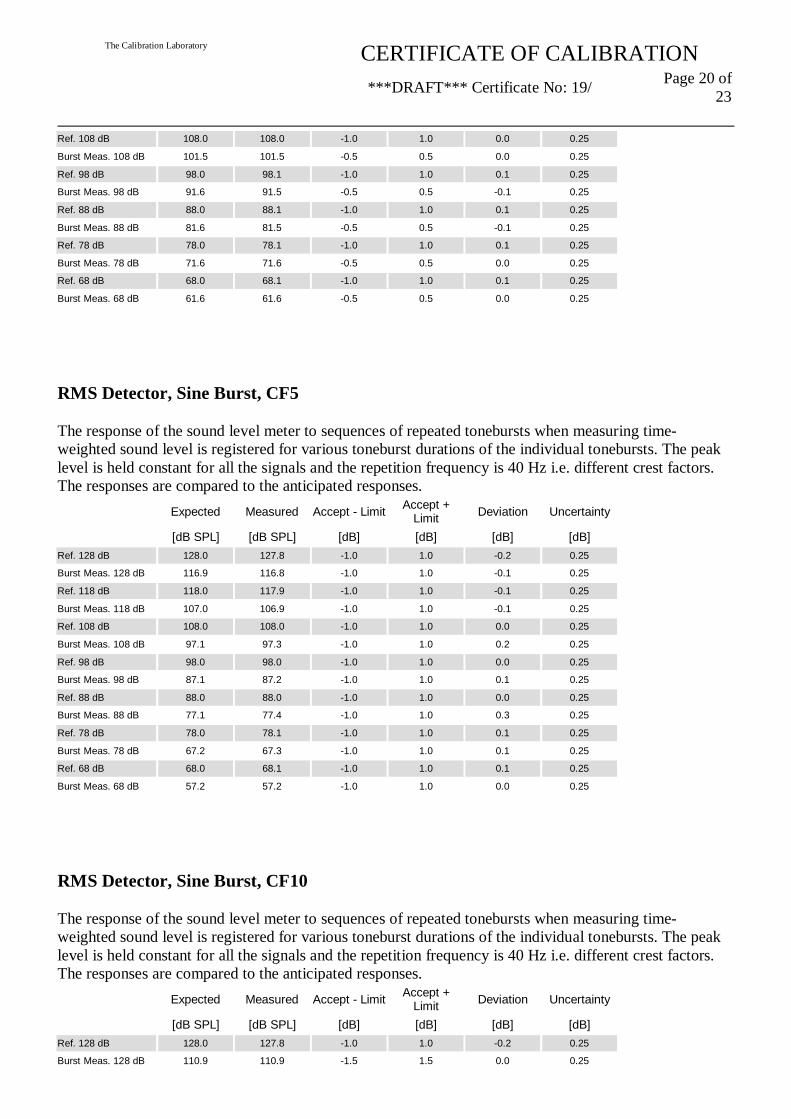
The response of the sound level meter to sequences of repeated tonebursts when measuring time-weighted sound level is registered for various toneburst durations of the individual tonebursts. The peak level is held constant for all the signals and the repetition frequency is 40 Hz i.e. different crest factors. The responses are compared to the anticipated responses. Expected Measured Accept - Limit Accept +
Ref. 108 dB 108.0 108.0 -1.0 1.0 0.0 0.25 Burst Meas. 108 dB 101.5 101.5 -0.5 0.5 0.0 0.25 Ref. 98 dB 98.0 98.1 -1.0 1.0 0.1 0.25 Burst Meas. 98 dB 91.6 91.5 -0.5 0.5 -0.1 0.25 Ref. 88 dB 88.0 88.1 -1.0 1.0 0.1 0.25 Burst Meas. 88 dB 81.6 81.5 -0.5 0.5 -0.1 0.25 Ref. 78 dB 78.0 78.1 -1.0 1.0 0.1 0.25 Burst Meas. 78 dB 71.6 71.6 -0.5 0.5 0.0 0.25 Ref. 68 dB 68.0 68.1 -1.0 1.0 0.1 0.25 Burst Meas. 68 dB 61.6 61.6 -0.5 0.5 0.0 0.25
RMS Detector, Sine Burst, CF5
The response of the sound level meter to sequences of repeated tonebursts when measuring time-weighted sound level is registered for various toneburst durations of the individual tonebursts. The peak level is held constant for all the signals and the repetition frequency is 40 Hz i.e. different crest factors. The responses are compared to the anticipated responses. Expected Measured Accept - Limit Accept +
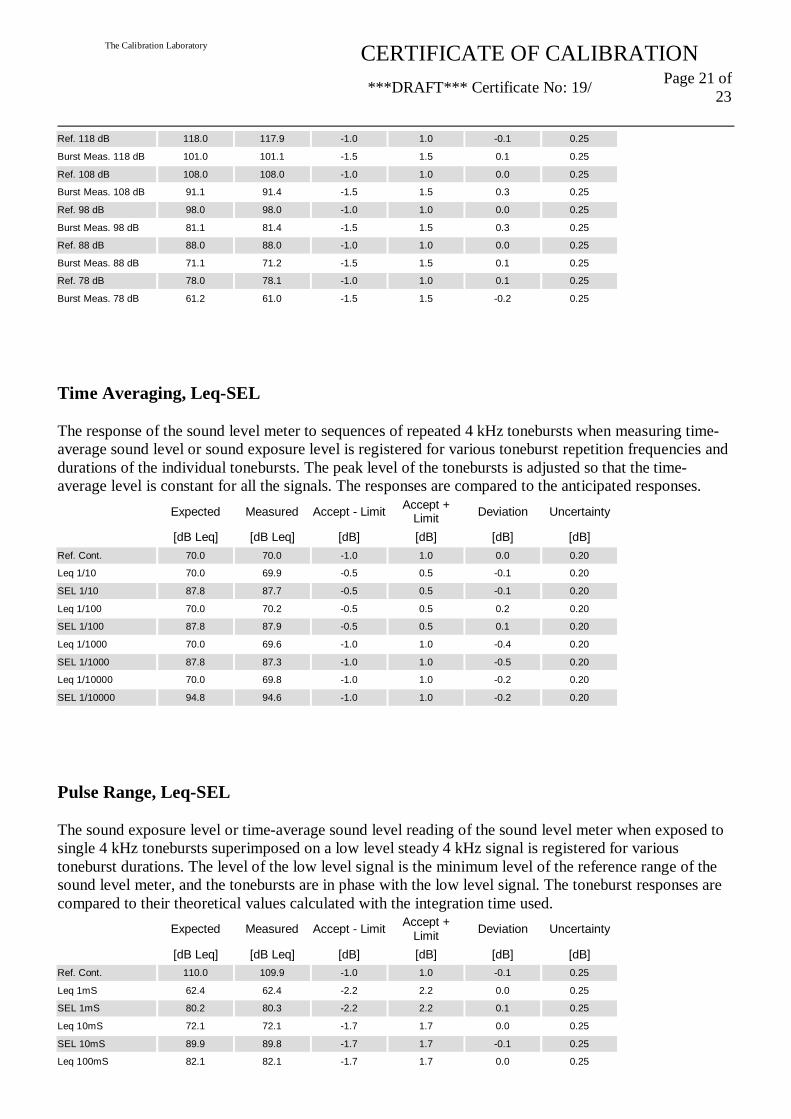
The response of the sound level meter to sequences of repeated tonebursts when measuring time-weighted sound level is registered for various toneburst durations of the individual tonebursts. The peak level is held constant for all the signals and the repetition frequency is 40 Hz i.e. different crest factors. The responses are compared to the anticipated responses. Expected Measured Accept - Limit Accept +
Ref. 118 dB 118.0 117.9 -1.0 1.0 -0.1 0.25 Burst Meas. 118 dB 101.0 101.1 -1.5 1.5 0.1 0.25 Ref. 108 dB 108.0 108.0 -1.0 1.0 0.0 0.25 Burst Meas. 108 dB 91.1 91.4 -1.5 1.5 0.3 0.25 Ref. 98 dB 98.0 98.0 -1.0 1.0 0.0 0.25 Burst Meas. 98 dB 81.1 81.4 -1.5 1.5 0.3 0.25 Ref. 88 dB 88.0 88.0 -1.0 1.0 0.0 0.25 Burst Meas. 88 dB 71.1 71.2 -1.5 1.5 0.1 0.25 Ref. 78 dB 78.0 78.1 -1.0 1.0 0.1 0.25 Burst Meas. 78 dB 61.2 61.0 -1.5 1.5 -0.2 0.25
Time Averaging, Leq-SEL
The response of the sound level meter to sequences of repeated 4 kHz tonebursts when measuring time-average sound level or sound exposure level is registered for various toneburst repetition frequencies and durations of the individual tonebursts. The peak level of the tonebursts is adjusted so that the time-average level is constant for all the signals. The responses are compared to the anticipated responses. Expected Measured Accept - Limit Accept +
The sound exposure level or time-average sound level reading of the sound level meter when exposed to single 4 kHz tonebursts superimposed on a low level steady 4 kHz signal is registered for various toneburst durations. The level of the low level signal is the minimum level of the reference range of the sound level meter, and the tonebursts are in phase with the low level signal. The toneburst responses are compared to their theoretical values calculated with the integration time used. Expected Measured Accept - Limit Accept +
The function of the overload detector of the sound level meter is verified with different voltage signals at levels around the limit of overload indication. A signal at a level corresponding to 5 dB below the maximum level of the sound level meter is applied starting at 1 kHz. The frequency of the signal is then lowered in 1/3-octave steps, and at the same time the level of the signal is increased so as to keep the same A-frequency-weighted level, until an overload is detected or the acceptance limits of the routine are exceeded. Expected Measured Accept - Limit Accept +
The function of the overload detector of the sound level meter is verified with different voltage signals at levels around the limit of overload indication. The applied signal is a 4-period 4 kHz tonebursts starting 5 dB below Lmax, the signal level is increased until an overload is detected or the acceptance limits of the routine are exceeded. Expected Measured Accept - Limit Accept +