Brent Crude Brent Crude The slippery climb upwards The slippery climb upwards 4 0 0 2 may Talking to Ralph Acampora The day-of-the-week effect Andrews’ Pitchfork .technicalanalyst.co.uk www Why traders should look at what prices aren’t doing On getting TA the respect it deserves Monday blues and sunny Fridays
Talking to Ralph Acampora The day-of-the-week effectAndrews’ Pitchfork
.technicalanalyst.co.uk www
Why traders should look at
what prices aren’t doing
On getting TA the
respect it deserves
Monday blues and
sunny Fridays
Advertisements - STA and Paritech
April 2004 THE TECHNICAL ANALYST 1
WELCOME
Cycles are cent ra l to th is issue of The Technical Analyst . Somecyc les, such as the day-of - the-week, are easy to take on board.After a l l , i t ' s not much of a surpr ise to f ind out that , in genera l , themarke ts a re i n a be t te r mood on F r i day t han on Monday.Researchers f rom the Nat ional Univers i ty o f S ingapore f ind ev i -dence for th is e ffect in the s tock markets o f As ia , but a lso go fur -ther in t ry ing to ident i fy whether some weeks are g loomier or hap-p ie r than o thers and in de te rmin ing wha t the re la t ionsh ip i sbetween the Monday and the preceding Fr iday.
Some cyc les invo lve a rhythm that may ho ld some psycholog ica land env i ronmenta l underp inn ing, such as those impl ic i t in the four-week ru le , but which are harder to exp la in fu l ly. In our ar t ic le on thefour-week ru le , the author prov ides some pract ica l adv ice on how toshore-up th is genera l phenomenon wi th pract ica l ru les and compl i -mentary analys is .
F ina l ly, we take the cyc le to the f ront iers o f comprehension wi th anar t ic le on Bradley 's s iderograph, a means of us ing ast ro logy toforecast mass market h ighs and lows. Despi te any natura l scept i -c ism for th is subject area, we inc lude th is ar t ic le because the pub-l ished resu l ts are impress ive and should be scrut in ised fur ther.
A lso in th is issue: a pract ica l ar t ic le on us ing Andrews' P i tchforkand new research on non- l inear i ty in the s tock markets and fore ignexchange rates of South-East As ia . In the la t ter ar t ic le , the authorscharacter ise the type of non- l inear i ty present and go on to suggestwhich TA techniques should work bet ter than others as a resu l t .
I f you have any comments on any aspect o f The Technica l Analystor jus t have someth ing to say on the subject , p lease emai l them toeditor@technicalanalyst .co.uk .
Matthew ClementsEditor
Editor: Matthew Clements (MSTA)[email protected] Editor: Jim BissEditorial Board:Mikael Bask, Umea University, SwedenTai-Leung Terence Chong, TheChinese University of Hong KongMarketing: Vanessa GreenSales: Christopher LeighDesign: Paul Simpson
The Technical Analyst is published byClements Biss Economic Publications Ltd,10-12 King Edward's Road, London E9 7SF Tel: +44 (0)20 8533 3025Web: www.technicalanalyst.co.ukEmail: [email protected]
SUBSCRIPTIONS
Subscription rates UK: £275 per annumRest of world: £325 per annumFor information, please contact: [email protected]
The Technical Analyst Talks To... Ralph Acampora, Managing Director, Prudential Equity Group
30
Book ReviewAdvanced Swing Trading by John Crane 41
LettersThe dangers of data snooping43
Commitments of Traders Report44
Training & Events Diary48
May 2004 THE TECHNICAL ANALYST 3
MAY 2004
06Market Views06 A head-and-shoulders pattern in USD/JPY
08 Brent crude
10 Making waves in the US dollar, Nikkei and fixed income markets
12Techniques12 Andrews’ pitchfork – the price failure rule
14 The four-week rule
18 Using the McClellan Oscillator
22 Volume spikes and index reversals
26 The inverse fisher transform
28 Astronomy and the Dow Jones
Subject Matters32 Monday blues and sunny Fridays
34 Why have the returns to managed futures funds decreased?
38 Nonlinearity favours nonlinear TA techniques
32
eSignal and Forex Capital Markets(FXCM), a leader in online FX trad-ing, have come together to offer anew feature that allows traders tomonitor market activity, identify trad-ing opportunities and execute tradesfrom a single, integrated platform.
The feature integrates eSignal'sstreaming market data, chartingpackage and customizable formulaswith FXCM's direct access execu-tion abilities, thus eliminating theneed to switch between applicationsto monitor and execute Forex trans-actions.
With eSignal and an FXCM account,
eSignal users may now: execute FXtrades on FXCM's trading platformvia a direct link from eSignal's mar-ket data and charting application;send market orders directly toFXCM's trading platform; obtainsplit-second trade executions fromFXCM; and monitor open positionsvia a direct link from eSignal toFXCM's trading platform
"FX trading offers 24-hour trading,transparent pricing, and low transac-tion costs. As a result, the activetrading community is embracing FXtrading in record numbers and look-ing for high-quality brokerage andanalytic products," said Drew Niv,
chief executive officer, Forex CapitalMarkets. "Our relationship witheSignal gives FXCM subscribers aconsistent means for not only backtesting diversification strategies, butalso for charting, analyzing andfacilitating execution of timely SpotFX trades."
Access to FX trading through FXCMis available to eSignal clients whohave a brokerage account withFXCM. Interested clients should visitwww.esignal.com. To open a broker-age account with FXCM, visit
www.fxcm.com
Product News
4 THE TECHNICAL ANALYST May 2004
C h a r t F i l t e ra n n o u n c e s i n t e -g r a t e d S t o c kT o o l s s o f t w a r e
M a r k e t W a t c h . c o m l a u n c h e s r e a l - t i m e s e r v i c e w i t h e S i g n a l
e S i g n a l a n d F X C M c r e a t e i n t e g r a t e d F X t r a d i n g s o l u t i o n
MarketWatch.com, Inc., a leadingmulti-media publisher, has teamedup with eSignal to launch CBSMarketWatch LIVE, an onlinestreaming, real-time news and mar-ket data product that is also compat-ible with portable handheld devices.
This new service provides tick-by-tick quotes from more than 75 glob-al markets, integrated news andcommentary, streaming charts, andmarket depth data. Subscribers alsohave use of more than 15 analytical
studies as well as market scannerswith customizable searches thatscreen the market for buy and sellopportunities.
CBS MarketWatch LIVE is availableat www.marketwatch.com/cbslivefrom $14.95 per month, plusexchange fees and fees for any add-on services. A free 30-day trial isavailable.
www.marketwatch.comwww.esignal.com
ChartFilter has told The Technical Analystthat its new analytical software, Stock Tools,will be available by June 2004. It will com-prise six integrated tools that can be down-loaded and installed from their website(www.chartfilter.com). These are: advancedtechnical charting; an alert system that allowsyou to create complex, staged alerts usingtechnical indicators and fundamentals onmultiple stocks; screening and backtesting;fundamentals to export or print; and a portfo-lio manager. "We wanted to make it easy fortechnical analysts to get the most out of theirown analytical abilities and imaginations,"said the company CEO, Doug Hubscher.
The monthly or yearly subscription includesend-of-day data (ComStock) as well as auto-matic upgrades.
Product News
May 2004 THE TECHNICAL ANALYST 5
Pronet Analytics.com Limited hasagreed terms for distribution of itsservice to clients of FXCM Asia Ltdin Greater China. Under the termsof the deal, FXCM Asia will offerPronet's FX research service to newand current clients in the region. Thecommercial terms are structured sothat FXCM Asia will continue to offerwhat are believed to be the mostcompetitive dealing spreads in theregion and the client will pay noadditional fees for access toPronet's research.
Shane Smith, Group CEO of PronetAnalytics.com, told The TechnicalAnalyst:
"Access to the China market is avery exciting development for theGroup. China presents an opportu-nity for many US and Europeanfirms generally, but it is worth enu-merating how large that opportunitymight be for Pronet Analytics.com:FXCM is the leading non-domesticFX online broker for mainlandChina, serving also Singapore andTaiwan, and since opening its officein Hong Kong in March 2003, hasseen month-on-month growth inaccounts of 150%. China is now thefourth largest trading nation in theworld, which itself creates a hugeFX requirement, but in additionoverseas funds are being repatriat-
ed at an unprecedented rate, puttingpressure on the Yuan. Irrespectiveof whether the Yuan itself eventuallyfloats, individuals and companiesare anyway allowed to trade foreigncurrencies, and also have a famouspropensity to speculate. Internetpenetration is growing, and with 80million current subscribers China issecond only to the US and is oncourse to overtake it as the mostwired nation on earth. All this pointsto a large and growing demand forweb-delivered research services toassist in better decision-making."
www.pronetanalytics.com
Pronet Analytics.com set sails for China
The London Stock Exchange hasannounced that Proquote, its tradingand market data business, hassecured its biggest deal to date withan agreement to supply 500 screensto TD Waterhouse. TD Waterhouse,one of the UK's largest execution-onlybrokers, has ordered the screens tosupport the launch of ProTrader™, itsintegrated market data and dealingservice for retail investors.
The new order follows one for 125screens in September 2003, andmeans TD Waterhouse will beProquote's largest customer, account-ing for just over a quarter of allProquote's installed screens.
Updataannouncescompatabil i tywith MyTrack
After announcing BloombergCompatibility last month,Updata has announced that itsTechnical Analyst software isnow compatible with theMyTrack data feed.
To coincide with this, Updatahas also launced a US site forboth Bloomberg and MyTrackusers.
www.updataTA.com
P r o q u o t e s u p p l i e s 5 0 0 s c r e e n s t o T D W a t e r h o u s e
Market Views
6 THE TECHNICAL ANALYST May 2004
The recent US dollar recovery has prompted concern of amore significant reversal of the long-term dollar bear trend.
A look at the dollar index chart (Figure 1) shows the marketprobing above the long-term bear channel line from early2002. As yet, this potential long-term trend reversal is not mir-rored in the USD/JPY chart (see Figure 2), but there are cer-tainly signs of further near-term corrective strength before thedollar resumes its path lower. Other major crosses (EUR/USDand USD/CHF) have traded dollar positively through their 200-day moving averages. Weekly momentum indicators (sto-chastic and MACD) for USD/JPY have turned higher showingdivergence at the recent lows. Whilst this pattern is a warningsign of loss of trend strength, one would normally want to seea trendline break to confirm a reversal. In USD/JPY the dom-
inant trendline from February 2002 is some way above currentprices.
The long-term pattern in USD/JPY shows a head-and-shoul-ders which developed from the left shoulder low in September2001 at 115.50 through the head in January 2002 at 135.20 tothe extended right shoulder base formed with a long-termdescending triangle from July 2002 to September 2003. Theflat neckline was broken in September of last year and was fol-lowed by a large weekly breakaway gap after the Dubai G7meeting. Subsequent price action formed a declining wedgeover the ensuing 5 months. The Bank of Japan was activelyintervening during this period to limit yen strength which even-tually led to a sharp recovery and a move back towards the
A HEAD-AND-SHOULDERS PATTERNIN USD/JPY by Kevin Edgeley
Figure 1.
Market Views
May 2004 THE TECHNICAL ANALYST 7
September gap. Crucially this move failed to enter, let alonefill, the gap and the market declined again to new lows. Thelatest rally should also be capped ahead of that major gaparea (112.70-113.60).
Price action since the financial year-end has been dollar posi-tive, so the BOJ has not had call to intervene to counter anyyen strength. Renewed weakness in the dollar may attract theauthorities back into the market but if the Japanese stock mar-ket sustains the bull run, and deflationary fears continue torecede, then any intervention is likely to be of reduced magni-tude and be used to smooth, rather than halt, yen strength. Itwill be interesting to see their involvement if the 101.25 lowsfrom late 1999 are tested. The performance of the Nikkei, par-ticularly the inflow of foreign investment, will be decisive for thefuture path of USD/JPY. While the Nikkei posted a bearishoutside week in mid-April, the bull trend remains intact and thelonger term moving averages remain supportive for furtherstock market gains.
Ichimoku Kinko Hyo is a Japanese technical system that isworthy of study in this market and indeed in any yen denomi-
nated asset. In short, it is a combination of moving averagesof varying time periods and with varying lead and lag times.The "cloud" which is the shaded area between two of theseaverages (plotted with a 26-period lead time) reflects the trendof the market. The weekly USD/JPY chart shows how themarket often accelerates on a break of the cloud and that it canalso act as important support and resistance. Note the impul-sive break down from the head-and-shoulders top through thecloud support in June 2002 and the failure of subsequent ral-lies, within the descending triangle, at the cloud low. Theweekly cloud base is currently within the September gap,which along with the long-term bear trendline from early 2002,is reinforcing this as an area of major resistance. Despite theshort-term recovery from the March lows and potentially bull-ish dollar indications from the dollar index chart, the head-and-shoulders pattern remains intact and gives scope for a longer-term move towards the reversal pattern objective at circa95.50. We would expect the 100-101 area to be a significantinterim sticking point on this decline.
Kevin Edgeley CFA is executive director and technicalanalyst at Goldman Sachs
Figure 2.
Market Views
8 THE TECHNICAL ANALYST May 2004
Brent crude prices could come underrenewed downward pressure in the short-term. The longer-term outlook, however,remains very positive.
While the medium-term trend structure for Brent crude isclearly upwards, the past 29 months' bull cycle still looks
to be a component of a major consolidation pattern whichstarted back in early 2000. As can be seen in Figure 1 pricesare now approaching the upper boundary of this broad tradingrange with strong resistance anticipated in and around the$34.50-$35.50 region. With oscillators showing the market tobe rather overbought, this should add a degree of potency tothis anticipated area of supply increasing the chances of aperiod of correction if not a fresh downward leg within the pre-vailing sideways pattern.
However, underlying technical studies favour eventual breaksabove these historically important levels which would completean accumulative platform capable of supporting advancestowards the 1990 peaks at around $41.00 and possibly a mar-ginal new high with targets of $45.00 clearly readable.
Immediate corrective pullbacks should uncover support at$30.00 initially with only a clear and sustained break beneath
uptrend support waiting at $28.00 likely to damage the overallpositive tone. This may trigger more serious falls setting val-ues on course to challenge the more important $22.50-$23.00zone.
On the individual delivery months, Figure 2 clearly shows howvalues are moving higher within the parameters of an upwardslanting channel with immediate rally attempts likely to againmeet strong resistance towards the upper boundary aroundthe $34.50 region (basis June 2004). This market appears tobe increasingly vulnerable to more serious corrective weak-ness with a fresh test of pivotal support around $32.30 likely inthe shorter-term. A decisive breach of this level would triggerfalls towards uptrend support waiting in the $30.00-$30.50region with only a clear and sustained break beneath this like-ly to damage the medium-term positive outlook and triggerfalls closer to the $26.00 area.
Cliff Green has been a technician since 1971 and was pre-viously a senior technical analyst with Merrill Lynch inLondon and a partner at Trend Analysis Ltd. He is now anindependent consultant specialising in the CommodityMarkets. ([email protected])
BRENT CRUDE by Cliff Green
Figure 1. Figure 2.
MTPredictor TM
The software solution for complete trading excellence
Designed exclusively to find, assess and manage only the very best trades in stocks, currencies and commodities
This is the type of trade MTPredictor can automatically uncover for you….
A Profit of approximately 7x the initial risk required to take the trade, ignoring slippage and commissions, in the UK stock GKN (October 2003)
TAKE CONTROL OF YOUR TRADING WITH THE IMMINENT LAUNCH OF THE NEW MTPREDICTOR 4.0 SERIES!
MTPredictor Ltd www.mtpredictor.com [email protected] Tel +44 (0) 208 9776191
End-of-Day and Real-time programs with automatic routines for:
· Ideal trades: Find exceptional set-ups with outstanding Risk/Reward prospects· Ideal trade size: Control your position size· Ideal trade management: Display the exit stop strategy on-screen· Ideal trading psychology: Consistent, logical trading, time after time· Systematic Elliott Wave software: Avoid the pitfalls of standard Elliott analysis· Advanced strategies: Expert trade opportunities and management plans
Market Views
10 THE TECHNICAL ANALYST May 2004
MAKING WAVES APPLYING ELLIOTT WAVE THEORY TO THE US DOLLAR, NIKKEI AND FIXED INCOME MARKETS by David Murrin
The US Dollar
The long-term view on the dollar is interesting. My generalview is that the US equity market leads the decline of the dol-lar by about 12 months, from the 2000 peak to the recentFebruary lows. The February lows are viewed as importantand will probably remain in place for the next 12 months or so,allowing a long-term correction to dollar weakness to unfold.Once this is complete somewhere in 2005 we would expectthe commencement of a second bear move in the dollar.
The overwhelmingly negative sentiment on the dollar matchedby massive bearish positions across the market place shouldalways provoke serious questions as to the sustainability of atrend. For a clear picture, it's important to look at a number of
currency pairs. For example, USD/CAD (see Figure 1) showsa very clear five-wave decline from its 2002 highs and the clar-ity of the internal five-wave structure suggests the January2004 low was the end of the move. We have since been rally-ing as part of a correction to the 1.41 target in the A wave. Offurther note was the way this pair respected the trend breakshown on our chart as the correction unfolded. This was thefirst pair to show the dollar's decline had finished.
The next two pairs of note are USD/CHF and the EUR/USD(Figures 2 and 3). Both of these show a completed five-wavedecline, but the image is slightly complicated by a large thirdwave unfolding with internal corrections of the same magni-tude as those of one higher degree. This is now very common
in any market that is highly analysed and traded, and is themarket's way of adding a degree of uncertainty to the process.That aside, the February lows in the dollar were marked byvery short five of five waves, a very clear signal that the mar-ket had lost momentum. USD/CHF has now broken its declin-ing trend line at 1.3040 confirming the low and is set to rallyback to the 1.41 level in the next three months. The euro how-ever has still to break its trend line at 1.1660, though it seemsthat this is likely to occur and that we will see a move to the1.06 level in the next three months.
Fixed Income
We believe there is a significant change in the relationshipbetween the US and European economies (which are on asecular decline this decade) and the Eastern economies suchas China and Japan (which are on a secular rally). In this con-
Figure 1.
Figure 2.
Figure 3.
May 2004 THE TECHNICAL ANALYST 11
Market Views
text, and coupled with the chart in Figure 4, we believe the UST-bonds are declining to the 98 region in the C-wave associat-ed with last year's rapid bear market. However at this stage westill favour the scenario that the move is a big three-wavedecline, at the bottom of which sentiment will lean strongly toa sequence of rate rises. Nevertheless, with our view of thedecade being one of US deflation, we think rates will stay lowand that the end of the C-wave will offer good buying levels.
Meanwhile, in Japan, if we are correct about the secular rallyin the fortunes of the Japanese economy then long-term ratesare on the rise and we have seen the lows for many years tocome. The JGB chart (see Figure 5) shows clear three-waverallies and five-wave declines that support such a view. Ourfirst target is the 132 region and our basic strategy will be tosell three-wave rallies and buy back five-wave declines untilproven otherwise.
The NIKKEI
Consistent with our overall analysis, we are bullish over thelong-term for the Japanese stock market. This view is support-ed by the clear completion of a three-wave decline from the1989 high to the 2003 low shown in Figure 6. This conclusionis supported by the clear internal count showing wave five offive of big C in March last year. Figure 7 shows the details ofthe rally with five-wave advances and three-wave corrections,suggesting the market will continue through the 12,000 level to14,000 in the next few months. It is no surprise that short JGBsand Long NIKKEI are in effect the same trade with some short-term variance.
David Murrin is chief investment officer of EmergentAsset Management Ltd
Figure 4.
Figure 7.
Figure 6.
Figure 5.
Techniques
12 THE TECHNICAL ANALYST May 2004
Those who have studied Dr. Alan H.Andrews' trading techniques in depthknow that he taught ways to expect achange in market sentiment, a changethat often results in a price move thatcatches many traders by surprise. Duringone of his seminars Andrews said, "a lotof traders spend a good deal of theirtime following the markets to see whatprices are doing. I suggest they would bebetter off if they spent more timeobserving what prices are not doing."
Acore Andrews technique that dealsdirectly with what prices are not doing
is called the "price failure rule." It comesinto play when prices don't reach the medi-an line. Before we look at the technique,let's first consider the broader interpreta-tion of price action vs. the median line.
The median line as a price magnet
The median line technique is Dr. Andrews'best-known work. It is the basis for thetrading tool commonly called "AndrewsPitchfork" that is found on many chartingsoftware programs. The primary feature isthe high probability that prices will reach amedian line and then reverse. This aspect iswell known among traders. Less known isthat the technique goes a great deal furtherthan that.
Figure 1 is a typical example of how themedian line acts as a price magnet, drawingprices towards it. The discovery of thisphenomenon prompted Dr. Andrews todevelop supplemental techniques thatwould help confirm the outlook of tradepositions already on the books, or alert himto a potential shift in market sentiment asprices interacted with the median line. Theprice failure rule is one of those techniques.
The price failure rule
To deal with those times when priceschange direction before reaching the medi-an line, Dr. Andrews developed a specialmethod called the price failure rule. It is aneasy to use, two-step process that preparesthe trader for a trend change when newbuying or selling interest appears to be sur-facing.
The rule relates to Dr. Andrews' commentquoted earlier in the article regarding theimportance of observing what prices arenot doing; i.e. not continuing to press onuntil the median line is reached. Price fail-ure to reach the median line raises a coupleof interesting issues: market sentiment ismore than likely changing and it is not
unusual to see a large countermove takeplace following a price failure.
Confirming a price failure
Figure 2 shows prices steadily moving lowerafter the pitchfork was drawn, well on theway to the median line. An Andrews trader,bearing in mind his observation that priceswill reach a median line more often thannot, would have had good reason to lookfor prices to continue the move down tothe 15 area. However, that outlook wouldhave been less clear when prices reversedand penetrated the upper parallel line of thepitchfork. That was a warning that a pricefailure was likely, calling for Hagopian'srule, a trendline adaptation Dr. Andrews
ANDREWS' PITCHFORK - THE PRICE FAILURE RULE by Gordon DeRoos
Figure 1. A, B and C are the three points which determine the shape of the pitchfork. PointA is placed at the end of the previous trend (and is the "handle"), B at the top of the nexttrend and C at the bottom of the trend (together, the base of the "fork").
Techniques
May 2004 THE TECHNICAL ANALYST 13
named after one of his early course mem-bers.
Hagopian's rule
Here's how he described the rule in hisoriginal course: "When prices reverse trendbefore reaching a line at which probabilityindicates such a reversal could start, properaction may be taken in buying or selling
when prices cross a trendline they weremoving along before reversing."
In figure 3, the pitchfork median line is "theline at which probability indicates such areversal could start." The "trendline theywere moving along before reversing" is theHagopian line.The Hagopian line drawn in Figure 3 is adowntrend line drawn across two previous
highs. It slopes away from the median line,which is the preferred arrangement accord-ing to Andrews. In the example, a buy sig-nal was given when prices broke throughthe Hagopian line, completing the setup forthe price failure rule.
Traders looking for additional trade signalconfirmation ought to find that theirfavorite technical indicators would mergequite well with this technique. Oscillatordivergence is one approach that can tie ineffectively. Volume analysis is another. Therange of indicators is considerable, andwhile each can be helpful to some extent,the real power comes from the clues gener-ated by the price movement itself as itinteracts with the median line. The test is torecognize those clues, and that is where theprice failure rule can lend a hand.
A question often arises regarding pivotselection for the pitchfork. Users wonder ifthere is a way to determine which set ofthree pivots (e.g. A, B and C in Figure 1)would be the best to use in any given situa-tion. Dr. Andrews addressed that very ques-tion during one of his seminars. Here ishow he responded: "Usually it seems bestto start with the most recent three alternatepivots of the time frame you're interestedin. That will give you the current outlook.But don't stop there, because any threealternate pivots can be used, and no matterwhich set is chosen, each resulting pitchforkwill add something to the outlook as it tellsits own story." The price failure rule is justone part of the pitchfork story.
Gordon DeRoos is an ex-US Army offi-cer (24 years) and commodity broker (18years). Although retired, he has beenteaching Dr. Alan H. Andrews'action/reaction trading methods for thelast seven years. www.pitchforkprimer.com
Figure 2.
Figure 3.
Techniques
14 THE TECHNICAL ANALYST May 2004
The Four-Week Rule is a basicmethod that may not appear glam-orous in the company of Fibonaccinumbers and Japanese candlesticks.Yet despite its simplicity and its obvi-ous shortcomings as a trend-follow-ing system (it works well in up ordowntrends, but not sideways trends),in the right hands it can be a powerfuland profitable tool.
The rules according to Donchian
Developed by Richard Donchian in theearly 1970s for commodities and futures (itis also known as the "price channel" or"Donchian channels") The Four-week Ruleis a method that includes a set of chartingrules that are generated from the pricechannel as well as a set of trading rules. Themistake that is often made it to use the pricechannels without the trading rules. But it isthe application of both sets of rules thatmake the method effective. (See Box 1)
As you can see from Figure 2, trend follow-ing systems react to movements rather thanattempting to predict them. The trendbreaks before the price closes below thelower band of the price channel.
When interpreting the price channel oncharts, buy signals are generated when theprice channel has closed above the upperband as shown in Figure 3. The price chan-nel tends to create quite a few signals dur-ing the course of the up trend.
For those who use technical stock screen-ers, use a screen with a rising close condi-tion where the price closes higher than theday before for three days, as well as a pricethat closes above the upper band. When weinclude a three-day rising close as well as a
price channel breakout, the number of falsesignals is reduced as can be seen in Figure 4below. The stock used in all of the chartillustrations was found using the followingstock screen:
price-channel buy, where the price penetrates theupper band, as well as the condition that the close
for the last three days was higher than the daybefore it.
(The reverse does not apply during sell con-ditions, three consecutive days down is notthe best pattern to wait for.)
Complimenting the Four-week Rule
So what can you do to increase the effec-tiveness of the Four-week Rule so that youdon't miss opportunities due to the laggingindicators? And equally as important, howcan you ensure that you aren't going to losemoney in a volatile or sideways-trendingmarket due to false signals?
One way to add certainty to the Four-weekRule is to use complimentary indicators ormethods to generate additional signals thatprovide a warning or confirmation.
For example, you can use another trend-fol-lowing system, the 5- and 20-day MovingAverages Method, also developed by
Donchian, in conjunction with the Four-week Rule, to create combined signals thathelp you determine if the price has reallygenerated a strong trend. Note: The rules inthese two systems do not conflict with oneanother.
The 5- and 20-day moving averagesmethod
The 5- and 20-day moving averages methodincludes several general and supplementalrules. These rules were initially intended forcurrency markets but can also be used toanalyze stocks.
The method consists of the following rules:
Basic rule A: Act on all closes that cross the20-day moving average by an amountexceeding by one full unit the maximumpenetration in the same direction of anyprevious closing when the closing was onthe same side of the moving average.
Basic rule B: Act on all closes that cross the20-day moving average and close one fullunit beyond the previous 25 closes.
Basic rule C: Within the first 20 days afterthe first day of a crossing that leads to atrading signal, reverse on any close thatcrosses the 20-day moving average and
The charting rules The trading rules The price channel generates the following signals (see Figure 1):
1. buy signals are produced when the price closes above the upper band of the price channel.
2. sell signals are generated when the price closes below the lower band of the price channel.
1. When the price is at its highest in a four week period, buy long and cover short positions. 2. When the price falls below the lows of a four week period, sell short and liquidate long positions.3. This last rule only applies to future traders, which is “to roll forward, if necessary, into the next contract on the last day of the month prior to expiration.
THE FOUR-WEEK RULEby Alex Martin
Box 1. The rules
Techniques
May 2004 THE TECHNICAL ANALYST 15
Figure 3.
Figure 1.
Figure 2.
Techniques
16 THE TECHNICAL ANALYST May 2004
Figure 6.
Figure 5.
Figure 4.
Techniques
May 2004 THE TECHNICAL ANALYST 17
closes one full unit beyond the previous 15closes.
Basic Rule D: Sensitive five-day movingaverage rules for closing out positions andfor reinstating position in the direction ofthe 20-day moving average are:
1. Close out positions when the currencycloses below the 5-day moving average forlong positions and above the 5-day movingaverage for short positions, by at least onefull unit more than the greater of either theprevious penetration on the same side ofthe 5-day moving average, or the maximumpoint of any penetration within the preced-ing 25 trading days. Should the rangebetween the closing price in the oppositedirection to the Rule D closeout signal begreater than the prior 15 days than therange from the 20-day moving average ineither direction within 60 previous sessions,do not act on Rule D closeout signals unlessthe penetration of the 5-day moving aver-
age exceeds by one unit the maximumrange both above and below the 5-day mov-ing average during the preceding 25 ses-sions.
2. Reinstate positions in the direction ofthe basic trend (a) when the conditions inparagraph 1 are achieved, (b) If a new RuleA basic trend is given, or (c) if new Rule Band Rule C signals in the direction of thebasic trend are given by closing in a newlow or new high ground.
3. Penetrations of two units or less do notcount as points to be exceeded by Rule Dunless at least two consecutive closes wereon the side of the penetration when thepoint to be exceeded was set up. (RichardDonchian, December 1974 Futures article),as quoted by Cornelius Luca in TechnicalAnalysis Applications in the GlobalCurrency Markets, 1997.
When we look at the charting signals in
Figure 5 generated by the 5- and 20-daymethod, we can see that signals are generat-ed earlier on in the trend than the pricechannel shown in Figure 6.
To better interpret the signals generated bythe 5- and 20-day method, it is advisable toinclude an MA cross system such asJapanese Crosses.
Combining the 5- and 20- day moving aver-age cross system with the Four-week Rulecan help to confirm information about thepotential trend change. These modificationsare not intended to replace basic trend-fol-lowing techniques, but to provide moreinformation about the trend when pricechannel signals are generated.
Alex Martin is Chief Technical Officerat ChartFilter.
www.chartfilter.com
Summary: Getting the Four-week Rule to work
1. Apply both sets of rules (trading and charting)
2. Buy and sell strictly according to the rules
3. Compensate for its shortcomings through complimentary analysis
18 THE TECHNICAL ANALYST May 2004
Techniques
In the last issue of The TechnicalAnalyst, Tom McClellan gave anintroduction to The McClellanOscillator. In this article, Tomtakes us through some of themore advanced ways in which itcan be used to help forecast mar-ket direction.
The McClellan Oscillator is a tool whichmeasures the acceleration in daily
Advance-Decline (A-D) statistics bysmoothing these numbers with two differ-ent exponential moving averages, then find-ing the difference between them. TheOscillator's most basic indication is its posi-tion relative to the zero line, which is theOscillator's neutral level. The market isnearly always accelerating or decelerating, inone direction or the other, and rarely has aneutral acceleration condition. A positiveOscillator reading is an indication ofupward acceleration, while a negative read-ing is a sign of downward acceleration. Butthere is much more that the Oscillator hasto tell us.
Overbought/Oversold
When the McClellan Oscillator reaches anextreme level, either high or low, it indicatesan extended condition for the market. Inthis respect, it is like many other over-bought/oversold indicators, and like theothers, an extended McClellan Oscillatorreading is no guarantee that the extendedmarket condition has to end right away.
Oversold readings on the McClellanOscillator offer us some additional insightswhen interpreted properly. First of all,deeply negative readings tend to indicatethe conclusion of a down move, whereasextremely high readings tend to show initi-
ation of a strong new up move. Also, adeeply negative Oscillator reading whichcomes along after a long period of quiet isa harbinger of more trouble to come.
We see great examples of all of these prin-ciples in Figure 1, showing the Oscillator in1998 and 1999. Point 1 in this chart was adeeply negative reading (-271) which cameafter a long quiet period. As such, it gave uswarning of the weakness that arrived laterin 1998 when the "Asian Contagion" hit themarkets. Points 2 and 3 in this chart werealso very low, but rather than being indica-tive of future weakness to come they werethe fulfillment of the weakness forecast bypoint 1. They also marked the end points ofstrong down moves, with prices eitherreversing or at least moving sideways for awhile as the bears gathered more strength.
For several months prior to point 3, therehad been no strong up moves accompaniedby very high Oscillator readings. The post-ings above +200 beginning in September1998 were a sign that the bulls were goingto be rushing back in and that they hadenough money to push prices higher for asustained period of time. These high post-
ings differed from the very low readingsbecause low readings are indicative of theconclusion of a down move, whereas thehigh readings tend to occur at the verybeginning of a strong up move. We almostnever see the price move higher on thehighest Oscillator reading. So when onesees a very high reading, it may be a signthat a brief pullback is needed, but it is alsoa sign that higher prices should be expectedfollowing that pullback.
In Figure 2, we see a great example of aconclusive indication from a very oversoldOscillator reading. This bottom was not fol-lowed by any strong positive readings for along time and the result was a choppy,range-bound period for stock prices.
Some sources on technical indicators willprescribe specific Oscillator values that rep-resent overbought and oversold levels, butwe discourage people from following suchguidelines. A wide variety of factors canaffect the amplitudes of Oscillator moves atvarious times, including market volatility,the strength of price moves, and changes inthe number of issues traded on theexchange. So an Oscillator value that might
USING THE MCCLELLAN OSCILLATOR by Tom McClellan
Figure 1.
Techniques
May 2004 THE TECHNICAL ANALYST 19
indicate an extreme condition during oneperiod may only be a routine high or lowduring another period. One way to adjustfor this is to calculate a "Ratio-Adjusted"McClellan Oscillator. Using Ratio-AdjustedMcClellan Oscillator values does indeedadjust for the changing number of stockson the exchange but it does not adjust forother factors such as fluctuating marketvolatility or changes in the diversity ofissues represented which may produce
greater or lesser Oscillator swings.
For periods of less than 2 years, we believethat it is fine to use the conventionalMcClellan Oscillator. Rather than focusingon the specific numerical value, an examina-tion of the chart pattern will give muchmore information about what theOscillator has to tell us. Certain chart struc-tures and behavior can be enormouslyrevealing.
Divergences
To the extent that the Oscillator's move-ments diverge from price action, it can sig-nal an impending change in direction forprices. This is where it helps to understandthat the Oscillator serves as a measure ofacceleration for the market breadth statis-tics. Measuring the acceleration can be help-ful to signal an impending change in trenddirection.
Figure 3 shows several divergences betweenthe price action in the NYSE CompositeIndex and the McClellan Oscillator. Noticethat these divergences tend to occur moreoften at tops than at bottoms, which is duein part to the way that the US stock markettends to have more rounded tops andexhaustive (spike) bottoms. This is not tosay that no divergent bottoms can befound, just that divergent tops are muchmore frequently seen.
Congestion Zones
A congestion occurs when the Oscillatorfluctuates by very small increments overseveral days. One or two days of smallchanges is not enough, it has to be a sus-tained period. The Oscillator value areawhere a congestion occurs (called the con-gestion zone) usually forms above the zeroline. We seldom see them form at extendednegative values.
The basic rule to remember is that a con-gestion zone is something to drop out of.Figure 4 illustrates a few examples of con-gestion zones. The common characteristicsof each are that they show several days ofpostings with the Oscillator in a relativelysmall range. Once the Oscillator breaksdown out of that range the market beginsto decline sharply. A couple of these exam-ples even have the congestion zone forming
Figure 2.
Figure 3.
20 THE TECHNICAL ANALYST May 2004
Techniques
at or below zero, but the result was still adrop down out of the congestion zone.Looking at one day's Oscillator value wouldnot convey this information; it takes a chart,and someone to interpret that chart, tonotice behaviour like congestion zones anddivergences developing.
Complex Versus Simple Structures
When the Oscillator moves up and down
over a period of days on one side of thezero line, we call that a "complex structure".Complexity of a structure implies strengthfor the side (of zero) upon which it forms,whether positive or negative. A "simplestructure" is one in which the Oscillatorcrosses zero in one direction in a move last-ing from one day up to a few days, and thenturns around and heads directly in theopposite direction without forming anycomplex structure. Simple structures implyweakness for the side upon which they
form, although that weakness may not bemanifesting itself during the period that thesimple structure is formed.
For example, the Oscillator could be chop-ping up and down below zero, implying thatthe bears are strong and then it might movebriefly above zero as the bulls try to regaincontrol. But if (in this example) theOscillator moves straight up through zeroand then turns around and moves straightback down through zero again, it is a signthat the bulls do not really have the strengthto carry on their mission for more than abrief period and the bulls cede control backto the bears.
Figure 5 shows a few examples of each typeof structure. Where a complex structureforms, it implies more strength to come forthat side of the market corresponding tothe side of the zero line where the structureformed, i.e. complexity above zero is bull-ish, and below zero is bearish. That strengthmay be temporarily interrupted while theother side tries to exert its influence, butwhere complexity has formed we have theexpectation that more strength will be man-ifested in that direction. Often we will seetrending price moves, either upward ordownward, made up of a succession ofcomplex structures that are interruptedonly briefly by simple structures. Whensuch a succession of complex structuresgives way to a simple structure, it can meanthat the trending side of the market is readyto give up control for a while, and theopportunity is there for the other side topick up the ball. Sometimes, neither sidewill form a complex structure, meaning thatboth the bulls and the bears are equally hes-itant to take charge.
Oscillator Trendlines
One interesting feature of the Oscillator isthat it forms trendlines just like price charts
Figure 4.
Figure 5.
Techniques
May 2004 THE TECHNICAL ANALYST 21
do, but the Oscillator trendlines will usuallybe broken before the corresponding pricetrendlines are broken. Figure 6 shows a fewexamples of Oscillator trendlines, and ineach case the breaking of the trendline sig-naled a reversal of the prevailing short-termtrend. And also in each case, the trendlinebreak in the Oscillator preceded the trend-line break on the equivalent price chart.
It is important to be careful when drawingsuch lines, and more importantly, whendrawing conclusions from them. Generallyspeaking, trendlines which span longer peri-ods become less meaningful, and it is betterpractice to stick to the steeper trendlineswhich span 3-6 weeks. As with price trend-lines, it is not unusual for the Oscillator tobreak out above a downtrend line and thengo back down to test the top of that linebefore continuing higher.
Additional Points In Conclusion
The McClellan Oscillator is based on thedaily closing values for the NYSE's totals of
advancing and declining issues, and so itdoes not exist as an intraday indicator.However, it is possible to take the intradayvalues for the number of advances anddeclines and calculate a "what if" value forthe Oscillator that assumes those A-D val-ues are the closing ones.
It is also possible to use other data to calcu-late McClellan Oscillators. We calculate andemploy in our analysis breadth versions ofthe Oscillator which are derived from A-Ddata on the Nasdaq market, the stocks inthe Nasdaq 100 Index, the 30 stocks in theDow Jones Industrial Average, the corpo-rate bond market, plus a subset of theNYSE breadth data for the "CommonOnly" stocks (filtering out preferred stocks,rights, warrants, and closed end funds). It iseven possible to create a McClellanOscillator out of any other breadth statis-tics you might think of such as a subset ofthe market that includes all of the stocks ina particular sector.
The problem with subset breadth statisticslike this is that they tend to all behave in a
homogeneous way. In a narrow sector likegold mining stocks, for example, it is typicalto see all of them go up one day and thenall go down the next day. Other industrygroups and sectors show this same effect toa greater or lesser degree. By narrowing thefocus to small groups like this, we end uplosing the key indication given to us bylooking at breadth statistics. By examiningthe behavior of a diverse collection ofstocks, we can see if there is a differentindication from what we see in prices alone.
Breadth statistics are valuable because theygive some of the best indications about thehealth of the liquidity that is available to thestock market. A small amount of moneycan be employed to make a handful ofstocks go up or down and if they are theright stocks then even the major marketindices can be moved. But to affect thebreadth numbers, which measure all of thestocks on the exchange, requires majorchanges in the liquidity picture. The avail-able money has to be so plentiful that it canbe spread far and wide in order to make themajority of stocks close higher, and espe-cially so in order for the market to showpositive breadth for several days.
By measuring the acceleration in thebreadth statistics, which is what theMcClellan Oscillator does, one can gainimportant insights about impending trenddirection changes for prices.
Tom McClellan is the editor of TheMcClellan Market Report. He is the sonof Sherman and Marian McClellan whocreated the McClellan Oscillator in1969.
www.mcoscillator.com
Figure 6.
Techniques
22 THE TECHNICAL ANALYST May 2004
In Volume Analytics, volume dataplays more than just a minor sup-porting role - it is the principalvariable used to forecast reversalsin stock exchange indices.
The extensive body of knowledge asso-ciated with volume analytics has given
rise to a view of the markets that is proven,time-tested, highly consistent, and prof-itable. Its basic premise is that volume andindex behaviors are closely interrelated andthat the trading patterns of an index can bepredicted, or at least anticipated, from aproper understanding of the unfolding vol-ume patterns. The technique provides thetrader with an elegant way of monitoringand analyzing the volume behaviour of aparticular index and allows him or her toheed one of the golden rules of trading,"Do not play against the market."
But why apply volume analytics to indexesand exchanges, rather than to individualstocks? Indexes best describe the mood ofthe market as a whole. Regardless of whatyou trade, a particular index or sub-index,stocks, options, futures, most of these trad-ing vehicles tend to move in concert withthe broad market. As a rule, the market dic-tates the direction of a particular security,never the other way around. It thereforemakes sense to get a good grasp on what ishappening at the index or stock exchangelevel, and we have found volume analyticsto be an excellent vehicle to make thatdetermination.
Terminology
Every trader is familiar with moving aver-ages of securities prices, perhaps the mostfrequently used technical indicator. We sim-ply apply the concept to volume, ratherthan to price, and plot Volume Moving
Averages (VMA) that range in durationfrom as short as a few minutes to as long asseveral months.
However, there is a slight twist to this.Volume activity typically follows certainpredictable patterns throughout the tradingday, with high levels prevalent immediatelyafter the open, lower values around noon,and increased levels once more toward theclose. We call this pattern the "time fac-tor". Unfortunately, the time factor pro-vides a rather distorted picture of the dailyvolume activity. It makes it difficult to dif-ferentiate those volume events, which aretruly significant, from those that are simplypart of the normal daily fluctuations. Wehave solved the time factor issue bynormalizing volume data before chartingit. Charting normalized volume allows amuch clearer determination of whether ornot volume levels are spiking above normallevels, an aspect that is at the core of ourmethodology.
We are particularly interested in the appear-ance of large peaks ("spikes") in the VMA -known as VMA spikes - and how an indexreacts when they are generated. SuddenVMA surges are indicative of bursts of sig-nificant buying or selling activity. As suchspikes occur, we determine whether theindex is moving up or down at that time. Ifthe direction is up, we call the associatedvolume surge a resistive VMA spike; if theindex direction is down, we label the spike asupportive VMA spike. In the absence ofdistinct volume spikes, we still call any vol-ume generated as the index is moving upresistive volume, and as it moves down,supportive volume.
Basic principles
The most basic premise of volume analyt-ics is we can always anticipate an index will
react to (significant) volume spikes - as arule, resistive volume spikes will force adownward move in the index; supportivevolume spikes will generate upward indexmomentum. This basic assertion must bequalified by two key questions:
1. What determines the extent and charac-teristics of an anticipated move: Will it beshort-lived or have staying power over themid- to long-term? Will it be gradual orsudden?
2. What determines when an anticipatedmove will most likely occur: Will it happenimmediately or will there be a certain timelag (a "delayed volume reaction")?
Our research shows the answers to thesequestions vary considerably, depending on(a) the general market context, and (b) thetechnical characteristics of the actual vol-ume spike(s) being analyzed. Therefore, inorder to get the most value from volumeanalytics, it must always be placed in theproper context:
Market context: Where in the larger mar-ket picture do supportive / resistive VMAspikes appear: During short-term pullbackswithin a larger uptrend? As part of short-term upside corrections within a largerdowntrend? At the presumed end of aweakening long-term trend? At the begin-ning of a new trend or somewhere in itsmiddle? During distinct trend runs or inmarkets with choppy sideways tradingaction (i.e., in support / resistance corri-dors)?
Technical considerations: When analyz-ing a VMA spike, consider its magnitude,both vertically (the height of a thrust) andhorizontally (its width or breadth).Comparatively larger and/or wider spikesobviously carry more weight. Caution mustbe exercised when analyzing volume spikes
VOLUME SPIKES AND INDEX REVERSALSby Steffen Norgren and Andrew von Stuermer
Techniques
May 2004 THE TECHNICAL ANALYST 23
on a short time frame, as their potentialimpacts on mid- or long-term trends caneasily be misjudged. A noteworthy spikeappearing on a 5-minute chart could wellaffect an index in the short-term, but it maynot necessarily have much of an impact onthe prevailing long-term trend.
Practical considerations
We suggest using only real-time intradayindex charts and applying volume analyticsto highly liquid indexes that reflect not onlythe US economy, but also the world econo-my, such as the NASDAQ 100, theS&P500, and the Russell 3000. Place vol-ume spikes in a broader market context byconsulting several charts with different set-tings; we suggest a chart range from intra-day to at least 2-years. Compare current vol-ume events with those of the past. Finally,it is essential to use only volume data thathas been normalized, so that the spikes youobserve are not distorted by the time factor.
Chart examples
Index values will always (sometimes imme-diately, sometimes with a delay) react to vol-ume spikes, and the greater the magnitudeof a spike (or series of spikes), the strongerthe ensuing reaction. (The many complexreasons why sudden volume surges takeplace are beyond the scope of this article).
For example, at the end of 2002/beginningof 2003 the long market downtrend in theS&P 500 finally reversed and switched to asteady up-trend (Figure 1). A volume analy-sis chart provides us with fresh insight.Three volume spikes (two large ones in Julyand October 2002, as well as a smallerVMA peak in February 2003) correspondwith a distinct long-term trend change for
Figure 1.
Figure 2.
the S&P 500. You could argue it wasprompted by the outbreak of the war inIraq. However, our volume analysis demon-strates the index was ready to move up,
given the large buildup of supportive vol-ume, as evidenced by the two very signifi-cant volume spikes. It could also be arguedthat the new uptrend actually began on
October 10, 2002 and that the January 2003move to retest the recent lows was just amid-term correction of the new up-trend.Figure 2 (a 30-day chart) clearly shows howeach volume spike was followed by an indexreversal, whereas Figure 3 shows that therelationship between volume spikes andindex reversals applies equally well to theshort-term.
Steffen L. Norgren and Andrew vonStuermer, Highlight Investment Group.
We would like to acknowledgeMarketVolume for their analytical sup-port and for the chart material present-ed in this article.
www.MarketVolume.com
Techniques
24 THE TECHNICAL ANALYST May 2004
Figure 3.
“INDEX VALUESWILL ALWAYS
REACT TO VOLUME SPIKES.”
Techniques
26 THE TECHNICAL ANALYST May 2004
The purpose of technical indicators isto help time your trading decisions.Hopefully, the signals are clear andunequivocal. However, more oftenthan not your decision to pull the trig-ger is accompanied by crossing yourfingers. In this article, I explain a wayof making oscillator-type indicatorsgive clear black-and-white signals ofwhen to buy or sell.
In the past, I have noted that the proba-bility distribution function (PDF) of
prices and indicators do not have aGaussian probability distribution. AGaussian PDF is the familiar bell-shapedcurve where the long "tails" mean that widedeviations from the mean occur with rela-tively low probability. The FisherTransform can be applied to almost anynormalized data set to make the resultingPDF nearly Gaussian, with the result thatthe turning points are sharply peaked andeasy to identify.
The Fisher Transform is defined by theequation
1)
Whereas the Fisher Transform is expansive,the Inverse Fisher Transform is compres-sive. The Inverse Fisher Transform is foundby solving equation 1 for x in terms of y.The Inverse Fisher Transform is:
2)
The transfer response of the Inverse FisherTransform is shown in Figure 1 (with x andy reversed to correspond to the usual defi-nitions of input and output). If the inputfalls between -0.5 and +0.5, the output isnearly the same as the input. For largerabsolute values (say, larger than 2), the out-put is compressed to be no larger than
unity. The result of using the Inverse FisherTransform is that the output has a very highprobability of being either +1 or -1. Thisbipolar probability distribution makes theInverse Fisher Transform ideal for generat-ing an indicator that provides clear buy andsell signals.
One of the more popular technical indica-tors is a Stochastic RSI. This indicator startsby taking an RSI of price. Then, aStochastic of that RSI is taken to limit theoutput to between 0 and 100. Translatingand scaling, this is mathematically the sameas varying between -1 and +1.
THE INVERSE FISHER TRANSFORM by John Ehlers
⎟⎠⎞
⎜⎝⎛−+
=xxy
1
1ln*5.0
1
12
2
+−
= y
y
eex
Figure 1. Transfer response of the Inverse Fisher Transform compresses the output tobetween -1 and +1
Figure 2. EasyLanguage Code to Take the Inverse Fisher Transform of an RSI
Techniques
May 2004 THE TECHNICAL ANALYST 27
But there is no reason to bludgeon the RSIwith a blunt instrument like a Stochastic.Instead of picking an observation lengththat is guaranteed to drive the Stochastic tosaturation, you can finesse the indicatorPDF using the Inverse Fisher Transform.The Easy Language code to do this is givenin Figure 2.
The 5 bar RSI varies from a minimum of 0and a maximum of 100. The 5 bar length ofthe RSI was selected to provide good oper-ation when applied to many price series.The RSI period is certainly available foroptimization. By subtracting 50, the RSIindicator is translated to range from -50 to+50. Then, multiplying by 0.1 reduces therange to be between -5 and +5 for Value1.
This is just the kind of maximum swingsuited to the Inverse Fisher Transform. Iused a 9 bar weighted moving average tocompute Value2 to smooth Value1 and ulti-mately remove some spurious trading sig-nals. There is no magic in this average. Itcould have fewer bars to have less lag or itcould be an Exponential Moving Average.Its function is just to be a smoother. Thetransform is calculated as the variable IFishand then plotted. The code also plots out-put reference lines at -0.5 and +0.5.
The transformed RSI is applied to theExchange Traded Fund (ETF) QQQ inFigure 3. The trading rules are simple. Buywhen the indicator crosses over -0.5 orcrosses over +0.5 (if it has not previously
crossed over -0.5). Sell short when the indi-cator crosses under +0.5 or crosses under -0.5 (if it has not previously crossed under+0.5). The trading signals are not only clearand unequivocal, but they are also prof-itable.
The Inverse Fisher Transform can beapplied with equal success to virtually alloscillator-type indicators and should pro-vide greater confidence in deciding when toenter and exit trades.
John Ehlers is an electrical engineer andhas been a private trader since 1978.
www.mesasystems.com
Figure 3. Inverse Fisher RSI
Techniques
28 THE TECHNICAL ANALYST May 2004
Published in 1948, DonaldBradley's 'Stock MarketPredictions - the planetary barom-eter and how to use it' was a 50page booklet that sold for fourdollars. It received little attentionand it would be forty years beforeLarry Pesavento and ArchCrawford began publishing yearlyforecasts based upon Bradley'sformulas. The Technical Analysttakes a step into the unknown andasks Larry Pesavento to explainwhat it's all about.
The Bradley model gives a chart (called asiderograph) based on the classic
Ptolemic harmonic angles between any twoplanets. Although the Bradley model cansometimes "predict" the exact highs andlows of the stock market it is far from infal-lible. However, the key turning dates in themodel are very useful. These can be usedfor locating tops and bottoms in the DowJones as well as other actively traded mar-kets.
What the Bradley model does do is makethe technical analyst aware that there mustbe some correlation of prices to variousastrological planetary harmonics. ButBradley warns, "At no time must the readergain the impression that a siderograph, assuch, is a prediction of what the stock mar-ket will actually do. Nevertheless, observa-tions prove that basic reversals in collectiveattitudes clearly predicted by the line areinevitably mirrored in stock averages."
It is my opinion that the Bradley modelshould be used in conjunction with othertechnical tools such as pattern recognition and wave ratio analysis.
ASTRONOMY AND THE DOW JONESby Larry Pesavento
Figure 1.
Figure 2.
Techniques
May 2004 THE TECHNICAL ANALYST 29
Notice the four charts using the Bradleymodel overlay as a cycle tool for determin-ing future price swings.
Figure 1 is a current Bradley model for2004. Figure 2 illustrates the model’s resultsfor 2002/2003 and shows that correlationsbetween the actual stock prices and theBradley model have been quite accurate.
Next we overlay the Bradley model over thecrude oil future (Figure 3) and gold futurechart (Figure 4). There is clearly some cor-relation in price to astrology. I checkedthese correlations in the Bradley modelfrom 1876 to the present and it consistent-ly produces results above 70%. Not too badfor a model that can be produced 100 yearsor more in advance.
Larry Pesavento is the author of sevenbooks on trading and is currently a pri-vate trader for a large hedge fund.
Charts provided bywww.ensignsoftware.com
Figure 3.
Figure 4.
“OBSERVATIONS PROVETHAT BASIC REVERSALSIN COLLECTIVE ATTI-TUDES CLEARLY PRE-DICTED BY THE LINE AREINEVITABLY MIRRORED INSTOCK AVERAGES.”
The Technical Analyst apologises for printing the wrong charts in the article "Fibonacci and harmonicity - a personal view" in theApril issue. Please note the correct charts are available via e-mail (in PDF format) from Jim Kane ([email protected]).
TTA: You are well known as a founding member of theMarket Technicians Association. What was your motivationfor setting this up?
RA: When I started working in the markets in New Yorkmost brokerage houses and major financial institutions inWall Street had a technical analyst who spent a major partof his day analysing charts. Even then, technical analysiswas an established subject but there was very little commu-nication between market analysts. They simply didn't talk toeach other. This was largely because there was a lack ofany formal structure of communication for analysts. At thetime, I had an analyst friend called John Brooks and togeth-er we decided to establish an association for analystswhere we could meet on a regular basis and discuss oursubject. This is how the MTA came about.
TTA: Despite the ubiquity of technical analysis in financialinstitutions, most houses still appear to devote relativelyfew resources to this area of analysis compared to thelarge number of economists and fundamental analysts gen-erally employed. Why do you think this continues to be thecase in the major financial centres across the world?
RA: Technical analysis still suffers to some extent with acredibility problem among heads of the institutions to whichyou refer. This is a perennial battle for me and has beensince the start of my career. In my view, the value and legit-imacy of technical analysis has been proved again andagain going back to the stock market crash of the twenties.However, fundamental analysis still reigns supreme amongthe banking establishment. I think the reason this attitudepersists is because of the approach to financial analysispropagated by universities and business schools in the US.Postgraduate courses such as MBAs have traditionally
devoted almost no time to technical analysis with prefer-ence instead being given to fundamental analysis. Forexample, share valuations using traditional mathematicalmethods still dominate rather than looking at a chart toestablish if a particular share is overbought or oversold. Ireally believe that a sea change in academic circlestowards technical analysis is required before the hierarchyof our banks and brokerage houses attach more impor-tance to TA. Furthermore, in our academic institutions therandom walk theory still predominates as a method ofdescribing the long-term path of financial markets, whetherthey be stocks, currencies or bonds. This theory has a his-tory of acceptance within the academic community and issomewhat revered as a valid theoretical model. It is a mootpoint where exactly technical analysis stands in relation tothis theory but there are fundamental divergences in thetwo methods that have established them as opposing viewsof market determinants.
TTA: Is there any evidence that this situation is beginningto change, at least as far as academia is concerned?
RA: I'm very pleased to report that things have begun tochange, but slowly. There is now a wealth of research intotechnical analysis and charting methods emerging fromuniversities across the globe. The scepticism within theacademic community towards the subject that has existedfor so long is at last beginning to change as academics'own research and testing of established techniques usedby analysts and traders have been shown to be empiricallyrobust. I'm pleased to report that Andrew Lo at MIT hasshown interest recently in establishing a chair for technicalanalysis at the school. I'm confident that the prejudiceagainst technical analysis within the academic communitywill continue to decline but it won't happen overnight.
Interview
30 THE TECHNICAL ANALYST April 2004
THE TECHNICAL ANALYST TALKS TO….
Ralph Acampora
Ralph Acampora is managing director and the
director of technical analysis for Prudential Equity
Group. Ralph has taught technical analysis at the
New York Institute of Finance since 1970 and is a
Chartered Market Technician (CMT).
Interview
May 2004 THE TECHNICAL ANALYST 31
TTA: Do you think the failure of fundamental analysis toanticipate the crash of 2001 has done much to boost theprofile of technical analysis, especially as so many TA indi-cators and signals were strongly bearish before the crash?
RA: Undoubtedly, but it should be remembered that thishas happened before. In 1929, the traders who mademoney from the crash were those relying on charting meth-ods and got out before the fall. However, the small analystcommunity failed to take advantage of this in order to raisethe profile of the subject and so the advantage was lost foranother 30 years or so. However, many of the most influ-ential books on technical analysis and new charting tech-niques emerged in the 1930s as technicians hurried to puttheir proven techniques that allowed them to avoid thecrash into print.
TTA: Are you still actively involved in the activities of theMTA?
RA: My goal at the moment is to get those who hold theMTA qualification (CMT) exempted from taking the CFAqualification. This is currently a big issue among analystson Wall Street, many of whom face the prospect of takingnew exams as SEC regulations have changed. From a per-sonal point of view, I don't want to have to start revising forexaminations at age 62 after more than 30 years in themarket. Economists and strategists are exempted eventhough they have no formal trade qualification. There is aninjustice here that stems from the lack of acceptance oftechnical analysis within the US financial establishment. Ifthis exemption is something that I manage to achieve I'lllook forward to becoming Saint Acampora among the TA'son Wall Street!
TTA: Has the use of technical analysis changed in the USover the last 10 years?
RA: Technical analysis has enjoyed a greater profile inrecent years as the private investor and day-trader com-munity has increased in size. It must be said that televisionhas played a crucial role in increasing the exposure of thesubject. Charts now feature regularly on news bulletins andexperts such as John Murphy and John Bollinger are nowto be seen regularly on our screens giving their commen-tary on the markets. As such, technical analysis has suc-ceeded in becoming part of mainstream financial newsreports.
TTA: Does TA remain more popular in the US than inEurope or Asia?
RA: No, I'm not convinced of this although the use of TA ismixed across Europe. I am often asked to give talks in var-ious European cities and in some countries the use of tech-nical analysis among both institutions and private investorsis as widespread as in the US. Switzerland and Irelandstand out as being enthusiastic TA followers. When I go toZurich they can't find a hotel large enough to hold theattendees but in London there is almost indifferencetowards such talks. On the other hand, perhaps they justdon't like me in the UK!
TTA: In your book " The Fourth Mega-Market" you predict-ed the Dow would reach 20,000 by 2011. Do you still holdto this view?
RA: The book was written in 2000 near the top of the mar-ket. At the time, my view was considered by some to be avery conservative outlook in terms of its relatively smallannual return. Other forecasts and books from the sameperiod were looking at 36,000 and above for the Dow.However, despite the crash I still hold to my original viewbut don't expect the market to enjoy an uninterrupted rallyto this level. I still expect a long period of very sloppy activ-ity over the forthcoming years and a fall back towards the7000 level before we reach 20,000.
TTA: Have you seen any recent developments in technicalanalysis that have attracted your attention?
RA: Not so much in new developments but more in termsof what is being done with established techniques. I'mthinking in particular of the research that is being done withbacktesting and the rigorous studies into pattern recogni-tion. I feel that this work by academics and market profes-sionals is helping to justify the last 40 years of my life! Inthe 65 years since the Great Depression we are still play-ing around to get the subject accepted. Therefore, anygood research that validates the subject is still very muchwelcomed.
Correction: In the April issue The Technical Analyst said that AnneWhitby is vice-chairman of 4CAST. This is incorrect - Anne Whitbyis vice-chairman of the Society of Technical Analysts, not 4CAST.
Subject Matters
32 THE TECHNICAL ANALYST May 2004
Do stock markets in Asia sufferfrom Monday blues and sunnyFridays, or what is more common-ly known as the day-of-the-weekeffect? Apparently yes. In agree-ment with previous studies in theUS and elsewhere (including Asia),we find that the mean return onMonday is indeed negative, andthe mean return on Friday is posi-tive and generally the highest.
Yet despite the mounting studies on theday-of-the-week effect, researchers have
not been able to explain the causes conclu-sively. In this study, we attempt to shed somelight on the mysterious day-of-the-week effectby examining whether the Monday (andFriday) returns are concentrated in any partic-
ular week(s) of the month and whether thelow-return Monday is related to the (preced-ing) Friday returns, as in the US.
Day-of-the-week effect
Using daily stock index returns from 1986 to2002, we find a cyclical pattern of stockreturns in the five Asian markets that we stud-ied (see box "The data").
Consistent with the studies in the US andother countries, the mean returns are negativeon Monday and highest on Friday. To substan-tiate the evidence for the day-of-the-weekeffect, an appropriate statistical test (the F-test, which is the ratio of two chi-square tests)is used and results show that the F-statisticsare significant for all the markets in the fullperiod 1986-2002.
However, sub-period analysis shows that thevalues of the F-statistics decline significantly
from the first sub-period (1986-1994) to thesecond sub-period (1995-2002) for most ofthe markets. For Hong Kong and Malaysia,the F-statistics turn insignificant in the secondsub-period 1995-2002. These results suggest
MONDAY BLUES AND SUNNY FRIDAYS IN THE ASIAN STOCK MARKETS?by Professor Wing-Keung WONG and Nee Tat WONG
Sample: Daily stock index returns from 2 January 1986 to 31 December 20021st sub-period: 1986-19942nd sub-period: 1995-2002Daily returns (Rit) are calculated as: Rit =(Pit - Pit-1) / Pitwhere Pit and Pit-1 are the closing values ofstock index i on days t and t-1 respectively.
Indices used: the Hang Seng Index (HongKong), the KLSE Industrial and CommercialIndex (Malaysia), Manila Commercial andIndustrial Index (Philippines), Straits TimesIndex (Singapore) and the SET Index(Thailand).
The data
Box 1.
the day-of-the-week effect has generallydiminished in the Asian markets, and in somecases disappeared.
Monday effect
In testing for the Monday effect (and Fridayeffect), we divide each month into five calen-dar weeks. The first week of the month isdefined as the week that contains the firsttrading day of the month.
We find no significant difference in theMonday returns across the different weeks.This is in contrast to the recent studies in theUS, which show that the Monday effect isconcentrated in the last two weeks of amonth.
Friday effect
Similarly, we find no significant difference in
the Friday returns across the weeks. AlthoughFriday returns are generally positive across allthe weeks, they are not significantly positive inany particular week.
Relationship between Monday effect andFriday effect
Monday returns tend to follow precedingFriday returns. In particular, Monday returnsare significantly positive (negative) when pre-vious Friday returns are positive (negative).Thus, it seems that the selling pressure frominvestors is substantially higher following badnews on the previous Friday, as proxied by thenegative returns on Friday. For instance in thefull period 1986-2002, the mean returns onMondays following positive Friday returns are0.219% to 0.535%. In contrast, the meanreturns on Mondays following negative Fridayreturns are -0.528% to -0.810%.
Conclusions
The study re-examines the existence of theday-of-the-week effect in the Asian markets ofHong Kong, Malaysia, Philippines, Singaporeand Thailand. Using eighteen years of data upto 2002, this study provides some evidence forthe day-of-the-week effect (for the full period1986-2002 and the first sub-period 1986-1994). However, sub-period analysis indicatesthat the day-of-the-week effect has generallydeclined and in some cases disappeared inrecent years.
The study also reveals that, unlike the US,there is no weekly pattern of Monday andFriday returns in the Asian markets. However,consistent with the US evidence, we foundthat Monday's returns are related to the previ-ous Friday's returns.
Professor Wing-Keung WONG and NeeTat WONG, Department of Economics,National University of Singapore.
Subject Matters
May 2004 THE TECHNICAL ANALYST 33
“SELLING PRESSURE FROMINVESTORS IS SUBSTANTIALLY
HIGHER FOLLOWING BAD NEWS ON THE PREVIOUS FRIDAY.”
Subject Matters
34 THE TECHNICAL ANALYST May 2004
Returns to managed futures fundsand Commodity Trading Advisors(CTAs) have decreased dramatical-ly. Since funds overwhelmingly usetechnical analysis, the authors con-sider why it is that technical trad-ing strategies have become lesssuccessful and find evidence tosuggest that lower price volatilityis the most likely culprit.
During the 1980s and early 1990s, invest-ment in the managed futures industry
grew quickly. In recent years however, futuresfund returns have decreased and the value ofassets invested in managed futures has stag-nated (Pendley and Zurla, 2002). The BarclayCommodity Trading Advisor Index in Figure1 shows a steady trend of decreasing returnsover the past twenty years. The causes of thisdecrease in fund performance are not fullyknown. Two possible explanations are:
(a) decreased market volatility (and thereforeprofit opportunities) and (b) price distortion caused by the growth ofthe industry.
To date, no author(s) has examined possiblecauses nor comprehensively studied a changein daily return characteristics. Yet research isneeded to determine the ways in which themarket has changed, thereby allowing techni-cal traders to adjust trading systems toaccount for these changes.
Our study (which uses bootstrap resamplingtechniques) tests the hypothesis that a struc-tural change in price fluctuations has occurredand that this may have affected the profitabil-ity of technically managed futures funds.
Evidence that technical trading returnshave decreased
Mean returns before 1991 and from 1991-2001 are presented in Table 1 for various
indices of Zurich Capital Markets. All of thefive indices show a substantial decrease inreturns. In particular, the CTA trend-follow-ing index shows a dropoff of over six per-centage points. The other indices includesome funds that either do not use technicaltrading systems or use a mixture of tradingmethods.
Brorsen and Irwin (1987) found that 13 of 21advisors relied solely on computer-guidedtechnical trading systems, but that only two of21 used no objective technical analysis.
Billingsley and Chance (1997) used a datasetthat let CTAs describe their trading approach.As a result, Billingsley and Chance went on toclassify 80% of CTAs' returns as being fromtechnical trading. They also pointed out thattraders in their non-technical category do relypartly on technical analysis.
Data we obtained from the Center forInternational Securities and DerivativesMarkets ("CISDM", 2000) classify the CTAsas 18.2% discretionary, 0.3% quantitative,60.5% systematic, 17.4% trend-based and3.6% trend-identifier. Several CTAs we knowthat rely almost entirely on trend-followingsystems are classified as systematic in theCISDM database. Many of the discretionarytraders also use trend-following systems based
on both charts and computers. Thus, thebroader indexes may be as representative oftrend-following returns as the narrowerindices.
The returns quoted in Table 1, however,should be considered in the light of the fol-lowing:
Estimating the decline in gross terms (i.e.adding back fund costs based on histori-cal records and reports): A conservativeestimate of the decrease in gross returns overthe study period is 5.15 percentage points(Table 1). However, if the calculation usesrecords that show a much larger decrease incosts, the decrease in gross returns is moredramatic - 10.16%.
The decline in interest yields: The declinein interest rates can explain part of thedecrease in the net returns (interest received is
WHY HAVE THE RETURNS TO MANAGEDFUTURES FUNDS DECREASED?by Willis Kidd and Wade Brorsen
Figure 1.
Fund returns are reported net of costs andinclude interest returns. Both costs andinterest rates have declined over time
Industry sources have related to us thatsome of the larger funds may have adopt-ed trading methods that accepted a lowerreturn in order to get reduced risk, result-ing in reduced volatility.
May 2004 THE TECHNICAL ANALYST 35
Subject Matters
a The source is the indices of Zurich Captial Markets (2002). The returns are calculated as the natural logarithm of the ending index value minus the natural logarithm of the initial value divided by the number of years. b The source is Brorsen and Irwin (1985). The costs are for public funds. c The source is Brorsen (1998). The costs are for commodity trading advisors. d Averages of the annualized returns for one-year U.S. Treasury bills by Federal Reserve Bank of St. Louis reported and then converted to a continuous-time return. e The standard deviation of monthly returns was computed by year for each CTA that listed their trading system as trend-following, trend-identifier, or mechanical. The statistics reported are the simple average of these annual standard deviations. f Calculated using the CTA value-weighted return of 14.65 minus interest of 6.75 plus cost of 13.85. The cost number is calculated as the public fund cost of 19.20 minus the difference in CTA value weighted returns and public fund returns (14.65-9.30 = 5.35) and thus assumes the entire difference in CTA and public fund returns is due to differences in cost. g Calculated using the CTA value-weighted return of 9.32 minus interest of 3.80 plus cost of 10.00. The result of 15.52 is then multiplied by the ratio of standard deviations (8.05/7.54) to adjust for possible lower leverage in the more recent period, which gives the result of 16.57
Annual Continuous-Time CTA and Commodity Pool Trading Return Statistics Before and After 1991
Return Characteristics Before and After 1991 for the Two CTAs That Were the Largest Before 1991
a 1975 or the first date in the time series.
Notes: Hypothesis tests were performed using the two sample stationary bootstrap with 1,000 repetitions. Statistically significant increases are denoted by + at .10 level and ++ at .05 level.
Statistically significant decreases are denoted by * at .10 level and ** at .05 level.
6
Variance of Daily Returns Variance of 20-Day Returns
a 1975 or the first date in the time series. Notes: Hypothesis tests were performed using the two sample stationary bootstrap with 1,000 repetitions. Statistically significant increases are denoted by
+ at .10 level and ++ at .05 level.
Statistically significant decreases are denoted by * at .10 level and ** at .05 level.
Variance of Daily and 20-Day Returns for Futures Prices
Table 2.
Table 3.
Table 1.
“DATA CLEARLY SUGGESTSTHE RETURNS TO MANAGEDFUTURES FUNDS AND CTASHAVE DECREASED BECAUSEOF THE DIMINISHING SUCCESS OF FOLLOWINGTECHNICAL TRADINGSTRATEGIES.”
36 THE TECHNICAL ANALYST May 2004
Subject Matters
a 1975 or the first date in the time series. Notes: Hypothesis tests were performed using the two sample stationary bootstrap with 1,000 repetitions.Statistically significant increases are denoted by + at .10 level and ++ at .05 level. Statistically significant decreases are denoted by * at .10 level and ** at .05 level.
Frequency and Mean of Breakaway Gaps in Futures Prices
a 1975 or the first date in the time series.
Notes: Hypothesis tests were performed using the two sample stationary bootstrap with 1,000 repetitions.Statistically significant increases are denoted by + at .10 level and ++ at .05 level. Statistically significant decreases are denoted by * at .10 level and ** at .05 level.
Mean and Variance of Close-to-Open Changes in Futures Prices
Skewness and Kurtosis of Daily Returns for Futures Prices
a 1975 or the first date in the time series. Notes: Hypothesis tests were performed using the two sample stationary bootstrap with 1,000 repetitions.Statistically significant increases are denoted by + at .10 level and ++ at .05 level. Statistically significant decreases are denoted by * at .10 level and ** at .05 level.
Variance and Skewness of Breakaway Gaps in Futures Prices
a 1975 or the first date in the time series. Notes: Hypothesis tests were performed using the two sample stationary bootstrap with 1,000 repetitions.Statistically significant increases are denoted by + at .10 level and ++ at .05 level. Statistically significant decreases are denoted by * at .10 level and ** at .05 level.
Table 4.Table 5.
Table 6. Table 7.
May 2004 THE TECHNICAL ANALYST 37
Subject Matters
down 3% per year), but is not enough toexplain the overall decline in returns.
The adoption of less risky trading strate-gies by larger funds: In terms of size, twofunds operating in the early period clearlydominated the others. Returns and standarddeviations for these two funds are reported inTable 2. Risk does show a substantial declinewhich supports the assertion that the largerfunds changed their trading methods. But forboth funds, the decline in trading returns wasmuch greater than the decline in standarddeviation. While a decline in risk may explaina portion of the decline in returns, it cannotexplain all of it.
The data clearly suggests the returns to man-aged futures funds and CTAs have decreasedbecause of the diminishing success of follow-ing technical trading strategies.
Structural changes to price movements
Any change in the way futures prices fluctuatecould change the returns to technical trading.Technical trading systems developed prior tothe change may therefore be obsolete.
For example, three livestock commodities doindeed show decreased frequency of limitmoves: pork bellies fell from 17% to 10%,feeder cattle from 5.5% to 2.2% and live cat-tle from 5.2% to 1.4%. Tables 3 to 7 presentseveral other statistical measures and provide
further evidence that reduced price variabilitywas the primary change in futures markets.
However, although many variables show evi-dence of change, there are still a few statisticsthat remained generally the same. The averagesize of close-to-open price changes andbreakaway gaps did not consistently change.The skewness of returns, gaps and close-to-open changes changed in only a few com-modities.
Conclusions
The two dominant changes are a decrease inprice volatility and an increase in the kurtosisof price changes occurring while markets areclosed. These changes are consistent with thereduced profitability of technical tradingbeing due to changes in the overall economy.The results are not consistent with increasedtechnical trading having caused the structuralchange, because in that case price volatilityshould have increased. If economic condi-tions change so that futures prices becomemore volatile, then presumably returns totechnical trading would increase.
Willis Kidd is a former graduate researchassistant in the Department ofAgricultural Economics at OklahomaState University.
Wade Brorsen is a Regents Professor andJean & Patsy Neustadt Chair in theDepartment of Agricultural Economics atOklahoma State University.
(Full details of the study will appear in theJournal of Economics and Business, May-June 2004, pp. 159-176).
References
Billingsley, R.S. and Chance, D.M. (1996). Benefitsand limitations of diversification among commodi-ty trading advisors. Journal of PortfolioManagement, 23, 65-79.
Brorsen, B.W. and Irwin, S.H. (1987). Futures fundsand price volatility. The Review of Futures Markets,6, 118-135.
Center for International Securities and DerivativesMarkets (CISDM) (2000). CISDM Database.University of Massachusetts at Amherst.
Pendley, K. and Zurla, K. (2002). Managed futures:Performance hinders growth but still outshinesequities. Futures Industry, July/August, 20-22.
Understanding the characteristicsof nonlinearity in financial mar-kets is crucial to the developmentof technical analysis - it may helpus determine which TA tech-niques will work better than oth-ers. Using data from the South-East Asian stock and currencymarkets, the authors describe non-linearity, show evidence for itsexistence and talk about its impli-cations for TA.
Studies into the financial markets have beendominated by the linear paradigm. The lin-
ear paradigm assumes that financial time-series conform to linear models, which may bebest represented by a continuous straight lineon a graph. Moreover, it is widely believedthat (1) stock prices can be well approximatedby the Capital Market Pricing Model (CAPM)and the Arbitrage Pricing Theory (APT)Model; and (2) foreign exchange rate move-ments may be determined by the PurchasingPower Parity (PPP), Interest Rate Parity (IRP)and other fundamental models. All these arecommonly applied linear models.
However, there is no solid reason to supposethat movements of financial prices must beintrinsically linear. One can hardly find a con-tinuous straight line on any graph of anyfinancial price. Rather, one normally comesacross combinations of wave-like or even U-,S-, V-, W- and L-shaped patterns. In fact,some recent empirical studies have shown thatfinancial variables exhibit nonlinear move-ments. (All movement that exhibits polynomi-al (e.g. square, cubic), exponential, logisticand/or trigonometric (wave-like) functionsare nonlinear in character). Among others,Nicholas Sarantis found empirical evidenceon the nonlinear behavior in the stock pricesof seven major industrial economies (G-7),whereas Christopher Baum and others havedetected the presence of nonlinear adjust-
ment dynamics in developed foreign exchangemarkets.
The potential existence of nonlinearity infinancial markets is due to the dynamic, asym-metric and heterogeneous behavior of marketplayers in their response to market informa-tion and conditions. Another cause is the non-proportional speed of adjustment in financialprices. A relatively small rise in a financialprice, for example, may not be transformedinto arbitrage action if such profit is not largeenough to cover the trading cost. Thus, smallchanges in prices will be left unadjusted.However, once the price exceeds certain limitswhereby marginal profits meet the players'expectations, they will certainly adjust. In suchcase, the larger the price change, the faster themarket adjustment.
Our study
This study reports the empirical evidence fornonlinear behavior in the stock prices andspot exchange rates of the major developingSouth-East Asian (SEA) financial markets.Our stock price data consists of the dailygrowth rates (from the close of one day to the
next) of the Jakarta Composite Index (JCI),the Kuala Lumpur Composite Index (KLCI),the Philippines Composite Price (PCOMP),the Singapore Straits Times Index (STI) andthe Stock Exchange of Thailand (SET). Asfor currencies, we study the daily growth ratesof the spot US dollar based exchange rates ofthe Indonesia rupiah (IDR), the Malaysia ring-git (MYR), the Philippines peso (PHP), theSingapore dollar (SGD) and the Thai baht(THB).
General stock markets characteristics
The results of our study on SEA stock pricesare summarized in Table 1. Table 1 shows thaton average the sum of daily positive growthrates in stock prices are slightly more thanthose of negative growth rates in the KLCI(mean=0.002%) and the STI (0.005%). Onthe other hand, the reverse is true for the JCI(- 0.001%), the PCOMP (- 0.003%) and theSET (- 0.038%). However, as the mean valueis susceptible to bias due to outliers (unordi-nary large or small values), the median value,which is not affected by outliers, is more reli-able. By this value, all stock indices exhibitzero average daily growth rates, implying
38 THE TECHNICAL ANALYST May 2004
NONLINEARITY FAVOURS NONLINEAR TA TECHNIQUESby Kian-Ping Lim and Venus Khim-Sen Liew
Subject Matters
Growth Rates JCI KLCI PCOMP STI SET
Summary Statistics
Sample period 2/1/1990
31/10/2001
2/1/1990
31/10/2001
2/1/1990
31/10/2001
2/1/1990
31/10/2001
2/1/1990
31/10/2001
No. of observations 3087 3087 3087 3087 3087 Mean – 0.001 0.002 – 0.003 0.005 –0.038 Median 0.000 0.000 0.000 0.000 0.000 Maximum 13.128 20.817 16.178 14.868 11.350 Minimum –12.732 – 24.153 – 9.744 – 9.672 – 10.028 Standard deviation 1.558 1.715 1.665 1.358 1.889 Normality Analysis
HBL Test (p-value) 0.006 0.006 0.028 0.006 0.036 LST Test (p-value) 0.000* 0.000* 0.000* 0.000* 0.000*
Table 1. Summary statistics, normality analysis and linearity test results of growth rates ofmajor SEA stock prices
May 2004 THE TECHNICAL ANALYST 39
break-even investment or arbitrage activitiesin these markets in the long term, even thoughprofits or losses may be encountered byinvestors or arbitrageurs in the short term.
By referring to the maximum and minimumvalues in Table 1, we know that the positiveand negative daily growths rates in the SEAregion have recorded a peak of 20.817% and24.152% respectively, both from theMalaysian stock market. Regarding investmentrisk, the standard deviation value shows thatthe Thailand stock market is the riskiest (stan-dard deviation=1.889) followed by theMalaysian market (1.715), whereas theSingapore stock market (1.358) has the leastrisk.
Evidence for nonlinearity in stock prices
More interestingly, the skewness values inTable 1 show that these financial prices haveasymmetrical distribution (0 in normal condi-tion). It is therefore not surprising to observethat the normality assumption (i.e. symmetri-cal bell-shaped distribution) has been stronglyrejected by the Jarque-Bera normality (JBN)test (see Box 1).
However, this finding cannot be taken as sta-tistical evidence for nonlinearity. Two formal
tests capable of distinguishing the linearity ornonlinearity of our growth rates - the Hinich-Bispectrum Linearity Test (HBL Test) and theLukkonen-Saikkonen-Teräsvirta Test (LSTTest) - are applied in this study. Briefly, theformer is able to detect the existence of non-linear self-dependencies whereas the latter isuseful in capturing the potential nonlinearadjustment of stock or forgien exchange mar-ket dynamics.
The results of the HBL linearity test (Table 1)show that stock prices exhibit strong nonlin-ear dependencies on their own past records.The LST test tells us more and suggests thenonlinearity present can be characterized by atype of nonlinear time-series model (theSmooth Transition Autoregressive (STAR)model) which captures bell- and S-shapednonlinear adjustments (exponential and logis-tic nonlinearity).
Subject Matters
Table 2. Summary Statistics, normality analysis and linearity test results of growth rates ofmajor SEA exchange rates
IDR MYR PHP SGD THB
Summary Statistics
Sample period 16/11/1995
31/12/2002
2/1/1990
31/8/2001
16/11/1995
31/12/2002
2/1/1990
31/12/2002
2/1/1990
31/12/2002
No. of observations 1759 2179 1773 3267 3210 Mean 0.078 0.020 0.040 – 0.003 0.016 Median 0.017 0.000 0.008 0.000 0.000 Maximum 30.189 7.196 7.176 2.762 20.769 Minimum – 23.316 – 9.157 – 12.518 – 4.144 – 6.353 Standard deviation 2.512 0.695 0.776 0.356 0.753
HBL Test (p-value) 0.006 0.006 0.010 0.006 0.006 LST Test (p-value) 0.000* 0.000* 0.000* 0.000* 0.000*
"trading rules based on techniques such as Elliott Wavesand head-and-shoulders, which already incorporate somesense of nonlinearity, may be more reliable or profitable.
In contrast, reservations must be made for technicalanalysis that uses linear autoregressive, moving average
or exponential moving average models."
40 THE TECHNICAL ANALYST May 2004
General foreign exchange markets charac-teristics
Table 2 depicts the results of our study on theSEA daily spot exchange rates. Table 2 showsthat, on average, the sum of daily positivegrowths (depreciation) are either equal to ormore than those of negative growths (appre-ciation) in all exchange rates (mean/medianare zero or positive in value) except theSingapore dollar, which recorded an averagemean value of - 0.003% (median=0, howev-
er). It should be noted that while the medianfor other foreign exchange rates are 0 in value,implying break even long term arbitraging andhedging activities, there are two rates namelythe rupiah (median=0.078%) and peso(0.008%) where investors holding short posi-tions may be slightly better off. However, it isworth knowing that the peso has the highestexchange rate risk (standard deviation =2.512, maximum = 30.189, minimum = -23.316; much riskier than its stock price index)in the SEA region. As for the other exchangerates, they have lower risk than their corre-sponding stock indices.
Evidence for nonlinearity in foreignexchange rates
Similar to the findings in the stock markets,the skewness and JBN values show that theSEA stock exchange rates are asymmetricaland thus non-normal in nature. On top ofthat, the results from the HBL and LST linear-ity tests provide strong evidence of nonlinearbehaviour in all these exchange rates.
More reliable technical trading rules
The existence of nonlinear financial price
behavior, as found in this study, has crucialimplications for financial market researchersand practitioners alike. We can no longer takethe linear assumption for granted. Hence, lin-ear models like the CAPM and APT (forstocks), and the PPP and IRP (for exchangerates) may need modification before they canbe readily applied, at least to the South-EastAsian region. To this end, trading rules basedon techniques such as Elliott Waves and head-and-shoulders, which already incorporatesome sense of nonlinearity, may be more reli-able or profitable. In contrast, reservationsmust be made for technical analysis that useslinear autoregressive, moving average or expo-nential moving average models.
Kian-Ping Lim is a lecturer in the LabuanSchool of International Business andFinance, Universiti Malaysia Sabah,Malaysia.
Venus Khim-Sen Liew is a research assis-tant at the Faculty of Economic andManagement, Universiti Putra Malaysia,Malaysia
Subject Matters
p-values show how far we can reject anull hypothesis. Conventionally, a p-value of 0.10 or larger is taken as evidence for not rejecting a null hypoth-esis. In the tests listed in Tables 1 and 2the p-values are significantly less than0.10 and result in the rejection of thefollowing null hypotheses:
JBN test: Normality does exist
HBL test: Nonlinearity does not exist
LST test: STAR-type nonlinearity doesnot exist
Brief note on the test statistics
Box 1.
Book review
ADVANCED SWING TRADING
Advanced Swing Trading Strategies to predict, identify, and tradefuture market swingsBy John Crane Published by John Wiley 219 pages, £45.50 ISBN 0-471-46256-X
A handful of books on swing trading have appeared inrecent years, in particular Marc Rivalland's book pub-lished by Harriman House. In contrast to Rivalland'swork, Crane's book assumes the reader has a goodworking knowledge of charting techniques and takes amore in-depth and systematic approach to the varioustechniques available to the swing trader.
Swing trading is designed to take advantage of short-term movements in longer-term market trends. Thisallows more pro-active traders to identify and exploitprofit making opportunities in normal market volatility.Crane calls such movements "reaction swings" and hegoes on to explain how they allow the trader to identifynot only price objectives and stop loss levels, but alsothe timing of future moves or "reversal dates".
Reaction swings resemble flags in the middle of a trendand are based on the theory of action/reaction. This isthe basic pattern of a trending market (action) whichcorrects and then resumes its trend (reaction). Theanalysis of this reaction swing allows the trader to antic-ipate subsequent moves and time future reversals in thecurrent price trend. The mid-point of the reaction swingcan be used to make projections by drawing a line fromthe start of the main trend through the mid-point of theswing. This accurately pinpoints both the price and tim-ing of the next price reversal.
The reaction swing is familiar to technical analysts as aflag or pennant. These usually indicate a mid-point of aprice trend but offer only limited information regardingthe timing of a price objective or future turning points.The reaction swing is a simple method that can makegreater use of the information inherent in these patterns.
The reaction cycle represents the bigger picture allow-ing the trader to identify the start of a market trend, itsmid-point and the end of the major trend. In an uptrend-ing market, identifing the first reaction swing is crucial inestablishing the beginning of a reaction cycle. Havingdiscussed the reaction swing and cycle, Crane goes onto discuss the application of Gann lines in relation toaction/reaction theory and also presents a usefuloverview of trading "hints" such as reversal price pat-terns, gapping patterns and trail days.
This book is written for the experienced trader who
May 2004 THE TECHNICAL ANALYST 41
Book review
already has a solid understanding of technical analysis.While swing trading is a relatively new technique fortrend analysis, it is not as groundbreaking as somerecent books have implied. Swing trading relies on theapplication of simple and established TA techniques andas such, this trading method is not as advanced asCrane's book title suggests.
In the text, the author readily admits to being an inexpe-rienced writer and this shows in his descriptions of thevarious techniques he presents. He therefore relies onnumerous examples to illustrate the subject with little orno reference to the market psychology that is behind thebehaviour of the reaction cycle. The problem with aheavy reliance on market examples is that the readerhas no way of knowing how carefully chosen the exam-
ples were by the author. A more scientific and theoreti-cal approach to the subject would greatly enforce thearguments presented in this and numerous other tech-nical analysis publications.
This is not an easy book to read and understand. Theprinciples that Crane attempts to describe in each chap-ter are not always as clearly explained as they shouldbe. Moreover, the time required to master the numerousvariations of the swing trading techniques described inthe book is probably more than most traders would con-sider, especially as he or she is doubtless already usingother techniques in their trading strategies. However,the numerous charts are well presented and Crane'spublication adds to the relatively limited amount of liter-ature on a valuable subject.
Letters
LETTERS TO THE EDITOR
SIR: I would like to draw your readers' attention to the dangersof data snooping - a phenomenon that I believe should beconsidered in all assessments of TA techniques.
Data snooping is the generic term for the danger that the bestforecasting model found in a given data set by a certain speci-fication search is just the result of chance instead of the resultof truly superior forecasting power. Jensen (1967) alreadyargued that the good results of the relative-strength tradingrule used by Levy (1967) could be the result of survivorshipbias. That is, strategies that performed well in the past get themost attention by researchers. Jensen and Benington (1969) goa step further and argue, "Likewise given enough computertime, we are sure that we can find a mechanical trading rulewhich works on a table of random numbers - provided ofcourse that we are allowed to test the same rule on the sametable of numbers which we used to discover the rule. We real-ize of course that the rule would prove useless on any othertable of random numbers, and this is exactly the issue withLevy's results."
Another form of data snooping is the publication bias. It is awell-known fact that studies presenting unusual results aremore likely to be published than the studies that just confirm awell-known theory.
The problem of data snooping was addressed in most of thework on technical analysis, but for a long time there was notest procedure to test for it. Finally White (2000), building onthe work of Diebold and Mariano (1995) and West (1996),developed a simple and straightforward procedure for testingthe null hypothesis that the best forecasting model encoun-tered in a specification search has no predictive superiorityover a given benchmark model. The alternative is of coursethat the best forecasting model is superior to the benchmark.Summarized in simple terms, the procedure bootstraps theoriginal time-series a great number of times, preserving thekey characteristics of the time-series. White (2000) recom-mends the stationary bootstrap of Politis and Romano (1994).
Next, the specification search for the best forecasting model isexecuted for each bootstrapped series, which yields an empiri-cal distribution of the performance of the best forecastingmodel. The null hypothesis is rejected at the alpha percent sig-nificance level if the performance of the best forecastingmodel on the original time series is greater than the alpha per-cent cut-off level of the empirical distribution. This procedureis called White's Reality Check (RC) for data snooping.Sullivan, Timmermann and White (1999, 2001) utilize the RCto evaluate simple technical trading strategies and calendareffects applied to the DJIA in the period 1897 to 1996.
Sullivan et al. (1999) take the study of Brock et al. (1992) as astarting point and construct an extensive set of 7846 tradingrules, consisting of Alexander's (1961) filters, moving averages,support-and-resistance, channel break-outs and on-balancevolume averages. It is demonstrated that the results of Brocket al. (1992) hold after correction for data snooping, but thatthe forecasting performance tends to have disappeared in theperiod after the end of 1986.
For the calendar effects (for example the January, Friday andthe turn of the month effect) Sullivan et al. (2001) find thatthe RC in all periods does not reject the null hypothesis thatthe best forecasting rule encountered in the specificationsearch does not have superior predictive ability over the buy-and-hold benchmark. If no correction were made for thespecification search, then in both papers the conclusion wouldhave been that the best model would have significant superiorforecasting power over the benchmark. Hence Sullivan et al.(1999, 2000) conclude that it is very important to correct fordata snooping otherwise one can make wrong inferences aboutthe significance of the best model found.
Gerwin Griffioen, analyst,Insinger de Beaufort Asset Management,The Netherlands
May 2004 THE TECHNICAL ANALYST 43
44 THE TECHNICAL ANALYST May 2004
COMMITMENTS OF TRADERS REPORT16 January 2004 – 4 May 2004Non-commercial net long positions and spot rates
10-year US Treasury Source: CBOT10-yr Treasury Spot
-250000
-200000
-150000
-100000
-50000
0
50000
100000
Jan-13 Feb-10 Mar-09 Apr-06 May-04
3.00
3.20
3.40
3.60
3.80
4.00
4.20
4.40
4.60
4.80
Commitments of Traders Report
5-year US Treasury Source: CBOT5-yr Treasury Spot
0
50000
100000
150000
200000
250000
300000
Jan-13 Feb-10 Mar-09 Apr-06 May-04
2.40
2.60
2.80
3.00
3.20
3.40
3.60
3.80
Dow Jones Industrial Average Source: CBOTDJIA Spot


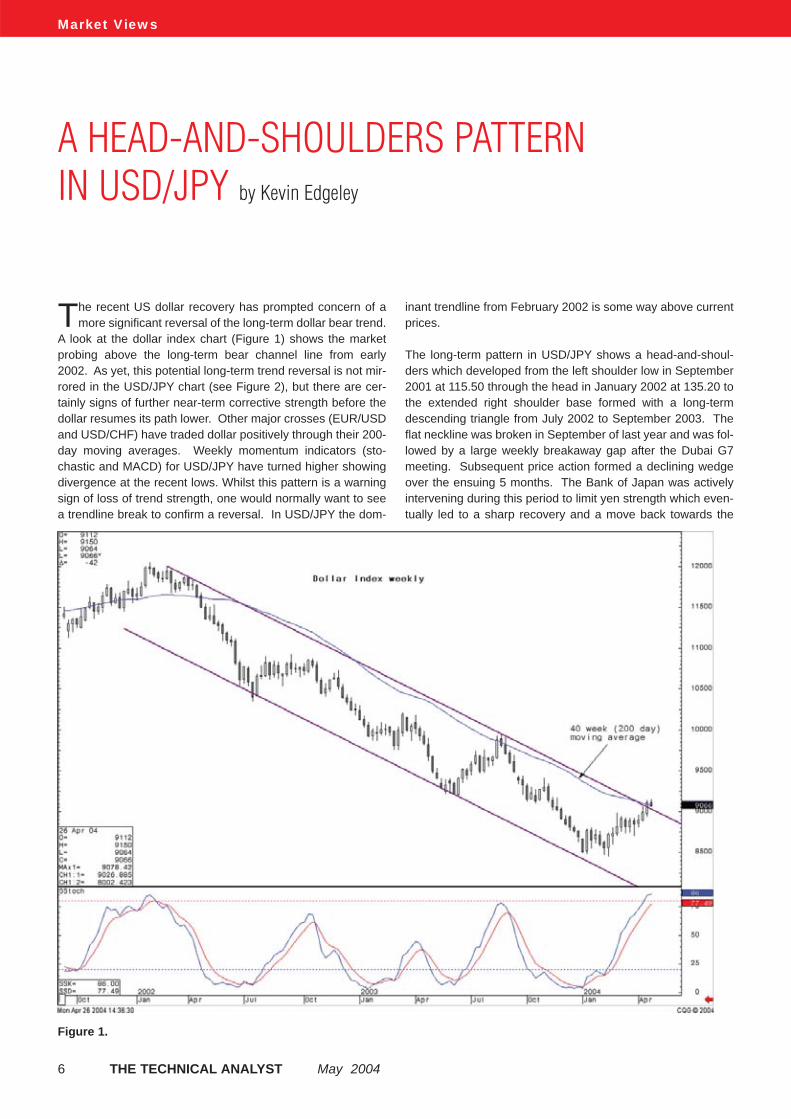
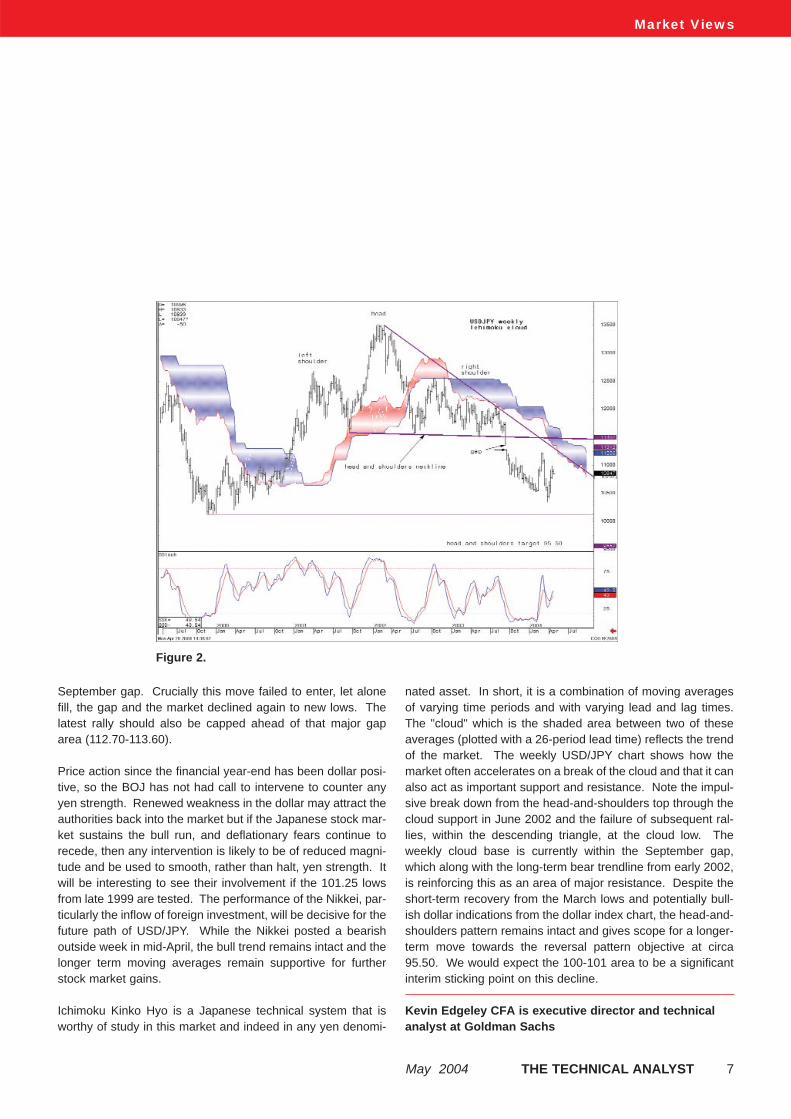
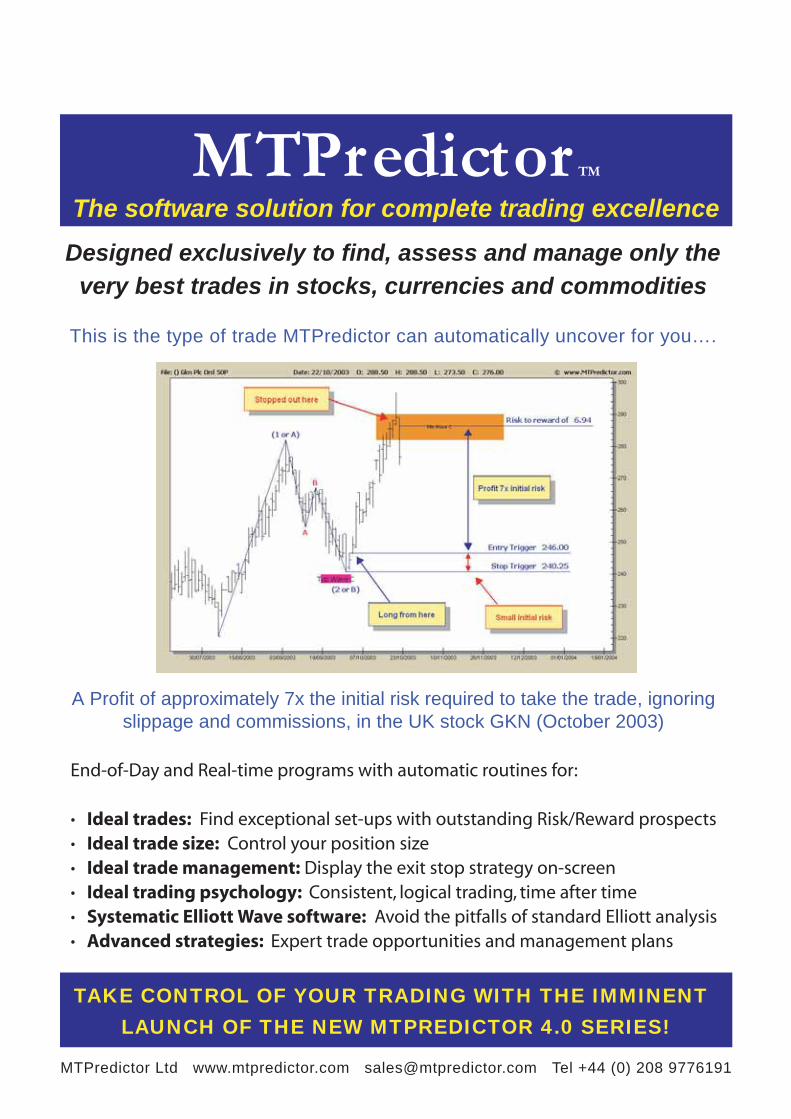
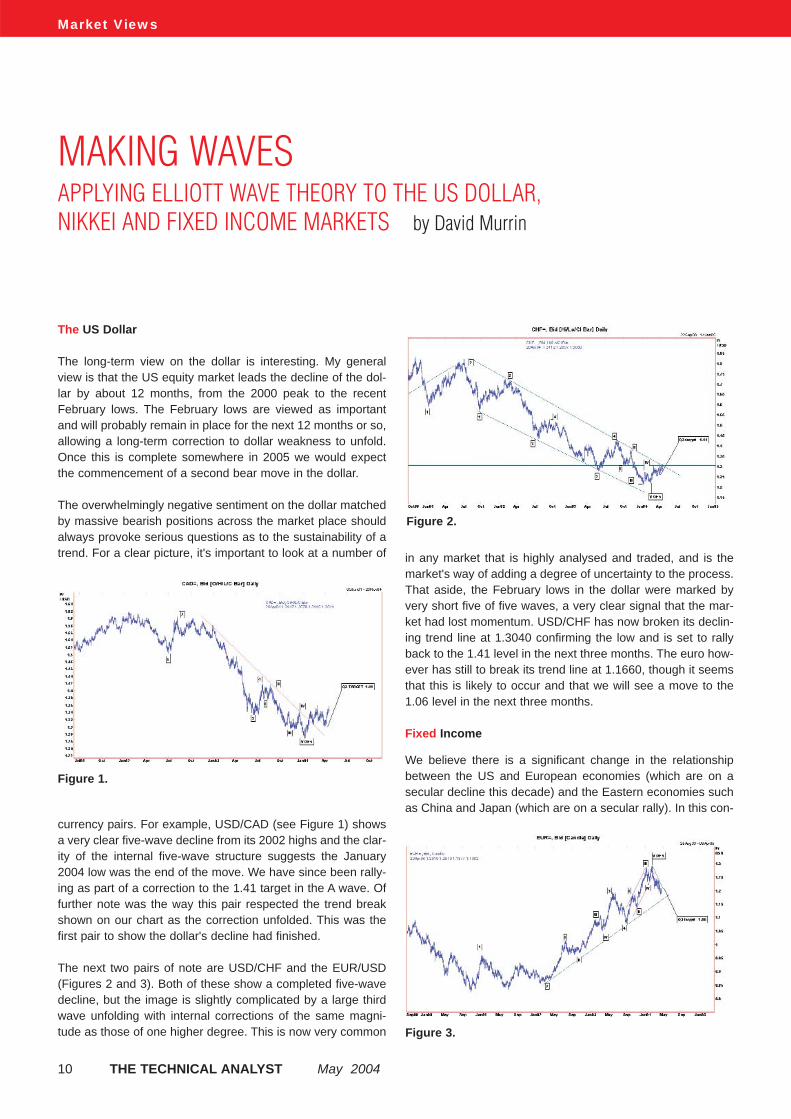
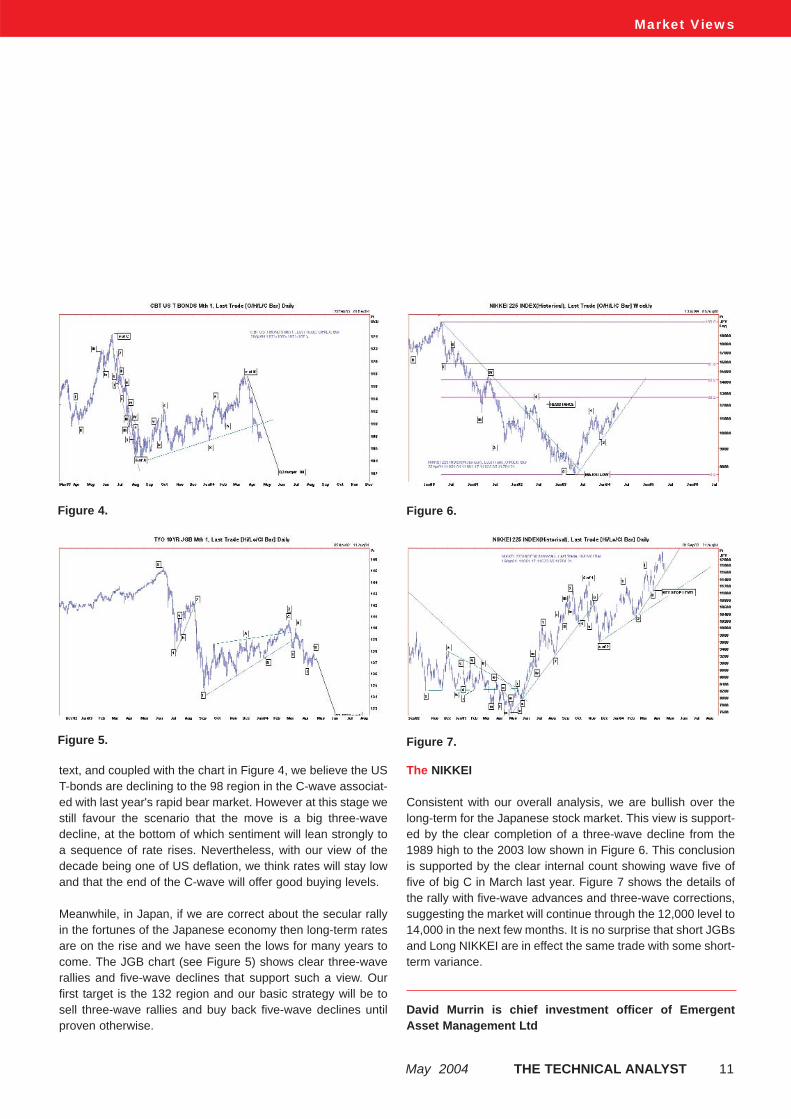
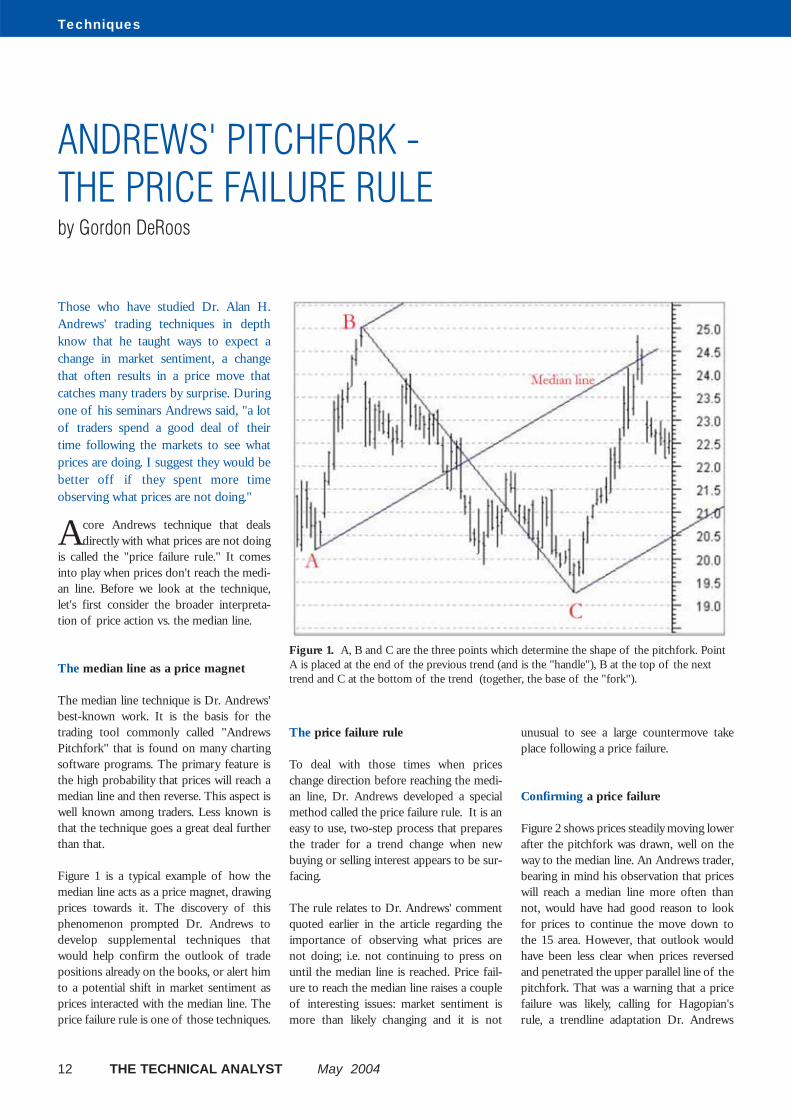
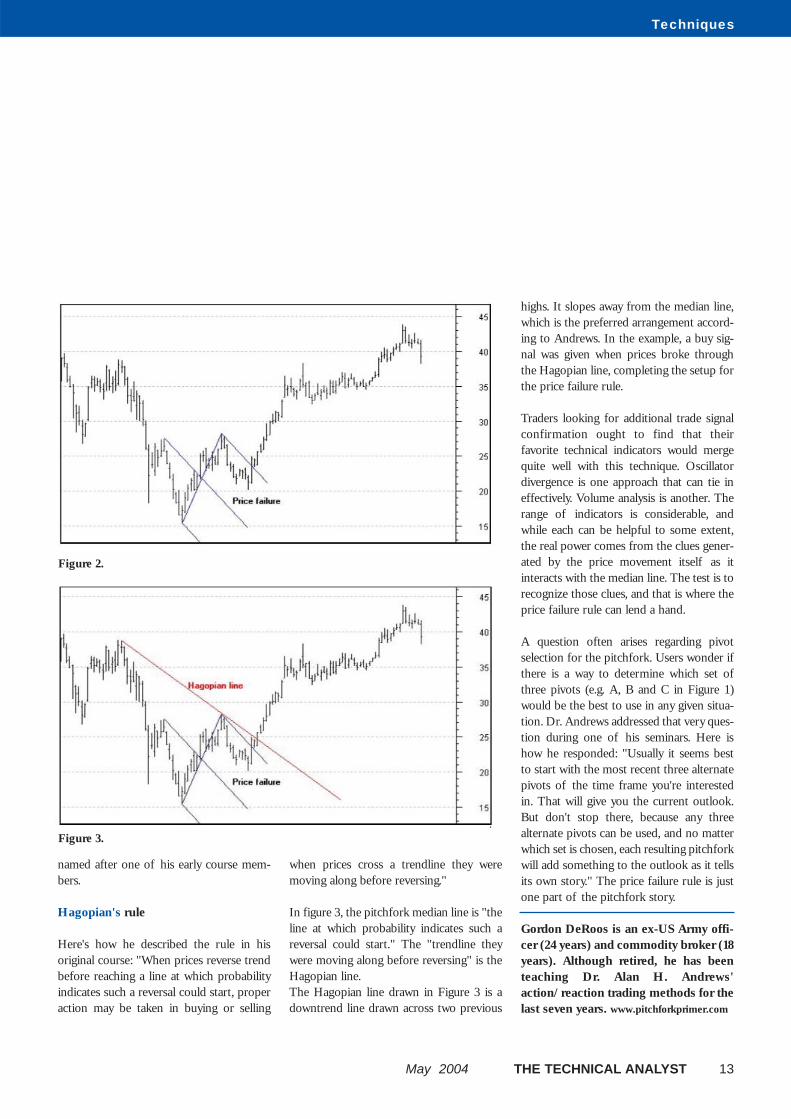

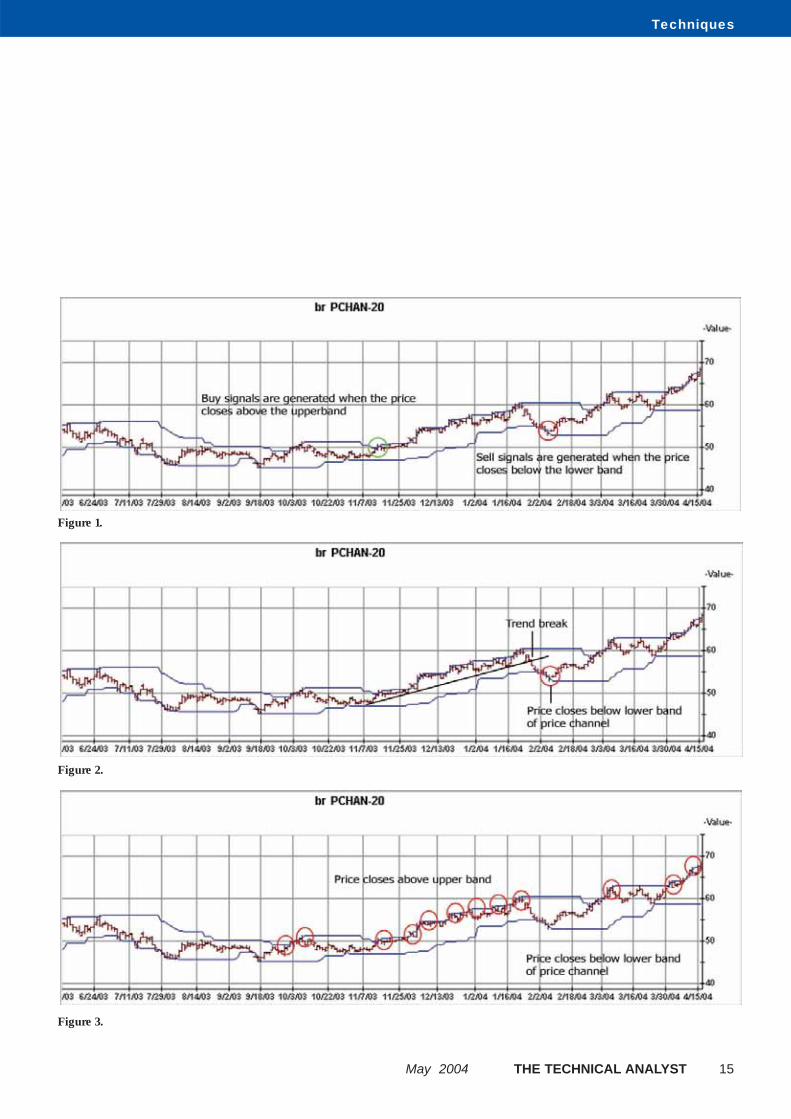
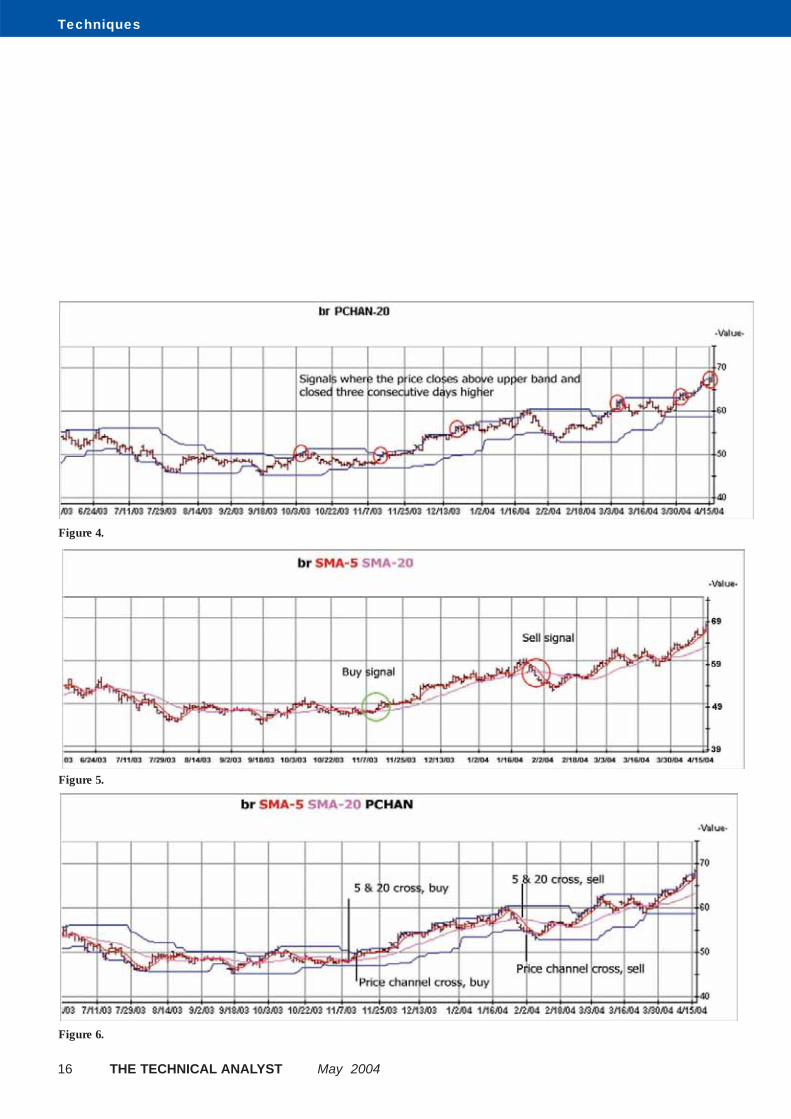
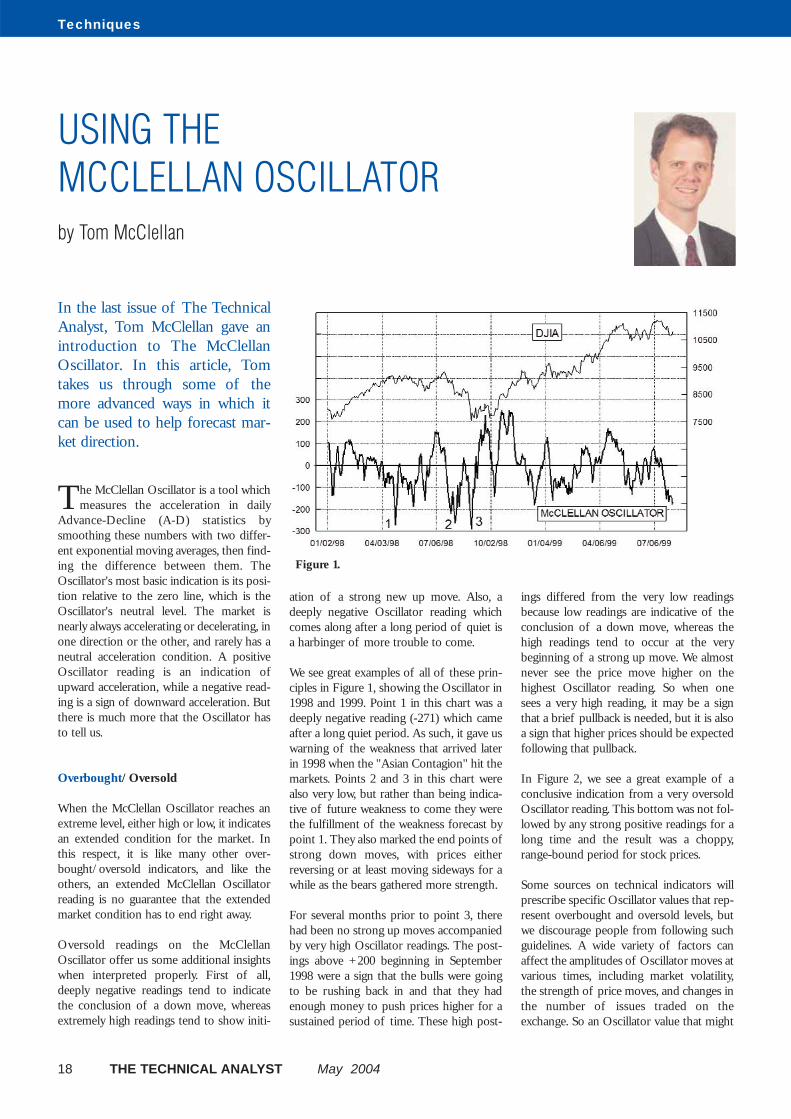
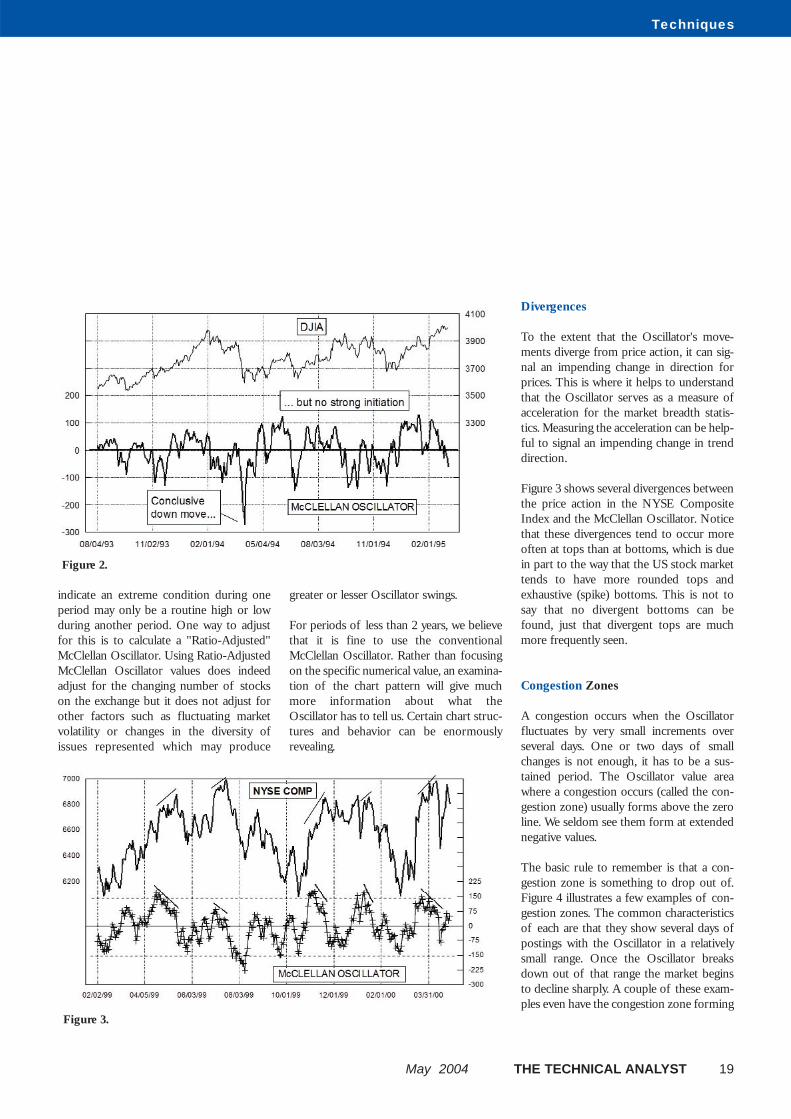
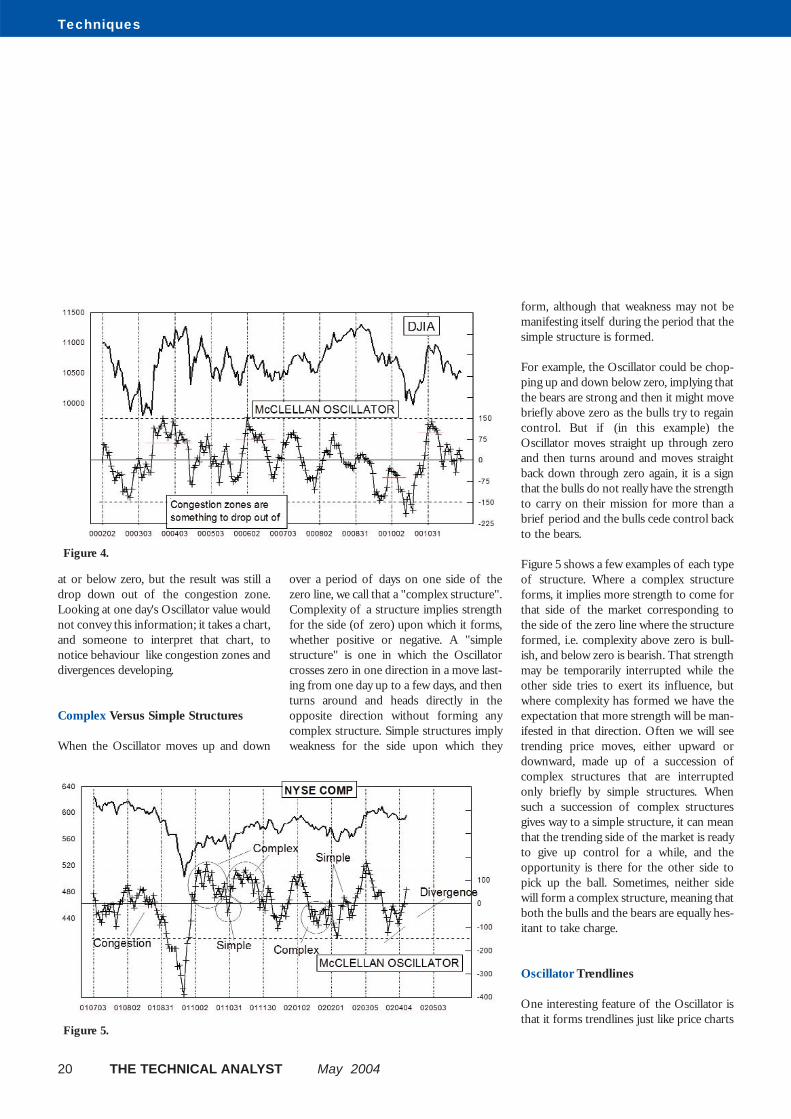
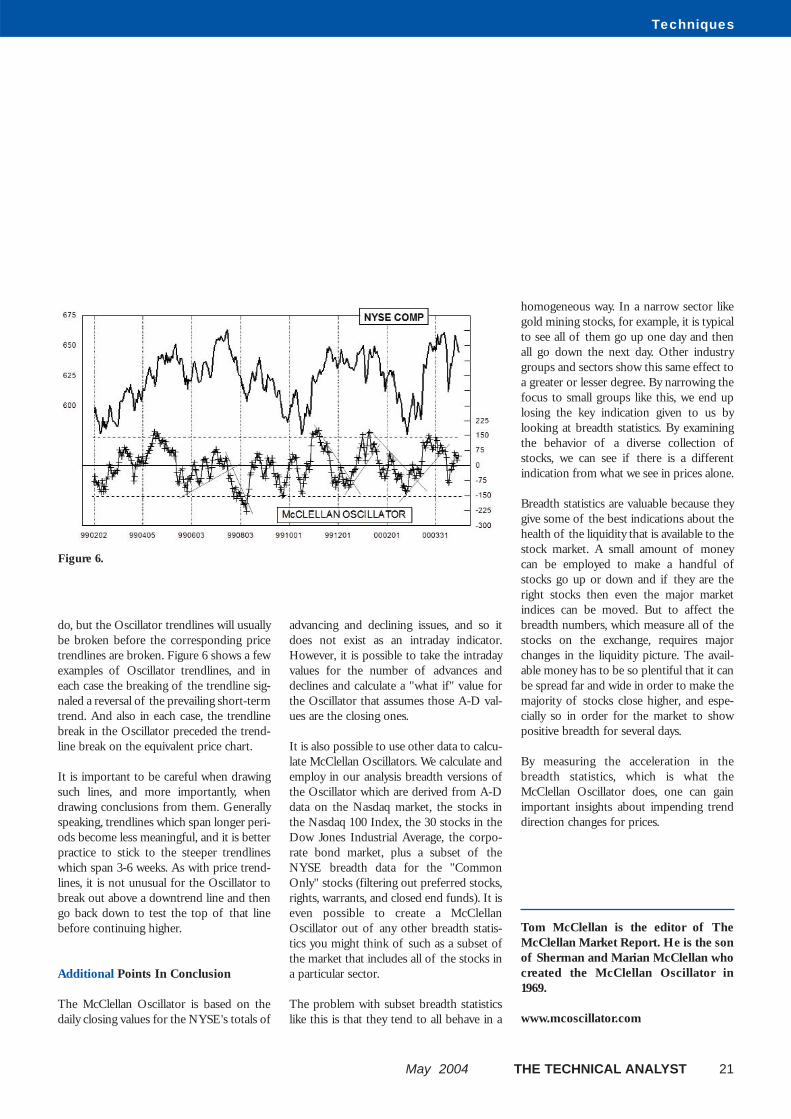
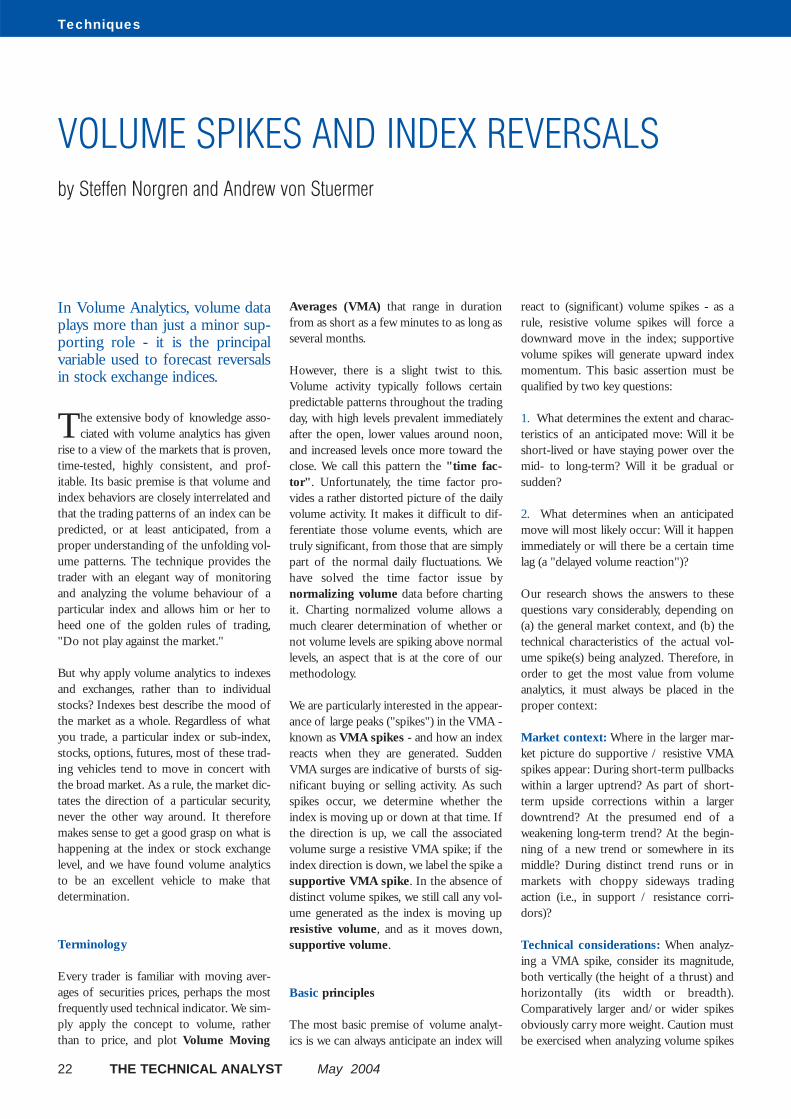
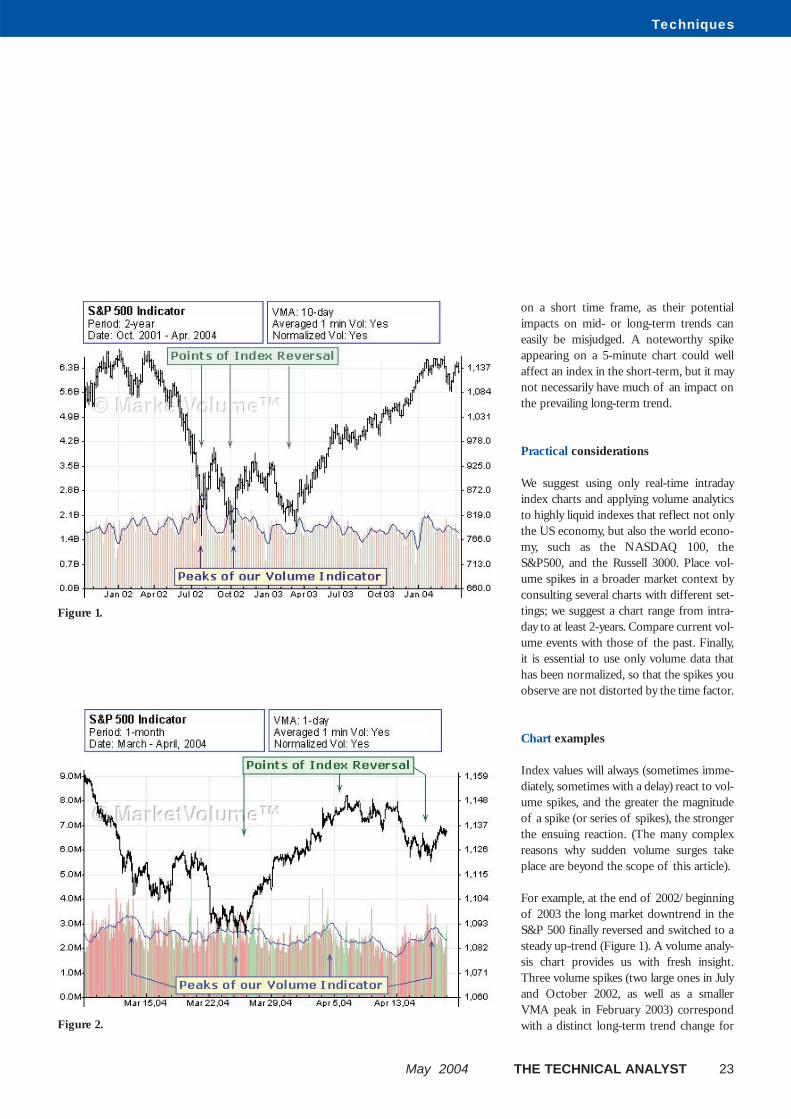
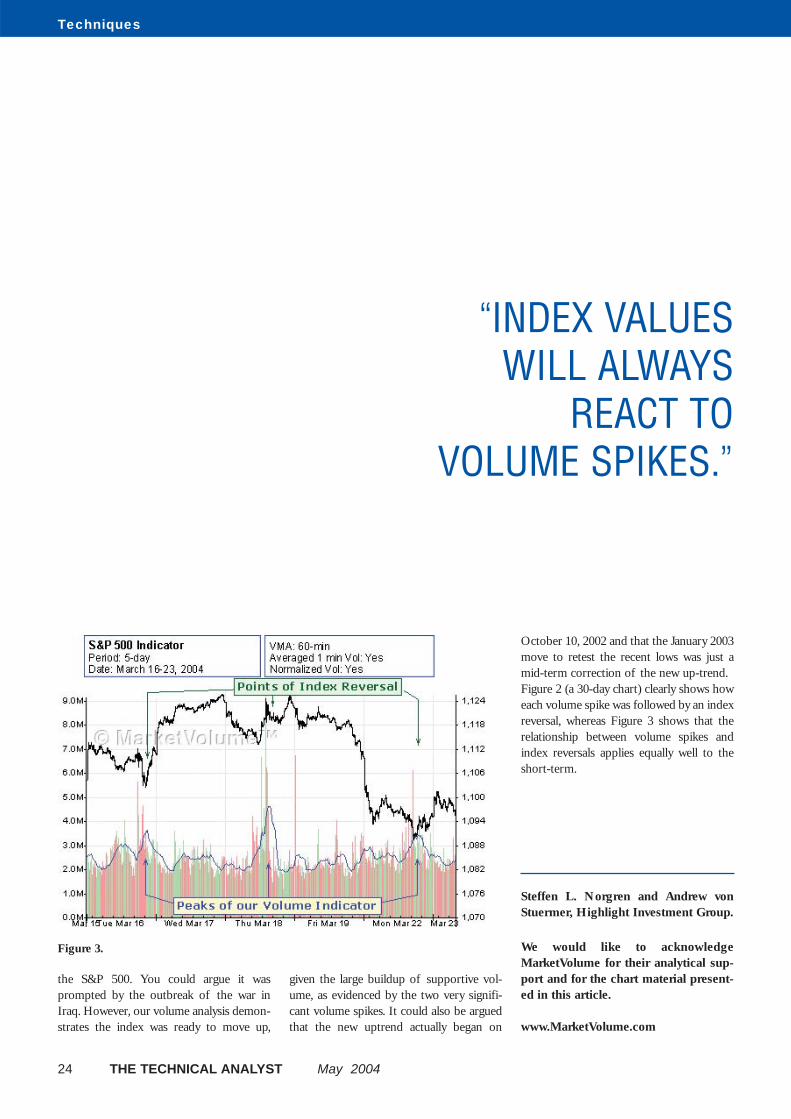

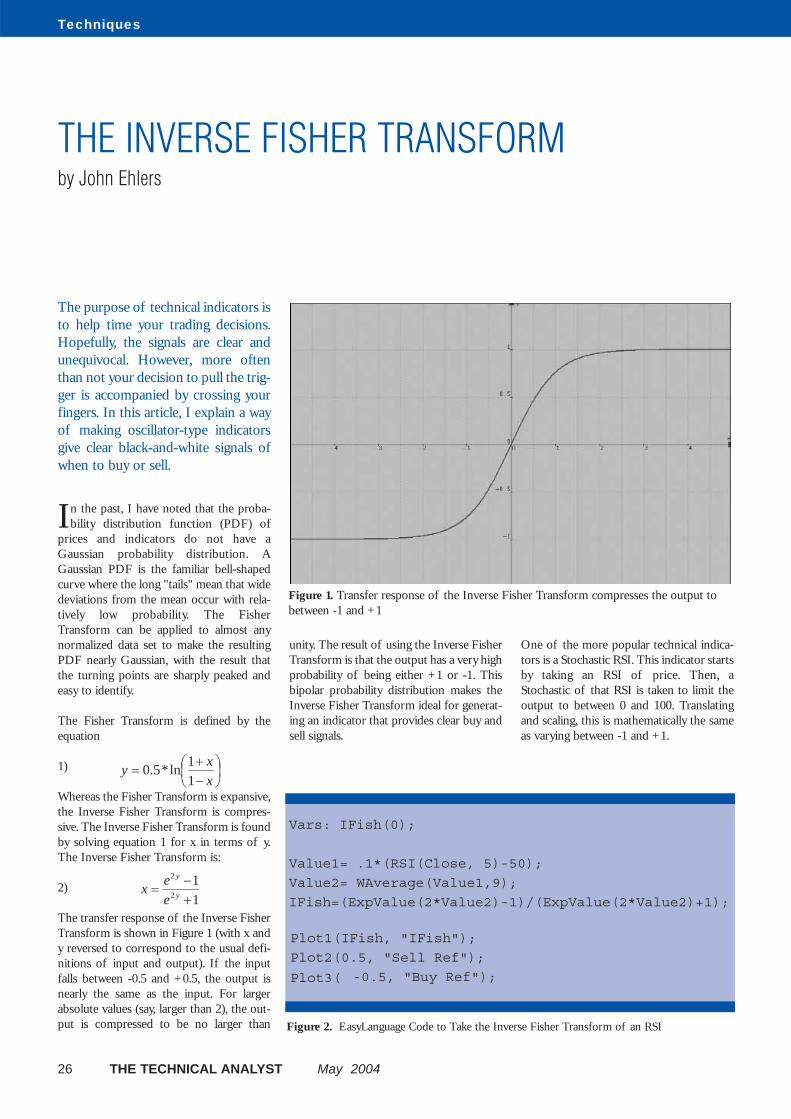
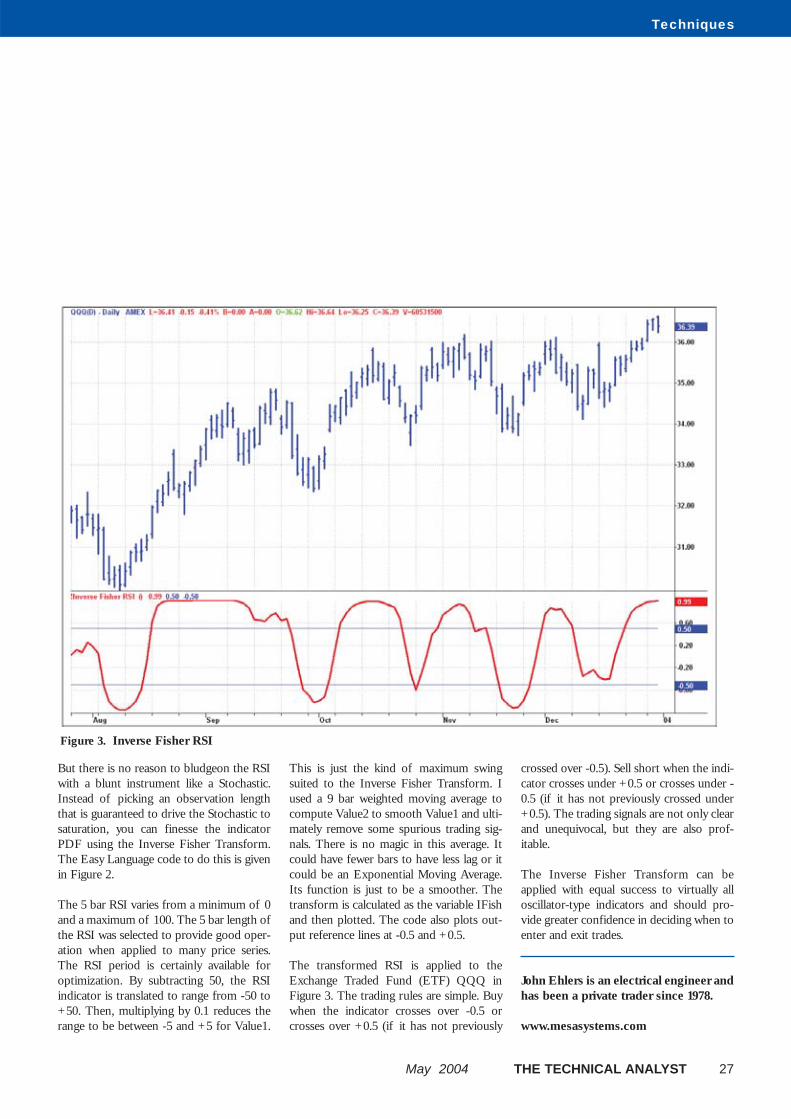
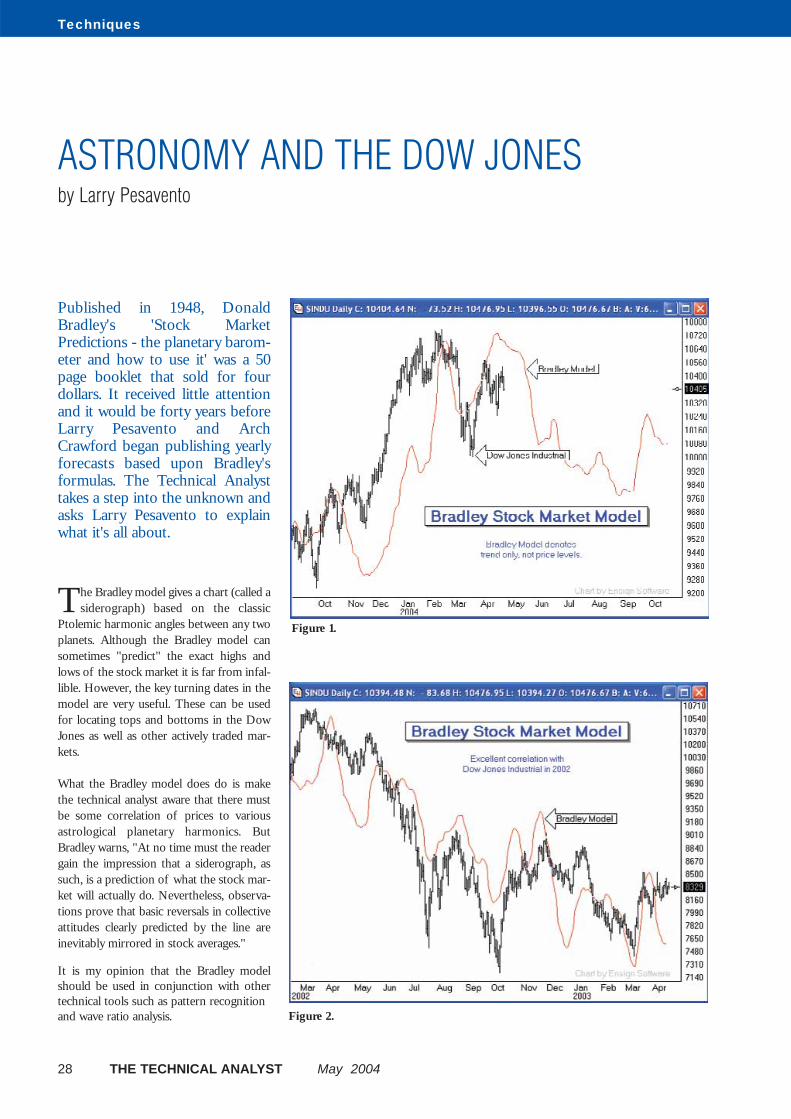
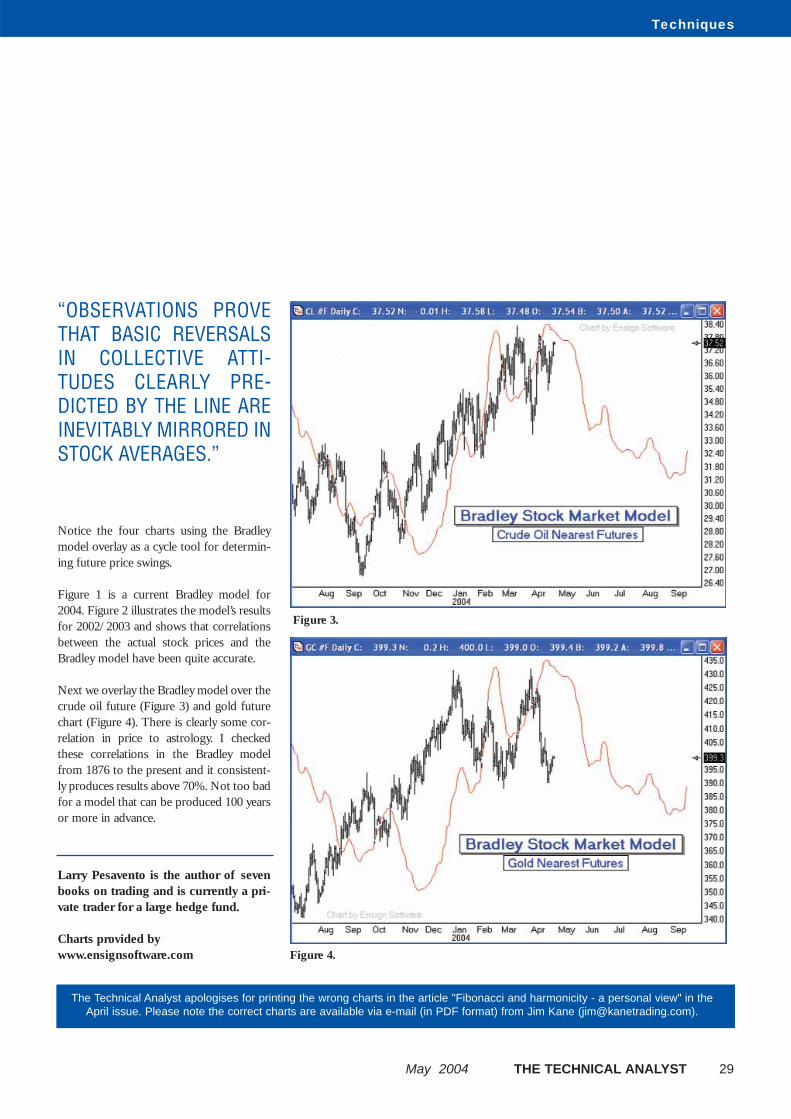


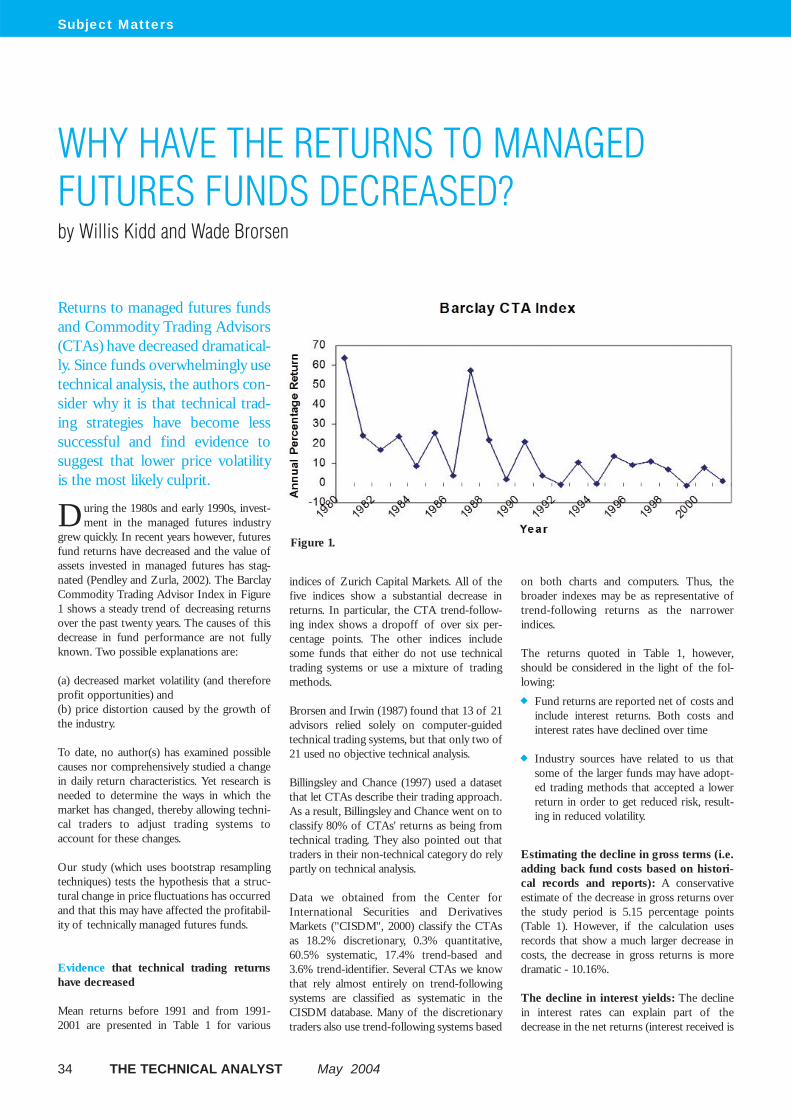
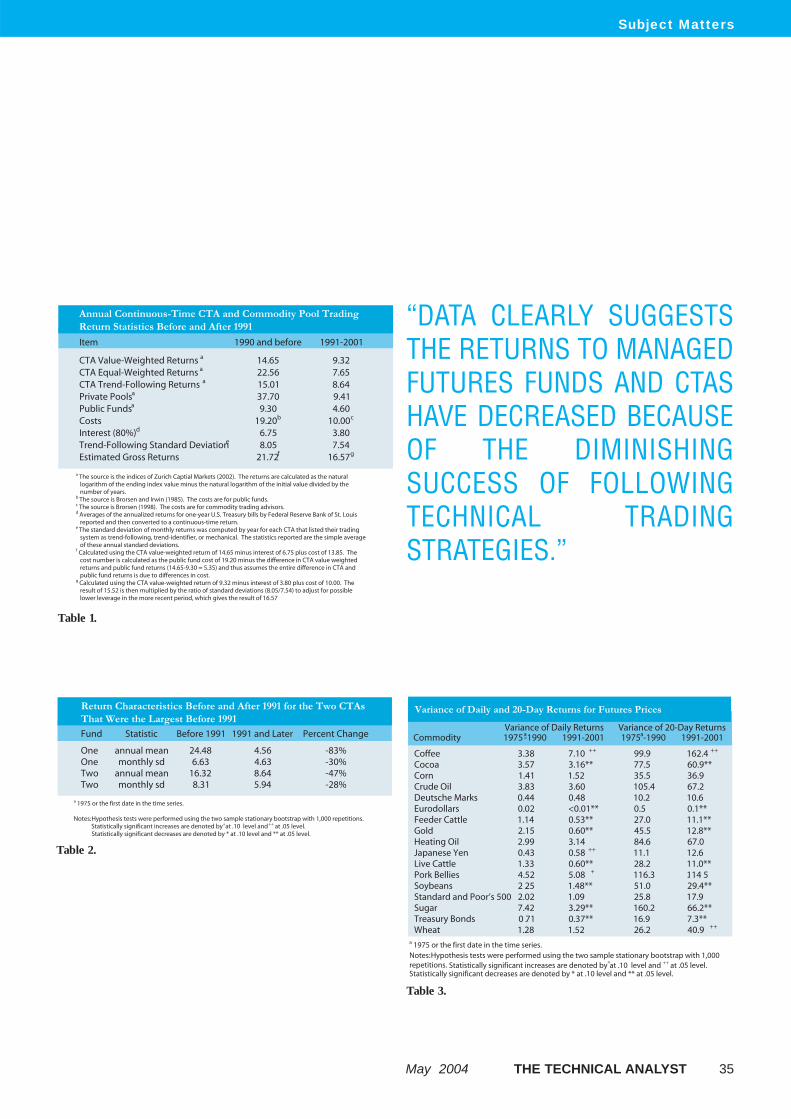
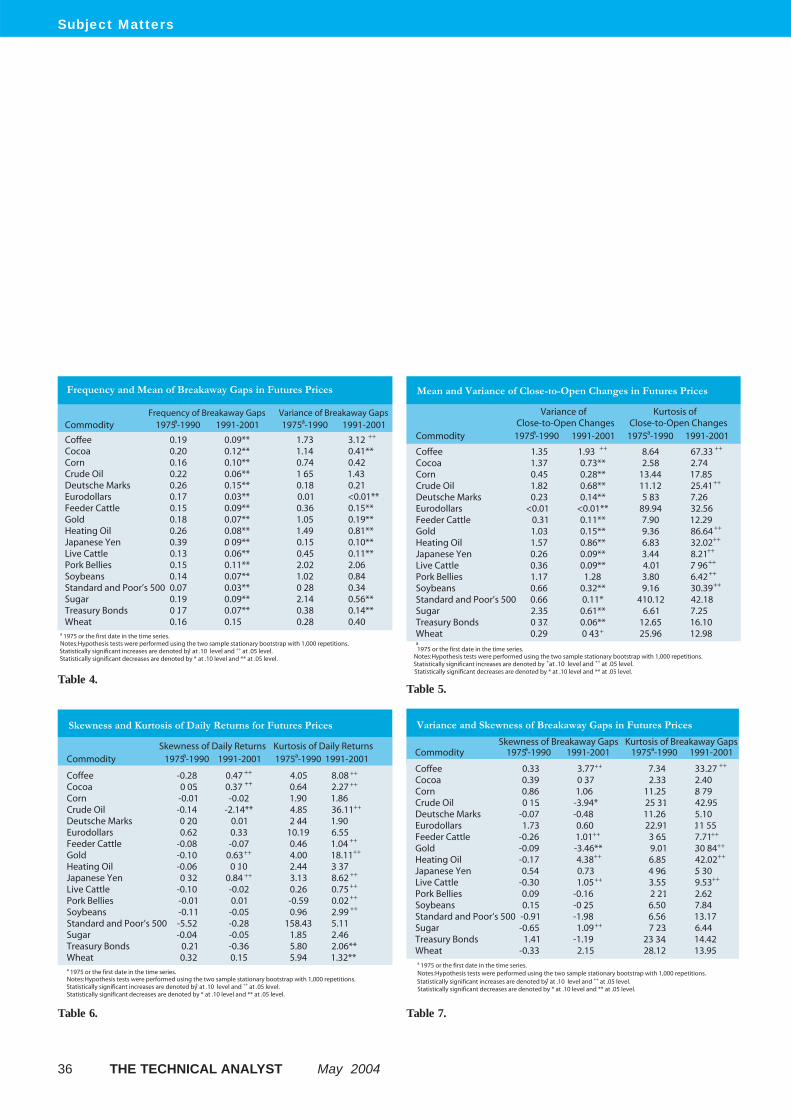

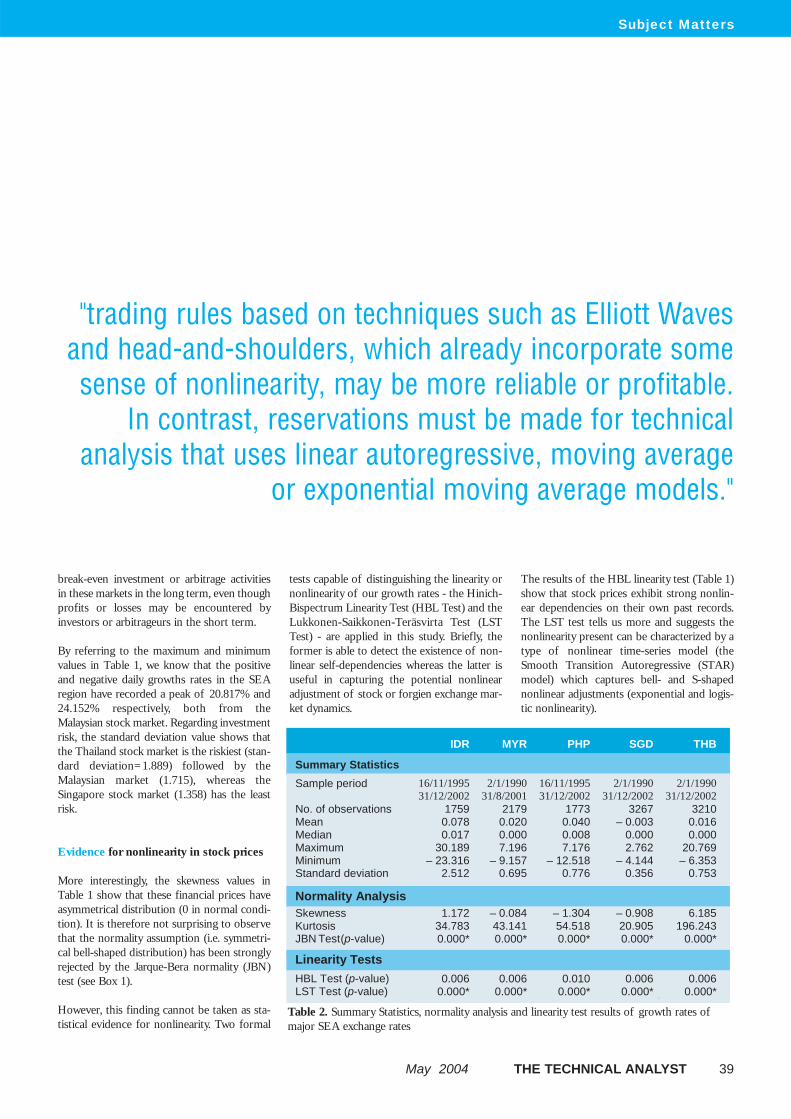
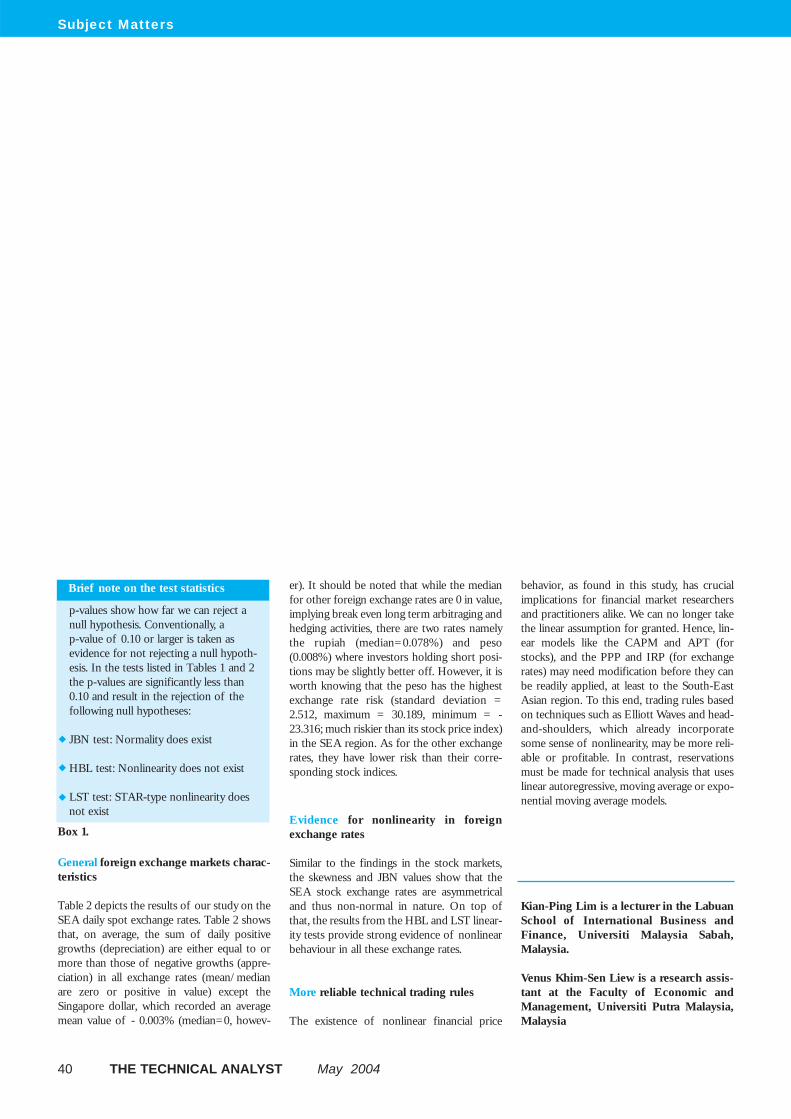
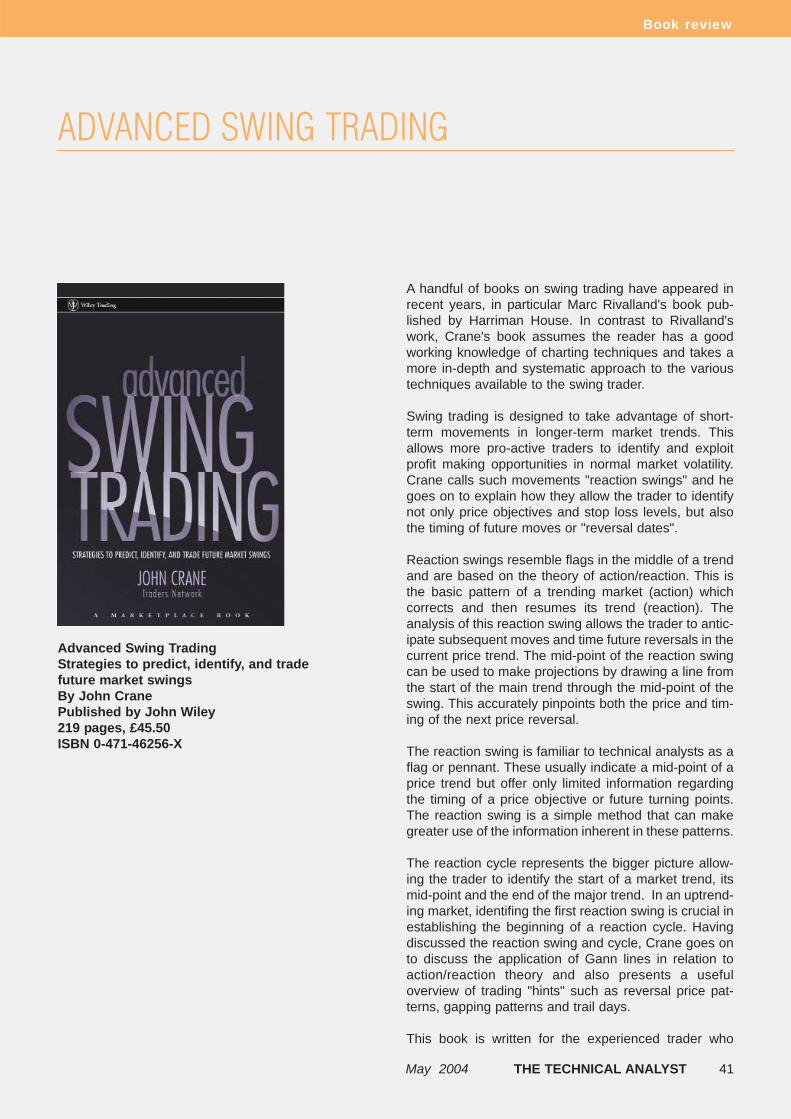


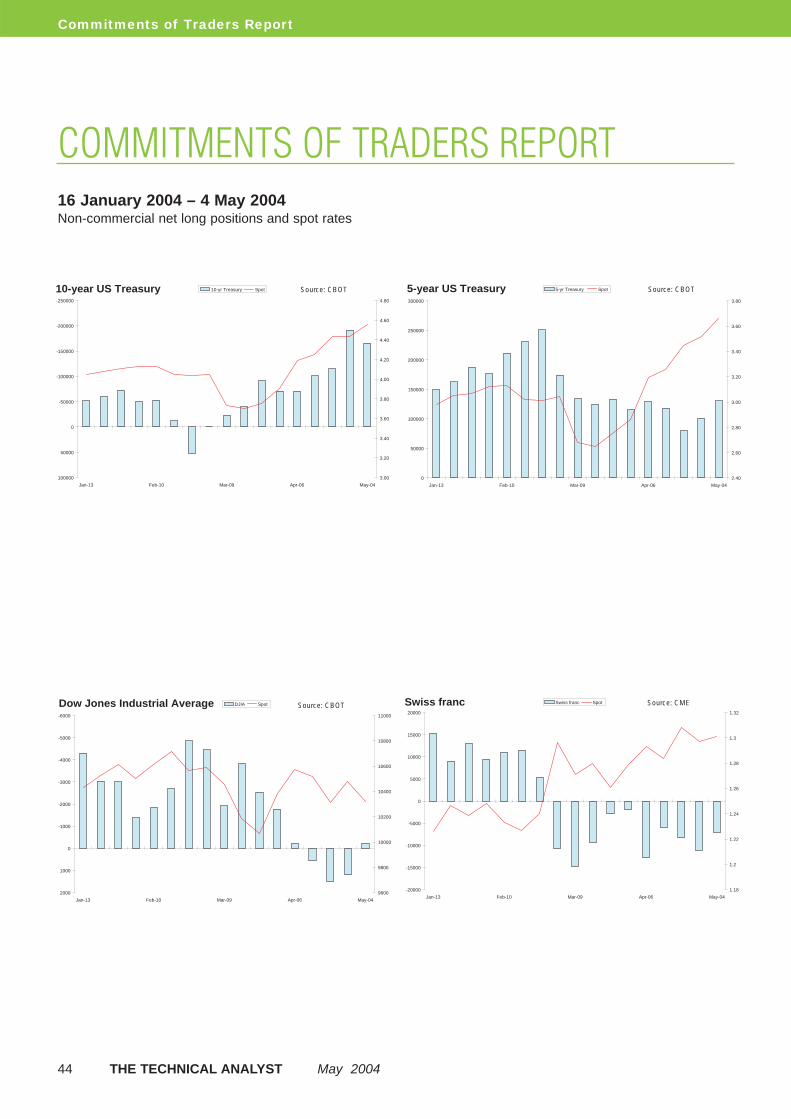
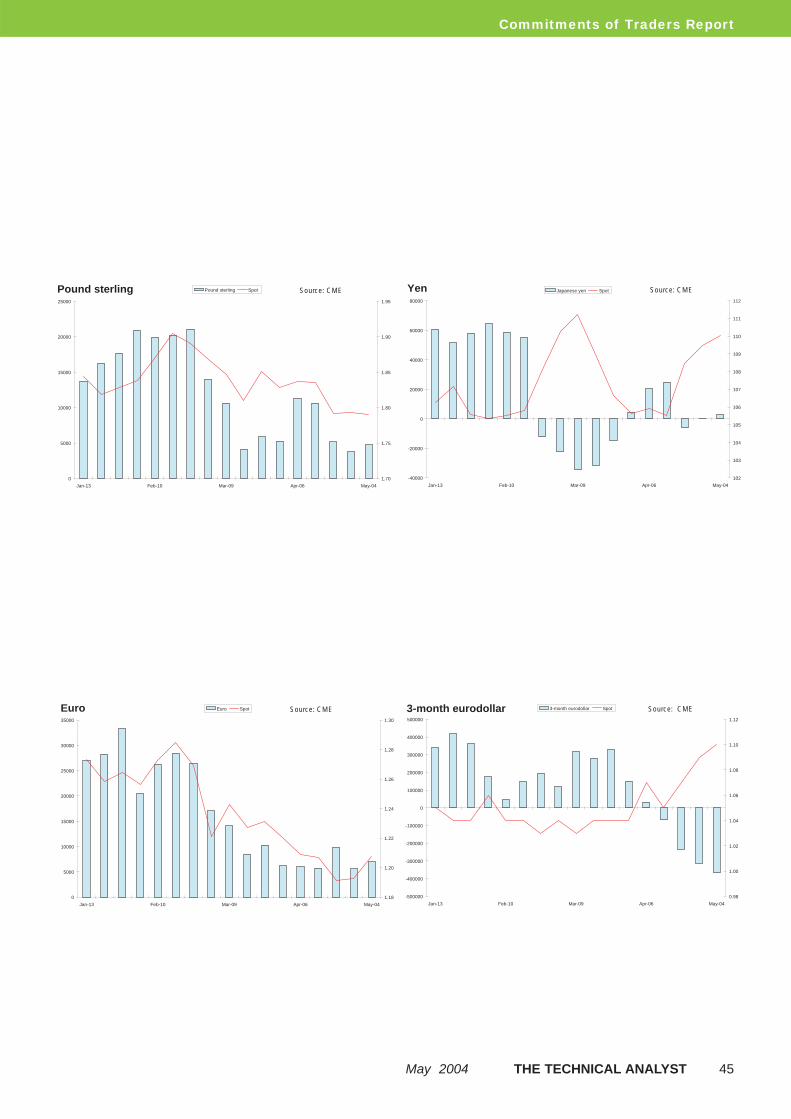
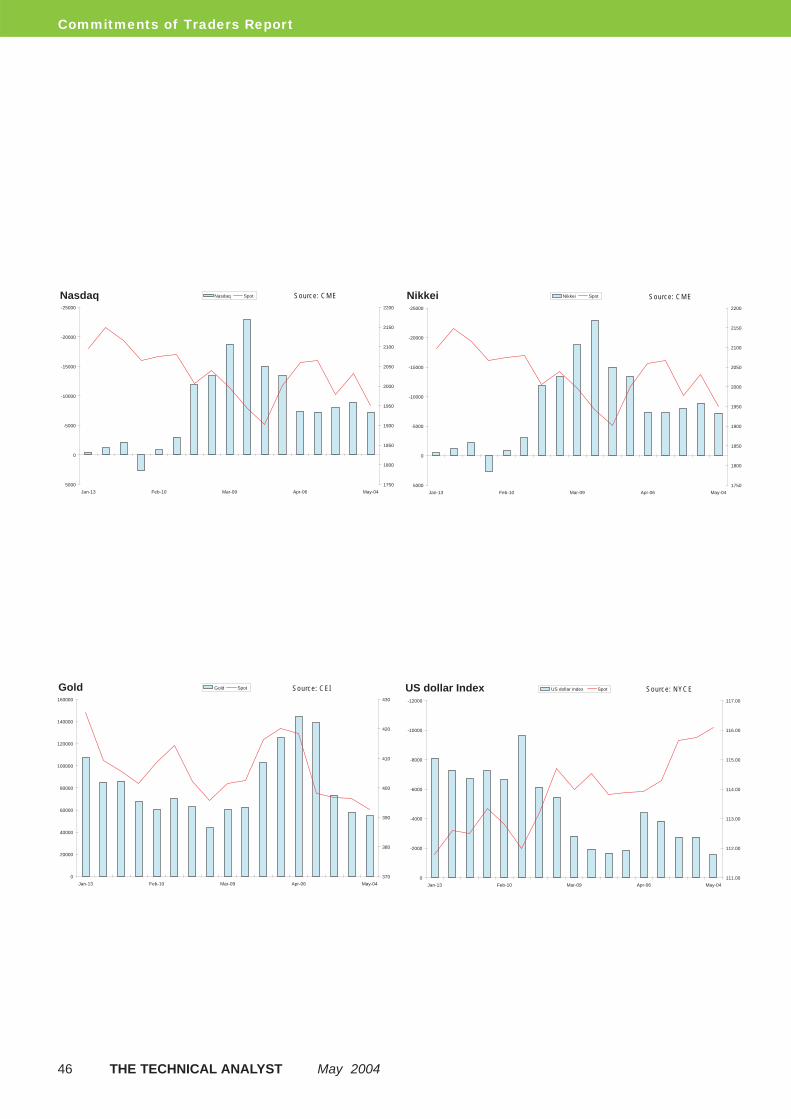
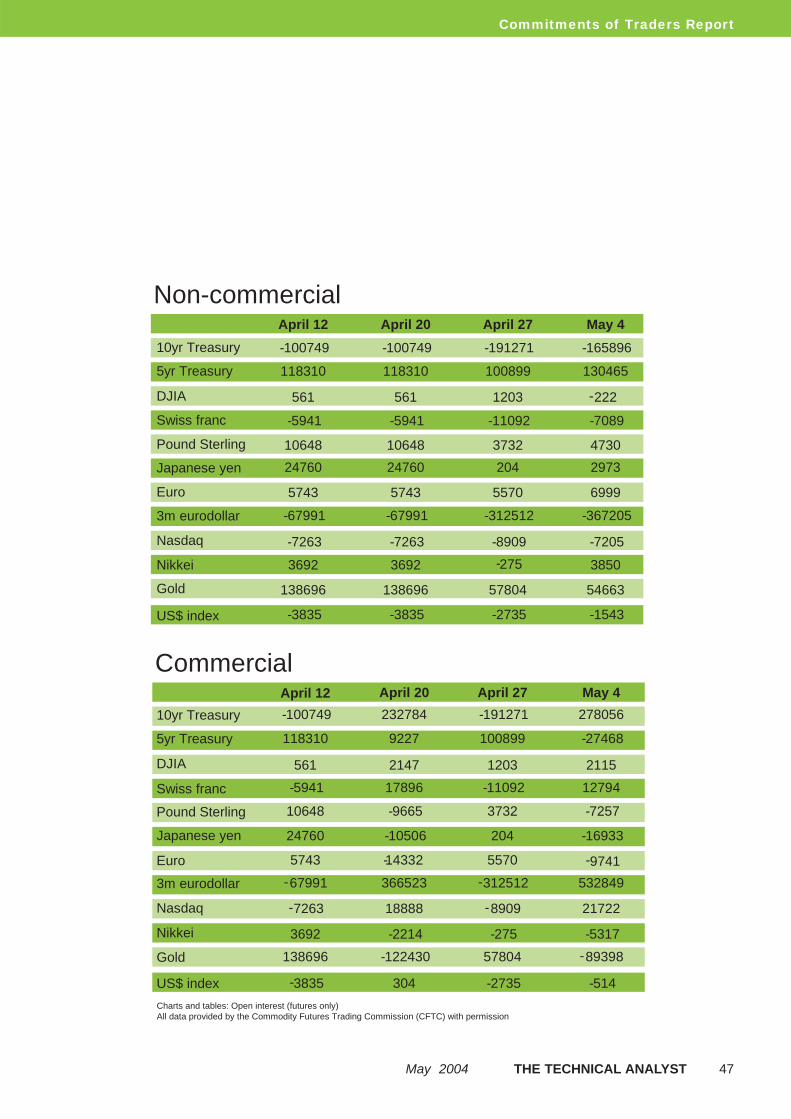


![What's the difference between WTI and Brent Crude Oil? [PPT]](https://static.documents.pub/doc/80x56/589ff76a1a28ab46598b5a77/whats-the-difference-between-wti-and-brent-crude-oil-ppt.jpg)


