30
BRFSS Behavioral Risk Factor Surveillance System STATE of OKLAHOMA 2005 Annual Report & Trend Analysis 19882005

BRFSS Behavioral Risk Factor Surveillance System
STATE of OKLAHOMA 2005 Annual Report
& Trend Analysis 19882005
Permission is granted for the reproduction of this publication provided that the reproductions contain reference to the source: BRFSS Oklahoma annual report 2005 & Trend Analysis 1988-2005.
Printed November 2007

BRFSS: Behavioral Risk Factor Surveillance System STATE of OKLAHOMA Annual Report 2005
& Trend Analysis 19882005
Oklahoma State Department of Health 1000 NE 10th Street Oklahoma City, OK 73117 http://www.health.ok.gov
Center for Health Statistics Printed November 2007 Email: [email protected]
Web Query: OK2Share (Oklahoma Statistics on Health Available foR Everyone) http://www.health.ok.gov/ok2share

acknowledgements
James M. Crutcher, M.D., M.P.H. Commissioner of Health and State Health Officer
Kelly M. Baker, M.P.H., Director Center for Health Statistics
Derek S. Pate, M.P.H., Quality Assurance Coordinator Health Care Information
EDITOR
Siew C. Ang, M.A. Health Care Information
BRFSS CALLING CENTER
Joyce Kirksey, Gloria Martinez, Sylvia Sims, Alex Borunda, Willie Cannon, Daniela Cavazos, Jan Foster, Yvonne Gonzales, Brenda James, Correllia Long, Connie Porter,
Julie Quirk, Verdia Russell, Clara Thomas
SPECIAL THANKS
Sue Mallonee, RN, MPH, Director of Scientific Affairs

contents
Oklahoma BRFSS 5
Introduction 6 Methodology 7 Demographics 10 Section I: Health Status
General Health Status 15 Healthy Days 20
Section II: Health Care Access Health Insurance Coverage 23 Health Care Barrier Due to Cost 27 Primary Care Provider 29
Section III: Health Prevalence Diabetes 31 Cardiovascular Diseases 38 High Blood Pressure 44 High Blood Cholesterol 47 Arthritis and Osteoporosis 50 Diagnosed Current Asthma 54
Section IV: Modifiable Individual Risk Behaviors Tobacco Use 59 Alcohol Consumption 63 Physical Activity 70 Leisure Time Physical Activity 72 Overweight and Obesity 75
Section V: Clinical Preventive Services Cholesterol Screening 81 Immunization
Influenza Shot 84 Nasal Spray Flu Vaccine 90 Pneumonia Shot 91
Breast Cancer Screening 94 PAP Test 97 Prostate Cancer Screening 99 Colorectal Screening 106
County Level Information 108 References 124
Contents
introduction methodology health status health care access health prevalence m
odifiable risk factors county information references
contents introduction m
ethodology demographics health status health care access health prevalence m
odifiable behaviors preventive services

6 Oklahoma BRFSS
Introduction Nearly half of all deaths occurring annually in
the United States are due to modifiable
behavioral risk factors (McGinnis, 1993). 1
This report indicated that if we could control
approximately ten risk factors, we could
reduce 40 to 70 percent of all premature
deaths, a third of all cases of acute disability,
and twothirds of all cases of chronic
disability.
The Behavioral Risk Factor Surveillance
System (BRFSS) is the world’s largest state
based telephone survey system, funded and
technically guided by the Center for Disease
Control and Prevention (CDC). BRFSS
monitors modifiable behavioral health risk
factors, selected disease screening and
disease incidence and prevalence trends
among adults aged 18 and above.
With only 15 participating states in its early
inception in 1984, today, BRFSS has
expanded to all 50 US states, District of
Columbia, and territories such as Puerto Rico
and the Virgin Islands. The Oklahoma State
Department of Health joined the BRFSS in
March 1988.
Oklahoma uses BRFSS to monitor trends in
health risk behaviors and selected diseases
among our adult population in order to
assess the health of Oklahomans disease
risk factors, prevalence, screening practices,
or evaluate prevention programs or policies.
Oklahoma BRFSS data are available at:
http://www.health.ok.gov/ok2share/ or CDC
site at: http://apps.nccd.cdc.gov/brfss/index.
asp.
This report covers results of the 2005 survey
questions, some trend analysis that includes
data from as far back as 1988, and part of
the results from the 2004 survey questions.
As BRFSS surveyed optional modules in
alternate years, some clinical preventive
measures such as mammogram, PAP test,
colorectal and prostate cancer screening,
and dentist visit were not collected in 2005.
These risk factors are included for 2004 in
this report. Oklahoma estimates were
compared to the national statistics to assess
our progress in relation to the nation across
years.
BRFSS monitors
modifiable health risk
factors and trends
among adults aged 18
and above.
The Behavioral Risk
Factor Surveillance
System (BRFSS) is the
world’s largest
telephone survey system.

Oklahoma BRFSS 7
contents introduction methodology dem
ographics health status health care access health prevalence modifiable behaviors preventive services
Methodology Oklahoma BRFSS is a telephone survey
system conducted within the state with
support from CDC. The Oklahoma State
Department of Health (OSDH) has an in
house calling center that follows the CDC
BRFSS protocol. The methodology for
conducting the survey has been provided
by CDC and is the same across all states.
Further information can be found in the
BRFSS User’s Guide and related policies at
http://www.cdc.gov/brfss.
Survey Sample Oklahoma and most other participating
BRFSS states obtained their survey
samples from Marketing Systems Group
(MSG) using the Genesys sampling
software. This software selects the sample
based on a disproportionate stratified
sampling (DSS) design. A representative
sample of noninstitutionalized Oklahoma
adults aged 18 and above is randomly
selected within a household, which was
randomly selected by random digitdialing
(RDD) from all households with at least one
working telephone. These telephone
numbers do not include cell phone
numbers.
Prior to 2001, the sample was stratified
among six Oklahoma regions to ensure that
rural and metropolitan Oklahoma had an
equal chance of selecting any household
with a working telephone and any adults in
the selected household. Since 2001,
Oklahoma BRFSS increased its stratified
levels to twentysix regions in an attempt to
capture a more representative sample.
Survey Questionnaire The BRFSS survey questionnaire consisted
of three components: a standardized core
component that must be asked by every
state, the stateselected / optional modules,
and the state added questions which may
vary from state to state. Most of the core
questions in 2005 were the same as the
past many years. The CDC, with
recommendation from participating states,
developed and selected the core questions.
All new items were field tested prior to
being added into the questionnaire.
Readers can find a copy of the 2005
BRFSS questionnaire at the following link:
http://www.cdc.gov/brfss/
technical_infodata/surveydata.htm.
The BRFSS survey
questionnaire consisted of
three components: a
standardized core
component that must be
asked by every state, the
state-selected / optional
modules, and the state
added questions which
may vary from state to
state.

8 Oklahoma BRFSS
The optional modules were surveyed every
alternate year. States may choose from
several topics best relevant to their
consumer needs and demands. In 2005, the
Oklahoma optional modules included seven
areas: cardiovascular health, heart attack
and stroke, osteoporosis, arthritis
management, secondhand smoke policy,
sexual violence, and intimate partner
violence.
The state added questions will not be
included in this report. Further information
regarding these questions and results can be
obtained from the Oklahoma BRFSS, Health
Care Information, Oklahoma State
Department of Health @ 4052716225 or
Interviewing Protocol The Oklahoma BRFSS calling center
randomly contacts residents six days a week,
MondayFriday, and half a day on Saturday.
The center is equipped with computer
assisted telephone interviewing software
(CATI) to ask the survey questions in a
standardized manner. Continuous
monitoring is in place to ensure a high quality
data collection process.
The Genesys sample is sent monthly to the
calling center and prescreened for any
business or nonworking numbers prior to
being released for interviews. Each telephone
number released from the sample will be
contacted a maximum of 15 times on varying
days of the week and at different times of the
day within a month.
Residents who refuse the interview are
contacted for a second attempt by
experienced interviewers who are proficient at
converting refusals. At the end of the call, a
disposition code is assigned to the call, such
as ‘complete,’ ‘refusal after respondent
selection,’ ‘no answer,’ ‘busy.’ More
information is available in the BRFSS User’s
Guide.
Survey Population Adults aged 18 or older were included in the
survey population except for adults:
• in any institutions or dormitories;
• contacted in their second home during a
stay of less than 30 days;
• who do not speak and understand English
well enough;
• without a land line telephone.
Each year, CDC
compiled and weighted
the data prior to re-
distributing it to the
states for statistical
analysis.
The methodology for
conducting the survey
has been provided by
CDC and is the same
across all states.
Results in this report
have been adjusted
(weighted) to reflect the
Oklahoma population.
Oklahoma BRFSS 9
Data Analysis Data collected were uploaded electronically
to CDC monthly. Each year, CDC compiled
and weighted the data prior to redistributing
it to the states for statistical analysis. The
“weight” variable adjusts for the number of
adults, households with telephones, number
of telephone lines, cluster and stratum sizes,
and age / race and sex distribution of the
population based on census data. Further
information is available at: http://www.cdc.
gov/brfss/technical_infodata/weighting.htm.
All percentages presented in this report were
weighted to accurately represent the
Oklahoma adult population. Responses of
“Don’t know / Not sure” or “Refused” were
excluded from the calculation of the
percentages. Results from small sample
sizes, group size less than 5 and marginal
group size (denominator) less than 50 were
not reported. Notations commonly used in
this report are shown in the box.
Confidence Intervals A 95% confidence interval is included in the
tables. They appear in the table columns
labeled as CI. Confidence intervals inform
us that 95% of the time our estimates will
reflect the “true” population value.
Confidence intervals are directly associated
with sample sizes. Larger sample sizes
yield smaller confidence intervals, and the
estimates become more reliable.
A Cautionary Note Telephone surveys are currently more
challenging to carry out. There have been
telephone technological advances in recent
years. Various screening devices, such as
answering machines, call filtering
mechanisms, and the recent
cell phone use patterns have
become a challenge for our
land line phone calls to reach
the targeted households and
the person selected for the
call. This is especially true for
the younger population.
Since 1994, significantly more
Oklahoma elders aged 65+ were
successfully surveyed compared to our
younger adults. To enhance the validity of
the results of the survey, the sampling
scheme for Oklahoma has been changed
since 2001 in an attempt to obtain a more
representative sample.
A cautionary note for
the readers of this
report: The sampling
scheme for Oklahoma
has been changed since
2001 in an attempt to
obtain a more
representative sample.
Notations used in this report
• NH: Non-Hispanic • Caucasian: Caucasian NH • AfricanAm: African American NH • AmIndian: American Indian NH • Multicul: Multicultural NH • Hispc: Hispanic • DC: District of Columbia
contents introduction methodology dem
ographics health status health care access health prevalence modifiable behaviors preventive services

10 Oklahoma BRFSS
A random sample of 13,707 adult Oklahoma
respondents aged 18+ were surveyed in
2005. After the data were collected, a
“weight” was statistically applied to the raw
sample to reflect the numbers in the entire
population. Details of the weighting process
were outlined in the methodology section.
Gender The weighted distribution of adult male and
female respondents in 2005 was 48.7% and
51.3%, respectively (Figure 1).
Age
Oklahoma adults were asked “What is your
age?” in the survey. Nearly onethird of the
adult population were between ages 1834,
31.9%, 50.3% between 3564, and 17.9%
ages 65+. The proportion of women was
larger than men among elders aged 65+ as
shown in the population pyramid (see Figure
2). The proportion of men was higher than
women among adults ages 49 and below.
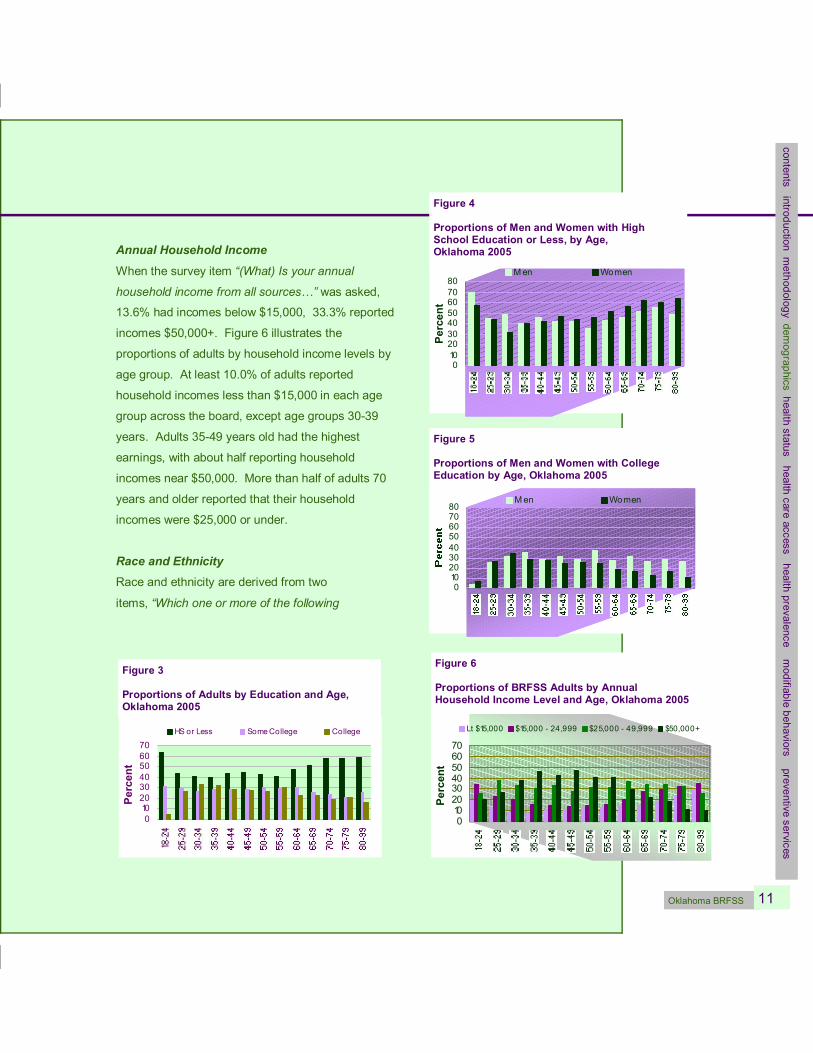
Education
When being asked “What is the highest grade
or year of school you completed?,” 23.9% of
Oklahoma adults had a college degree,
28.2% had some college education, 33.8%
had a high school (HS) diploma and 14.1% did
not graduate from high school.
Nearly half of respondents between ages 2560
years old and more than half ages 65+ of the
adults in each age group reported high school or
less education (Figure 3). Furthermore, adults
under 44 years old who reported the lowest
education were more likely to be young men
than women (Figure 4). On the other hand,
young women under 35 years were slightly more
likely to report college education compared to
men in the same cohort (Figure 5).
Demographics
Figure 2
BRFSS Respondents Population Pyramid, Oklahoma 2005
Percentage of Men and Women Aged 18+ in Oklahoma, 2005
Male 48.7%
Female 51.3%
Figure 1
Percent of Adult Males and Females, Oklahoma, 2005
Oklahoma BRFSS 11
Annual Household Income
When the survey item “(What) Is your annual
household income from all sources…” was asked,
13.6% had incomes below $15,000, 33.3% reported
incomes $50,000+. Figure 6 illustrates the
proportions of adults by household income levels by
age group. At least 10.0% of adults reported
household incomes less than $15,000 in each age
group across the board, except age groups 3039
years. Adults 3549 years old had the highest
earnings, with about half reporting household
incomes near $50,000. More than half of adults 70
years and older reported that their household
incomes were $25,000 or under.
Race and Ethnicity Race and ethnicity are derived from two
items, “Which one or more of the following
0 10 20 30 40 50 60 70
Percent
HS or Less Some College College
Figure 3
Proportions of Adults by Education and Age, Oklahoma 2005
contents introduction methodology dem
ographics health status health care access health prevalence modifiable behaviors preventive services
Figure 5
Proportions of Men and Women with College Education by Age, Oklahoma 2005
0 10 20 30 40 50 60 70 80
Men Women
0 10 20 30 40 50 60 70
Percent
Lt $15,000 $15,000 24,999 $25,000 49,999 $50,000+
Figure 6
Proportions of BRFSS Adults by Annual Household Income Level and Age, Oklahoma 2005
Figure 4
Proportions of Men and Women with High School Education or Less, by Age, Oklahoma 2005
0 10 20 30 40 50 60 70 80
Percent
Men Women

12 Oklahoma BRFSS
would you say is your race? Mark all that
apply.” and “Are you Hispanic or Latino?”
All respondents who reported they were of
Hispanic or Latino origin are coded as
Hispanic.
In 2005, the largest proportion of BRFSS
adults was Caucasian Non Hispanic (NH),
71.9%, followed by American Indian NH,
7.5%, and Hispanic, 7.6% (Figure 7).
The Multicultural NH group consisted of
respondents who identified themselves
with two or more races. Of the 5.3%
Multicultural NH group, about 94%
identified with American Indians as one of
their races. Compared to 2004, adults
who identified themselves as Multicultural
increased 47.2% from 3.6% to 5.3% in
2005.
The largest proportions of minority men
from 1839 years were Hispanics (Figure
8). Minority men above 45 years and
women 6569 years were more likely be
American Indian NH; Hispanic women were
highest among 1834 years (Figure 9).
Caucasian NH accounted
for 71.9% of respondents,
American Indian NH, 7.5%,
Hispanic, 7.6%, and
African American NH,
6.2% of the total BRFSS
adult population.
Figure 8
Proportions of Men in each Age Group by Minority Race / Ethnicity, Oklahoma 2005
0
5
10
15
20
25
Percen
t
AfricanAm AmIndian Hispanic
Figure 7 by Race / Ethnicity
Caucasian 71.9%
AmIndian 7.5%
Mult icul 5.3%
Other 1.5%
Hispanic 7.6%
AfricanAm 6.2%
Figure 7
BRFSS Respondents by Race / Ethnicity, Oklahoma, 2005
Proportions of Women by Minority Race / Ethnicity in each Age Group
0
5
10
15
20
25 Af ricanAm AmIndian Hispanic
Figure 9
Proportions of Women in each Age Group by Minority Race / Ethnicity, Oklahoma 2005

Oklahoma BRFSS 13
Marital Status
When respondents were asked “Are you:
Married, Divorced, Widowed, Separated,
Never married, or a member of an unmarried
couple,” nearly twothirds of the adult
population was “married,” and one in 11
Oklahoma adults was currently divorced
(Figure 10). The highest proportion of adults
who were never married was between ages
1824 years old, 64.1% (Figure 11). In
addition, about 64% of the “never been
married” adults were under ages 25, and
about 76.0% of the widows were age 65+.
Employment Status A survey item asked respondents their
current employment status, “Are you
currently: Employed for wages, Self
employed, Out of work, A homemaker, A
student, Retired, Unable to work?” Half of
the Oklahoma adults were employed for
wages, one in six retired, roughly one in 10
were selfemployed (Figure 12).
In addition, the majority of selfemployed
adults were older (ages 45+) than their
employed for wages counterparts. The “out
of work” and “unable to work” adults
constituted about 11.0% of the Oklahoma
adult population. Furthermore, Figure 13
illustrates that under each age group
between 4565, at least one in 10 adults
reported they were “unable to work,” while
roughly one in 20 were “out of work” within
this age range.
by Marital Status
Member of unmarried couple 2.9%
Married 63.9%
Divorced 9.1%
Never been married 14.8%
Widowed 7.3%
Separated 1.9%
Figure 10
BRFSS Respondents by Marital Status, Oklahoma, 2005
contents introduction methodology dem
ographics health status health care access health prevalence modifiable behaviors preventive services
Proportions of Adults Currently Married or Divorced in each Age Grp
0
20
40
60
80
100
Percent
Married Divorced Never been married Widowed
Figure 11
Proportions of BRFSS Adults by Marital Status and Age, Oklahoma 2005
The “out of work” and
“unable to work”
adults constituted
about 11.0% of the
Oklahoma adult
population.

14 Oklahoma BRFSS
Job Activity by Type Another item surveyed respondents’ job
activity type by asking “When you are at
work, which of the following best describes
what you do?” Sixty percent of adults had
jobs that required mostly sitting or
standing, 23.0% mostly walking, and
17.0% had heavy labor jobs that required
physically demanding work. While all age
groups had jobs with mostly sitting or
standing, young adults ages 1834 had the
highest proportion of heavy labor jobs
(Figure 14) compared to their older
counterparts.
4.3
4.4
6.2
16.2
8.6
50.6
9.6
0 10 20 30 40 50 60
Employed for wages
Self employed
Out o f work (0+yrs)
A homemaker
Ret ired
Unable to work
A student
P ercent
Figure 12
Proportions of BRFSS Adults by Employment Status, Oklahoma 2005
62.4 64.6
52.3
28.3 20.7 26.1 9.3 14.7 21.7
0
20
40
60
80
1834 3564 65+ A ge in Y e a rs
Percent
M ost ly sit t ing / stand ing M o st ly walking
M o st ly heavy labo r
Figure 14
BRFSS Adults by Job Types and Age, Oklahoma 2005
P ropo rt io ns o f Adults and the ir Age under Emplo yment fo r Wages and Selfemplo yed Status
0
5
10
15
20
Percent
Unable to work Out of work
Figure 13
Proportions of BRFSS Adults by Specific Employment Status and Age, Oklahoma 2005
Oklahoma BRFSS 15
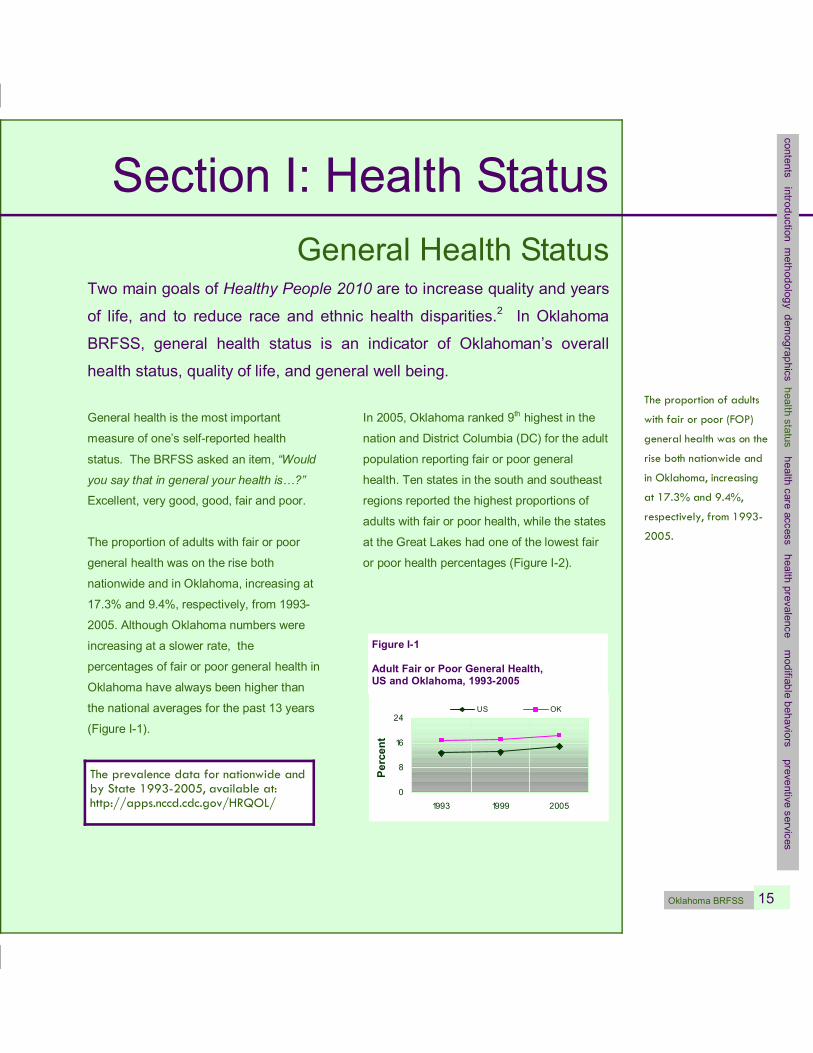
Section I: Health Status General Health Status
Two main goals of Healthy People 2010 are to increase quality and years
of life, and to reduce race and ethnic health disparities. 2 In Oklahoma
BRFSS, general health status is an indicator of Oklahoman’s overall
health status, quality of life, and general well being.
General health is the most important
measure of one’s selfreported health
status. The BRFSS asked an item, “Would
you say that in general your health is…?”
Excellent, very good, good, fair and poor.
The proportion of adults with fair or poor
general health was on the rise both
nationwide and in Oklahoma, increasing at
17.3% and 9.4%, respectively, from 1993
2005. Although Oklahoma numbers were
increasing at a slower rate, the
percentages of fair or poor general health in
Oklahoma have always been higher than
the national averages for the past 13 years
(Figure I1).
In 2005, Oklahoma ranked 9 th highest in the
nation and District Columbia (DC) for the adult
population reporting fair or poor general
health. Ten states in the south and southeast
regions reported the highest proportions of
adults with fair or poor health, while the states
at the Great Lakes had one of the lowest fair
or poor health percentages (Figure I2).
0
8
16
24
1993 1999 2005
Percent
US OK
Figure I1
Adult Fair or Poor General Health, US and Oklahoma, 19932005
The prevalence data for nationwide and by State 1993-2005, available at: http://apps.nccd.cdc.gov/HRQOL/
The proportion of adults
with fair or poor (FOP)
general health was on the
rise both nationwide and
in Oklahoma, increasing
at 17.3% and 9.4%,
respectively, from 1993-
2005.
contents introduction methodology dem
ographics health status health care access health prevalence m
odifiable behaviors preventive services

16 Oklahoma BRFSS
In 2005, eight out of 10 Oklahoma adults
reported “Excellent, Very Good, or Good”
general health and nearly 500,000 adults,
or 19.0%, reported fair or poor general
health (Table I1). The estimated age
adjusted rate for fair or poor health was
19.3% in 2005 as compared to 18.3% in
2003.
General Health, Gender and Age In 2005, one out of every 3 elderly
Oklahomans age 70+ reported fair or poor
health compared to one out of every 10
young adults ages 1839 years. Oklahoma
women under 50 years were more likely to
report fair or poor health than men, but as
age increased, men reported fair or poor
health more than women (Figure I3).
Consistent with the national trend, older
adults were more likely to report fair or poor
health than younger adults (Figure I3).
General Health, Education and Household Income
According to US Census Bureau, in 2003,
Oklahoma was among the nation’s ten worst
states in poverty. According to the United
Nations, education, poverty and health
conditions are highly associated. 3 Adults with
the lowest education and household incomes
were significantly more likely to report fair or
poor health across all age groups compared to
adults with the highest education and incomes
(Figure I4 and I5), especially those 40 years
and above.
Figure I2
Adults Reporting Fair or Poor General Health, by State, US 2005
One out of every 3
elderly Oklahomans
age 70+ reported Fair
or Poor health
compared to one out of
every 10 young adults
ages 18-39 years.
Adults who were
divorced were nearly
70% more likely to
report FOP health than
married individuals,
26.6% vs. 15.7%,
respectively.
Table I1
Oklahoma BRFSS 17
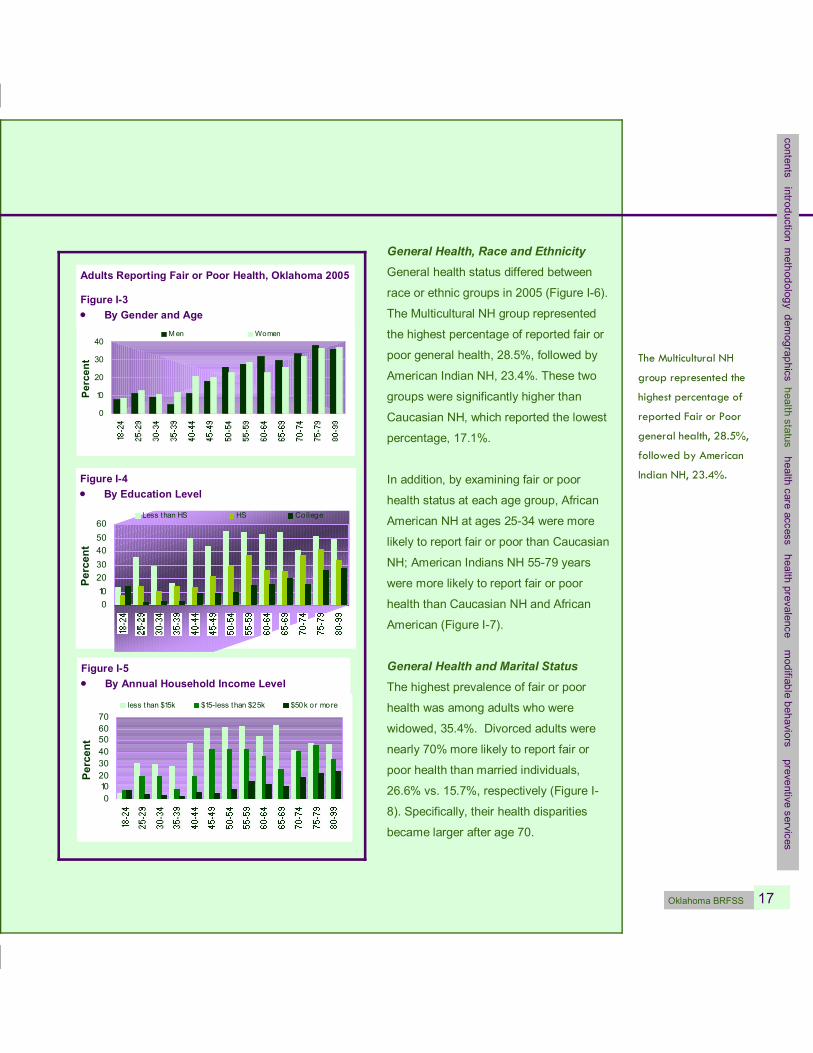
General Health, Race and Ethnicity General health status differed between
race or ethnic groups in 2005 (Figure I6).
The Multicultural NH group represented
the highest percentage of reported fair or
poor general health, 28.5%, followed by
American Indian NH, 23.4%. These two
groups were significantly higher than
Caucasian NH, which reported the lowest
percentage, 17.1%.
In addition, by examining fair or poor
health status at each age group, African
American NH at ages 2534 were more
likely to report fair or poor than Caucasian
NH; American Indians NH 5579 years
were more likely to report fair or poor
health than Caucasian NH and African
American (Figure I7).
General Health and Marital Status The highest prevalence of fair or poor
health was among adults who were
widowed, 35.4%. Divorced adults were
nearly 70% more likely to report fair or
poor health than married individuals,
26.6% vs. 15.7%, respectively (Figure I
8). Specifically, their health disparities
became larger after age 70.
The Multicultural NH
group represented the
highest percentage of
reported Fair or Poor
general health, 28.5%,
followed by American
Indian NH, 23.4%.
contents introduction methodology dem
ographics health status health care access health prevalence m
odifiable behaviors preventive services
0 10 20 30 40 50 60
Percent
Less than HS HS College
Figure I4 • By Education Level
Adults Reporting Fair or Poor Health, Oklahoma 2005
Figure I3 • By Gender and Age
0
10
20
30
40
Percen
t
Men Women
0 10 20 30 40 50 60 70
Percent
less than $15k $15less than $25k $50k or more
Figure I5 • By Annual Household Income Level
18 Oklahoma BRFSS
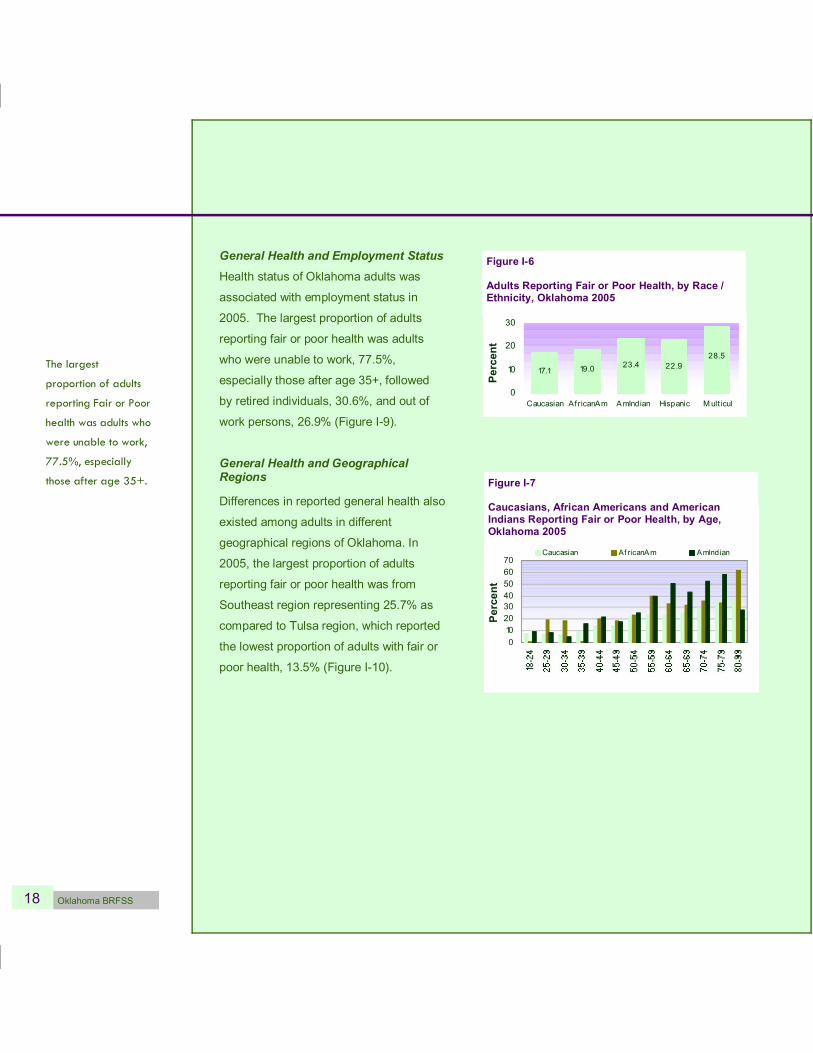
General Health and Employment Status Health status of Oklahoma adults was
associated with employment status in
2005. The largest proportion of adults
reporting fair or poor health was adults
who were unable to work, 77.5%,
especially those after age 35+, followed
by retired individuals, 30.6%, and out of
work persons, 26.9% (Figure I9).
General Health and Geographical Regions
Differences in reported general health also
existed among adults in different
geographical regions of Oklahoma. In
2005, the largest proportion of adults
reporting fair or poor health was from
Southeast region representing 25.7% as
compared to Tulsa region, which reported
the lowest proportion of adults with fair or
poor health, 13.5% (Figure I10).
The largest
proportion of adults
reporting Fair or Poor
health was adults who
were unable to work,
77.5%, especially
those after age 35+.
Caucsn NH, Afrcn Am NH and Am Indn Reporting FOP Health in each Age GRP
0 10 20 30 40 50 60 70
Percent
Caucasian Af ricanAm AmIndian
Figure I7
Caucasians, African Americans and American Indians Reporting Fair or Poor Health, by Age, Oklahoma 2005
Figure I6
Adults Reporting Fair or Poor Health, by Race / Ethnicity, Oklahoma 2005
17.1 19.0 28.5
22.9 23.4
0
10
20
30
Caucasian Af ricanAm AmIndian Hispanic Multicul
Percent

Oklahoma BRFSS 19
Figure I10
Adults Reporting Fair or Poor Health, by Region, Oklahoma 2005
One in four residents in
the Southeast region
reported Fair or Poor
general health as
compared to one in
seven in the Tulsa
region.
contents introduction methodology dem
ographics health status health care access health prevalence m
odifiable behaviors preventive services
77.5
30.6
7.9
11.5
3.1
17.7
26.9
0 10 20 30 40 50 60 70 80
Employed for wages
Self employed
Out of work (0+yrs)
A homemaker
A student
Ret ired
Unable to work
P ercent
Figure I9 • By Employment Status
Status, OK 2005
26.2
35.4
26.6
10.7
13.4
15.7
0 10 20 30 40
Member of unmarr ied couple
Never been marr ied
Separat ed
Widowed
Divorced
Marr ied
P ercent
Adults Reporting Fair or Poor Health, Oklahoma 2005
Figure I8 • By Marital Status

20 Oklahoma BRFSS
Healthy Days
There were two additional items that
explore Oklahoman’s physical and mental
state of health. In 2005, Oklahoma adults
were asked “How many days your physical
health (which includes physical illness and
injury) was not good in the past 30 days.”
Sixtyfive percent reported no unhealthy
days, 35.1% reported at least one
unhealthy day (Figure I11).
When being asked “how many days your
mental health (which includes stress,
depression, and problems with emotions)
was not good in the past month,” in 2005,
nearly 70% of Oklahoma adults reported no
unhealthy days, 31.4% reported at least
one unhealthy day (Figure I11).
Healthy Days and Gender This section will focus on the profiles of the
adults reporting at least one physical or
mental unhealthy day. In 2005, no health
disparities existed by gender in the “at least
one unhealthy day” population, although
women under age 50 reported slightly
higher average mental unhealthy days than
men (Figure I12).
Healthy Days and Age Adults 35+ were significantly more likely to
report higher averages of physical unhealthy
days than younger adults (Figure 113). Only
elders ages 65+ were significantly more likely
to report higher average mental unhealthy
days than the youngest adults. It should also
be noted that the youngest adults reported
higher mental than physical unhealthy days.
Elders had substantially more physical
unhealthy days than mental.
64.9 68.6
23.5 20.2
11.6 11.2
0.0%
20.0%
40.0%
60.0%
80.0%
100.0%
Physical Mental
None 1 14dys GE 15dys
Figure I11
Adult Physical or Mental Unhealthy Days, Oklahoma 2005
0 5 10 15 20 25
male female
0 5 10 15 20 25
male female
• Mental Unhealthy Days
Figure I12
Men and Women Average Physical and Mental Unhealthy Days (1+ days) in the Past Month, by Age, Oklahoma 2005
• Physical Unhealthy Days

Oklahoma BRFSS 21
Healthy Days, Race and Ethnicity In order to obtain sufficient sample sizes to
compare among race and ethnicity, data from
the past three years were combined for the
following analysis. Among the unhealthy
population in 20032005, multicultural adults
reported nearly half a month in which their
physical or mental health was not good while
Caucasian NH, African American NH and
Hispanic reported only onethird of a month
(see Figure I14).
Healthy Days and Marital Status Examining the unhealthy population by marital
status, the highest average physical and
mental unhealthy days were reported by
widows, 15+ days, followed by
divorced individuals, 14 days (Figure
I15). Separated, members of
unmarried couple and never been
married adults had higher average
mental unhealthy days than physical.
Healthy Days and Employment Status
Adults who were unable to work or
retired reported more physical than
mental unhealthy days. Students,
unemployed individuals, self
employed and employed for wages adults
7.8 12.1
17.2
10.9 12.1 13.5
0
5
10
15
20
1834 3564 65+
Average
Days
Physical M ental
Figure I13
Adult Average Physical and Mental Unhealthy Days (1+ Days) in the Past Month, by Age, Oklahoma 2005
Multicultural adults
reported nearly half a
month in which their
physical or mental health
was not good while
Caucasian NH, African
American NH and
Hispanics reported only
one-third of a month.
contents introduction methodology dem
ographics health status health care access health prevalence m
odifiable behaviors preventive services
Adult Physical Health Not Good (1+ Days) In Past 30 Days, OK 20032005
11.9 11.1 14.3
11.5 11.7
0
5
10
15
Caucasian AfricanAm AmIndian Hispanic Mult icul
Average Days
• Mental Health Not Good
Figure I14
Adult Average Physical and Mental Unhealthy Days (1+ Days) In the Past Month by Race / Ethnicity, Oklahoma 20032005
• Physical Health Not Good
12.4 10.7 13.5
11.6 11.4
0
5
10
15
Caucasian AfricanAm AmIndian Hispanic Mult icul
Average
Days
0 5 10 15 20
M ember of unmarried couple
Never been married
Separated
Widowed
Divorced
M arried
Average Days
Physical M ental
Figure I15
Adult Physical and Mental Unhealthy Days (1+ Days) In Past Month, by Marital Status, Oklahoma 20032005
22 Oklahoma BRFSS
0 10 20 30
Employed for wages
Selfemployed
Out of work (0+yrs)
A homemaker
A student
Retired
Unable to work
Average D ays
Physical Mental
Figure I16
Adult Physical and Mental Health Unhealthy Days by Employment Status, Oklahoma 20032005 reported higher average mental than
physical unhealthy days (Figure I16).
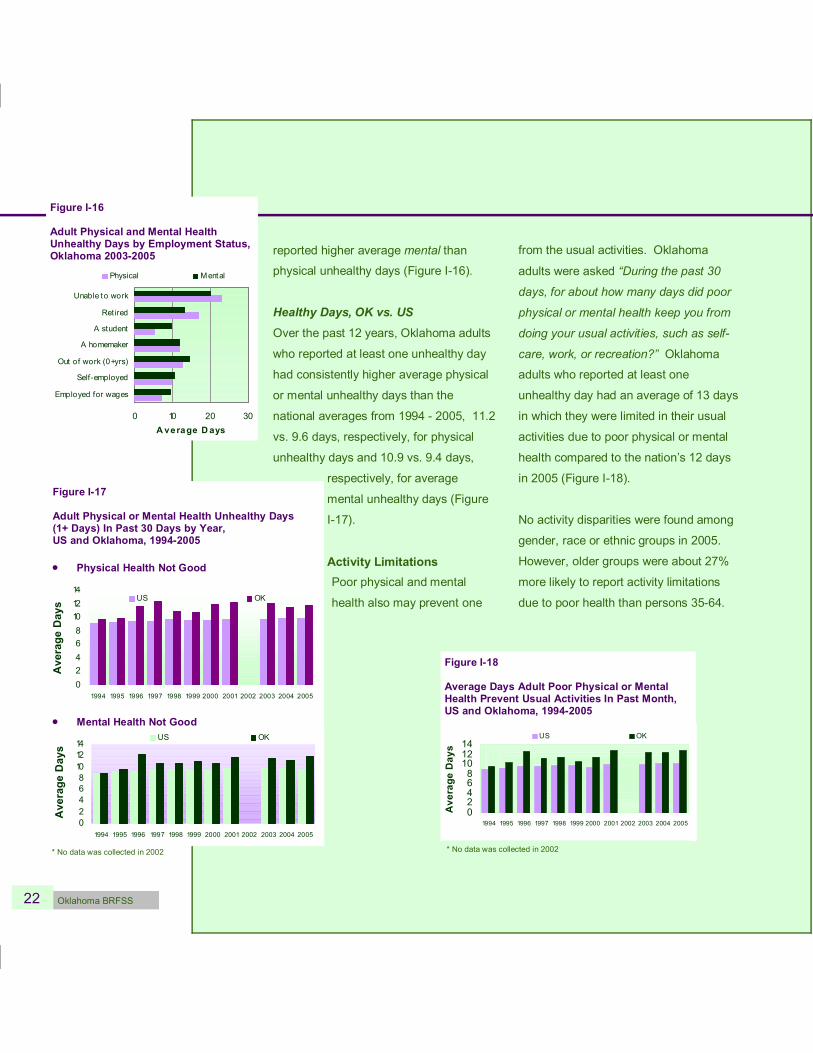
Healthy Days, OK vs. US Over the past 12 years, Oklahoma adults
who reported at least one unhealthy day
had consistently higher average physical
or mental unhealthy days than the
national averages from 1994 2005, 11.2
vs. 9.6 days, respectively, for physical
unhealthy days and 10.9 vs. 9.4 days,
respectively, for average
mental unhealthy days (Figure
I17).
Activity Limitations Poor physical and mental
health also may prevent one
from the usual activities. Oklahoma
adults were asked “During the past 30
days, for about how many days did poor
physical or mental health keep you from
doing your usual activities, such as self
care, work, or recreation?” Oklahoma
adults who reported at least one
unhealthy day had an average of 13 days
in which they were limited in their usual
activities due to poor physical or mental
health compared to the nation’s 12 days
in 2005 (Figure I18).
No activity disparities were found among
gender, race or ethnic groups in 2005.
However, older groups were about 27%
more likely to report activity limitations
due to poor health than persons 3564.
US 1993 2005
0 2 4 6 8 10 12 14
1994 1995 1996 1997 1998 1999 2000 2001 2002 2003 2004 2005
Average
Days
US OK
Figure I18
Average Days Adult Poor Physical or Mental Health Prevent Usual Activities In Past Month, US and Oklahoma, 19942005
* No data was collected in 2002
Past Month, Oklahoma and US
0 2 4 6 8 10 12 14
1994 1995 1996 1997 1998 1999 2000 2001 2002 2003 2004 2005
Average
Days
US OK
• Mental Health Not Good
0 2 4 6 8 10 12 14
1994 1995 1996 1997 1998 1999 2000 2001 2002 2003 2004 2005
Average
Days US OK
Figure I17
Adult Physical or Mental Health Unhealthy Days (1+ Days) In Past 30 Days by Year, US and Oklahoma, 19942005
• Physical Health Not Good
* No data was collected in 2002

Oklahoma BRFSS 23
Section II: Health Care Access Health Insurance Coverage
Regular access to quality health care is crucial to ensure an overall good
health and early detection and control of potentially serious health problems.
Regular ongoing health care access requires adequate health insurance
coverage. Residents without sufficient health insurance coverage face
increased risks of morbidity and mortality from chronic diseases. Approximately 15%-
20% of Oklahoma adults
reported no health
insurance coverage each
year, a rate about 30%-
40% higher than the
national median.
The BRFSS explores health care access
issues by surveying one of the key
indicators health insurance coverage.
Oklahoma respondents were asked, “Do
you have any kind of health care coverage,
including health insurance, prepaid plans
such as HMOs, or government plans such
as Medicare?” Overall, we have made little
progress in promoting health insurance
coverage to the public in the past 15 years.
Approximately 15%20% of Oklahoma
adults reported no health insurance
coverage each year from 19912005, a rate
about 30%40% higher than the national
median (Figure II1).
Oklahoma ranked 7 th highest in the nation
and DC for the population reporting no
health insurance coverage. An estimated
545,000 Oklahoma adults (or one in every
five) reported no health insurance coverage
in 2005, as compared to nearly one in seven
for the nation.
Health Insurance and Gender In 2005, 21.6% of men aged 18+ reported no
health insurance plan, compared to 19.8% of
women. The rate of health insurance among
men and women during the past 15 years were
similar.
0
5
10
15
20
25
1991 1992 1993 1994 1995 1996 1997 1998 1999 2000 2001 2002 2003 2004 2005
Percent
US OK
Figure II1
Adults Reporting No Health Insurance Coverage, US and Oklahoma, 19912005
contents introduction methodology dem
ographics health status health care access
health prevalence modifiable behaviors preventive services
24 Oklahoma BRFSS
Figure II3
Adults with No Insurance Coverage by Education and Annual Household income Level, Oklahoma 2005
41.2
33.5
18.4
5.9
5.0
39.1
24.2
17.9
8.4
0 10 20 30 40 50
Less than $15,000
$15,000 24,999
$25,000 49,999
$50,000 74,999
$75,000+
Less than H.S.
High school
Some college
College
Percent
each age gro up
0
10 20 30 40 50
Percen
t
Figure II2
Adults Aged 1864 Reporting No Health Insurance Coverage by Age, Oklahoma 2005
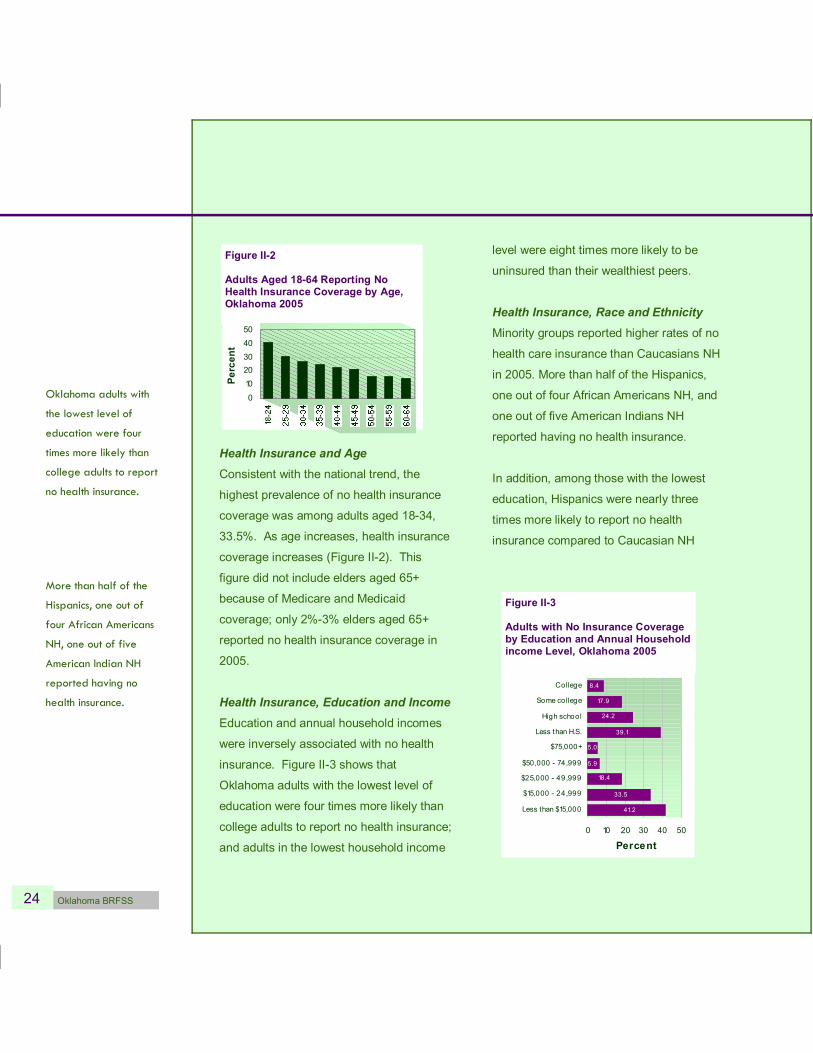
Oklahoma adults with
the lowest level of
education were four
times more likely than
college adults to report
no health insurance.
Health Insurance and Age Consistent with the national trend, the
highest prevalence of no health insurance
coverage was among adults aged 1834,
33.5%. As age increases, health insurance
coverage increases (Figure II2). This
figure did not include elders aged 65+
because of Medicare and Medicaid
coverage; only 2%3% elders aged 65+
reported no health insurance coverage in
2005.
Health Insurance, Education and Income Education and annual household incomes
were inversely associated with no health
insurance. Figure II3 shows that
Oklahoma adults with the lowest level of
education were four times more likely than
college adults to report no health insurance;
and adults in the lowest household income
level were eight times more likely to be
uninsured than their wealthiest peers.
Health Insurance, Race and Ethnicity Minority groups reported higher rates of no
health care insurance than Caucasians NH
in 2005. More than half of the Hispanics,
one out of four African Americans NH, and
one out of five American Indians NH
reported having no health insurance.
In addition, among those with the lowest
education, Hispanics were nearly three
times more likely to report no health
insurance compared to Caucasian NH
More than half of the
Hispanics, one out of
four African Americans
NH, one out of five
American Indian NH
reported having no
health insurance.
Oklahoma BRFSS 25
27.9 21.6 42.8
30.2
70.0
48.1
0
20
40
60
80
Less than H.S. High schoo l
Percent
Caucasian Af ricanAm Hispanic
Figure II4
Caucasians, African Americans and Hispanics with High School or Less Education Levels Reporting No Health Insurance, Oklahoma 2005
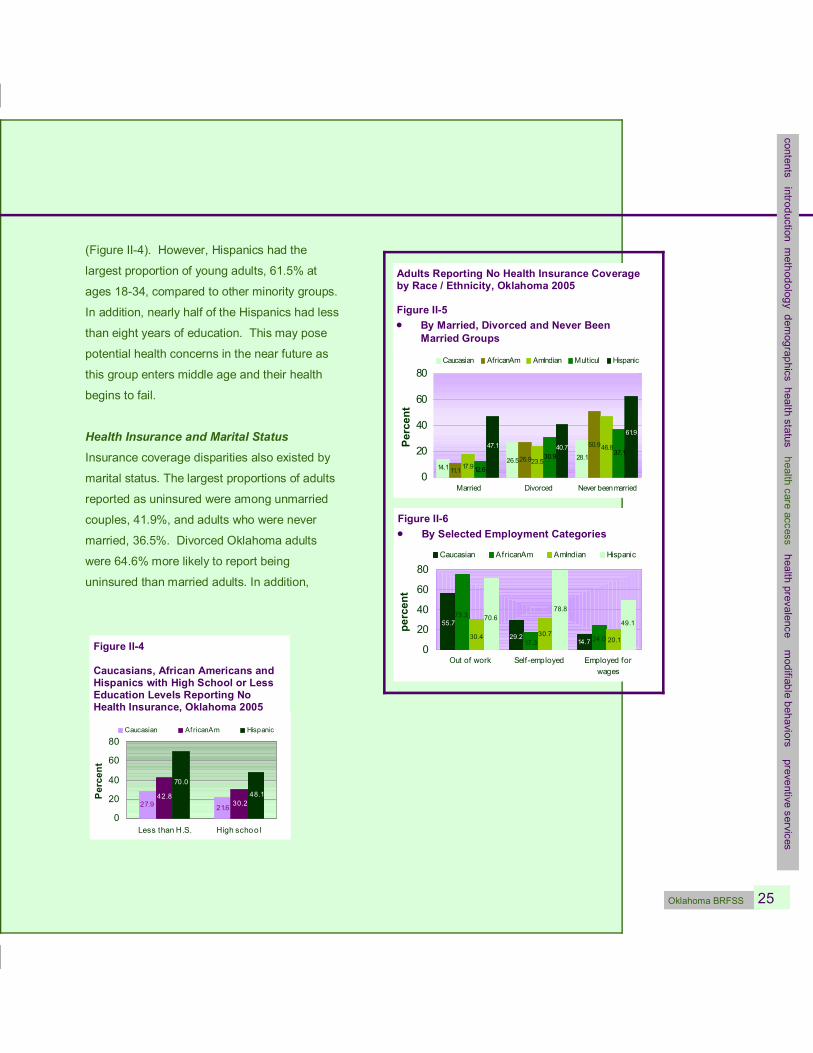
(Figure II4). However, Hispanics had the
largest proportion of young adults, 61.5% at
ages 1834, compared to other minority groups.
In addition, nearly half of the Hispanics had less
than eight years of education. This may pose
potential health concerns in the near future as
this group enters middle age and their health
begins to fail.
Health Insurance and Marital Status Insurance coverage disparities also existed by
marital status. The largest proportions of adults
reported as uninsured were among unmarried
couples, 41.9%, and adults who were never
married, 36.5%. Divorced Oklahoma adults
were 64.6% more likely to report being
uninsured than married adults. In addition,
14.7 29.2
55.7
24.0 17.3
75.3
20.1 30.7 30.4
49.1
78.8 70.6
0
20
40
60
80
Out of work Selfemployed Employed for wages
percent
Caucasian AfricanAm AmIndian Hispanic
Figure II6 • By Selected Employment Categories
28.1 26.5 14.1
26.9
50.9
11.1
46.8
23.5 17.9
37.1 30.9
12.6
40.7
61.9
47.1
0
20
40
60
80
Married Divorced Never been married
Percent
Caucasian AfricanAm AmIndian Multicul Hispanic
Adults Reporting No Health Insurance Coverage by Race / Ethnicity, Oklahoma 2005
Figure II5 • By Married, Divorced and Never Been
Married Groups
contents introduction methodology dem
ographics health status health care access
health prevalence modifiable behaviors preventive services
26 Oklahoma BRFSS
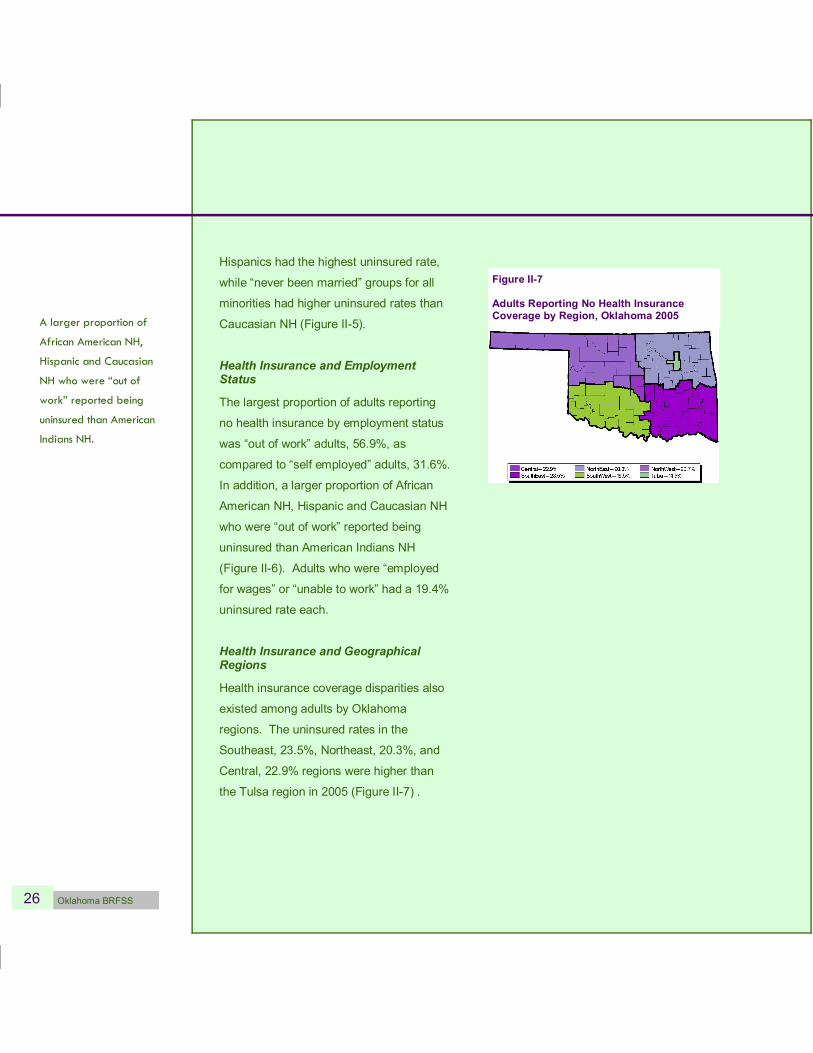
Figure II7
Adults Reporting No Health Insurance Coverage by Region, Oklahoma 2005 A larger proportion of
African American NH,
Hispanic and Caucasian
NH who were “out of
work” reported being
uninsured than American
Indians NH.
Hispanics had the highest uninsured rate,
while “never been married” groups for all
minorities had higher uninsured rates than
Caucasian NH (Figure II5).
Health Insurance and Employment Status
The largest proportion of adults reporting
no health insurance by employment status
was “out of work” adults, 56.9%, as
compared to “self employed” adults, 31.6%.
In addition, a larger proportion of African
American NH, Hispanic and Caucasian NH
who were “out of work” reported being
uninsured than American Indians NH
(Figure II6). Adults who were “employed
for wages” or “unable to work” had a 19.4%
uninsured rate each.
Health Insurance and Geographical Regions
Health insurance coverage disparities also
existed among adults by Oklahoma
regions. The uninsured rates in the
Southeast, 23.5%, Northeast, 20.3%, and
Central, 22.9% regions were higher than
the Tulsa region in 2005 (Figure II7) .

Oklahoma BRFSS 27
Health Care Barrier Due to Cost
The BRFSS respondents were asked “Was
there a time in the past 12 months when you
needed to see a doctor but could not
because of cost?” Oklahoma ranked 5 th
highest in the nation and DC in 2005 for the
population reportedly needing a doctor but
the cost was too high. Nearly 18% of
Oklahoma adults who needed a doctor
reported the cost was too high for them to
visit one.
For the past 15 years on average, Oklahoma
had a higher proportion of adults reporting
health care barriers due to cost than the
nation, and the rate was higher in 2005 vs.
1998 (Figure II8). However, the rate of
increase in Oklahoma was much slower than
the nation from 19912005, 7.3% vs. 22.0%,
respectively.
Cost Barrier, Gender and Age As the sample size for a single year was too
small to yield any meaningful results,
data were combined in three years for
analysis. In 20032005, female adults were
significantly more likely to report medical cost
barriers than male adults, 20.7% vs. 14.3%,
respectively. Younger adults aged 1834
Nearly 18% of Oklahoma
adults who needed a
doctor reported the cost
was too high for them to
visit one.
In 2003-2005, female
adults were more likely to
report medical cost
barriers than male adults.
contents introduction methodology dem
ographics health status health care access
health prevalence modifiable behaviors preventive services
Oklahoma and US
13.3 9.1 10.9
17.6 12.2
16.4
0
5
10
15
20
1991 1998 2005
Percent
US OK
Adults Needing a Doctor Last Year but Cost was too High
Figure II8 • US and Oklahoma, 1991 2005
5.7 18 .6
22 .7 20 .7 14 .3
0
10
20
30
Male Female 1834 3564 65+
Percen
t
Figure II9 • By Gender and Age,
Oklahoma 2003 2005
16.0 21.6 18.8 21.1
25.9
0
10
20
30
Caucasian AfricanAm AmIndian Hispanic Multicul
Percen
t
Figure II10 • By Race / Ethnicity,
Oklahoma 2003 2005
28 Oklahoma BRFSS
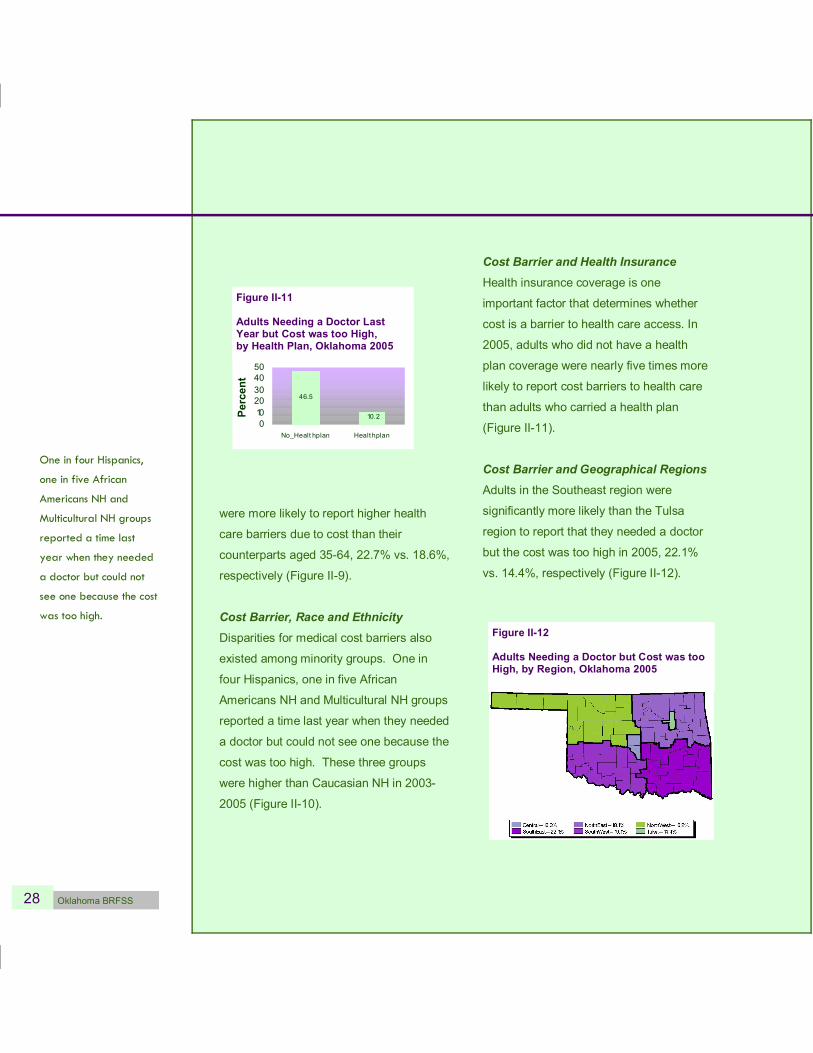
Adult Needing a Doctor but Cost was too High OK 2005
46.5
10.2 0 10 20 30 40 50
No_Healt hplan Healt hplan
Percent
Figure II11
Adults Needing a Doctor Last Year but Cost was too High, by Health Plan, Oklahoma 2005
were more likely to report higher health
care barriers due to cost than their
counterparts aged 3564, 22.7% vs. 18.6%,
respectively (Figure II9).
Cost Barrier, Race and Ethnicity Disparities for medical cost barriers also
existed among minority groups. One in
four Hispanics, one in five African
Americans NH and Multicultural NH groups
reported a time last year when they needed
a doctor but could not see one because the
cost was too high. These three groups
were higher than Caucasian NH in 2003
2005 (Figure II10).
Cost Barrier and Health Insurance Health insurance coverage is one
important factor that determines whether
cost is a barrier to health care access. In
2005, adults who did not have a health
plan coverage were nearly five times more
likely to report cost barriers to health care
than adults who carried a health plan
(Figure II11).
Cost Barrier and Geographical Regions Adults in the Southeast region were
significantly more likely than the Tulsa
region to report that they needed a doctor
but the cost was too high in 2005, 22.1%
vs. 14.4%, respectively (Figure II12).
Figure II12
Adults Needing a Doctor but Cost was too High, by Region, Oklahoma 2005
One in four Hispanics,
one in five African
Americans NH and
Multicultural NH groups
reported a time last
year when they needed
a doctor but could not
see one because the cost
was too high.

Oklahoma BRFSS 29
In 2005, when Oklahoma adults were
asked if they had one person whom they
considered as their personal doctor or
health care provider, 22.2% of Oklahoma
adults reported no personal health care
provider, 8.4% had more than one, and
69.4% had one.
Personal doctor / Primary care provider, Gender and Age
Men were nearly 60% higher than
women to have no primary care provider
(Figure II13). One in three young adults
aged 1834 did not have a personal
doctor or health care provider, compared
to one in 15 elders aged 65+ years.
Personal doctor / Primary care provider, Race and Ethnicity
More than half of Hispanics and one in
four Multicultural NH adults did not have
a personal doctor (Figure II14). These
rates were significantly higher than
Caucasian NH. African American NH
was nearly significantly higher than
Caucasian NH.
Personal Doctor or Primary Care Provider
More than half of
Hispanics and one in
four Multicultural NH
adults did not have a
personal doctor. These
rates were significantly
higher than Caucasian
NH.
18.1 27.2 22.7 26.5
53 .4
0 10 20 30 40 50 60
Caucasian A fricanAm AmInd ian Hispanic M ulticul
Percent
Figure II14 • By Race / Ethnicity
OK 2005
27.5 17.2
35.8 19.2
6.7 0 10 20 30 40 50 60
Male Female 1834 3564 65+
Percent
Adults with No Personal Doctor, Oklahoma 2005
Figure II13 • By Gender and Age
contents introduction methodology dem
ographics health status health care access
health prevalence modifiable behaviors preventive services
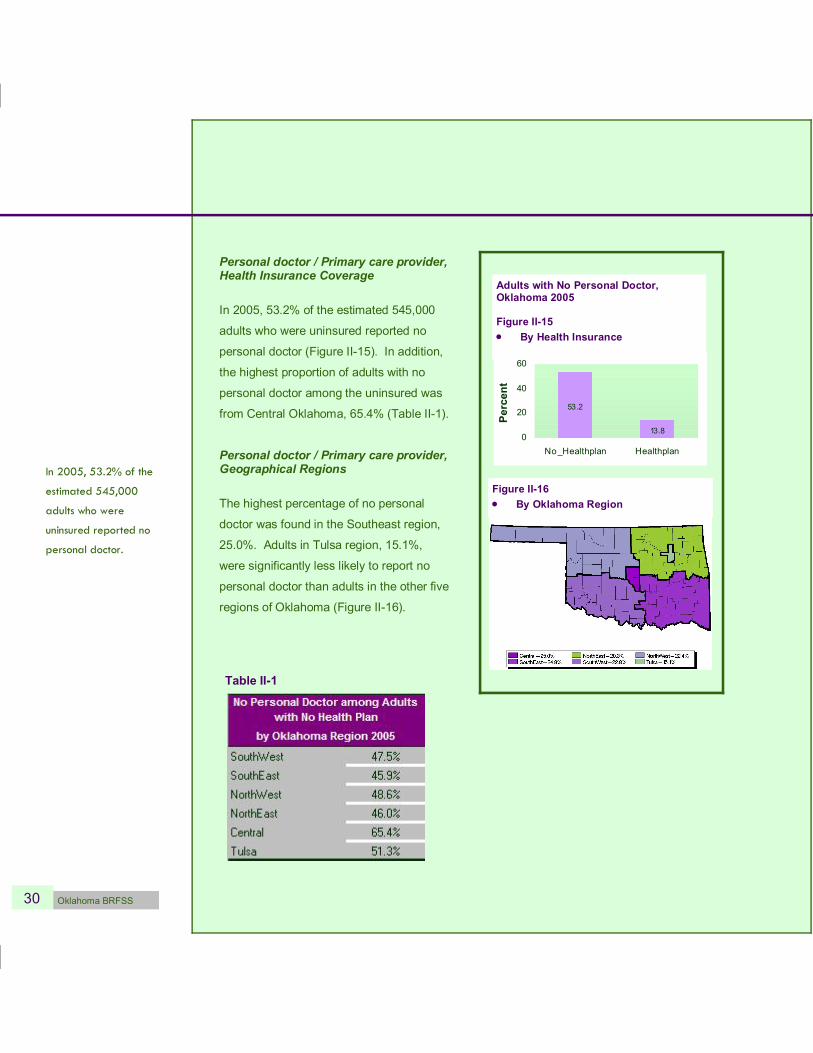
30 Oklahoma BRFSS
Figure II16 • By Oklahoma Region
Personal doctor / Primary care provider, Health Insurance Coverage
In 2005, 53.2% of the estimated 545,000
adults who were uninsured reported no
personal doctor (Figure II15). In addition,
the highest proportion of adults with no
personal doctor among the uninsured was
from Central Oklahoma, 65.4% (Table II1).
Personal doctor / Primary care provider, Geographical Regions
The highest percentage of no personal
doctor was found in the Southeast region,
25.0%. Adults in Tulsa region, 15.1%,
were significantly less likely to report no
personal doctor than adults in the other five
regions of Oklahoma (Figure II16).
Table II1
13.8
53.2
0
20
40
60
No_Healthplan Healthplan
Percent
Adults with No Personal Doctor, Oklahoma 2005
Figure II15 • By Health Insurance
In 2005, 53.2% of the
estimated 545,000
adults who were
uninsured reported no
personal doctor.


