Cumulative and career-stage citation impact of social-personality psychology programs and their members Brian A. Nosek Jesse Graham Nicole M. Lindner Selin Kesebir Carlee Beth Hawkins Cheryl Hahn Kathleen Schmidt Matt Motyl Jennifer Joy-Gaba Rebecca Frazier Elizabeth R. Tenney University of Virginia Word count = 9,475 Authors’ note: Supplementary materials are available at http://briannosek.com/papers/citations/ . Corresponding author: Brian Nosek, [email protected]; Department of Psychology, University of Virginia, Charlottesville, VA 22904-4400. Abstract Number of citations and the h-index (Hirsch, 2005) are popular metrics for indexing scientific impact. These, and other existing metrics, are strongly related to scientists’ seniority. We introduce complementary indicators that are unrelated to the number of years since PhD. To illustrate cumulative and career-stage approaches for assessing the scientific impact across a discipline, we amassed and analyzed citations for 611 scientists from 97 U.S. and Canadian social psychology programs. Results provide benchmarks for evaluating impact across the career span in psychology, and other disciplines with similar citation patterns. Career-stage indicators provide a very different perspective on individual and program impact than cumulative impact, and may predict emerging scientists and programs. Comparing social groups, Whites and men had higher impact than non-Whites and women respectively. However, average differences in career stage accounted for most of the difference for both groups. Keywords = citations, scientific impact, h-index, scientific awards, gender differences
Transcript
Cumulative and career-stage citation impact of social-personality psychology programs and their members
Brian A. Nosek Jesse Graham
Nicole M. Lindner Selin Kesebir
Carlee Beth Hawkins Cheryl Hahn
Kathleen Schmidt Matt Motyl
Jennifer Joy-Gaba Rebecca Frazier
Elizabeth R. Tenney
University of Virginia
Word count = 9,475 Authors’ note: Supplementary materials are available at http://briannosek.com/papers/citations/. Corresponding author: Brian Nosek, [email protected]; Department of Psychology, University of Virginia, Charlottesville, VA 22904-4400.
Abstract
Number of citations and the h-index (Hirsch, 2005) are popular metrics for indexing scientific impact. These, and other existing metrics, are strongly related to scientists’ seniority. We introduce complementary indicators that are unrelated to the number of years since PhD. To illustrate cumulative and career-stage approaches for assessing the scientific impact across a discipline, we amassed and analyzed citations for 611 scientists from 97 U.S. and Canadian social psychology programs. Results provide benchmarks for evaluating impact across the career span in psychology, and other disciplines with similar citation patterns. Career-stage indicators provide a very different perspective on individual and program impact than cumulative impact, and may predict emerging scientists and programs. Comparing social groups, Whites and men had higher impact than non-Whites and women respectively. However, average differences in career stage accounted for most of the difference for both groups. Keywords = citations, scientific impact, h-index, scientific awards, gender differences
There are a variety of indicators of scientific impact – the influence of scientific works on the accumulation of knowledge – such as number of works published, prestige of the outlets in which they were published, and number of times the works have been cited. Metrics of scientific impact serve evaluative and benchmarking purposes for professional societies to administer awards, departments to review faculty for promotion, and the scientific community to gauge the contributions of articles, scientists, or programs.
The purpose of this article is to advance methods and evidence for obtaining objective impact indices for individuals and institutions, using recent advances in Internet citation databases and search technology. The resulting methods and metrics are applied to a large cross-section of active faculty in social-personality psychology. Documenting citation trends provides an opportunity to (a) establish benchmarks for citation impact by career stage, (b) add to metrics for comparing programs as complements (or alternatives) to reputation ratings (e.g., U.S. News and World Report), and (c) identify high-impact articles, scientists and programs.
Citation counts as a measure of scientific impact
The use of citation counts as a measure of scientific impact is well-established (e.g., Ball, 2007; Bornmann, et al., 2008; Endler, et al., 1978; Garfield, 1975; Garfield & Welljams-Dorof, 1992; Gordon & Vicari, 1992; Hirsch, 2005; Moed, 2005; Myers, 1970). Citation impact is used in tenure, promotion and award decisions, and in the evaluation of departments and programs (Ostriker, et al., 2009). Despite widespread use of citation counts, there are no established benchmarks or comparative data to assist in clarifying the meaning of a particular individual’s or program’s citation impact in Psychology. This article addresses this gap.
Citation counts are useful, but imperfect, indicators of scientific impact. They are useful because they provide a “relatively objective” indicator of scholarly activity (Sternberg & Gordeeva, 1996, p. 70). They are a ‘blue collar’ index of impact, made primarily by people in the trenches rather than by the generals” (Douglas, 1992, p. 405) in that they do not rely on the judgment of any single individual (such as a textbook author) or group of individuals (such as an award committee), but are based on the citation “votes” of the entire scientific community. Citations also show convergent validity with other measures of scientific impact, such as number of cited articles (Rodgers & Maranto, 1989; Simonton, 1992), textbook citations (Gordon & Vicari, 1992), peer ratings (Endler, et al., 1978; Simonton, 1992), and scientific recognitions and awards (Myers, 1970; Simonton, 1992) including the Nobel Prize (Garfield & Welljams-Dorof, 1992).
Citation counts are imperfect indicators of scientific impact because they are influenced by factors other than scholarly merit. First, there are different citation patterns across fields, making impact rating comparisons across disciplines challenging. For example, neighboring disciplines of neuroscience and medicine/health accumulate more citations more quickly than psychology (Iglesias & Pecharroman, 2007). While this discrepancy might partly indicate a difference in the impact of one field compared to another, other factors contribute such as the average number of citations per paper and the number of authors per paper.1
Another imperfection of citation counts is the asymmetry in their meaning. High citation counts are unambiguous indicators of scientific impact, but low citation counts are ambiguous.2 Articles can
1 The number of authors per paper has an impact because most citation count indices give full credit for each
citation to every author. The total number of papers in a field does not change the average number of citations per paper, but it does allow the more notable or impactful papers in the discipline to accumulate even more citations. 2 Some have wondered if the context of the citation is important (Moravcsik & Murugensan, 1975). Should a
citation that criticizes the original article be given similar weight as one that praises it? The most popular view is
influence thinking and subsequent research without being cited regularly, and articles can vary as to when they will start to have impact.
A final caveat against overinterpretation of citation counts is that impact is not equivalent to quality (Robinson, 2003; Sternberg, 2003). High-quality research may not have influence if no one applies the findings. Low-quality research may be published in prestigious journals (e.g., Bones & Johnson, 2006), and even become highly cited. Also, different types of contributions may garner different levels of respect or accolade, even with the same citation count. For example, some might argue that methodological contributions are less valuable than other types (or the opposite), so their citation impact should be discounted. This article is focused exclusively on documenting citation impact trends, not the quality of work by individual scholars or programs.
Metrics of impact
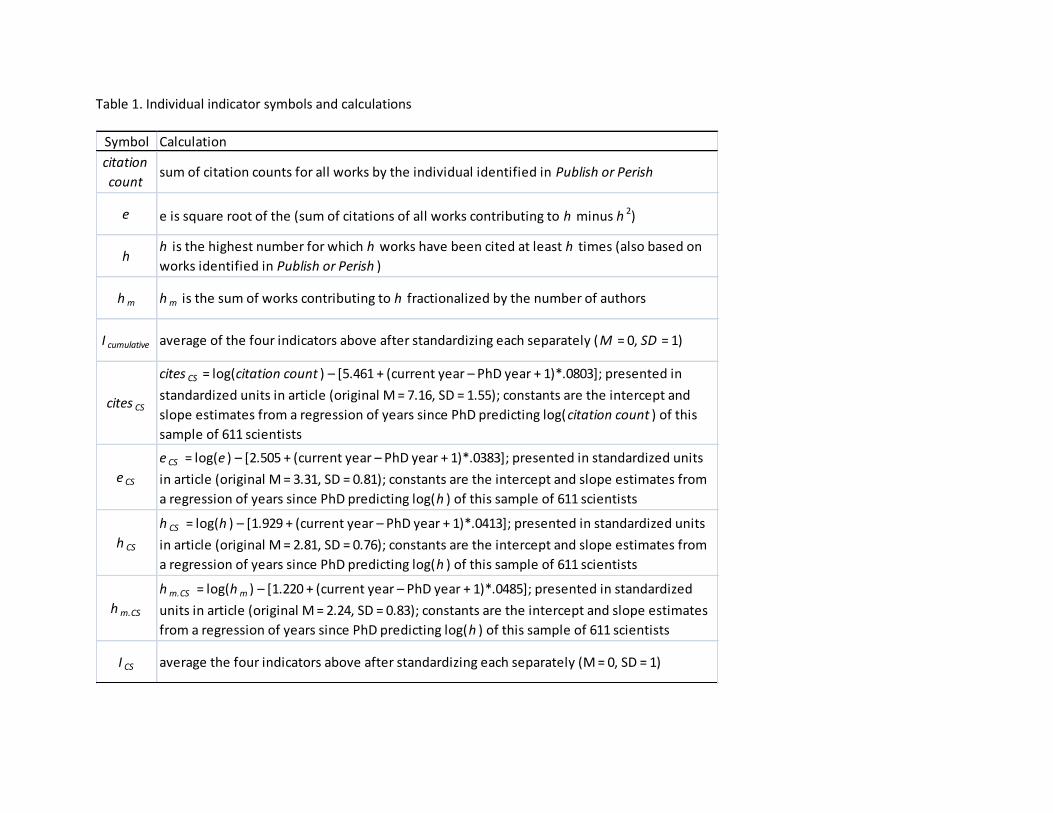
Many citation impact metrics have been proposed (e.g., Alonso, et al., 2009; Bornmann, et al., 2008; Egghe & Rousseau, 2006; Hirsch, 2005; Jin, et al., 2007; Levitt & Thelwall, 2007; Schreiber, 2008; van Raan, 2005; Zhang, 2009). In this article, we do not evaluate the strengths and weaknesses of the various indicators. Instead, we employ four that capture distinct aspects of citation impact. Of these, two are the most popular indicators: total citation count and the h-index (Hirsch, 2005), while the remaining two are derivatives of those: the e-index (Zhang, 2009) and the hm-index (Schreiber, 2008). All four indices track cumulative impact – the total impact over a scholar’s corpus and career. We also introduce new career-stage indicators that estimate the expected citation impact for a scientist given the number of years since PhD. These career-stage indicators allow for comparisons of impact between individuals at different career stages. Here we introduce each of the indicators and describe their strengths and limitations.
Total citation count. The most obvious citation count metric is the total number of citations of all the scientific works produced by a scientist. Each time a scientific work is cited, it has had impact. The simple count of those citations thus indicates the total impact of a paper, scientist, or program. Despite its intuitive appeal and simplicity, total citation count has limitations (Schubert & Braun, 1993; van Raan, 2005). A scientist’s citation count does not consider whether the citation impact is exclusive to a single highly-cited contribution or distributed across a variety of works. For example, Jordan Schwartz earned a Master’s degree in psychology and left the field for a successful career as a software developer. Schwartz published a single scientific article (Greenwald, McGhee, & Schwartz, 1998); that article is one of the most highly-cited psychology papers of the last 15 years. Its 1905 citations (as of August 22, 2009) gives Schwartz the 4th highest citation count compared to the 106 scientists from the present sample within a couple of years of Schwartz’s cohort. With no intent to undermine the importance of the contribution, this example illustrates that one heavily-cited article can overwhelm the impact of the entire corpus of works across a career of research contribution. Using only the total citation count may therefore miss some features deemed important for indexing scientific impact.
The h-index. One obvious alternative metric to total citation count is the total number of works produced. However, getting articles or books published is more an indicator of productivity than impact. Many published works have little or no impact at all. Getting published is a step toward having impact, but is not impact itself.
Hirsch (2005) suggested the h-index to take into account both citation counts and productivity in a single indicator. A scientist’s h is the largest number for which the person has h publications that have been cited at least h times. For example, after arranging one’s articles from most to least cited, if the
that any citation (pro or con) is evidence of impact and influence on the accumulation of knowledge. In this sense, the aphorism about fame applies – it is better to be criticized than ignored – at least for the purposes of having impact.
10th article on the list has been cited at least 10 times, and the 11th article has been cited 10 times or less, then the person’s h is 10. The upper bound of h is the total number of articles published, and the lower bound is 0, indicating that the scientist has never been cited. As such, h rewards productivity, but only if the works are cited. By balancing publication and citation counts, h favors scientists who consistently publish influential works as opposed to those who produce a few unusually influential ones or many that are not influential (Braun, et al., 2005; Kelly & Jennions, 2006).
h is a popular impact metric because of its intuitive appeal and ease of calculation (Anon, 2005; Ball, 2005, 2007). It is calculated automatically by Web of Science and Publish or Perish, two popular citation packages, and is gaining popularity as the individual scientist parallel to the journal ISI impact factor (Gracza & Somoskovi, 2007). A variety of studies find that it has predictive validity for other indicators of scientific impact or recognition (e.g., Bornmann & Daniel, 2005). Hirsch (2007) reported evidence that h predicts a scientist’s future productivity.
Even so, like any other single indicator, h has limitations. For example, Daryl Bem is understood to be one of psychology’s high-impact scholars. However, his h is 30 – a fine but not outstanding number, given his 45 years since earning his PhD. This apparent discrepancy can be understood by noting that Bem has pursued a low-output, high-impact publishing strategy.
This example illustrates that h ignores some important aspects of impact. Consider two hypothetical scientists, Smith and Smyth, with an identical h of 12. Despite their identical h-values, they could have very different citation counts for those 12 papers (often referred to as the “h-core” papers). Smith, for example, might have had each of the 12 papers cited 100 times. Smyth, on the other hand, might have just 12 citations for each, the minimum possible to achieve an h of 12. Obviously Smith has had a bigger impact than Smyth despite their equivalent h’s.
The e-index. Complementing h, the e-index (Zhang, 2009) captures the difference between our hypothetical scientists Smith and Smyth. e incorporates information about total citation counts and is theoretically independent of h. e2 represents the ignored excess citations for the papers that contribute to the scientist’s h score (the h-core papers). For Smith, in the current example, e would be the square root of the number of citations for the 12 h-core papers (1200) minus h2 (144, the square of the minimum number of papers needed to achieve an h of 12), or 32.5. For Smyth, e would be 0 because there were no citations beyond the minimum 12 for each of the 12 papers contributing to the h.
The hm-index. Science, especially 21st-century science, is intensely collaborative. Citation counts, e, and h make no correction for whether the scientist publishes every paper alone or with 10 co-authors. As a consequence, individuals who publish in large collaborative groups could have very high h’s even if they contribute only a small portion to each project.
“Correcting” for co-authorship in citation impact is much debated (Batista, et al., 2006, Bornmann & Daniel, 2007, Burrell, 2007, Imperial & Rodriguez-Navarro 2007). The hm-index (Schreiber, 2008) is related to h but fractionalizes the counting of papers by the number of co-authors. Schreiber (2008) provides some evidence that it performs better than other co-authorship correctives. We included hm, to complement the indicators that ignore co-authorship. Notably, it correlated very strongly with h (r = .976) within our sample. hm and h will correlate more weakly in investigations that compare disciplines with different collaboration and authorship practices.3
3 Other possible corrections that we do not pursue are authorship order and self-citations. It is arguable that first-
authored papers are stronger indicators of one’s impact than junior-authored papers. However, there are no standards for what kind of correction is appropriate, if any. And, any such correction adds considerable complexity for data collection. For programmatic research, self-citation is a meaningful indicator of impact – the prior work is influential and important for the subsequent work. The difficulty is in identifying and correcting for gratuitous self-citation (e.g., Nosek, 2005). No standards exist for identifying such behavior and it would have to be particularly frequent (Nosek, 2007) to have a strong biasing influence on citation counts.
Combining cumulative impact indices. Bornmann and colleagues (2008) factor analyzed a variety of citation indices and found two factors: the breadth of impact – the quantity of the “core” contributions from a scholar (e.g., the set of papers contributing to the h-index), and the magnitude of impact – the number of times papers are cited. Bornmann and colleagues (2008) tested the predictive validity of latent breadth and magnitude impact factors in the assessment of biomedical postdoctoral researchers. Both factors contributed unique predictive validity, with the magnitude factor contributing almost twice as much as the breadth factor (see also Bornmann, et al. [in press]). In our investigation h and hm operationalize the breadth of impact, whereas total citation count and e (r = .94) operationalize the magnitude of impact.
In summary, considering h, hm, citation count, and e together represents both the quantity of productive publications and their impact, and both factors contribute to predicting other accepted indicators of scientific contribution.
Taking career-stage into account. Citation count, e, h and hm are cumulative indicators; everyone starts at 0 and impact can increases with time. So, as in reality, senior scientists have higher cumulative impact on average than junior scientists. However, having a means of taking career stage into account is possible and often valuable, so that significant early- and mid-career contributors can be identified, and scientists with different career lengths can be compared.
We created career-stage indicators for each of the indices – named citesCS, ecs, hCS and hm.cs – that compare an individual’s scores to the expected value of someone with the same number of years since earning his or her PhD. 4 This approach was made possible by our sampling strategy – all members of a wide variety of programs, whatever their career stage and impact. Prior investigations of impact have focused on senior scholars. This limits the ability to draw conclusions about effects of career stage on impact, and to characterize the scientific impact of scientists in general.
One challenge to calculating expected values for a given career stage is that the relationship between years since PhD and impact factors produces a distribution that violates the assumption of homoscedasticity – there is more variability in impact scores among people at advanced career-stages than at early career-stages. If uncorrected, this threatens the analysis and interpretation of regression estimates, and damages the comparability of scores across the career span.5 To remove the heteroscedasticity, we used the natural log of the indicators when creating regression and individual estimates of impact given career-stage (see Cohen & Cohen, 1983, pp. 128-130). This transformation was effective in mitigating heteroscedasticity.6
4 Hirsch (2005) suggested h be divided by career length. However, this adjustment is problematic because it
overcorrects at early career stages and undercorrects at later career stages (Jensen, Rouquier & Croissant, 2009). Also, many citation analyses use “years publishing” instead of “years since PhD,” presumably because the former can be determined in the citation databases themselves. We adopted “years since PhD” because there is considerable variability in the circumstances of a scientist’s first publication that may or may not correspond with the onset of general research productivity. Achievement of a PhD is a standard benchmark for the initiation of one’s career as a scientist. To establish a simple integer metric, years since PhD was calculated as 2010 minus the recorded year of the scientist earning their PhD. 5 For example, Phillips (2007) suggested a linear regression strategy to predict citation counts of a faculty
member’s top three papers based on years since PhD: Expected citations = -12.5 + 32.5 * Years since PhD. However, the accumulation of raw citation counts is non-linear (see Figure 1), and the analysis strategy did not take into account heteroscedasticity. 6 Alternative approaches to the natural log adjustment include Poisson and negative binomial regression (Hilbe,
2007).
Overview and Goals To advance a method for documenting and comparing impact across scientists and programs in
a scientific subfield, we investigated citation impact trends using a sample of 611 scientists working in 97 PhD-granting universities in the U.S. and Canada. We included all active core faculty so that we could cross-sectionally estimate the various indicators of scientific impact at different stages of the academic career. Our unique approach is labor-intensive, but services our goals to (a) provide insight into the variation in impact across the career span, (b) highlight contributions of mid- and early-career scientists, and (c) enable program comparisons that are not exclusively weighted by the most senior members of the scientific community. Finally, we conducted impact comparisons across gender and race/ethnicity. The overall results will contribute to the goal of identifying methods and benchmarks for evaluation of the scholarly impact of individuals and programs. Such objective indices might, for example, provide a useful contrast to reputation rankings that are currently the norm for ranking psychology programs.
Method
Sample We focused on active (i.e., not retired or emeritus) core faculty in social or social-personality
programs of psychology departments at PhD-granting institutions in the United States and Canada. This focus covers a sizable portion of the contributors to social-personality psychological science with reasonably well-defined inclusion rules. For feasibility, we restricted sampling to the top 116 Psychology Departments as rated by the U.S. News and World Report in 2009, plus the 12 Canadian Universities appearing in the social-personality psychology section at http://socialpsychology.org/.
Next, we excluded departments that did not have social-personality PhD programs or sub areas. For the remaining programs, we identified those among the faculty who belonged to the social-personality area. These two criteria are fuzzy sets. Departments vary in their definition of programs and in their inclusion of faculty as primary members. We attempted to maintain standard definitions of “social program” and “primary faculty” to maximize similarity across departments, while still respecting departments’ self-definitions.
To qualify for inclusion, departments had to have a defined Social or Social-Personality program7; scientists had to (a) be tenured or tenure-track faculty on August 1, 2009, and (b) be primary members of the Social program (i.e., not secondary members with core affiliations in another area or department). These criteria were applied in two stages. First, the department website - its public self-description – provided a basis for generating a tentative list of primary faculty. Second, we contacted a faculty member in each department directly, described the criteria, and used their advice to edit the list to fit the area’s self-conception of its primary faculty. This approach has the advantage of ensuring that the department’s self-perception is prioritized with the disadvantage that departments may have somewhat different ways of defining social-personality psychology. Of course, there is no consensual definition of social-personality psychology. Other approaches are reasonable (e.g., counting all SPSP members at the University), but because discipline and participation boundaries are fuzzy, none are universally applicable. Our approach emphasized identification of the social program as defined by the program itself. The results and conclusions should be understood in that context. (See online supplements for additional detail on inclusion criteria, selection process, and relative merits and disadvantages of other approaches.)
7 Some departments had complex blended areas such as “Social, Developmental, and Abnormal.” Most of these
blended areas reported “social concentrations” or had some means of identifying a social core from a large, diverse blended group.
With these criteria, a total of 97 departments and 611 scientists comprised the sample (248 women, 363 men; 41% female). Departments with social areas had an average of 6.3 core area members, with a wide range (SD = 2.89, min = 2, max = 15). The median year for PhD earned was 1990 (20 years since PhD), with 166 (27%) earning their doctorate in the 2000’s, 154 (25%) in 1990’s, 123 (20%) in 1980’s, 126 (21%) in 1970’s, 39 (6%) in 1960’s, and 3 (<1%) in 1950’s. We attempted to categorize scientists by race/ethnicity with five categories: Black (n = 20), White (n = 517), Asian (n = 31), Hispanic (n = 15), “Other” (n = 8), and 20 unknown. Category membership was determined by the present authors’ knowledge of the individuals, or with images and other information available on the Internet. As such, the race/ethnicity data should be interpreted cautiously. The small number of members in each non-White category prevents these categories from being considered separately. Race/ethnicity analyses were conducted as a dichotomous variable - White (86%) or non-White (n = 74, 14%).
Obtaining Citation Data
Technological advances have made it possible to conduct effective citation counts for a relatively large sample. We used the software package Publish or Perish (PoP; Harzing, 2009). PoP queries Google Scholar (GS; http://google.scholar.com/), and has useful tools for culling errors, refining searches and calculating statistics. However, the results are not error free. For example, the GS database may miss articles entirely, double count citations, or credit citations to the wrong authors. Search accuracy depends on culling erroneous citations (Bar-Ilan, 2008). This can be challenging, especially for scientists with common names. On the other hand, GS does have a couple of important advantages compared to alternatives (Web of Science, Scopus). GS is more inclusive of scientific works across media (e.g., book chapters, books, journals) and it has useful search and calculation mechanisms. GS does not discriminate whether articles are published or unpublished – it only counts whether they have been cited. With these features and despite the limitations, GS tends to be the most comprehensive citation database (Meho & Yang, 2007; see also http://www.harzing.com/pop_gs.htm for an excellent discussion of citation data sources).
Procedure
Citation data was collected with Publish or Perish intensively within 10 days (Aug 14 – 23, 2009) because citation counts keep accumulating.8 During data collection, team members discussed search strategies through email to ensure consistent norms. The primary citation counts were supplemented by Web of Science searches (WoS; http://isiknowledge.com/wos/) and individual vitae or websites to check for accuracy and missing data. While powerful, citation search tools are not perfect. Certainly, errant data made it through these checks. We assumed that the error was distributed randomly and does not alter the overall results substantially. More caution should be reserved for counts of individual scientists. An individual’s rating will shift as a function of the accuracy of the search. The most accurate individual search is one conducted by a person very familiar with the scientist’s works. Such a count should be preferred over individual counts offered in this article.
We conducted secondary checks on searches to estimate their reliability by having each investigator re-run five searches that had been done by another investigator (50 secondary searches in total). The correlation of total citations between primary and secondary searches elicited rs of .994 (citation count), .977 (h), .996 (e), and .973 (hm). We also conducted 555 secondary searches using Web of Science (WoS) as a comparison database to check for errors. Because it excludes many data sources, WoS generated 58% lower citation counts on average than GS (WoS Mean N = 1,414; GS Mean N = 3,375
8 Twenty-one additional searches were conducted during revisions (March, 2010). To partly adjust for the passage
of time for those search counts, those individuals were credited with an additional 0.5 years since PhD.
for the same subsample). Even so, the WoS and GS databases produced highly correlated counts (r = .92).
Results and Discussion
Cumulative impact for individuals We used four indices of the cumulative impact of each scientist: total citations, e, h, and hm (see
Table 1). Among our 611 scientists, the average total citation count was 3,431, with considerable variability around the mean (SD = 5478; range 3 to 48193). The average h-index was 21.3, also with considerable variability (SD = 14.8; range 1 to 83). Likewise, high variability was observed in the e-index (M = 36.78, SD = 28.75; range 0 to 208.90) and hm-index (M = 12.87, SD = 9.95; range 0.33 to 53.05). The substantial variation reflects our sampling of scientists across the career span rather than focusing exclusively on senior scientists. Appendix A presents the top 10% of individual scientists based on Icumulative, an average of the four indicators after standardizing each (M = 0, SD = 1).9 Of course, this table is just a small slice of the extraordinary contributors to psychology – and only documents cumulative citation impact.10 Also, people who were dead, retired, emeritus, not on tenure-track, outside of a PhD granting psychology programs, outside of the U.S. News and World Report list of top 116 psychology programs in the Fall of 2009, or employed outside of the U.S. or Canada were not included in the present sample, no matter what level of contribution they have made to science. Career-stage impact for individuals
Cumulative impact is highly related to years since PhD. Years since PhD accounted for 43% of the variance in log(total citations), 48% of the variance in log(h), 36% of the variance in log(e), and 54% of the variance in log(hm). This relationship is not surprising – more years in the field provides more time to publish scientific works and more time for those works to be noticed and influence others. Career-stage indicators estimate scientific impact relative to the expected cumulative impact given one’s career-stage.
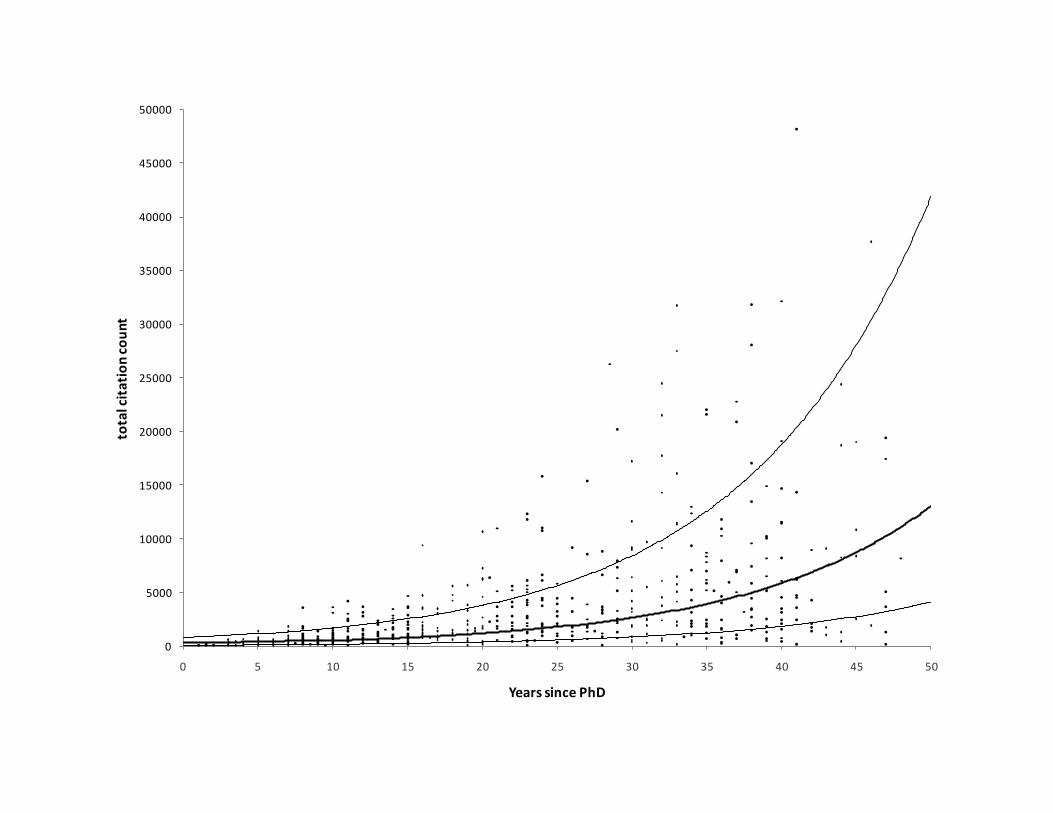
Figure 1 plots total citations by years since PhD. The strong relationship between years and citations is obvious, as is the heteroscedasticity in the scatter plot – there is less variation in citation counts among early-career scientists than among later-career scientists. The figure plots the raw citation counts, but regressions were conducted on log(citation count) to mitigate the effects of heteroscedasticity. The thick regression line is the estimated log(citation count) by years since PhD rescaled in raw citation count units. The lighter lines around it represent +/- 1 standard deviation of the residuals (SD of residuals = 1.166), likewise rescaled in raw units. Approximately 68% of scientists are estimated to have citation counts between those lines.
The variation in early career scientists is very difficult to see in Figure 1. Figure 2 plots just the scientists with 10 or fewer years since PhD and rescales the y-axis (less than 1/10th the range of Figure 1). With a very high proportion of scientists below the +1 SD line, this plot suggests that the regression may overestimate citation counts for very early career scientists. This apparent overestimation was confirmed with a residual analysis. As an illustration, just 11 of 60 scientists (18%) with 5 or less years since PhD exceeded the mean expected value on citation count and h-index. However, among scientists with 6-10 years since PhD, 55 of 106 (52%) exceeded the mean expectation for citation count and 57 of
9 The four were highly intercorrelated producing an alpha of the four indicators combined of .975.
10
Some individuals might not ordinarily be thought of as a “social-personality psychologist.” Recall that our inclusion rules were that the person was identified as a core member of the department’s social-personality program, not what degree they earned or where they publish most of their research.
106 (56%) on h-index. Because very early career scientists will have a disproportionately high percentage of “just published” works, their citation counts may need a few years to catch up to the overall trend trajectory. Scatterplots for h, e, and hm looked very similar to the trends in Figure 2.
CitesCS , eCS, hCS , and hm.cs are career-stage impact indicators that estimate a scientist’s distance from the expected value given his or her years since PhD. These values can be calculated for scientists who did not appear in this dataset (or to update estimates) with the following formulas:
citesCS = log(citation count) – [5.461 + (current year – PhD year + 1)*.0803] eCS = log(e-index) – [2.505 + (current year – PhD year + 1)*.0383] hCS = log(h-index) – [1.929 + (current year – PhD year + 1)*.0413] hm.cs = log(hm-index) – [1.220 + (current year – PhD year + 1)*.0485]11
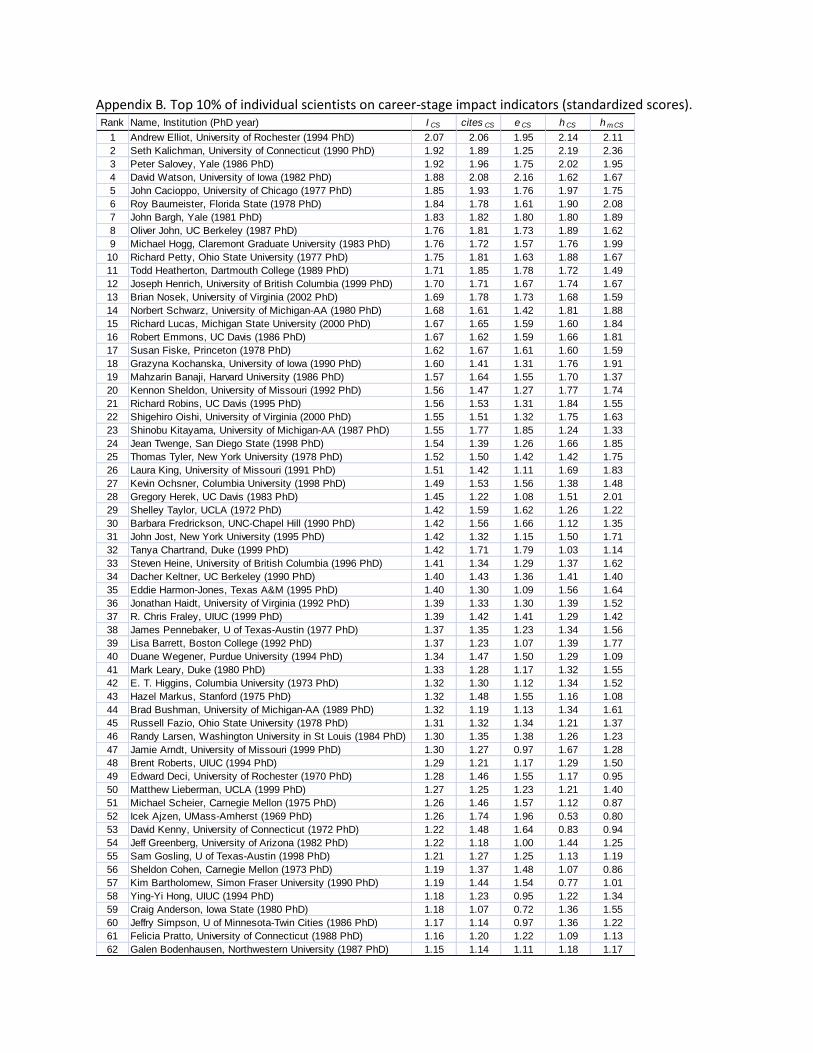
The intercept and slope constants are based on the present sample. As such, any derived estimate is only interpretable in comparison to this sample. However, citation patterns are relatively consistent across psychology subdisciplines suggesting that these estimates may generalize to the discipline. Appendix B presents the top 10% of individual scientists in the sample based on ICS – an average of standardized citesCS , eCS ,hCS, and hm.cs scores. Many on the list were also on the cumulative impact list indicating a long career of high impact work that greatly exceeds their expected impact. But, well over half of those on the career-impact list did not appear on the cumulative impact list - all those were early to mid-career scientists. Career award winners have relatively high cumulative and career-stage impact scores One way to show convergent validity evidence for the Icumulative and ICS metrics as indicators of scientific impact is to compare winners of major scientific awards with the rest of the sample. We identified the members of our sample that won the SESP Distinguished Scientist award (1992-2008; N = 12), SPSP Donald T. Campbell award (1980-2008; N = 18), and the social, personality, or individual differences APA Early Career awards (1976-2009; N = 16). The first two are career awards; the last is an early career award. Icumulative represents the average of four standardized impact indicators. As such, positive values are approximately equivalent to the number of standard deviations above the mean cumulative impact rating for the sample. For the career awards, SESP winners had a mean Icumulative of 2.12 and SPSP winners had a mean of 2.57 – impact ratings at the extreme high end of the distribution. For the APA early career award winners, the Icumulative mean was 0.88 – still almost a standard deviation above the cumulative impact of the sample. Its smaller value is easily understood by noting that the average years since PhD was nearly 20 years smaller in this group than the career award winners. ICS likewise represents the average of four standardized career-stage indicators. SESP winners had a mean ICS of .41 and SPSP winners’ mean was 0.94, indicating that these career award winners also exceed their expected values given their career-stage. Notably, the APA early career award winners had an even larger average ICS of 1.25 (with no value lower than 0.62). Across all three awards, only 2 awardees had an ICS score at or slightly below 0 – the expected value for one’s career-stage. Cumulative impact for social psychology programs
The cumulative impact indices for social psychology programs were the sum of total citations (total cites), e (summed e), h (summed h), and hm (summed hm) across the core members of each
11
Appendices show standardized values. To compare newly calculated scores with the appendices, apply these formulas and then standardized those scores on the mean and standard deviation of the present dataset: citescs M = 0.00074, SD = 1.17; ecs M = -0.00025, SD = 0.65; hcs M = 0.00021, SD = 0.55; hm.cs M = -0.00018, SD = 0.56).
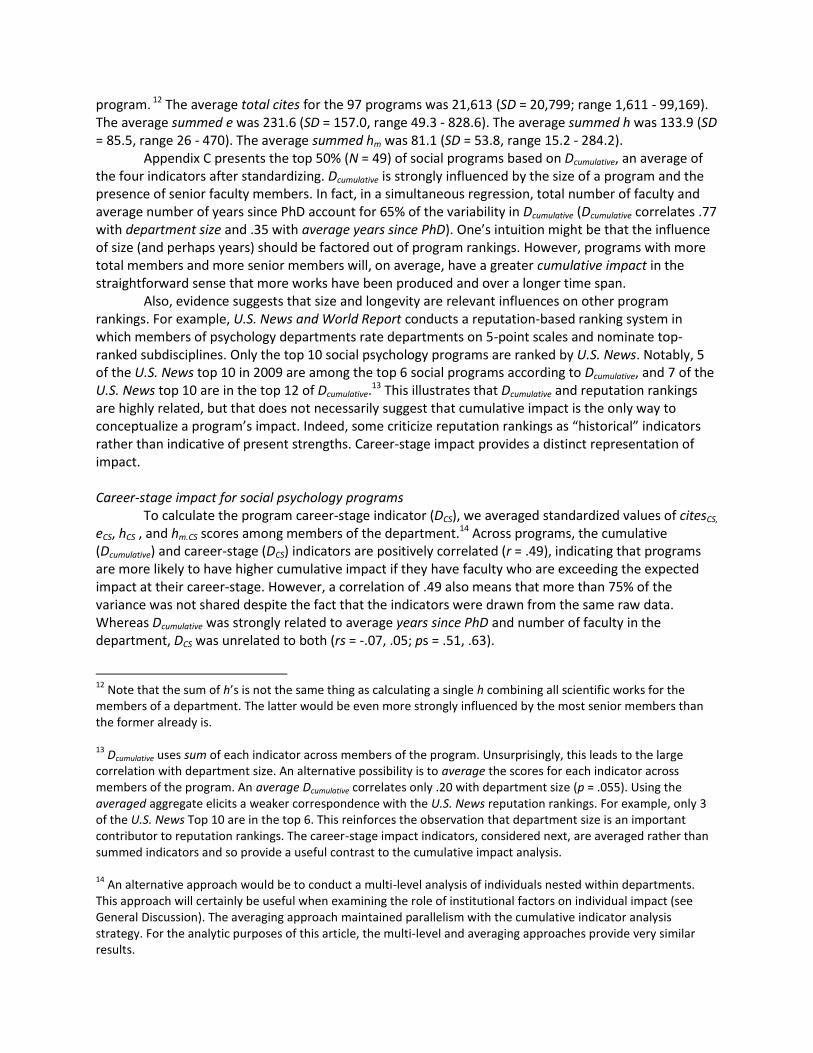
program. 12 The average total cites for the 97 programs was 21,613 (SD = 20,799; range 1,611 - 99,169). The average summed e was 231.6 (SD = 157.0, range 49.3 - 828.6). The average summed h was 133.9 (SD = 85.5, range 26 - 470). The average summed hm was 81.1 (SD = 53.8, range 15.2 - 284.2).
Appendix C presents the top 50% (N = 49) of social programs based on Dcumulative, an average of the four indicators after standardizing. Dcumulative is strongly influenced by the size of a program and the presence of senior faculty members. In fact, in a simultaneous regression, total number of faculty and average number of years since PhD account for 65% of the variability in Dcumulative (Dcumulative correlates .77 with department size and .35 with average years since PhD). One’s intuition might be that the influence of size (and perhaps years) should be factored out of program rankings. However, programs with more total members and more senior members will, on average, have a greater cumulative impact in the straightforward sense that more works have been produced and over a longer time span.
Also, evidence suggests that size and longevity are relevant influences on other program rankings. For example, U.S. News and World Report conducts a reputation-based ranking system in which members of psychology departments rate departments on 5-point scales and nominate top-ranked subdisciplines. Only the top 10 social psychology programs are ranked by U.S. News. Notably, 5 of the U.S. News top 10 in 2009 are among the top 6 social programs according to Dcumulative, and 7 of the U.S. News top 10 are in the top 12 of Dcumulative.
13 This illustrates that Dcumulative and reputation rankings are highly related, but that does not necessarily suggest that cumulative impact is the only way to conceptualize a program’s impact. Indeed, some criticize reputation rankings as “historical” indicators rather than indicative of present strengths. Career-stage impact provides a distinct representation of impact.
Career-stage impact for social psychology programs
To calculate the program career-stage indicator (DCS), we averaged standardized values of citesCS,
eCS, hCS , and hm.CS scores among members of the department.14 Across programs, the cumulative (Dcumulative) and career-stage (DCS) indicators are positively correlated (r = .49), indicating that programs are more likely to have higher cumulative impact if they have faculty who are exceeding the expected impact at their career-stage. However, a correlation of .49 also means that more than 75% of the variance was not shared despite the fact that the indicators were drawn from the same raw data. Whereas Dcumulative was strongly related to average years since PhD and number of faculty in the department, DCS was unrelated to both (rs = -.07, .05; ps = .51, .63).
12
Note that the sum of h’s is not the same thing as calculating a single h combining all scientific works for the members of a department. The latter would be even more strongly influenced by the most senior members than the former already is. 13
Dcumulative uses sum of each indicator across members of the program. Unsurprisingly, this leads to the large correlation with department size. An alternative possibility is to average the scores for each indicator across members of the program. An average Dcumulative correlates only .20 with department size (p = .055). Using the averaged aggregate elicits a weaker correspondence with the U.S. News reputation rankings. For example, only 3 of the U.S. News Top 10 are in the top 6. This reinforces the observation that department size is an important contributor to reputation rankings. The career-stage impact indicators, considered next, are averaged rather than summed indicators and so provide a useful contrast to the cumulative impact analysis. 14
An alternative approach would be to conduct a multi-level analysis of individuals nested within departments. This approach will certainly be useful when examining the role of institutional factors on individual impact (see General Discussion). The averaging approach maintained parallelism with the cumulative indicator analysis strategy. For the analytic purposes of this article, the multi-level and averaging approaches provide very similar results.
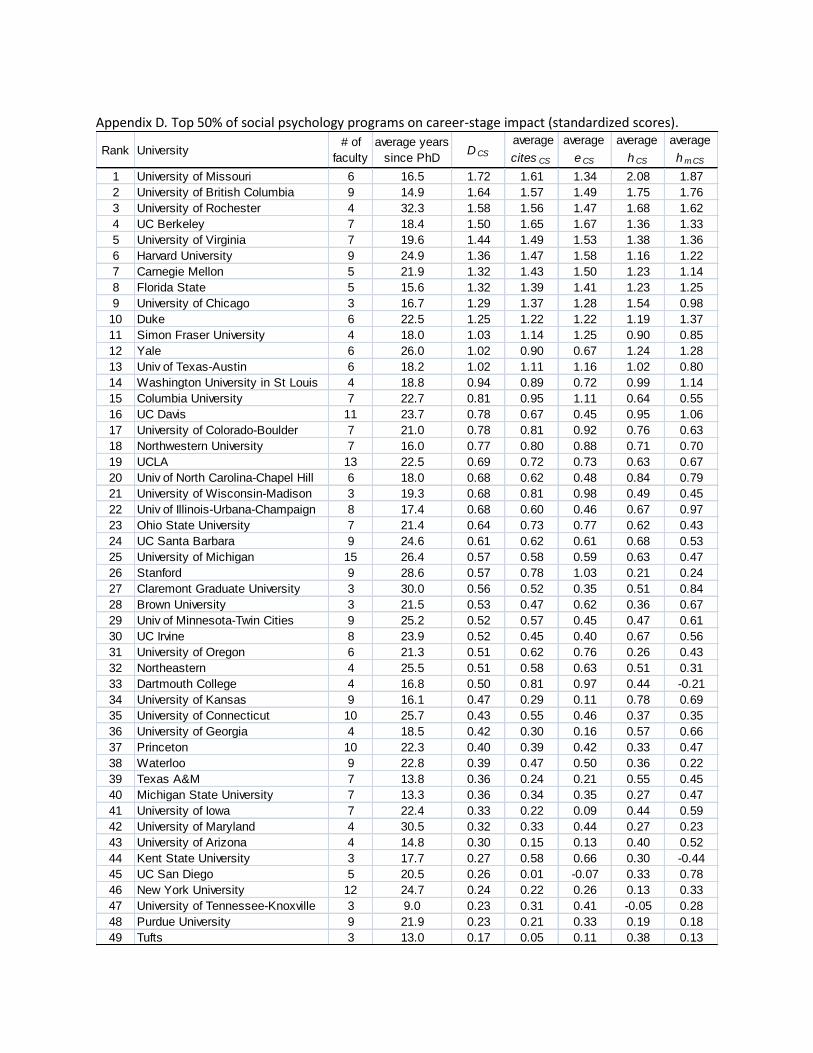
Appendix D presents the top 50% (N = 49) of programs in terms of DCS. The difference from the cumulative impact indicators is evident. None of the top five programs in terms of career-stage indicators appeared in the top 10 of Dcumulative. These programs, on average, have younger or smaller faculties than the top programs on the cumulative indicators list that is dominated by older and larger programs. Career-stage impact ranking is less related to the U.S. News reputation ranking than was cumulative impact ranking. Zero of the top 3, 2 of the top 5, and 5 of the top 20 programs in career-stage impact ranking appeared on the U.S. News top 10. Using either the cumulative or the career-stage impact indicator is reasonable (some readers may find the approach that reflects best on their own institution or alma mater to also have the most compelling rationale). Appendix E presents the top half of social psychology programs in our sample ordered by Daggregate, the average of Dcumulative and DCS. Impact trends by gender and ethnicity A multivariate regression with gender and ethnicity (White, non-White) predicting Icumulative
showed gender and ethnic differences in citation impact. Men (Icumulative M = 0.16, SD = 1.05) had a higher average impact than women (Icumulative M = -.23, SD = 0.78; F[1, 588] = 21.9, p < .0001), and Whites (M = 0.08, SD = 1.00) had a higher average impact than non-Whites (M = -0.42, SD = .58; F[1, 588] = 15.4, p < .0001). Together, gender and ethnicity explained 6.4% of variance in Icumulative. However, the average male (years since PhD M = 23.0, SD = 13.1) and White scientist (M = 22.2, SD = 12.7) had a longer career span than the average female (M = 18.4, SD = 11.5) and non-White scientist (M = 14.8, SD = 10.3), suggesting that some of the gender and ethnicity effects might be due to average differences in career-stage. Indeed, repeating the regressions with the career-stage indicators showed much weaker effects. Men (M = 0.10, SD = 0.97) had slightly higher ICS scores than women (M = -0.14, SD = 0.95; F[1, 588] = 7.59, p = .006), and Whites (M = 0.04, SD = 0.97) had slightly higher ICS scores than non-Whites (M = -0.19, SD = 0.92; F[1, 588] = 3.12, p = .08). In this case, gender and ethnicity explained 1.9% of the variance in ICS. Compared to the regressions above, this suggests that a large portion of the gender and ethnicity gaps are a function of average differences in seniority.15
General Discussion Citing another work in an academic article is an acknowledgment that the cited work provides something – empirical evidence for a claim, theoretical development of an idea, a method to draw on, or a contrasting opinion that one intends to criticize. The accumulated citations within an article provide the theoretical and empirical base on which the present article builds. The accumulated network of citations in a scientific field reflects the integration of academic investigations and the accumulation of knowledge. We examined two forms of citation impact for individuals and programs – the cumulative impact of one’s contributions, and the career-stage impact – the cumulative impact compared against the expected impact given one’s years since PhD. These indicators are non-redundant: The former grows larger with the passage of time while the latter is independent of time. Cumulative impact (operationalized by Icumulative and Dcumulative for individuals and departments respectively) reflects the existing understanding of scientific impact. Across individuals, some of the most prominent members of the field are on the list of top contributors (Appendix A), and winners of career awards show extremely high cumulative impact scores. Across programs, the cumulative impact of the core faculty corresponds closely with the U.S. News and World Report ranking – a reputation-
15
An alternative way to test this question is to include years since PhD as a mediator of the relationship between gender or race/ethnicity and Icumulative (Baron & Kenny, 1986). Such an analysis produced a very similar result (after including years since PhD in the model, gender was a small, but significant predictor, p = .01; ethnicity was not, p = .15).
based measure. Programs with the highest reputations are larger and have more senior faculty than average, providing more opportunities for scientific impact to accumulate. Career-stage impact (operationalized by ICS and DCS for individuals and programs respectively) is distinct and its calculation required the methodology detailed in this paper – an in-depth data collection of a large, career-spanning sample from a single subdiscipline – to calculate a regression of the expected growth of impact over time. It is uncorrelated with years since PhD, and instead reflects the distance from “expected” impact at a given career stage. Career-stage impact is higher for career award winners – especially early-career award winners who, as a group, have not had as much time to accumulate impact. Comparing departments, career-stage impact is related to U.S. News reputation rankings, but much more weakly than is cumulative impact. Also, because the career-stage program impact (DCS) is an average of core faculty indicators instead of a sum like the cumulative impact ratings, smaller departments had more of an opportunity to appear in the top career-stage rankings. Gender and race/ethnicity differences in citation and scientific impact We observed that Whites and men had higher impact than non-Whites and women respectively, but most of this difference was accounted for by average differences in career stage. However, even after accounting for career-stage differences, approximately 2% of the variation in citation impact was accounted for by gender and race/ethnicity. This adds to a growing literature across disciplines examining group differences in scientific impact by gender (Boice et al., 1985; Cole & Singer, 1991; Gonzalez-Brambila & Veloso, 2007; Haslam et al., 2008; Helmreich et al., 1980; Joy, 2006; Long, 1992; Sandström, 2009; Xie & Shauman, 1998) and race/ethnicity (Blackburn, et al., 1994; Clemente, 1974; Freeman, 1978; del Carmen & Bing, 2000; Elmore & Blackburn, 1983; Greenwald & Schuh, 1994; Nettles & Perna, 1995; Rafky, 1972; Wanner, et al., 1981). In total, the data on gender and race/ethnicity differences in citation impact suggests that the gaps are real, perhaps small, and the full explanation is still unknown. Sources of invalidity in evaluating citation impact
We used citation indicators that have been validated with other samples in other disciplines, and derived new indicators from them that account for career stage. We also found evidence of validity in this study with individual indicators being related to career and early-career award winners, and program indicators being related to reputation rankings. However, scientific impact is amorphous, and this validation evidence is not comprehensive. Another means of validation is to compare the outcomes of the a priori defined criteria in this article against one’s intuitions for how the ranking “should” have come out across individuals and programs. Of course, when one’s intuitions are in conflict with results, the problem might be with the intuitions. Intuitions are likely to be influenced by a variety of factors that are not useful for gauging scientific impact, such as (a) ego-protective strategies that lead one to believe that whichever criteria look best for oneself and one’s group are likely to be the most accurate (Greenwald, 1980), (b) the availability heuristic that may produce an inordinate influence of highly accessible scientists and programs on perceived impact (Tversky & Kahneman, 1974), or (c) naïve realism (Ross & Ward, 1996), mistaking the impact on oneself - what one personally has been influenced by - for impact on academic scholarship more generally.16
Even so, there are undoubtedly reasonable alternatives and useful refinements to any indexing of impact. For example, changing inclusion rules can have a dramatic effect on relative ranks. One could
16 Further, even though we generated our design and criteria a priori, it is possible that irrelevant influences like
these shaped the construction of decision rules for inclusion or selection and design of indicators. Some might have seemed more appealing because we guessed that our program would look better with one approach than another. Despite our intent for objectivity, the possibility of this influence cannot be ruled out.
include emeritus faculty, remove faculty who are in the area but have not graduated a PhD student for 5 years, include affiliates from other programs or departments, or count just those members that have published in a particular selection of journals (e.g., PSPB, JPSP, JESP). Each of these will produce a unique composition of program faculty. Another line of research could develop program or department-level indicators that enhance the two offered in this article. For example, Dcumulative scores that included retired faculty would provide cumulative impact over a program’s history, including faculty with secondary appointments might provide a more complete picture of current contributors to a program, and investigating graduates of a program provides an alternative way of thinking about program impact.
Also, despite their apparent validity, there is little reason to think that the indicators that we used, and our equal-weighting method of combining them, are the last word on indexing impact. Our approach was democratic – the universe of data was all citations that have been indexed by Google, and every citation carried the same weight for contributing to citation counts. As a consequence, the topic of the article (e.g., theory or method focus), the context of the citation (praising or criticizing), the authorship order (first, last or somewhere in between), the identity of the citer (e.g., self, senior scholar, graduate student), and the location of the citation (e.g., in another psychology article versus one in physics or education) were irrelevant. Impact was impact no matter where or why it occurred. This is not the only possible approach. For example, Tesser and Bau (2002) examined citations in handbook chapters. Handbook or textbook analyses localize consideration of impact on the specific discipline covered by the book, use a small sample of impact “judges” (the handbook authors), and are much less likely to represent contributions of early-career scientists. That is not to suggest that handbook methods are ineffective, it is just that they address a distinct aspect of impact. In summary, impact is a heterogeneous concept, no single index can encapsulate it, and each index must be understood based on its inclusion criteria and measurement properties.
How should citation impact metrics be used?
The preceding discussion begs an obvious question of how best to make use of citation impact metrics, knowing that they represent only part of scientific impact and quality. The answer is not obvious in that the cumulative and career-stage impact indicators produced distinct results across people and programs. Which one is correct? The answers both and neither are surely more accurate than one or the other. Both are correct in the sense that they each capture a distinct aspect of scientific contribution. Neither is correct in the sense that citation impact is only one aspect of how academic scientists contribute to knowledge. Even so, as with every other complex social phenomenon, indicators that validly account for some of the variance in scientific contribution can be useful if applied wisely considering both their utility and limitations. Impact ratings of individuals and departments might be used by prospective graduate students considering labs and universities, hiring committees considering job applicants, tenure committees considering promotions, university administrators considering the status of their faculty and departments, and national and international committees considering award nominees. Citation impact is not effectively used in isolation for any of these groups for multiple reasons. First, is the point from the introduction: impact is not the same as quality. High quality research may not have high impact because (a) a subfield may be too small for the research to be cited frequently, (b) the research may not be noticed, (c) the research may be in a crowded field in which a subset of prominent people or works dominate, or (d) others may not yet recognize or have the ability to apply the research.
Second, there are other activities of scientists and programs that make them important contributors to scientific progress, including teaching, mentorship, reviewing or editing, university or national service, and other contributions that are not reflected in citation counts.
Third, the indicators are not uniformly applicable to all people and all contexts. The present data are most relevant for members of psychology programs at Ph.D. granting universities. To the extent that
other disciplines have similar citation patterns, the regression estimates for the components of ICS may generalize.17 Further, the regression estimates may not be equally applicable across the career span. In particular, people with 5 years or less since their PhD appear to be systematically disadvantaged, even on the career-stage indicators, presumably because of the high proportion of their works that have not yet appeared or had sufficient time in public to be cited.
Finally, citation impact is not an unambiguous indicator of the individual scholar or program, because it is also influenced by situational factors. The most obvious situational influence on citation impact is the availability of research-relevant resources. A fair comparison group for a scientist or program’s productivity and impact would be a selection of individuals or programs with similar resources. To the extent that the environments for research are matched, the comparison removes variation that might be explained by situational influences. For example, a multi-level model of scientists nested in departments could estimate the variance explained in citation impact attributable to program factors (e.g., teaching load, number of graduate students) versus individual factors. There is, of course, a complicating factor in separating personal and situational influences; highly resourced departments are likely to be more effective at attracting the most talented faculty.
Conclusion
Citation impact is an important indicator of scientific contribution because it is valid, relatively objective and, with existing databases and search tools, straightforward to compute. As with any metric, it can be difficult to avoid the temptation to overgeneralize its applicability as the singular index of individual or program scientific contribution, or to essentialize it as a “pure” indicator of the person or department at the expense of situational influences. The complexity of documenting and ranking scientific impact is reinforced by our observation that cumulative impact and career-stage impact reveal distinct effects. Nonetheless, citation impact provides useful information for individuals, committees, and disciplines that are gauging the health, variation, and progress of advancing knowledge.
References
Alonso, S., Cabrerizo, F. J., Herrera-Viedma, E., & Herrera, F. (2009). h-Index: a review focused in its variants, computation and standardization for different scientific fields. Journal of Informetrics, 3, 273-289.
Anon. (2005). Data point. Science, 309(5738), 1181. Ball, P. (2005). Index aims for fair ranking of scientists. Nature, 436, 900. Ball, P. (2007). Achievement index climbs the ranks. Nature, 448, 737. Bar-Ilan, J. (2008). Which h-index? — A comparison of WoS, Scopus and Google Scholar. Scientometrics,
74, 257-271. Baron, R. M., & Kenny, D. A. (1986). The moderator-mediator variable distinction in social psychological
research: Conceptual, strategic and statistical considerations. Journal of Personality and Social Psychology, 51, 1173-1182.
Batista, P.D., Campiteli, M.G., Kinouchi, O. & Martinez, A.S. (2006). Is it possible to compare researchers with different scientific interests? Scientometrics, 68, 179-189.
Blackburn, R., Wenzel, S. & Bieber, J. P. (1994). Minority vs. majority faculty publication performance: a research note. Review of Higher Education, 17, 217-282.
Boice, R., Shaughnessy, P., & Pecker, G. (1985). Women and publishing in psychology. American Psychologist, 40, 577-578.
17
We have made notes and other files available at http://briannosek.com/papers/citations/ to make it easier for other teams to replicate our methodology with other samples or to reanalyze the present data.
Bones, A. K., & Johnson, N. R. (2006). Measuring the immeasurable: Or “could Abraham Lincoln take the Implicit Association Test?”. Perspectives on Psychological Science, 2, 406-411.
Bornmann, L., & Daniel, H-D. (2005). Does the h-index for ranking of scientists really work? Scientometrics, 65, 391-392.
Bornmann, L. & Daniel, H.-D. (2007). What do we know about the h index? Journal of the American Society of Information Science and Technology, 58, 1381-1385.
Bornmann, L., Mutz, R., & Daniel, H-D. (2008). Are There Better Indices for Evaluation Purposes than the h Index? A Comparison of Nine Different Variants of the h Index Using Data from Biomedicine. Journal of the American Society for Information Science and Technology, 59, 830-837.
Bornmann, L., Mutz, R., Daniel, H.-D., Wallon, G., & Ledin, A. (in press). Are there really two types of h index variants? A validation study by using molecular life sciences data. Research Evaluation.
Braun, T., Glänzel, W., & Schubert, A. (2005). A Hirsch-type index for journals. The Scientist, 19, 8. Burrell, Q.L. (2007). Should the h-index be discounted? In W. Glänzel, A. Schubert, B. Schlemmer (Eds.)
The multidimensional world of Tibor Braun (pp. 65-68). ISSI, Leuven. Clemente, F. (1974). Race and research productivity. Journal of Black Studies, 5, 157-166. Cohen, J., & Cohen, P. (1983). Applied multiple regression/correlation analysis for the behavioral
sciences. Hillsdale, NJ: Lawrence Erlbaum Associates. Cole, S., & Singer, B. (1991). A theory of limited differences. In H. Zuckerman, J. Cole, & J. T. Bruer (Eds.),
The outer circle: women in the scientific community (pp. 277 – 310). New York: Norton. Del Carmen, A. & Bing, R. L. (2000) Academic productivity of African Americans in criminology and
criminal justice. Journal of Criminal Justice Education, 11, 237-250. Diener, E., Sapyta, J. J., Suh, E. (1998). Subjective well-being is essential to well-being. Psychological
Inquiry, 9, 33-37. Douglas, R. J. (1992). How to write a highly cited article without even trying. Psychological Bulletin, 112,
405–408. Egghe, L., & Rousseau, R. (2006). An informetric model for the Hirsch-index. Scientometrics, 69, 121-129. Elmore, C. J. & Blackburn, R. T. (1983). Black and white faculty in white research universities. Journal of
Higher Education, 54, 1-15. Endler, N. S., Rushton, J. P., & Roediger, H. L. III. (1978). The productivity and scholarly impact (citations)
of British, Canadian and U.S. Departments of Psychology (1975). American Psychologist, 33, 1064-1082.
Fox, M.F. & Stephan, P.E. (2001). Careers of young scientists: Preferences, prospects, and realities by gender and field. Social Studies of Science, 31, 109-122.
Freeman, R. B. (1978) Discrimination in the academic marketplace. In T. Sowell (Ed.), American ethnic groups, (pp. 167-202). Washington, D.C.: Urban Institute.
Garfield, E. (1975). Highly cited articles: 19. Human psychology and behavior. Current Contents: Life Sciences, 18, 5-9.
Garfield, E. & Welljams-Dorof, A. (1992). Of Nobel class: A citation perspective on high impact research authors. Theoretical Medicine, 13, 118–126.
Gonzalez-Brambila, C. & Veloso, F.M. (2007). The determinants of research output and input: A study of Mexican researchers. Research Policy, 36, 1035-1051.
Gordon, R. A., & Vicari, P. J. (1992). Eminence in social psychology: a comparison of textbook citation, social sciences citation index, and research productivity rankings. Personality and Social Psychology Bulletin, 18, 26-38.
Gracza, T., & Somoskovi, I. (2007). Impact factor and/or Hirsch index? Orvosi Hetilap, 148, 849–852. Greenwald, A. G. (1980). The totalitarian ego: Fabrication and revision of personal history. American
Psychologist, 35, 603-618.
Greenwald, A. G., McGhee, D. E., & Schwartz, J. K. L. (1998). Measuring individual differences in implicit cognition: The Implicit Association Test. Journal of Personality and Social Psychology, 74, 1464-1480.
Greenwald, A. G., & Schuh, E. S. (1994). An ethnic bias in scientific citations. European Journal of Social Psychology, 24, 623-639.
Guyter, L., & Fidell, L. (1973). Publications of men and women psychologists. American Psychologist, 28, 157-160.
Harzing, A. W. (2009). Publish or Perish, version 2, available at http://www.harzing.com/pop.htm. Haslam, N., Ban, L., Kaufmann, L., Loughnan, S., Peters, K., Whelan, J., & Wilson, S. (2008). What makes
an article influential? Predicting impact in social and personality psychology. Scientometrics, 76, 169-185.
Helmreich, R. L., Spence, J. T., Beane, W. E., Lucker, G. W., & Matthews, K. A. (1980). Making it in academic psychology: Demographic and personality correlates of attainment. Journal of Personality and Social Psychology, 39, 896-908.
Hilbe, J. M. (2007). Negative Binomial Regression. Cambridge, UK: Cambridge University Press. Hirsch, J. E. (2005). An index to quantify an individual’s scientific research output. Proceedings of the
National Academy of Sciences, 102, 16569-16572. Hirsch, J. E. (2007). Does the h-index have predictive power? Proceedings of the National Academy of
Sciences, 104, 19193-19198. Iglesias, J. E., & Pecharroman, C. (2007). Scaling the h-index for different scientific ISI fields.
Scientometrics, 73, 303-320. Imperial, J. & Rodriguez-Navarro, A. (2007). Usefulness of Hirsch’s h-index to evaluate scientific research
in Spain. Scientometrics, 71, 271-282. Jensen, P., Rouquier, J-B., & Croissant, Y. (2009). Testing bibliometric indicators by their prediction of
scientists promotions. Scientometrics, 78, 467-479. Jin, B., Liang, L., Rousseau, R., & Egghe, L. (2007). The R- and ARindices: Complementing the h-index.
Chinese Science Bulletin, 52, 855–863. Joy, S. (2006). What should I be doing, and where are they doing it? Scholarly productivity of academic
psychologists. Perspectives on Psychological Science, 1, 346-364. Kelly, C.D., & Jennions, M.D. (2006). The h index and career assessment by numbers. Trends in Ecology &
Evolution, 21, 167–170. Levitt, J.M., & Thelwall, M. (2007). Two new indicators derived from the h-index for comparing citation
impact: Hirsch Frequencies and the Normalised Hirsch Index. In D. Torres-Salinas & H.F. Moed (Eds.), Proceedings of the 11th Conference of the International Society for Scientometrics and Informetrics (Vol. 2, pp. 876–877). Madrid, Spain: Spanish Research Council (CSIC).
Long, J.S. (1992). Measures of sex differences in scientific productivity. Social Forces, 71, 159-178. Mauleaon, E. & Bordons, M. (2006). Productivity, impact, and publication habits by gender in the area of
Materials Science. Scientometrics, 66, 199-218. Meho, L.I., & Yang, K. (2007). A new era in citation and bibliometric analyses: Web of Science, Scopus,
and Google Scholar. Journal of the American Society for Information Sci and Tech, 58, 2105–2125. Moed, H. F. (2005). Citation analysis in research evaluation. Dordrecht, Netherlands: Springer. Moravcsik, M. J. & Murugesan, P. (1975). Some results on the function and quality of citations. Social
Studies of Sciences, 5, 86–92. Myers, C. R. (1970). Journal citations and scientific eminence in contemporary psychology. American
Psychologist, 25, 1041-1048. Nettles, M. T. & Perna, L. W. (1995). Sex and race differences in faculty tenure, rank, and productivity:
Why on average, do women, African Americans, and Hispanics have lower salaries, tenure, and rank. Paper presented at Association for Study of Higher Education 20th Annual Conference.
Nosek, B. A. (2005). Moderators of the relationship between implicit and explicit evaluation. Journal of Experimental Psychology: General, 134, 565-584.
Nosek, B. A. (2007). Implicit-explicit relations. Current Directions in Psychological Science, 16, 65-69. Ostriker, J. P., Holland, P. W., Kuh, C. V., & Voytuk, J. A. (2009). A guide to the methodology of the NRC
assessment of doctorate programs. Washington, DC: National Academic Press. Perlman, D. (1984). Recent developments in personality and social psychology: a citation analysis.
Personality and Social Psychology Bulletin, 10, 492-501. Phillips, N. (2007). Citation Counts, Prestige Measurement, and Graduate Training in Social Psychology.
Dialogue, 22(2), 24-26. Pion, G. M., Mednick, M. T., Astin, H. S., Hall, C. C., Kenkel, M. B., Keita, G. P., Kohout, J. L. & Kelleher, J.
C. (1996). The shifting gender composition of psychology trends and implications for the discipline, American Psychologist, 51, 509-528.
Rafky, D. M. (1972). The attitude of Black scholars toward the Black colleges. Journal of Negro Education, 41, 320-330.
Robinson, D. N. (2003). Impact as substance and as fashion. In R. J. Sternberg (Ed.), Anatomy of impact: What has made the great works of psychology great? (pp. 197-212). Washington, DC: American Psychological Association.
Rodgers, R. C. & Maranto, C. C. (1989). Causal models of academic productivity in psychology. Journal of Applied Psychology, 74, 636,-649.
Ross, L., & Ward, A. (1996). Naïve realism in everyday life: Implications for social conflict and misunderstanding. In E. S. Reed, E. Turiel, & T. Brown (Eds.), Values and knowledge (pp. 103-135). Hillsdale, NJ: Lawrence Erlbaum Associates, Inc.
Sandström, U. (2009). Combining curriculum vitae and bibliographic analysis: Mobility, gender, and research performance. Research Evaluation, 18, 135-142.
Sax, L. J., Hagedorn, L. S., Arredondo, M., & Dicrisi, F. A. (2002). Faculty research productivity: Exploring the role of gender and family-related factors. Research in Higher Education, 43, 423-446.
Schreiber, M. (2008). A modification of the h-index: The hm-index accounts for multiauthored manuscripts. Journal of Infometrics, 2, 211-216.
Schubert, A., & Braun, T. (1993). Reference standards for citation based assessments. Scientometrics, 26, 21-35.
Simonton, D. K. (1992). Leaders of American psychology, 1879–1967: Career development, creative output, and professional achievement. Journal of Personality and Social Psychology, 62, 5–17.
Stack, S. (2002) Gender and scholarly productivity: the case of criminal justice. Journal of Criminal Justice, 30, 175-182.
Sternberg, R. J. (2003). Afterword: How much impact should impact have? In R. J. Sternberg (Ed.), Anatomy of impact: What has made the great works of psychology great? (pp. 223–228). Washington, DC: American Psychological Association.
Sternberg, R. J., Gordeeva, T. (1996). The anatomy of impact: What makes an article influential? Psychological Science, 7, 69–75.
Tesser, A., & Bau, J. J. (2002). Social psychology: Who we are and what we do. Personality and Social Psychology Review, 6, 72-85.
Tversky, A., & Kahneman, D. (1974). Judgment under uncertainty: Heuristics and biases. Science, 185, 1124-1131.
van Raan, A. F. J. (2005). Measurement of central aspects of scientific research: performance, interdisciplinarity, structure. Measurement, 3, 1-19.
Wanner, R. A., Lewis, L. S. & Gregorio, D. I. (1981). Research productivity in academia: A comparative study of the Sciences, Social Sciences and Humanities. Sociology of Education, 54, 238-253.
Xie, Y. & Shauman,K.A. (1998). Sex differences in research productivity: New evidence about an old puzzle? American Sociological Review, 63, 847-870.
Zhang, C-T. (2009). The e-index, complementing the h-index for excess citations, PLoS ONE, 5, e5429.
Appendix A. Top 10% of individual scientists on cumulative impact indicators (standardized scores). Rank Name, Institution (PhD year) I cumulative citation count e-index h-index h m-index
61 Andrew Elliot, University of Rochester (1994 PhD) 1.30 1.09 1.50 1.46 1.14
62 Charles Judd, University of Colorado-Boulder (1976 PhD) 1.29 1.08 1.42 1.60 1.08
Appendix B. Top 10% of individual scientists on career-stage impact indicators (standardized scores). Rank Name, Institution (PhD year) I CS cites CS e CS h CS h m.CS
1 Andrew Elliot, University of Rochester (1994 PhD) 2.07 2.06 1.95 2.14 2.11
2 Seth Kalichman, University of Connecticut (1990 PhD) 1.92 1.89 1.25 2.19 2.36
31 University of Oregon 6 21.3 0.51 0.62 0.76 0.26 0.43
32 Northeastern 4 25.5 0.51 0.58 0.63 0.51 0.31
33 Dartmouth College 4 16.8 0.50 0.81 0.97 0.44 -0.21
34 University of Kansas 9 16.1 0.47 0.29 0.11 0.78 0.69
35 University of Connecticut 10 25.7 0.43 0.55 0.46 0.37 0.35
36 University of Georgia 4 18.5 0.42 0.30 0.16 0.57 0.66
37 Princeton 10 22.3 0.40 0.39 0.42 0.33 0.47
38 Waterloo 9 22.8 0.39 0.47 0.50 0.36 0.22
39 Texas A&M 7 13.8 0.36 0.24 0.21 0.55 0.45
40 Michigan State University 7 13.3 0.36 0.34 0.35 0.27 0.47
41 University of Iowa 7 22.4 0.33 0.22 0.09 0.44 0.59
42 University of Maryland 4 30.5 0.32 0.33 0.44 0.27 0.23
43 University of Arizona 4 14.8 0.30 0.15 0.13 0.40 0.52
44 Kent State University 3 17.7 0.27 0.58 0.66 0.30 -0.44
45 UC San Diego 5 20.5 0.26 0.01 -0.07 0.33 0.78
46 New York University 12 24.7 0.24 0.22 0.26 0.13 0.33
47 University of Tennessee-Knoxville 3 9.0 0.23 0.31 0.41 -0.05 0.28
48 Purdue University 9 21.9 0.23 0.21 0.33 0.19 0.18
49 Tufts 3 13.0 0.17 0.05 0.11 0.38 0.13
Appendix E. Top 50% of social programs combining cumulative and career-stage impact indicators.
Rank Univesity # of facultyaverage years
since PhDDaggregate Dcumulativ e DCS
1 University of Michigan 15 26.4 2.19 3.81 0.57
2 UCLA 13 22.5 1.72 2.76 0.69
3 Harvard University 9 24.9 1.67 1.97 1.36
4 UC Davis 11 23.7 1.46 2.14 0.78
5 Stanford 9 28.6 1.43 2.29 0.57
6 University of British Columbia 9 14.9 1.20 0.75 1.64
7 University of Rochester 4 32.3 1.19 0.79 1.58
8 New York University 12 24.7 1.15 2.07 0.24
9 UC Berkeley 7 18.4 1.11 0.72 1.50
10 Yale 6 26.0 1.11 1.19 1.02
11 University of Connecticut 10 25.7 1.03 1.64 0.43
12 University of Virginia 7 19.6 1.03 0.63 1.44
13 Carnegie Mellon 5 21.9 1.01 0.69 1.32
14 Columbia University 7 22.7 0.99 1.16 0.81
15 University of Missouri 6 16.5 0.94 0.15 1.72
16 Univ of Minnesota-Twin Cities 9 25.2 0.85 1.17 0.52
17 Duke 6 22.5 0.82 0.40 1.25
18 Ohio State University 7 21.4 0.77 0.91 0.64
19 Princeton 10 22.3 0.77 1.15 0.40
20 UC Santa Barbara 9 24.6 0.76 0.91 0.61
21 Florida State 5 15.6 0.76 0.19 1.32
22 Univ of Texas-Austin 6 18.2 0.68 0.35 1.02
23 Waterloo 9 22.8 0.67 0.96 0.39
24 UC Irvine 8 23.9 0.67 0.81 0.52
25 Univ of Massachusetts-Amherst 9 20.2 0.59 1.14 0.03
26 University of Chicago 3 16.7 0.56 -0.17 1.29
27 University of Iowa 7 22.4 0.56 0.79 0.33
28 Northwestern University 7 16.0 0.52 0.26 0.77
29 University of Oregon 6 21.3 0.51 0.51 0.51
30 University of Colorado-Boulder 7 21.0 0.50 0.21 0.78
31 Arizona State 11 25.2 0.48 1.05 -0.09
32 University of Toronto 15 20.0 0.47 1.26 -0.32
33 University of Kansas 9 16.1 0.43 0.38 0.47
34 Univ of Illinois-Urbana-Champaign 8 17.4 0.40 0.12 0.68
35 Rutgers 10 29.8 0.38 1.05 -0.29
36 Washington University in St Louis 4 18.8 0.25 -0.44 0.94
37 Univ of North Carolina-Chapel Hill 6 18.0 0.25 -0.19 0.68
38 Purdue University 9 21.9 0.24 0.26 0.23
39 Simon Fraser University 4 18.0 0.23 -0.57 1.03
40 Iowa State 9 16.1 0.17 0.44 -0.10
41 Claremont Graduate University 3 30.0 0.11 -0.34 0.56
42 Northeastern 4 25.5 0.11 -0.30 0.51
43 University of Western Ontario 7 25.6 0.10 0.09 0.11
44 University of Utah 8 22.3 0.07 0.04 0.10
45 Michigan State University 7 13.3 0.05 -0.26 0.36
46 University of Maryland 4 30.5 0.05 -0.23 0.32
47 UC Riverside 9 22.0 0.02 0.38 -0.34
48 Texas A&M 7 13.8 0.02 -0.33 0.36
49 University of Wisconsin-Madison 3 19.3 0.01 -0.67 0.68
Table 1. Individual indicator symbols and calculations
Symbol Calculation
citation
countsum of citation counts for all works by the individual identified in Publish or Perish
e e is square root of the (sum of citations of all works contributing to h minus h 2)
hh is the highest number for which h works have been cited at least h times (also based on
works identified in Publish or Perish )
h m h m is the sum of works contributing to h fractionalized by the number of authors
I cumulative average of the four indicators above after standardizing each separately (M = 0, SD = 1)
cites CS
cites CS = log(citation count ) – *5.461 + (current year – PhD year + 1)*.0803+; presented in
standardized units in article (original M = 7.16, SD = 1.55); constants are the intercept and
slope estimates from a regression of years since PhD predicting log(citation count ) of this
sample of 611 scientists
e CS
e CS = log(e ) – *2.505 + (current year – PhD year + 1)*.0383+; presented in standardized units
in article (original M = 3.31, SD = 0.81); constants are the intercept and slope estimates from
a regression of years since PhD predicting log(h ) of this sample of 611 scientists
h CS
h CS = log(h ) – *1.929 + (current year – PhD year + 1)*.0413+; presented in standardized units
in article (original M = 2.81, SD = 0.76); constants are the intercept and slope estimates from
a regression of years since PhD predicting log(h ) of this sample of 611 scientists
h m.CS
h m.CS = log(h m ) – *1.220 + (current year – PhD year + 1)*.0485+; presented in standardized
units in article (original M = 2.24, SD = 0.83); constants are the intercept and slope estimates
from a regression of years since PhD predicting log(h ) of this sample of 611 scientists
I CS average the four indicators above after standardizing each separately (M = 0, SD = 1)
Figure 1. Total citations for individual scientists by years since PhD. Notes: Thicker line is estimated regression line calculated with log(total citations) and converted back to raw units. Thinner line is estimates of +/- 1 SD of residuals around the log(total citations) regression line, such that approximately 68% of scientists are estimated to have total citation counts between those lines. Figure 2. Total citations for individual scientists with 10 or fewer years since PhD. Notes: Regression lines are estimates from entire sample. Thicker line is estimated regression line calculated with log(total citations) and converted back to raw units. Thinner line is estimates of +/- 1 SD of residuals around the log(total citations) regression line, such that approximately 68% of scientists are estimated to have total citation counts between those lines.