46
Brian Donovan Healthcare Pricing Office 25 May 2016

Brian Donovan
Healthcare Pricing Office 25 May 2016

2
• The aims of this presentation are
To detail the steps in moving from Block Funding to an ABF budget allocation To explore the methodologies and tools employed in benchmarking To introduce the idea of Transition Adjustments

The next series of slides will introduce, define and illustrate the following terms which are used in benchmarking and ABF in general. ◦ Block Funding
◦ Activity Based Funding (ABF)
◦ Expenditure Data
◦ Costing Data (Specialty Costing and Patient Level Costing)
◦ DRG Price Setting
◦ ABF DRG Revenue ( Weighted Units)
◦ Setting Activity Targets (HIPE Data)
◦ ABF Co Payments
◦ Transition Adjustments (Benchmarking)
◦ Monthly Reporting
Additional definitions will be introduced later in the presentation.
3

The term block funding refers to the practice of allocating funding to hospitals based on their budget for the previous year with some adjustments made for factors such as inflation, expected service levels, reconfiguration and available overall budget.
Block funding of hospitals does not explicitly take the type and complexity of patients treated into account.
Block Funding is in effect an incremental basis of funding
To date hospitals in Ireland have been funded on a block funding basis.
4
Activity based funding (ABF) is a general term for the provision of funding to hospitals based on the number and mix of patients that they treat.
In January 2016 the first ABF based budgets were allocated to hospitals
This represents a major change in the way hospitals are funded in Ireland and puts the allocating of funding on a more transparent and equitable footing.
ABF is essentially funding patients rather than institutions
5

ABF revenue is defined as the amount of money a hospital could expect to be paid under an ABF model given their mix of cases.
As only inpatient and daycase activity are currently covered by ABF, only activity in these areas would attract ABF revenue.
ABF revenue is broadly the funding that a hospital receives through the DRG.
ABF Revenue also contains co payments for High cost Oncology Drugs, Tertiary Referral and Specialist Paediatric Adjustment and Agency. ◦ Details on these adjustments are covered in later slides.
6

The block grant to a hospital is defined as the portion of the hospital’s funding which is provided on a non-ABF basis. i.e. it is block funded.
Up to 2015 100% of a Irish hospitals funding was allocated through a block grant.
From January 2016 hospitals are funded partially on an ABF basis (inpatients and daycases) and partially through a block grant (all other areas).
In 2016 the split between ABF and block funding is around 69% ABF 31% block though this varies from hospital to hospital.
The ABF % ranges from 35% in Louth County to 85% in Kilcreene
7
For the purpose of this presentation a hospital’s gross expenditure is defined as the total cost of running the hospital in a given year excluding expenditure on capital items.
The gross expenditure does not take income generated by the hospital (for example from providing services to external bodies, private patient fees, ED fees etc.) into account and therefore represents the true total non-capital cost of running the hospital.
The Gross expenditure in ABF hospitals in 2015 was €4.77 bn and ranged from around €16m in Kilcreene to €402m in St. James.
8

Currently the scope of ABF is inpatient and daycase activity in the 38 ABF hospitals. ED and outpatients are currently not covered.
This means that in order to assess a hospital’s position under an ABF model (i.e. compare revenue vs expenditure) we need to isolate the component of expenditure which relates to the treatment of inpatient and daycase patients only.
This leads to the current definition of ABF expenditure as the portion of a hospital’s total expenditure which relates to the treatment of inpatients and daycases.
The ABF expenditure in ABF hospitals in 2015 was in the region of €3.34bn and ranged from around €10m in Louth County to €263m in CUH.
9

Non-ABF or “Block” expenditure is defined as a hospital’s total expenditure minus their ABF expenditure.
This is the portion of a hospital’s total expenditure which relates to non-ABF activity which currently means any expenditure not related to the treatment of inpatients and daycases.
10

Benchmarking
11

In 2014 and 2015 an exercise was undertaken with the aim of ◦ estimating the financial positions of hospitals if they were funded under an ABF
model and
◦ gaining a better understanding of the factors driving the resulting positions of each hospital.
This exercise differed from the old Casemix budget model methodology in that instead of describing a prior years position it aimed to take account of the most up to date activity and expenditure figures in order to predict likely positions at the and of the current year.
This exercise which was undertaken by the HPO is called benchmarking.
12

Total Expenditure
= €100m
ABF Expenditure
= €70m
Non-ABF
Expendit
ure=
€30m
13
Total Revenue
= €98m
ABF Revenue
= €68m
Block
Grant
= €30M
Gap = €2m

This is defined as the difference between ABF expenditure and ABF revenue. i.e. the Gap
It represents the financial position of a hospital in a ABF system.
In the context of the previous example, benchmarking is concerned with ◦ Calculating the ABF expenditure (€70m) and the ABF revenue (€68m) and
finding the gap (€2m)
14

Expenditure
15

There are two main sources of expenditure data used in the benchmarking exercises.
CRS ◦ Finance system for reporting hospital income and expenditure
Specialty Costing Files ◦ HPO system for capturing hospital expenditure
16

Hospitals gross expenditure and income figures are captured on the CRS system on a monthly basis.
However, this figure is not broken down into expenditure by patient type i.e. inpatient, daycase ED, OPD, other.
Therefore CRS can give us up to date gross expenditure figures but not ABF expenditure figures.
17

The HPO specialty costing files capture hospital expenditure on an annual basis.
These files break down the expenditure to a level which allows for the identification of those costs relating only to ABF work (i.e. inpatients and daycases).
Therefore the specialty costing files can give us ABF expenditure figures but they are not current.
18

In order to overcome the short comings with each of these systems the two are combined.
The specialty costing data allows us to estimate the ABF component of gross expenditure.
The ABF % is calculated from the specialty costing and applied to the up to date gross expenditure figures from CRS to estimate the up to date ABF expenditure
As usual things aren’t quite that simple ◦ The gross expenditure reported in CRS contains items which are not included in
specialty costing so adjustments are required to account for this.
19
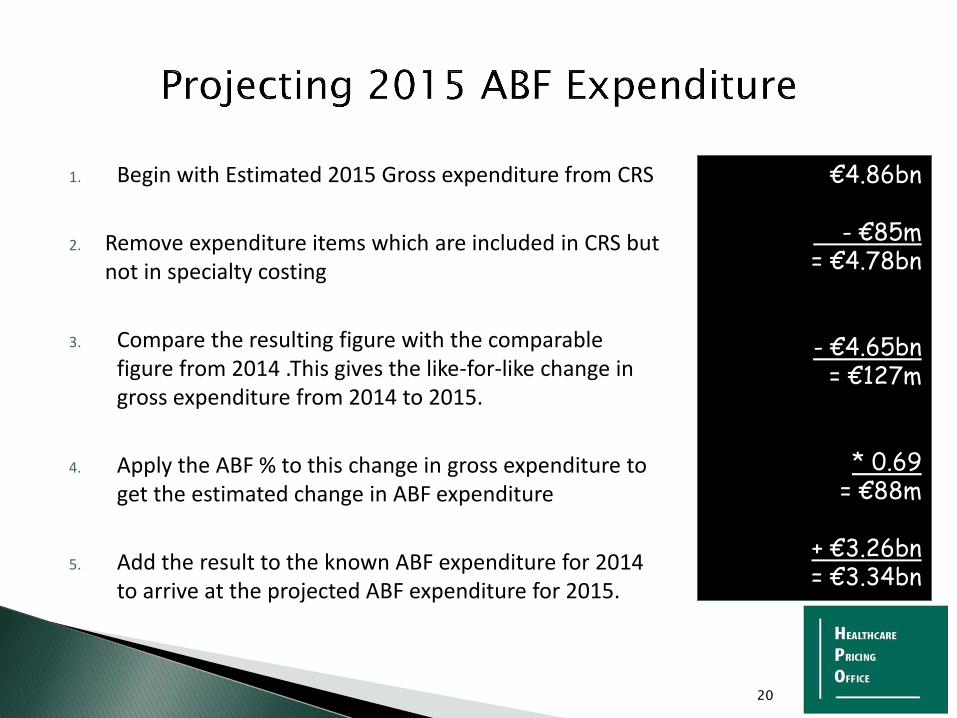
1. Begin with Estimated 2015 Gross expenditure from CRS
2. Remove expenditure items which are included in CRS but not in specialty costing
3. Compare the resulting figure with the comparable figure from 2014 .This gives the like-for-like change in gross expenditure from 2014 to 2015.
4. Apply the ABF % to this change in gross expenditure to get the estimated change in ABF expenditure
5. Add the result to the known ABF expenditure for 2014 to arrive at the projected ABF expenditure for 2015.
20
€4.86bn
- €85m = €4.78bn
- €4.65bn = €127m
* 0.69 = €88m
+ €3.26bn = €3.34bn

ABF Revenue
21

The main source of ABF Revenue derives from DRG’S
All patients discharged from hospital are assigned to one and only one DRG
Patients are assigned to the DRG’S based on a number of criteria including age, sex, diagnosis and procedures carried out during the stay.
The DRG system allows for different level of complexities to cater for the fact that some patients have complications and co-morbididities that add to the cost of their stay.
HIPE coders assign codes based on the diagnosis and procedures a patient
The DRG Classification system assign the patient to a DRG based on these codes.
The HIPE system is used to collect the data from each hospital
22
ABF Funding calculated based on an activity target
Target calculated based on the 12 months ended 31 October 2015 (Latest 12 months in Dec 15)
Monthly profile of activity available which will be used to compare actual performance against target on a monthly basis
Hospitals must now carry out the targeted level of activity to receive the funding.
Activity target expressed in terms of weighted units and not cases
23

The HPO sets prices for each DRG on an annual basis. (There are 695 inpatient and 330 daycase DRG’S in the Australian DRG Classification).
Prices are calculated based on the Patient Level costings provided by hospitals and the HIPE activity.
Each DRG has a weighted unit score ◦ Eg Hip Replacement – ccc = 2.45
◦ Liver Transplant = 18.93
◦ Average = 1
One inpatient weighted unit = €4,217
One Daycase unit = € 549
A Hospitals total DRG Revenue is calculated by multiplying the cases in each DRG by the price of that DRG.
24

ABF Co Payments
25

Early on in the benchmarking exercise a number of possible factors were identified as likely to impact on the hospitals’ “gap” in the exercise.
Some of these were ◦ Tertiary Referral Status
◦ Specialist Paediatric Status
◦ High Cost Drugs
◦ Agency Costs
◦ Coding/chart documentation (Covered earlier by Deirdre)
26

It is generally recognised that both tertiary referral centres and specialist paediatric hospitals bear additional costs which are not sufficiently well funded through the DRG system.
In order to take these additional costs into account for benchmarking purposes estimates were made of the additional costs involved and these were deducted from the ABF expenditure for the relevant hospitals
The adjustments were initially calculated based on base price differentials between groups of hospitals from the old Casemix system
27

The total amounts allocated for the 2015 benchmarking were €98m and €44m for tertiary referral and specialist paediatric hospitals respectively.
The tertiary referral and specialist paediatric adjustments are cost adjustments.
In effect they reduce the amount of ABF expenditure which is to be funded through the DRGs which in turn reduces the base prices.
28

Hospitals meeting 3 of the 4 criteria below are eligible for a tertiary referral adjustment ◦ Model 4 hospitals
◦ Gross expenditure > €150m
◦ > 20,000 WU (overnight, non-maternity)
◦ CMI > 1
Eight hospitals received the Tertiary Referral Adjustments based on the above criteria.
Just two hospitals receive the Specialist Paediatric adjustment – Temple Street and OLH Crumlin.
29

The issue with high cost drugs is that when they are used to treat only a small cohort of patients in a particular DRG they distort the average cost and therefore the price paid.
As only certain hospitals dispense these drugs this can lead to systematic over or under funding.
The main issue in Ireland is that we don’t have either a list of high cost drugs or a means of capturing details of their use at the patient level.
However……. the NCCP were able to provide us with a list by hospital of their high cost oncology drug spend for 2012 - 2014 and for part of 2015. A methodology was developed to remove these costs from the DRG price and fund the drugs through an ABF adjustment.
30
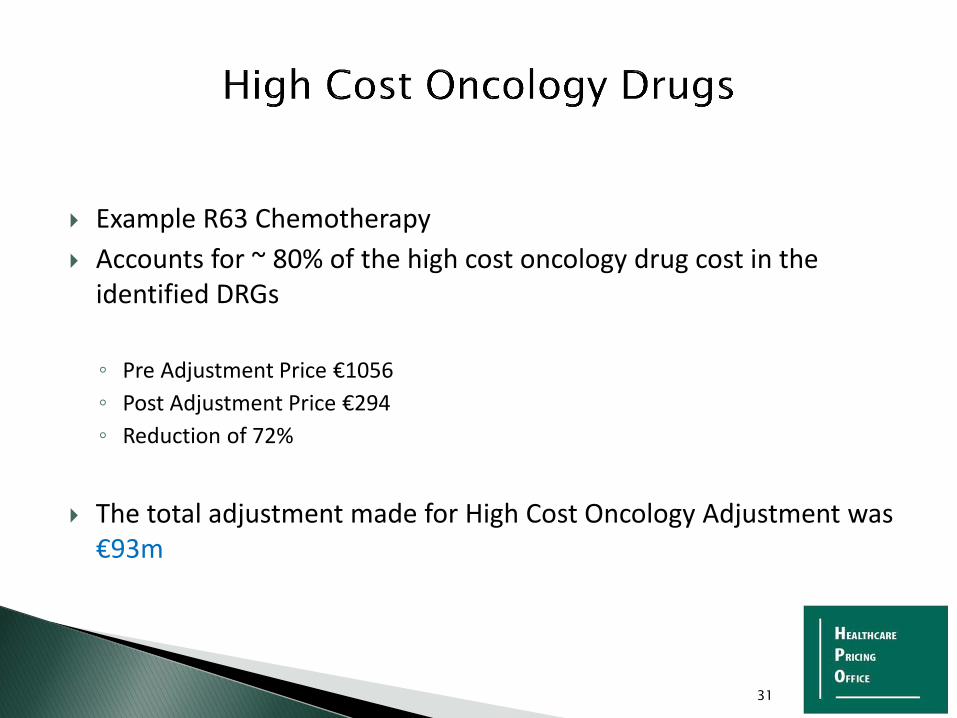
Example R63 Chemotherapy
Accounts for ~ 80% of the high cost oncology drug cost in the identified DRGs
◦ Pre Adjustment Price €1056
◦ Post Adjustment Price €294
◦ Reduction of 72%
The total adjustment made for High Cost Oncology Adjustment was €93m
31
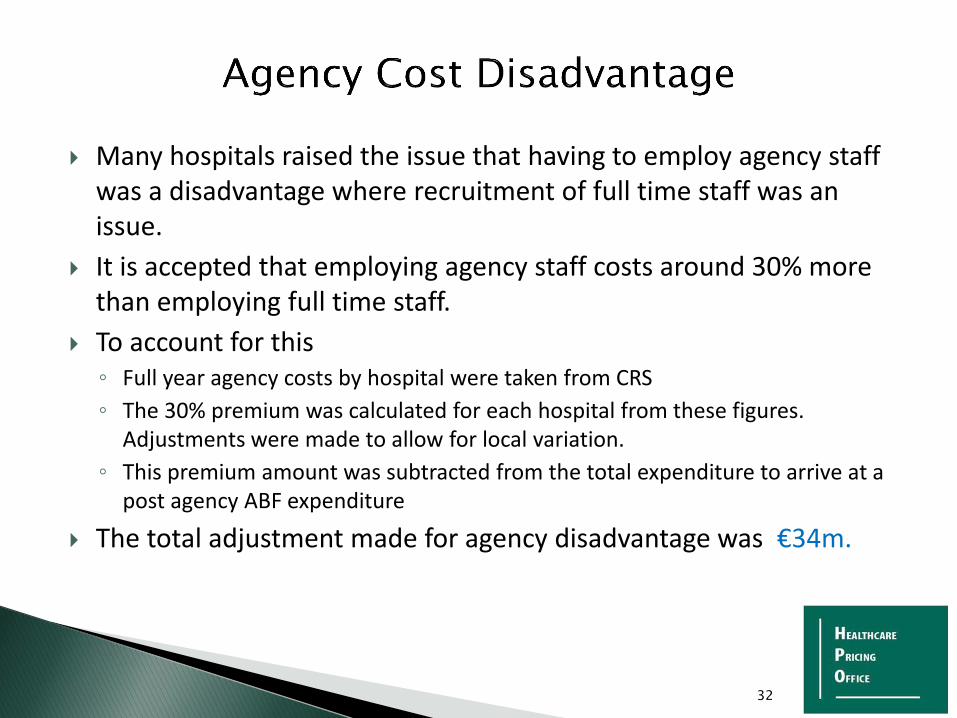
Many hospitals raised the issue that having to employ agency staff was a disadvantage where recruitment of full time staff was an issue.
It is accepted that employing agency staff costs around 30% more than employing full time staff.
To account for this ◦ Full year agency costs by hospital were taken from CRS
◦ The 30% premium was calculated for each hospital from these figures. Adjustments were made to allow for local variation.
◦ This premium amount was subtracted from the total expenditure to arrive at a post agency ABF expenditure
The total adjustment made for agency disadvantage was €34m.
32

The term transition adjustment refers to the adjustment made to a hospital’s budget to cover the gap between ABF expenditure and ABF revenue.
Transition adjustments are typically made in the early phases of ABF implementation to allow hospitals time to address any cost or efficiency issues before they are exposed to the full impact of ABF funding. ◦ Hospitals with ABF Revenue which is less than their ABF expenditure need to
receive a transition adjustment to cover the gap between expenditure and revenue.
◦ Hospitals with ABF revenue greater than ABF expenditure revenue have a negative transition adjustment again to cover the gap.
◦ The transition adjustments are budget neutral at the national level and are equivalent to the old Casemix Adjustments.
◦ The transition adjustments for 2016 are the 2015 benchmarking positions.
33

-4000
-3000
-2000
-1000
0
1000
2000
3000
Below Avg Coding Above Avg Coding Net
Funding in an
ABF envoirnment
35

Although benchmarking gives us a picture of how hospitals would perform under an ABF model it doesn’t address the issue of how to allocate the funding in practice.
The move from using DRGs to retrospectively measure efficiency to using DRGs to prospectively allocate funding raised issues which until recently did not need to be considered.
Breaking up the old historical block grant budgets and replacing them with ABF based budgets for 2016 has been a huge technical challenge involving multiple HSE stakeholders including HPO, HSE Corporate Finance, Acute Services.
36
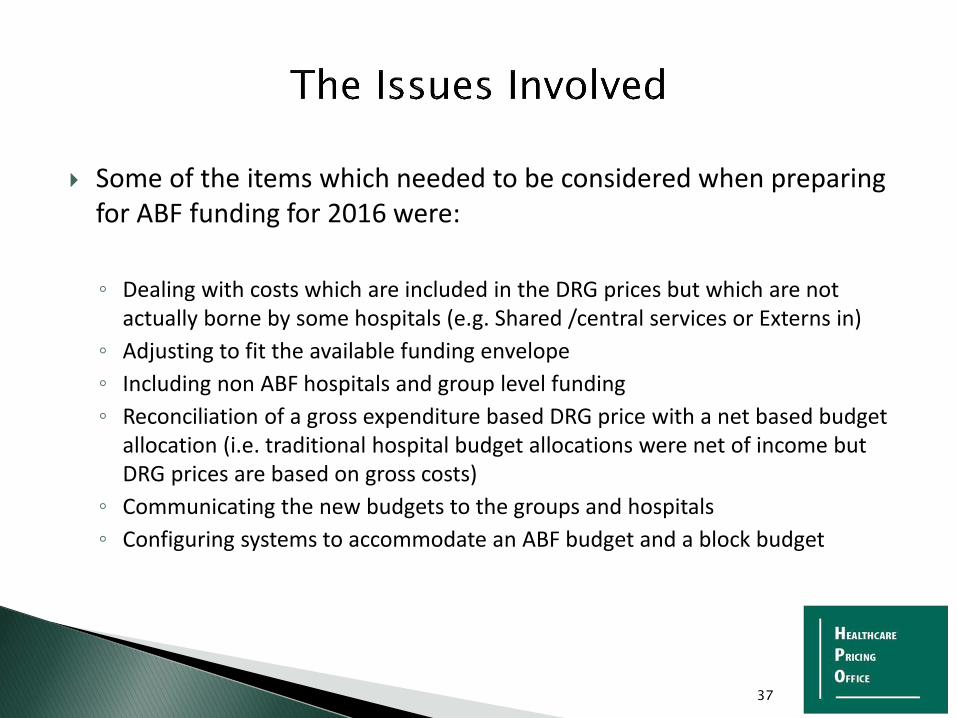
Some of the items which needed to be considered when preparing for ABF funding for 2016 were:
◦ Dealing with costs which are included in the DRG prices but which are not
actually borne by some hospitals (e.g. Shared /central services or Externs in)
◦ Adjusting to fit the available funding envelope
◦ Including non ABF hospitals and group level funding
◦ Reconciliation of a gross expenditure based DRG price with a net based budget allocation (i.e. traditional hospital budget allocations were net of income but DRG prices are based on gross costs)
◦ Communicating the new budgets to the groups and hospitals
◦ Configuring systems to accommodate an ABF budget and a block budget
37

Through the specialty costing and PLC costing processes we are trying to obtain the full cost for providing care within a particular DRG even if that full cost is not borne entirely by the hospital. E.g.
◦ IT and other services provided centrally by the HSE and not paid for by the hospital (Shared Services)
◦ Work carried out by a consultant in who is paid by another hospital (Externs in)
The result of this is that we have a set of DRG prices which reflect full costs and some hospitals who don’t bear that full cost.
Rather than having different DRG prices for hospitals who avail of central or external services we simply subtract the value of these services from their ABF revenue.
For example a hospital with an ABF revenue of €100m which receives central/external services to the value of €5m will actually receive €95m in ABF revenue.
38

1. Take our 2015 ABF Expenditure Figure
2. Subtract off externs in @ ABF %
3. Subtract off central services @ ABF%
4. The result is the new amount to be funded through ABF
39
€3.34bn
-€28.4m
-€17.8m
=€3.30bn

Although the introduction of ABF has enabled us to quantify the work carried out by acute hospitals in terms of cost and volume, in reality the available funding envelope may not be enough to cover the full cost.
For instance the available funding envelope for 2016 is €5.13bn.
The amount relating to ABF hospitals is €4.77bn which is allocated to €3.23bn through ABF and €1.53bn through the block.
In order to work within the available funding envelope the base prices and various adjustments all need to be deflated by a fixed factor.
40

Start with the available ABF funding envelope
Divide this by the the 2015 ABF expenditure figure after all adjustments have been applied
The resulting factor is applied to all of the components of the ABF budget ◦ DRG revenue, Tertiary referral, paediatric, HCD,
agency
And the deductions ◦ externs, central services
This factor is also applied to the block grant.
This means that in 2016 we must deliver the 2015 ELS with a 2 % (1.958%) reduction in expenditure.
41
€3.23bn/ €3.30bn
~0.98

The benchmarking exercises only looked at the funding of ABF hospitals.
However in reality budgets are allocated to all hospitals, to the group and to Acute Services nationally.
In the 2016 ABF budget make up the budget allocations to non-ABF hospitals were allocated through the block funding stream.
Therefore each hospital group received a budget comprising of: ◦ ABF Hospitals (ABF and block allocation)
◦ Non-ABF Hospitals (block allocation only)
◦ Central budget allocation (block allocation only)
42

Both the DRG price setting and the benchmarking processes are based on gross costs. ◦ No account is taken of the income that hospitals generate from patient charges
To date hospital budget allocations have been given in net terms along with the income target.
For 2016 the budget allocations were communicated in gross terms along with the income target to arrive at a net figure.
43

Due to the change in funding arrangements for 2016, the budget allocations to each hospital were communicated through a budget pack to each hospital group.
The packs consisted of a series of tables indicating 1. The build-up of ABF revenue and gross budget allocation
2. The traditional budget make up (with income included for comparison purposes)
3. The income budget
4. The activity target (Cases and WUs)
5. Comparison of 2014 and 2015 activity levels
In addition, the groups were issued a set of tables which outlined each step of the budget setting process.
44

What is the result of all of this?
A shift from historical block grant funding to ABF
2016 hospital budget allocations which are made up of ABF and block components.
ABF budget components which are directly linked to a specified level of activity (weighted units)
A mechanism whereby hospitals’ financial performance can be monitored along side their activity levels as part of the monthly reporting process
45

Slide 46


![005014908 00124 - National Archives of Ireland · Terence. [121 Effects £2,729 5B. DONOVAN Michael. Effects £87 DONOVAN Michael, [1011 Effects £82. DONOVAN Patrick, [24] Effects](https://static.documents.pub/doc/80x56/5ec604f05638540e6d6ee584/005014908-00124-national-archives-of-terence-121-effects-2729-5b-donovan.jpg)
