Bridge Information Modeling: Opportunities, Limitations, and Spanning the Chasm with Current Tools Francesca Maier, PE – Parsons Brinckerhoff CI1529 With 3D structural analysis being the norm and with a rapidly growing implementation of bridge asset management systems, the market is poised for an explosive adoption of Bridge Information Modeling (BrIM). However, there is no single black-box information model that incorporates hydraulic and structural analysis, geometric design, and plans production—and much less structural detailing! This class will create a process map for bridge design that identifies data exchanges from conception through construction. It will look at owners' bridge management information needs and what data should flow to the operation and maintenance (O&M) phase. Taking into consideration appropriate Autodesk® tools for bridge design and analysis, such as AutoCAD® Civil 3D® software, AutoCAD® Revit® Structure software, and their various extensions and analysis modules, the class will offer best practices for creating a workflow to meet the owner's, contractor's and designer's needs. We won't necessarily have all the answers, but we'll contemplate some thought-provoking questions. Learning Objectives At the end of this class, you will be able to: List the component processes to bridge design Identify the data exchanges that occur in the bridge asset lifecycle Identify software products that fit into a bridge information modeling workflow Develop bridge information modeling process maps to fit your bridge projects About the Speaker Francesca is a civil/utilities modeling expert in PB’s Virtual Design and Construction group, providing civil modeling support, implementation planning and model management on VDC/BIM projects throughout the US. Francesca is an Autodesk® Approved Instructor with experience in applying Autodesk® technology on transportation, bridge, tunnel, water resources and other infrastructure projects. She provides instruction on AutoCAD® and AutoCAD® Civil 3D® software in support of the Autodesk® Authorized Training Center at Parsons Brinckerhoff. Francesca is committed to sharing knowledge within Parsons Brinckerhoff and the wider community. She leads Parsons Brinckerhoff’s Civil 3D user group and coordinates monthly webinars for her global colleagues on VDC/BIM topics. Francesca has been published in AUGIWorld magazine and has taught undergraduate students in an ABET-accredited engineering program about CADD and BIM. [email protected]
Transcript
Bridge Information Modeling: Opportunities, Limitations, and Spanning the Chasm with Current Tools Francesca Maier, PE – Parsons Brinckerhoff
CI1529 With 3D structural analysis being the norm and with a rapidly growing implementation of bridge asset management systems, the market is poised for an explosive adoption of Bridge Information Modeling (BrIM). However, there is no single black-box information model that incorporates hydraulic and structural analysis, geometric design, and plans production—and much less structural detailing! This class will create a process map for bridge design that identifies data exchanges from conception through construction. It will look at owners' bridge management information needs and what data should flow to the operation and maintenance (O&M) phase. Taking into consideration appropriate Autodesk® tools for bridge design and analysis, such as AutoCAD® Civil 3D® software, AutoCAD® Revit® Structure software, and their various extensions and analysis modules, the class will offer best practices for creating a workflow to meet the owner's, contractor's and designer's needs. We won't necessarily have all the answers, but we'll contemplate some thought-provoking questions.
Learning ObjectivesAt the end of this class, you will be able to:
List the component processes to bridge design
Identify the data exchanges that occur in the bridge asset lifecycle
Identify software products that fit into a bridge information modeling workflow
Develop bridge information modeling process maps to fit your bridge projects
About the Speaker Francesca is a civil/utilities modeling expert in PB’s Virtual Design and Construction group, providing civil modeling support, implementation planning and model management on VDC/BIM projects throughout the US.
Francesca is an Autodesk® Approved Instructor with experience in applying Autodesk® technology on transportation, bridge, tunnel, water resources and other infrastructure projects. She provides instruction on AutoCAD® and AutoCAD® Civil 3D® software in support of the Autodesk® Authorized Training Center at Parsons Brinckerhoff.
Francesca is committed to sharing knowledge within Parsons Brinckerhoff and the wider community. She leads Parsons Brinckerhoff’s Civil 3D user group and coordinates monthly webinars for her global colleagues on VDC/BIM topics. Francesca has been published in AUGIWorld magazine and has taught undergraduate students in an ABET-accredited engineering program about CADD and BIM.
Bridge Information Modeling: Opportunities, Limitations, and Spanning the Chasm with Current Tools
2
IntroductionOne of the tenants of Building Information Modeling (BIM) is that you start with the end in mind. In that spirit, this presentation will start with looking at the data needs of bridge owners during the operations and maintenance phase. With an understanding of how bridges are managed, as well as the issues facing bridge owners, we will turn our attention to design and construction of bridges and how we can improve upon those processes.
This presentation will draw upon a wealth of resources from the United States only.
Common Understanding of Terms“Bridge Information Modeling” is the application of Building Information Modeling to Bridges. Before we get started, let’s set a baseline for terms.
Building Information Modeling (BIM)There are numerous formal definitions of BIM from succinct sentences to page-long descriptions. Instead of defining BIM, let’s look at some of the hallmarks of BIM. No single hallmark constitutes BIM, and omission of any hallmark does not discount BIM.
Goal-oriented
Parametric 3D geometric design
Integrated analysis and design
Single source of data
Multidisciplinary collaboration
Lifecycle view
Constantly seeking improvement
BridgeWhen we picture a bridge, we usually envision a signature structure; like the majestic Sydney Harbour Bridge, the Golden Gate Bridge, or the Brooklyn Bridge. Sometimes we think of bridges framed in notoriety, like the Tacoma Narrows Bridge. Few people even notice most of the bridges they cross every day on their commute. The average span length of all bridges in the United States is around 200 ft (about 60 m). Most bridges are short, straight, single-span bridges over roads or small rivers. Designing, constructing, operating and maintaining the majority of the nation’s bridge inventory is quite different to designing, constructing, operating and maintaining the type of bridge that is featured on a calendar.
Bridge Information Modeling: Opportunities, Limitations, and Spanning the Chasm with Current Tools
3
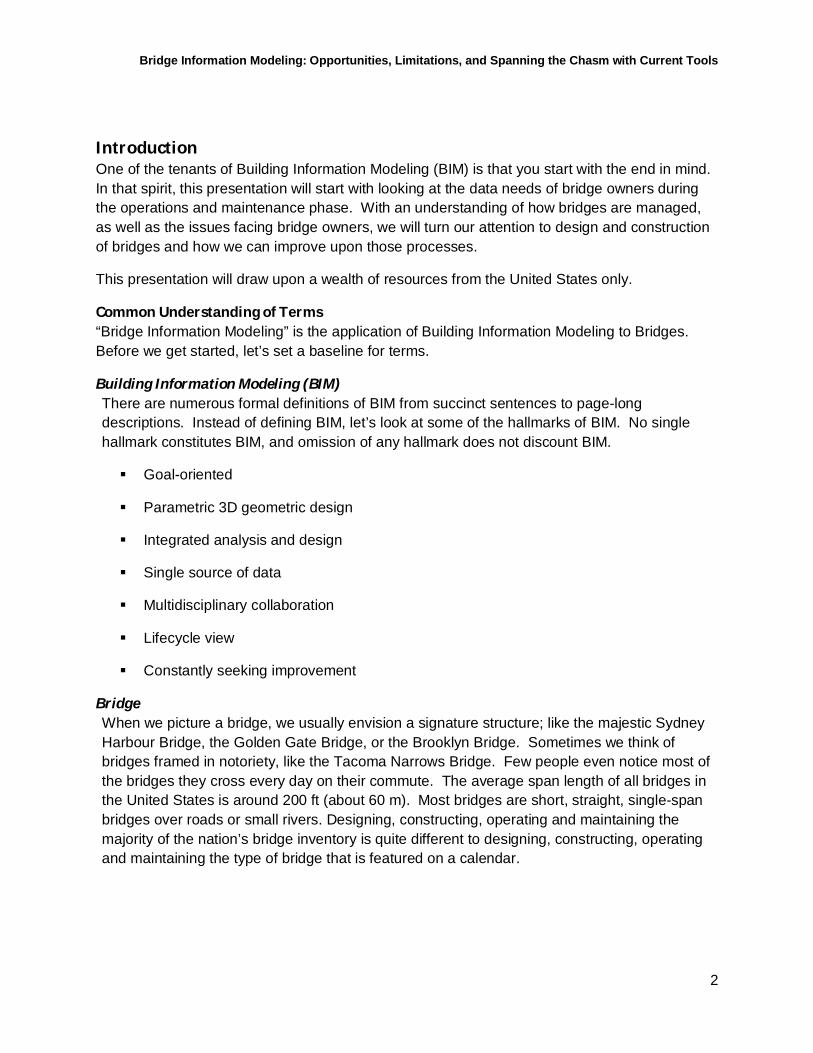
Bridge Data Needs in the Operations Management PhaseThe Federal-Aid Highway Act of 1970 introduced the requirement for standardized bridge inspections and originated the National Bridge Inventory (NBI), a nationwide inventory of bridge assets and their condition assessment1. The NBI established Commonly Recognized bridge Elements (CoRE) that had to be individually inspected and assessed.
Figure 1: NBI Commonly Recognized Elements
In 1990, as Geographic Information Systems (GISs) began to emerge, the Federal Highway Administration (FHWA) created the first version of Pontis, a Bridge Management System (BMS). Pontis was an improvement over the NBI for owners because the inspection data format was more disaggregate and the condition assessment more meaningful. With the power of a GIS database to manage their bridge data, bridge owners began to manipulate their data beyond NBI reporting and reuse it to great effect.
The de facto standard for BMSs, Pontis allows owners to store, retrieve and query their bridge inspection data in myriad ways. Now part of the American Association of State Highway Officials (AASHTO) AASHTOWare, the software includes localized cost data for bridge maintenance or replacement cost-benefit analyses. There is a sufficient description of the bridge elements to perform structural analysis, using element properties modified based on the condition of the elements at their most recent inspection. If we look at the hallmarks of BIM, we can see that how bridge owners manage their bridge data checks most of the boxes.
The industry is now moving into the next generation of BMSs, with web server-based, customized wrapper GIS databases that support all Pontis functionality, as well as bespoke tables, queries and reports for owners. Inspectors can view each element’s record, populate inspection report forms and upload photographs from the field. Some of these databases incorporate a 3D model of the structure. The most sophisticated of these databases even include live monitoring of “Smart Bridge” monitoring systems.
1 A non-affiliated site that maintains a data dictionary for the NBI is located at http://nationalbridges.com/nbiDesc.html. If you are interested in the NBI data, you can download csv-format data by state or for the whole inventory and the data dictionary will help you query it.
Bridge Information Modeling: Opportunities, Limitations, and Spanning the Chasm with Current Tools
4
It is abundantly clear that bridge owners value data and are very adept at finding creative ways to reuse it. Owners are already talking about extending their BMSs to include “cradle to grave” data about a structure; incorporating the National Environmental Protection Act (NEPA) documents, design documents, structural analysis outputs, construction materials reports and other data into their BMSs. As we move forward with Bridge Information Modeling, we need to keep at the forefront of our minds how to push our data into the owner’s BMS.
New Era of Bridge DesignLet’s return for a moment to the NBI. My favorite report from the NBI is a simple bar graph in Figure 2 below. The figure shows the total number of structures and the number of deficient structures by year constructed. The “deficient” structures include both structurally deficient and functionally obsolete structures. These are bridges that are a high priority for repair or replacement, either because they are reaching the end of their safe operating life or are too narrow, not high enough above the floodplain or otherwise no longer suited to their current use.
Figure 2: Bridges by Year Built
Through December 31, 2011, there were about 605,000 bridges in the National Bridge Inventory. Approximately 144, 000 of them (about 25%) were deficient.
0
10,000
20,000
30,000
40,000
50,000
60,000
All Bridges (605,000)
Deficient Bridges (144,000)
Bridge Information Modeling: Opportunities, Limitations, and Spanning the Chasm with Current Tools
5
One of the things that immediately pops out at me when I look at Figure 2 is that the number of bridges built in the past 5 years is about half as many as the preceding periods until as far back as World War II. The spiraling construction costs in the mid-2000s construction boom and the fiscal constraints following the global financial crisis continue to plague bridge owners. Just as bridge owners are facing a growing maintenance and replacement burden, market conditions make it more difficult to execute that work.
When we think back to the golden age of bridge construction; the bridges around New York, San Francisco, the Sydney Harbour Bridge… These were all green fields construction projects.
Figure 3 & 4: Golden Gate Bridge and Manhattan Bridge Construction
That era has passed, for the most part. Bridge construction projects nowadays are typically maintenance or replacement projects. They occur on or adjacent to facilities in active use by thousands of people every day and some are tolled. The sites are highly constrained, frequently limited to a narrow strip of right-of-way and often in dense, urban areas. The challenges facing bridge engineers of the past – structural analysis of complex structures without the aid of calculators or computers – are long since replaced with the challenge of constructability and minimizing construction impacts for the communities that the bridge serves.
Construction materials have changed over time. In the past five years, the first highway and railroad bridges built from recycled plastic have been put into service. The proliferation of steel fabrication heralded the dawn of long span bridge construction. However, with the global urban population set to more than double in the next 30 years, steel is now a resource that is much more constrained with prices that fluctuate readily based on international demand.
The total cost and predictability of materials cost isn’t the only factor influencing the choice of construction material – after all, concrete bridges have a great deal of reinforcing steel in them. According to the NBI, concrete bridges outnumber steel bridges by 2:1, but for the subset of structurally deficient bridges, steel bridges outnumber concrete bridges by 1.5:1. Put another way, about 1 in 20 concrete bridges is structurally deficient, compared with about 1 in 5 steel bridges.
Bridge Information Modeling: Opportunities, Limitations, and Spanning the Chasm with Current Tools
6
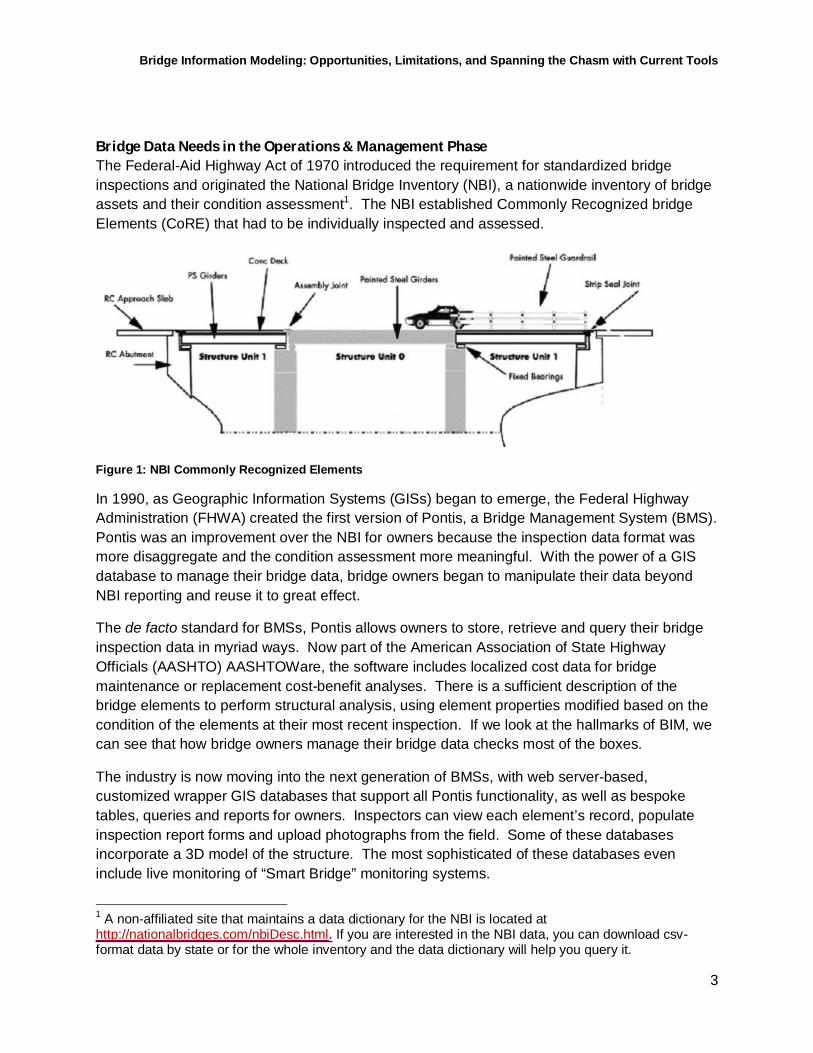
When you consider the inspection and maintenance burden of a steel truss bridge like the old San Francisco-Oakland Bay Bridge east span, it is easy to understand why it is being replaced with a cable stayed concrete box girder bridge with a fraction of the number of individual structural members.
Figure 5: San Francisco-Oakland Bay Bridge
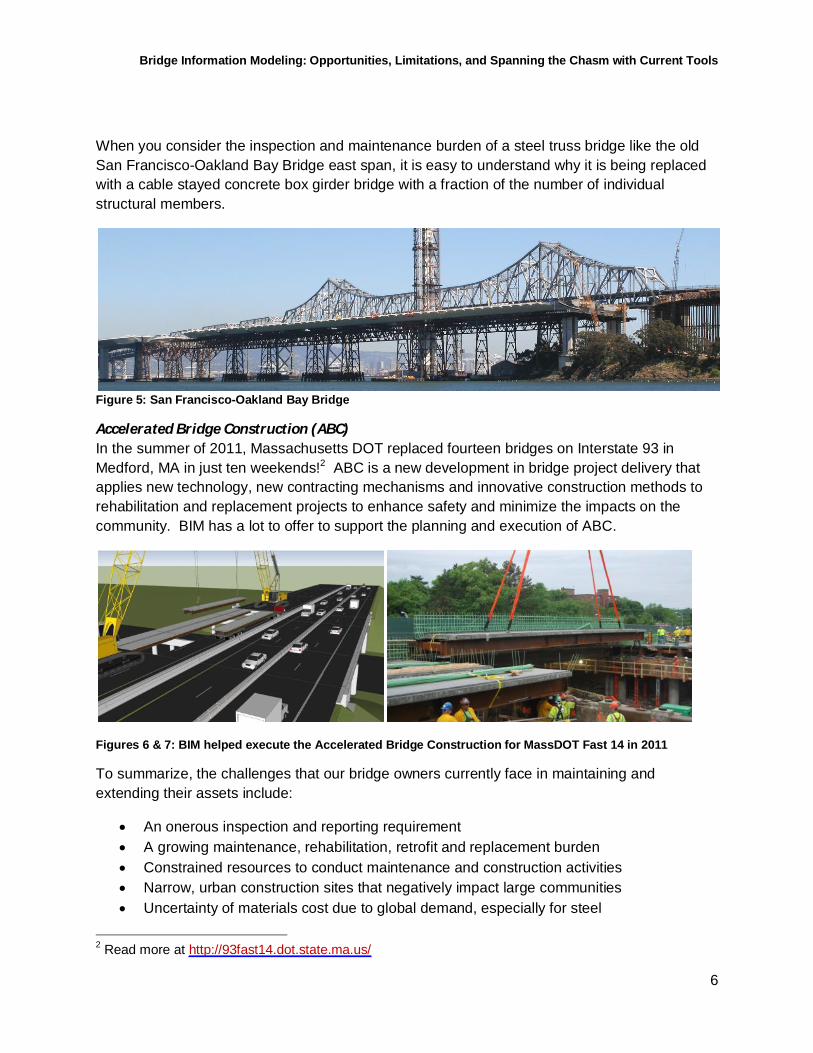
Accelerated Bridge Construction (ABC)In the summer of 2011, Massachusetts DOT replaced fourteen bridges on Interstate 93 in Medford, MA in just ten weekends!2 ABC is a new development in bridge project delivery that applies new technology, new contracting mechanisms and innovative construction methods to rehabilitation and replacement projects to enhance safety and minimize the impacts on the community. BIM has a lot to offer to support the planning and execution of ABC.
Figures 6 & 7: BIM helped execute the Accelerated Bridge Construction for MassDOT Fast 14 in 2011
To summarize, the challenges that our bridge owners currently face in maintaining and extending their assets include:
An onerous inspection and reporting requirement A growing maintenance, rehabilitation, retrofit and replacement burden Constrained resources to conduct maintenance and construction activities Narrow, urban construction sites that negatively impact large communities Uncertainty of materials cost due to global demand, especially for steel
Bridge Information Modeling: Opportunities, Limitations, and Spanning the Chasm with Current Tools
7
Moving forward, to better serve our bridge owning clients, we need to be mindful of these challenges in our approach to design and construction project delivery. Our solutions need to consider the whole lifecycle costs, the predictability of construction materials costs, and how we can minimize the impact of construction upon the communities.
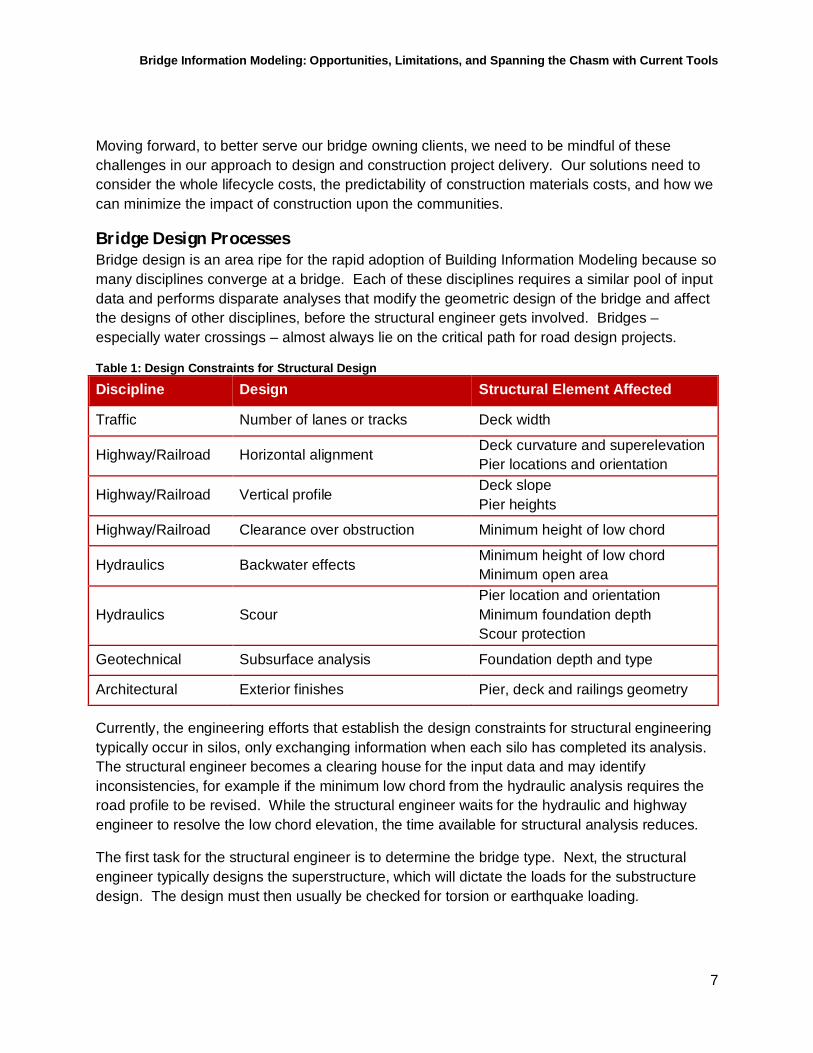
Bridge Design ProcessesBridge design is an area ripe for the rapid adoption of Building Information Modeling because so many disciplines converge at a bridge. Each of these disciplines requires a similar pool of input data and performs disparate analyses that modify the geometric design of the bridge and affect the designs of other disciplines, before the structural engineer gets involved. Bridges – especially water crossings – almost always lie on the critical path for road design projects.
Table 1: Design Constraints for Structural Design
Discipline Design Structural Element Affected
Traffic Number of lanes or tracks Deck width
Highway/Railroad Horizontal alignment Deck curvature and superelevation Pier locations and orientation
Highway/Railroad Clearance over obstruction Minimum height of low chord
Hydraulics Backwater effects Minimum height of low chord Minimum open area
Hydraulics Scour Pier location and orientation Minimum foundation depth Scour protection
Geotechnical Subsurface analysis Foundation depth and type
Architectural Exterior finishes Pier, deck and railings geometry
Currently, the engineering efforts that establish the design constraints for structural engineering typically occur in silos, only exchanging information when each silo has completed its analysis. The structural engineer becomes a clearing house for the input data and may identify inconsistencies, for example if the minimum low chord from the hydraulic analysis requires the road profile to be revised. While the structural engineer waits for the hydraulic and highway engineer to resolve the low chord elevation, the time available for structural analysis reduces.
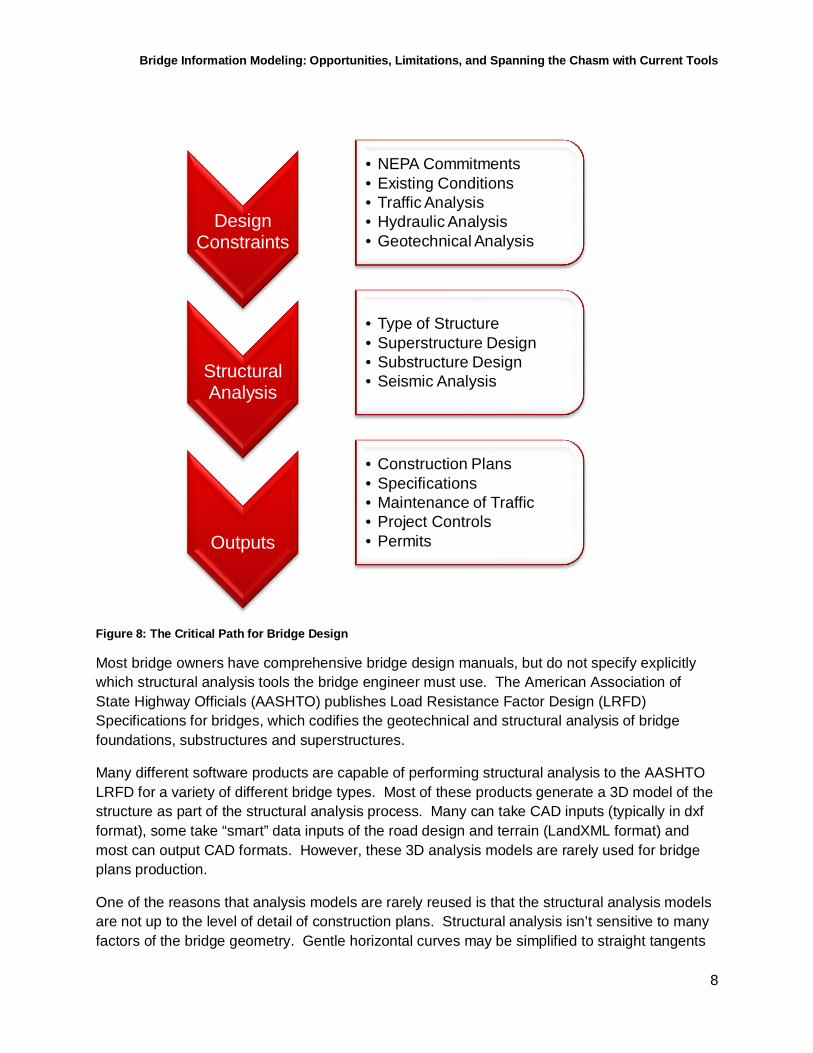
The first task for the structural engineer is to determine the bridge type. Next, the structural engineer typically designs the superstructure, which will dictate the loads for the substructure design. The design must then usually be checked for torsion or earthquake loading.
Bridge Information Modeling: Opportunities, Limitations, and Spanning the Chasm with Current Tools
8
Figure 8: The Critical Path for Bridge Design
Most bridge owners have comprehensive bridge design manuals, but do not specify explicitly which structural analysis tools the bridge engineer must use. The American Association of State Highway Officials (AASHTO) publishes Load Resistance Factor Design (LRFD) Specifications for bridges, which codifies the geotechnical and structural analysis of bridge foundations, substructures and superstructures.
Many different software products are capable of performing structural analysis to the AASHTO LRFD for a variety of different bridge types. Most of these products generate a 3D model of the structure as part of the structural analysis process. Many can take CAD inputs (typically in dxf format), some take “smart” data inputs of the road design and terrain (LandXML format) and most can output CAD formats. However, these 3D analysis models are rarely used for bridge plans production.
One of the reasons that analysis models are rarely reused is that the structural analysis models are not up to the level of detail of construction plans. Structural analysis isn’t sensitive to many factors of the bridge geometry. Gentle horizontal curves may be simplified to straight tangents
• Type of Structure• Superstructure Design• Substructure Design• Seismic Analysis
Outputs
• Construction Plans• Specifications• Maintenance of Traffic• Project Controls• Permits
Bridge Information Modeling: Opportunities, Limitations, and Spanning the Chasm with Current Tools
9
and the profile of the bridge deck may be simplified to horizontal. Architectural finishes are not structurally relevant beyond the weight they add. These shortcuts improve the efficiency of the structural analysis task. In a siloed workflow, there is little motivation for the structural engineer to enhance the accuracy of the 3D analysis model so that it may be reused.
Once the structural design is complete, the final design must be documented for construction. This requires plans production, writing specifications, performing quantity take-off to create a bid set, estimating the construction duration and cost, applying for permits, planning the maintenance of traffic and informing the community of the coming construction project. Of course, the design isn’t complete once the contract has been let.
It is typically up to the contractor to design the structural detailing because that design is a byproduct of how the contractor plans to build the structure. For instance, in a segmental concrete box girder bridge, the individual segment lengths, as well as whether they will be fabricated off-site or cast-in-place, may be left up to the contractor. The length and anchor points of the post-tension tendons will change depending on the segment length. The reinforcing design must fit around the post-tensioning, so it is inefficient and risky to have the design engineer produce these fabrication drawings except in a design-build delivery.
Goals for Bridge Information Modeling during the Design PhaseWe discussed initially how many of the issues that owners face are related to the construction and operations and maintenance phases, but BrIM has a lot to offer for the design phase, too. Some of the goals for BrIM during design may include:
Produce deliverables more efficiently
Shorten the critical path
Reduce uncertainty in project controls
Minimize the impact of construction
Reduce risk
Seed the BMS database
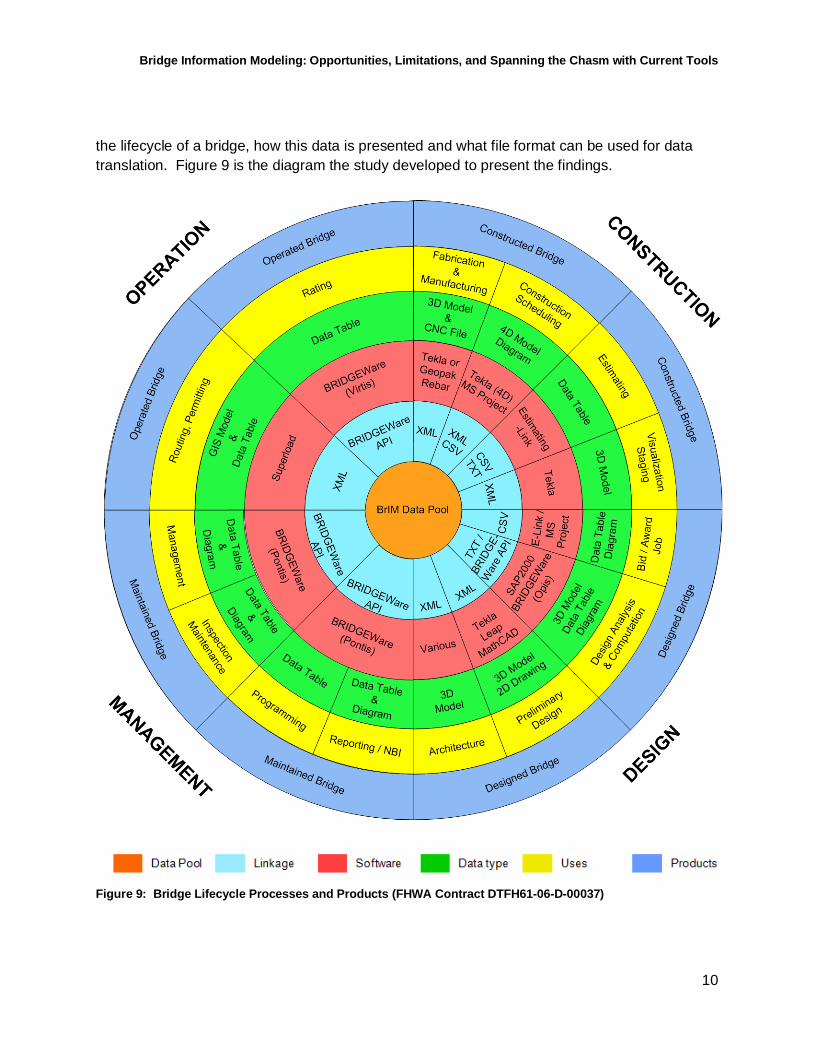
Data Exchanges in the Bridge LifecycleWe have already looked at the data needs and uses in the design, construction and O&M phases. Now let’s look at how a “single source of data” can help to increase efficiency. In 2006, the FHWA recognized that the state-of-the-practice in bridge management did not manage data efficiently and initiated a research project called Integrated Bridge Project Delivery and Life Cycle Management3. The study identified the type of data used during each phase in
3 For more information, see http://www.fhwa.dot.gov/bridge/integrated/flyer.pdf.
Bridge Information Modeling: Opportunities, Limitations, and Spanning the Chasm with Current Tools
10
the lifecycle of a bridge, how this data is presented and what file format can be used for data translation. Figure 9 is the diagram the study developed to present the findings.
Figure 9: Bridge Lifecycle Processes and Products (FHWA Contract DTFH61-06-D-00037)
Bridge Information Modeling: Opportunities, Limitations, and Spanning the Chasm with Current Tools
11
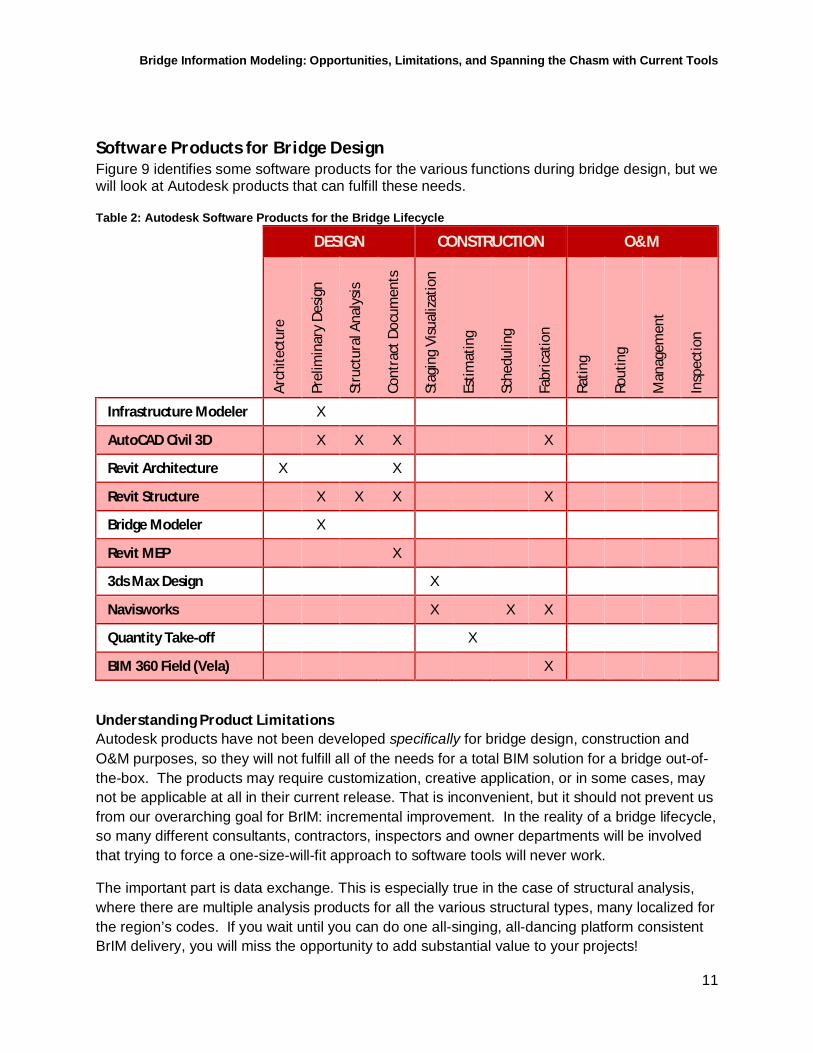
Software Products for Bridge DesignFigure 9 identifies some software products for the various functions during bridge design, but we will look at Autodesk products that can fulfill these needs. Table 2: Autodesk Software Products for the Bridge Lifecycle
DESIGN CONSTRUCTION O&M
Arc
hite
ctur
e
Pre
limin
ary
Desig
n
Str
uctu
ral A
naly
sis
Con
trac
t Doc
umen
ts
Sta
ging
Visu
aliza
tion
Est
imat
ing
Sch
edul
ing
Fab
ricat
ion
Rat
ing
Rou
ting
Man
agem
ent
Insp
ectio
n
Infrastructure Modeler X AutoCAD Civil 3D X X X X Revit Architecture X X Revit Structure X X X X Bridge Modeler X Revit MEP X 3ds Max Design X Navisworks X X X Quantity Take-off X BIM 360 Field (Vela) X
Understanding Product LimitationsAutodesk products have not been developed specifically for bridge design, construction and O&M purposes, so they will not fulfill all of the needs for a total BIM solution for a bridge out-of-the-box. The products may require customization, creative application, or in some cases, may not be applicable at all in their current release. That is inconvenient, but it should not prevent us from our overarching goal for BrIM: incremental improvement. In the reality of a bridge lifecycle, so many different consultants, contractors, inspectors and owner departments will be involved that trying to force a one-size-will-fit approach to software tools will never work.
The important part is data exchange. This is especially true in the case of structural analysis, where there are multiple analysis products for all the various structural types, many localized for the region’s codes. If you wait until you can do one all-singing, all-dancing platform consistent BrIM delivery, you will miss the opportunity to add substantial value to your projects!
Bridge Information Modeling: Opportunities, Limitations, and Spanning the Chasm with Current Tools
12
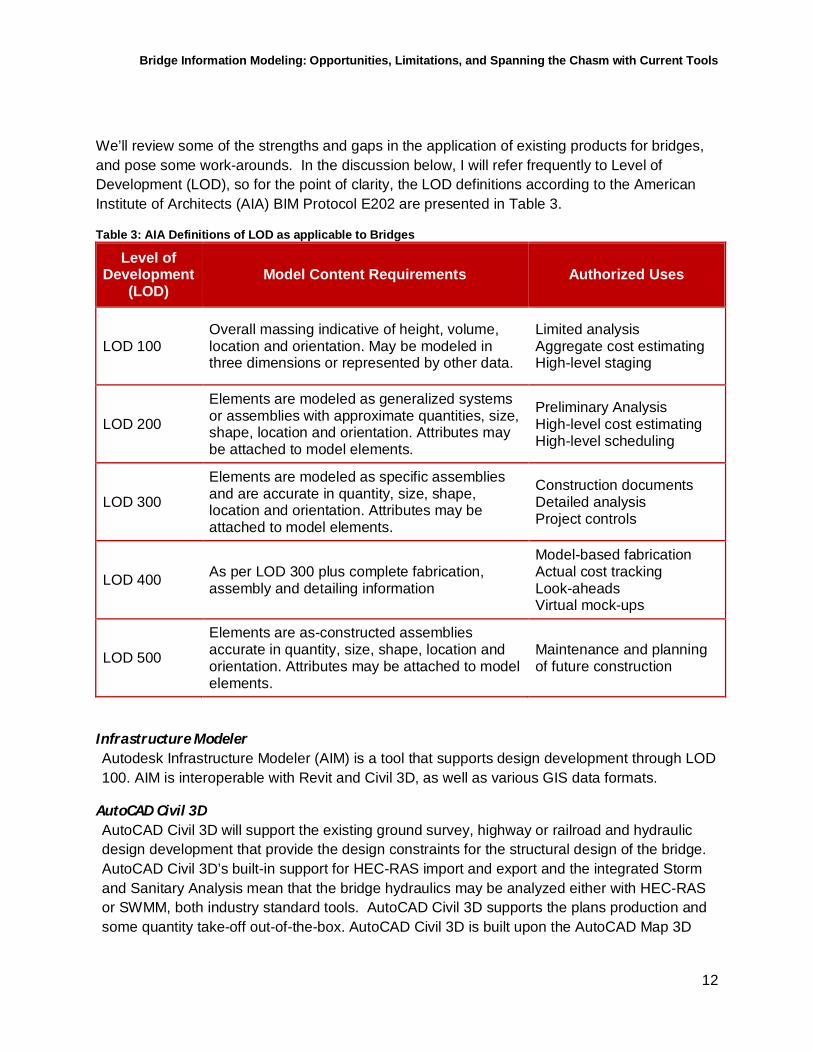
We’ll review some of the strengths and gaps in the application of existing products for bridges, and pose some work-arounds. In the discussion below, I will refer frequently to Level of Development (LOD), so for the point of clarity, the LOD definitions according to the American Institute of Architects (AIA) BIM Protocol E202 are presented in Table 3.
Table 3: AIA Definitions of LOD as applicable to Bridges
Level of Development
(LOD) Model Content Requirements Authorized Uses
LOD 100 Overall massing indicative of height, volume, location and orientation. May be modeled in three dimensions or represented by other data.
Elements are modeled as generalized systems or assemblies with approximate quantities, size, shape, location and orientation. Attributes may be attached to model elements.
Elements are modeled as specific assemblies and are accurate in quantity, size, shape, location and orientation. Attributes may be attached to model elements.
Construction documents Detailed analysis Project controls
LOD 400 As per LOD 300 plus complete fabrication, assembly and detailing information
Model-based fabrication Actual cost tracking Look-aheads Virtual mock-ups
LOD 500
Elements are as-constructed assemblies accurate in quantity, size, shape, location and orientation. Attributes may be attached to model elements.
Maintenance and planning of future construction
Infrastructure ModelerAutodesk Infrastructure Modeler (AIM) is a tool that supports design development through LOD 100. AIM is interoperable with Revit and Civil 3D, as well as various GIS data formats.
AutoCAD Civil 3DAutoCAD Civil 3D will support the existing ground survey, highway or railroad and hydraulic design development that provide the design constraints for the structural design of the bridge. AutoCAD Civil 3D’s built-in support for HEC-RAS import and export and the integrated Storm and Sanitary Analysis mean that the bridge hydraulics may be analyzed either with HEC-RAS or SWMM, both industry standard tools. AutoCAD Civil 3D supports the plans production and some quantity take-off out-of-the-box. AutoCAD Civil 3D is built upon the AutoCAD Map 3D
Bridge Information Modeling: Opportunities, Limitations, and Spanning the Chasm with Current Tools
13
platform, making it fully interoperable with most GIS data formats. AutoCAD Civil 3D also supports import and export of LandXML to exchange alignment, profile, surface and other data.
The AutoCAD Civil 3D Subassembly Composer (SAC) tool allows you to create custom, dynamic subassemblies. The SAC is a great tool for modeling retaining walls or abutment walls and bridge superstructures. It is possible to create box girder subassemblies that vary in width, depth and even the number of cells. SAC also lets you create subassemblies for beams, railings or for post-tensioning ducts. The Corridor Solids extension will export 3D solids or bodies of your corridor objects.
Revit ArchitectureAutodesk Revit Architecture lets you establish shared coordinates between Revit and AutoCAD Civil 3D to exchange models between the two products. Revit Architecture will support the design development of any architectural finishes on the superstructure and substructure.
Revit StructureRevit Structure natively supports many of the structural elements of bridges. Stock beam, slab, column and wall families can be modified to build the majority of most short-span bridge models.
Creating a LOD 300 model of the exterior finish of a complex bridge substructure is very well supported by Revit Structure, especially foundations where some stock families can be applied. Custom piers and abutments need to be modeled as Generic families, but even quite complex external geometry is typically parametric to a small set of dimensions. Generic families can host rebar, but they do not work well with the automatic rebar layout tools.
Revit Structure is less mature for true LOD 300 modeling on complex bridges, especially bridges that have parabolic post-tension tendon layouts, bridges with a (parabolic) vertical curve in the roadway and bridges with variable deck widths or complex horizontal curvature with spirals. Revit supports line and curve-based reference lines, but it does not support parabolic reference lines. If you have to deal with parabolic curvature, you need to import a 3D spline via CAD and use the pick lines tool to loft a Mass family. The latter limitation constrains how far you can progress the LOD of the model.
The biggest shortcoming of Revit for bridge plans production is that you cannot cut a curved section. If there is horizontal curvature in the bridge, you have to export the Revit mass to AutoCAD Civil 3D and project the mass onto your profile. However, the projection tool is not currently a true section, so this work-around is not yet fully dynamic and some manual drafting may be required for these complex bridges. Revit will get you most of the way to LOD 300 for bridges, but you will need to be creative and incorporate some manual processes in your workflow.
Bridge Information Modeling: Opportunities, Limitations, and Spanning the Chasm with Current Tools
14
Bridge Modeler Extension for Civil 3D and Revit StructureThe Bridge Modeler Extension for AutoCAD Civil 3D and Revit Structure is a tool that exchanges data between the two products at an object-based level. The extension takes an AutoCAD Civil 3D corridor region, reads the point codes on that region and creates a model of a bridge including abutments, piers, bearings, girders, a deck, barriers and roadway overlay. The tool supports girder bridges, concrete slab bridges and box girder bridges. The Bridge Modeler extension for Revit comes pre-loaded with bridge families for the elements it supports.
Bridge Modeler is very good for LOD 100 and for LOD 200 on the bridge types that it supports. However, it has some shortcomings for use in production and advanced design development toward LOD 300. The tool is not well documented in terms of the behind-the-scenes of converting a corridor region into a bridge, so there are issues with predictability. The tool does not support creating a single bridge from multiple corridor regions at this time. The main drawback of using Bridge Modeler is that it creates Mass families for the superstructure, doesn’t give you as much control on establishing shared coordinates, and does not set up any reference planes, lines or levels. This adds unpredictability to swapping out the mass families with stock beam or slab families without first creating these reference lines yourself.
Revit MEPBridges cross obstacles, and as a result, end up piggybacking a host of utilities, especially as Intelligent Transpiration and Smart Bridge technologies proliferate. Revit MEP is a good solution for planning the locations and detecting clashes between the various systems that the bridge must carry. It is also well suited to detailing bridge drainage structures and conduits like scuppers and downspouts.
Developing Process Flow MapEvery bridge project will be different. Some will be more different than others, but no two will be identical. Geotechnical conditions will differ; traffic volumes will make maintenance of traffic planning unique; the people involved in the design will have different strengths and preferences and the owner’s deliverable requirements will vary. Implementation planning is a very important component to delivering BrIM and a successful implementation plan will be developed with all the stakeholders in the room. Stakeholders include data originators and data consumers. Often the decisions regarding design processes are made in marketing meetings before the project is won. However, the reality that the processes are not ideal is merely a limitation to what can be achieved in the name of incremental improvement, the ultimate goal of BrIM.
BIM is Team SportNobody fully understands all the processes involved in designing a bridge, not even the project manager. You cannot develop the process flow map on your own. In my experience, engineers are quite open to water cooler questions about their design processes. However, the best place to iron out the process flow map is in a formal interdisciplinary meeting. The FHWA research on Integrated Bridge Project Delivery and Life Cycle Management is a great resource and provides two process flow maps for concrete and steel bridge design alternatives.
Bridge Information Modeling: Opportunities, Limitations, and Spanning the Chasm with Current Tools
15
Ultimately, you will develop two separate process flow maps. One will outline your Geometric Model, which is a LOD 300+ 3D model that is used for contract document preparation and in the planning and execution of the construction. The second will outline your Analysis Model, which will be much more variable depending on the type of structure, the local design codes and owner requirements.
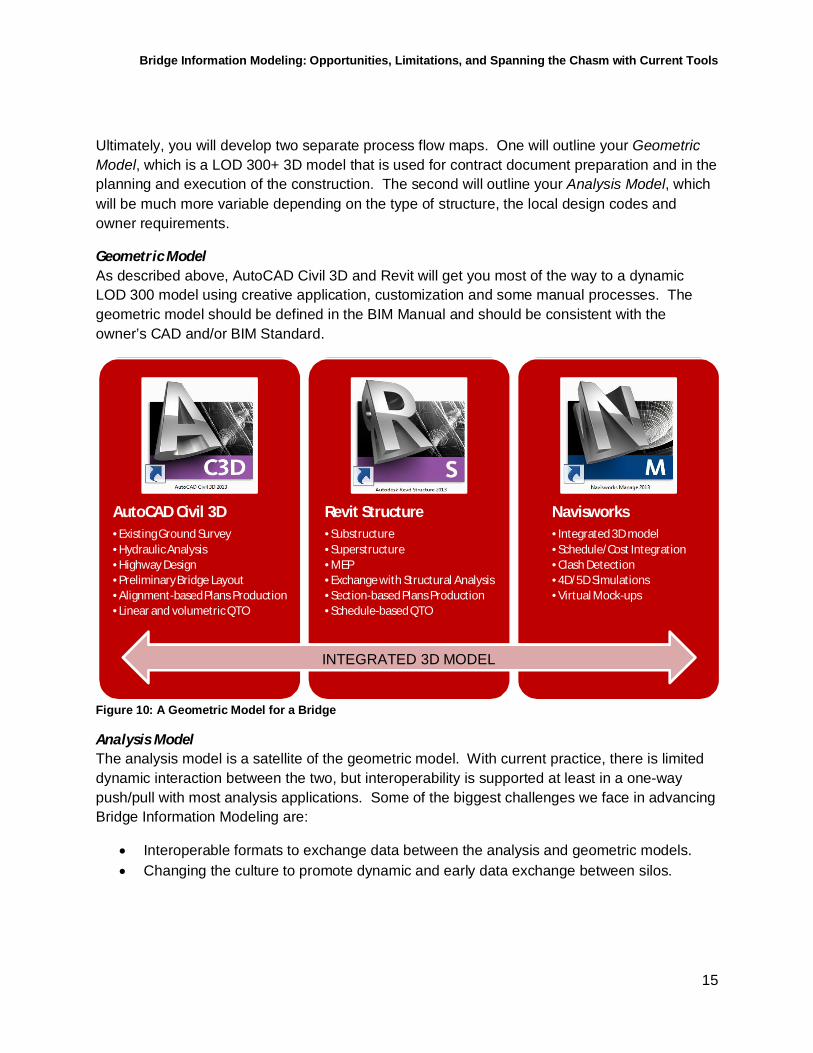
Geometric ModelAs described above, AutoCAD Civil 3D and Revit will get you most of the way to a dynamic LOD 300 model using creative application, customization and some manual processes. The geometric model should be defined in the BIM Manual and should be consistent with the owner’s CAD and/or BIM Standard.
Figure 10: A Geometric Model for a Bridge
Analysis ModelThe analysis model is a satellite of the geometric model. With current practice, there is limited dynamic interaction between the two, but interoperability is supported at least in a one-way push/pull with most analysis applications. Some of the biggest challenges we face in advancing Bridge Information Modeling are:
Interoperable formats to exchange data between the analysis and geometric models. Changing the culture to promote dynamic and early data exchange between silos.
Revit Structure•Substructure•Superstructure•MEP•Exchange with Structural Analysis•Section-based Plans Production•Schedule-based QTO
Navisworks•Integrated 3D model•Schedule/Cost Integration•Clash Detection•4D/5D Simulations•Virtual Mock-ups
INTEGRATED 3D MODEL
Bridge Information Modeling: Opportunities, Limitations, and Spanning the Chasm with Current Tools
16
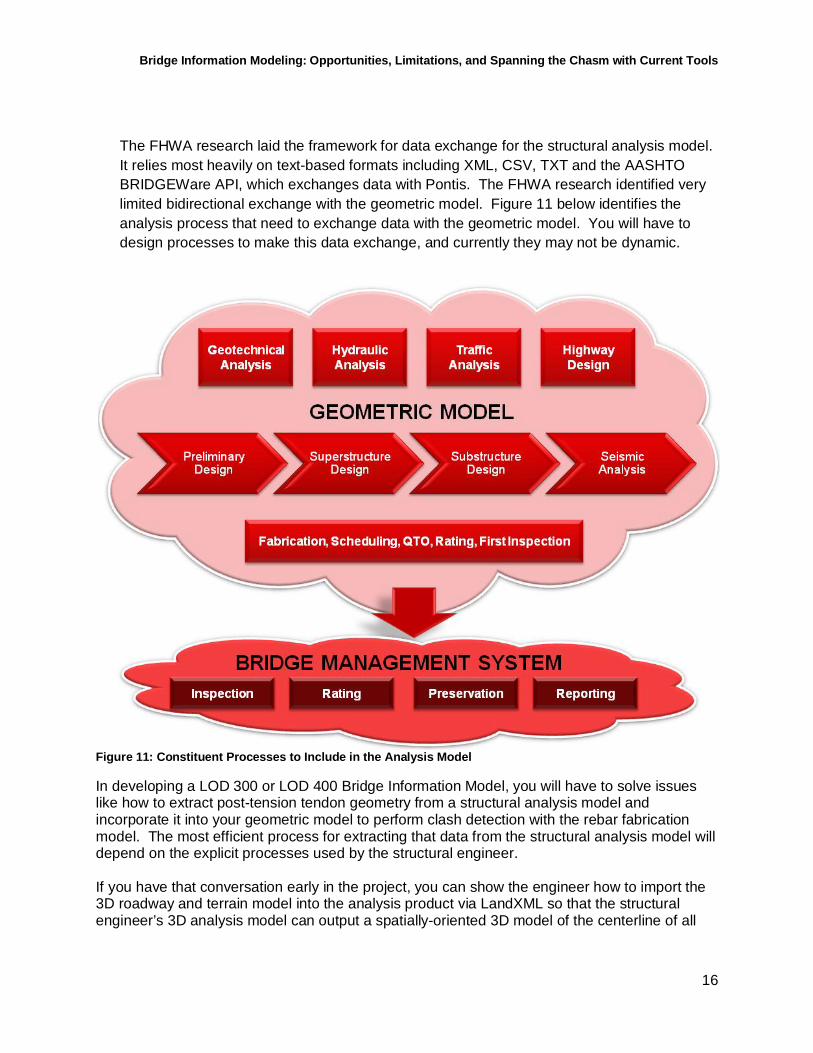
The FHWA research laid the framework for data exchange for the structural analysis model. It relies most heavily on text-based formats including XML, CSV, TXT and the AASHTO BRIDGEWare API, which exchanges data with Pontis. The FHWA research identified very limited bidirectional exchange with the geometric model. Figure 11 below identifies the analysis process that need to exchange data with the geometric model. You will have to design processes to make this data exchange, and currently they may not be dynamic.
Figure 11: Constituent Processes to Include in the Analysis Model
In developing a LOD 300 or LOD 400 Bridge Information Model, you will have to solve issues like how to extract post-tension tendon geometry from a structural analysis model and incorporate it into your geometric model to perform clash detection with the rebar fabrication model. The most efficient process for extracting that data from the structural analysis model will depend on the explicit processes used by the structural engineer. If you have that conversation early in the project, you can show the engineer how to import the 3D roadway and terrain model into the analysis product via LandXML so that the structural engineer’s 3D analysis model can output a spatially-oriented 3D model of the centerline of all
Bridge Information Modeling: Opportunities, Limitations, and Spanning the Chasm with Current Tools
17
the tendons. This would be an ideal CAD link into Revit to sweep a circular family along the lines to generate a mass of the tendon. Another option may be that the structural engineer is able to output a set of coordinates for the post-tension tendon’s location in relation to the centerline of the concrete box girder at known station locations. Since the Profile Grade Line (PGL) location is known relative to the center of the box girder, these coordinates become offset/elevation points relative to the baseline, ripe for creating a corridor model in AutoCAD Civil 3D using a circular assembly from SAC.
SummaryBridge Information Modeling is still an emerging field, but one that has the potential to add substantial value to bridge projects for all stakeholders. Bridges lie on the critical path during the design of a project. With good BIM Implementation Planning, BrIM can bring more reliable data to the structural engineers sooner, to reduce the length of the feedback loop in the bridge design process.
Model-based plans production using both AutoCAD Civil 3D and Revit can enhance the quality and efficiency of preparing bridge plans, in spite of software challenges for complex and curved bridges. A LOD 300+ geometric model would contribute favorably to reducing uncertainty in key project controls of cost estimating and construction scheduling, reducing overall project risk. This would support expanded offsite fabrication and other components of Accelerated Bridge Construction to reduce the impact of repair and replacement projects on communities. On tolled bridges, this would have a positive revenue impact for owners.
Finally, in contemplating how we can offer better value to our clients, we should consider how we can push the design and construction data into their sophisticated Bridge Management Systems.
Image creditsFigure 3: US Library of Congress
Figure 4: Underhill, I., 23 March 1909 (US Library of Congress)
Figure 5:Leonard G., 12 May 2011 (Creative Commons CC0 1.0)
Figure 6: Accelerated Bridge Construction Final Manual (HIF-12-013), FHWA, 11-01-11
Figure 7: Accelerated Bridge Construction Final Manual (HIF-12-013), FHWA, 11-01-11
Figure 9: Chen, S. and Shirolé, A., 2008, FHWA Contract DTFH61-06-D-00037