45
© BRIDGE TO INDIA, 2012 The Project Development Handbook INDIA SOLAR DECISION BRIEF © BRIDGE TO INDIA, 2012 Illustration by Kavya Bagga Sponsored by
| Date post: | 07-Aug-2015 |
| Category: |
Documents |
| Upload: | sanman-rajput |
| View: | 63 times |
| Download: | 5 times |

© BRIDGE TO INDIA, 2012 1
The Project Development
Handbook
INDIA SOLARDECISION BRIEF
© BRIDGE TO INDIA, 2012Illustration by Kavya Bagga
Sponsored by

© BRIDGE TO INDIA, 2012 2
Enerparc is an internationally successful specialist in the whole value chain of large-scale photovoltaic power plants in the megawatt segment. The company was founded beginning 2009 and has offices in Germany, United States and India. As pioneers of this industry, the Enerparc team is specialized in project development, installation as well as in the investment and operation of solar power plants. The service ranges from the technical planning (EPCm) to the turn-key delivery (EPC) and finally to the operation (O&M) of the power plant. In the last 24 months the Enerparc Group successfully connected more than 700 MW to the grid and it operates 300MW of own PV power plants.
Telephone: +91 80 4022 4085Fax: +91 011 4060 1235Email: [email protected]
SPONSORED BY
BRIDGE TO INDIA relies on interviews with key industry professionals and government officials to gather primary information on the market. We analyze this information in an unbiased and systematic manner based on our expertise and analytical models developed in-house.
The opinions and analyses expressed in this report are those of BRIDGE TO INDIA, and do not, in any way, unless specifically mentioned, convey or include the opinions of the sponsors of this report.
GIZ is a federal enterprise, which supports the German Government in achieving its objectives in the field of international cooperation for sustainable development.
GIZ operates in many fields: economic development and employment promotion; governance and democracy; security, reconstruction, peace building and civil conflict transformation; food security, health and basic education; and environmental protection, resource conservation and climate change mitigation. We support our partners with management and logistical services, and act as an intermediary, balancing diverse interests in sensitive contexts.
Telephone: +49 61 96 79-0Fax: +49 61 96 79-11 15Email: [email protected]

© BRIDGE TO INDIA, 2012
© 2012 BRIDGE TO INDIA Energy Pvt. Ltd.All rights reserved September 2012, New Delhi
All Reports are owned by BRIDGE TO INDIA and are protected by Indian copyright and international copyright/intellectual property laws underapplicable treaties and/or conventions. The user agrees not to export any reportinto a country that does not have copyright/intellectual property laws thatwill protect BRIDGE TO INDIA’s rights therein.
BRIDGE TO INDIA hereby grants the user a personal, non-exclusive, non-refundable,non-transferable license to use the report for research purposesonly pursuant to the terms and conditions of this agreement. BRIDGE TO INDIA retains exclusive and sole ownership of each report disseminated under thisagreement. The user cannot engage in any unauthorized use, reproduction,distribution, publication or electronic transmission of this report or theinformation/forecasts therein without the express written permission of BRIDGE TO INDIA.
DISCLAIMER
For further enquiries, please contact:
Mr. Akhilesh Magalakhilesh.magal@bridgetoindia.
com
BRIDGE TO INDIA Pvt. Ltd.S-181,Panchsheel Park
New Delhi 110017India
www.bridgetoindia.com
www.bridgetoindia.com/blog
Follow us on www.facebook.com/
bridgetoindia
www.twitter.com/BRIDGETOINDIA
www.linkedin.com/company/bridge-to-india-pvt.-ltd.
No part of this report may be used or reproduced in any manner or in any form or by any means without mentioning its original source.
BRIDGE TO INDIA is not herein engaged in rendering professional advice and ser¬vices to you. BRIDGE TO INDIA makes no warranties, expressed or implied, as to the ownership, accuracy, or adequacy of the content of this product. BRIDGE TO INDIA shall not be liable for any indirect, incidental, consequential, or punitive damages or for lost revenues or profits, whether or not advised of the possibility of such dam¬ages or losses and regardless of the theory of liability.

© BRIDGE TO INDIA, 2012
1. Overview 01
2. Solar Project Opportunities in India 02
3. Project Development Process 07
3.1 Feasibility Study
3.2 EPC Selection
3.3 Technology Selection
3.4 Process - PPA, Licenses, Permits
07
12
12
14
4. Profitability 19
5. Overview of Policies 22
6. Challenges and Risks 24
7. Annexure 26
TABLE OF CONTENTS

© BRIDGE TO INDIA, 2012 01
1. OVERVIEWSince the announcement of the National Solar Mission (NSM) in early 2010, there has been considerable development in the Indian solar market. The overall installed capacity has increased from 22 MW in 2010 to over 1,050 MW1 today. This growth was propelled largely by the NSM and the Gujarat State Solar Policy. The market is now poised for further growth with the announcements of solar policies from states such as Tamil Nadu, Andhra Pradesh, Chhattisgarh and draft policies of phase two of the NSM. Meanwhile, the Renewable Energy Certificate (REC) mechanism provides an alternative to the Feed-in Tariff (FiT) policies. This provides investors, project developers and EPC players several opportunities. The challenge is that each of the policies requires different set of permits, clearances and approvals - at different timelines and costs. Navigating through these procedures and assessing their relative risks and returns can be challenging.
At the same time, an un-structured and ill-informed approach to project development jeopardizes project timelines and affects the profitability of projects. From a bankability perspective, structured and well-documented information is key to achieving financial closure. Although information is available, it is often distributed, haphazard and uncritical. This absence of structured information deters new entrants into the market and imposes challenges on players that are already in the market.
The Project Development Handbook from BRIDGE TO INDIA aims to present relevant information in a structured manner to provide a sound overview of the processes, timelines, costs, challenges and opportunities in project development in India. This manual shall help in the assessment of projects in terms of profitability and bankability across various off-take options. The handbook is meant for investors, project developers and EPC players.
1 BRIDGE TO INDIA.India Solar Compass. October 2012
The absence of structured information
deters new entrants into the market and imposes challenges on players that are
already in the market.
The Project Development
Handbook from BRIDGE TO INDIA aims
to present relevant information in a
structured manner to provide a sound
overview of the processes, timelines, costs, challenges and
opportunities in project development in India.

© BRIDGE TO INDIA, 2012 02
2. SOLAR PROJECT
OPPORTUNITIES IN INDIA
Since the announcement of the NSM in 2010, the Indian solar market has expanded. Several states have meanwhile announced independent solar policies. Furthermore, the REC mechanism provides another off-take option for developers. The table below shows the different off-take options available for developers and the expected year-on-year capacity addition until 2017.
THE NATIONAL SOLAR MISSIONThe NSM is the only national policy towards solar generation in India. It was announced in 2010 and consists of three phases. Phase one is complete and consisted of two batches. Projects under both batches of phase one
2 Refer to BRIDGE TO INDIA's INDIA SOLAR HANDBOOK November 2012 edition3 The state of Gujarat has fulfilled its RPOs. Further allocations are expected based on the REC mechanism.4 The Andhra Pradesh solar policy is based completely on the REC mechanism. No policy targets have been announced.
Source: BRIDGE TO INDIA
Table 1: Expected policy announcements (MW)2
Policy 2013 2014 2015 2016 2017NSM 1,000 667 667 667 0Gujarat3 0 0 0 0 0Karnataka 40 40 40 40 0Rajasthan 150 50 50 50 50Madhya Pradesh 200 200 200 200 0Andhra Pradesh4 1,000 0 0 0 0Tamil Nadu 1,000 1,000 1,000 0 0Chhatisgarh 200 200 200 200 200TOTAL 3,590 2,157 2,157 1,157 250
were allocated through a reverse bidding mechanism. Phase 1 has been concluded and all projects have been alloted (not all have been commissioned).
The draft policy guidelines of phase two were announced by the Ministry of New and Renewable Energy (MNRE) on December 3rd 2012. It is expected that 3,000 MW will be available for auction under this phase until 2017 (see table 1). The draft policy aims at 1,000 MW that would be auctioned under a Viability Gap Funding (VGF) based allocation method. VGF is a mechanism through which government would provide upfront capital to bridge the viability gap. Priority would be given to those developers who require the least support.
© B
RID
GE
TO IN
DIA
, 201
2
Since the announcement of the
NSM in 2010, the Indian solar market has
expanded.
The draft policy guidelines of phase
two of the NSM were announced by the
Ministry of New and Renewable Energy
(MNRE) on December 3rd 2012.
Table 2: Capacity allocations under the NSM
Batch Capacity allocated (MW)
Average bid price (`/Wh)
Benchmark Tariff (`/kWh)
Batch 1 150 12.00 17.91Batch 2 350 8.20 15.39
© BRIDGE TO INDIA, 2012Source: BRIDGE TO INDIA

© BRIDGE TO INDIA, 2012 03
GUJARAT SOLAR POLICYThe state of Gujarat was the first Indian state to launch its own solar policy in 2009 even before the NSM. The current policy is operative until 2014 but a new policy is expected before it ends. The initial target was to achieve an installed capacity of 500 MW. Given the interest from a large number of developers and an assumption that some projects may not be implemented, the government allocated projects worth 958.5 MW of PV. Unlike the NSM, Gujarat has not opted for reverse bidding as a means to allocate projects, nor does the policy have a Domestic Content Requirement (DCR). The tariff was fixed as shown in Table 3.
From Table 1, no project allocations are expected from Gujarat since the state’s RPOs have been fulfilled. Future project allocations are likely to be through the REC mechanism.
KARNATAKA SOLAR POLICYKarnataka announced its solar policy in July 2011. 80 MW was auctioned through a reverse bidding process held in November 2011 out of which 70 MW was allocated to PV. These projects
© B
RID
GE
TO IN
DIA
, 201
2
Table 3: Tariffs under the Gujarat solar policy (January 29th 2012 to March 31st 2013)5 Type of project
Accelerated Depreciation
Year 0 to Year 12
Year 13 to Year 25
Levelized tariff for 25 years
Megawatt scale PV projects
With Accelerated Depreciation
9.98 7.00 9.28
Without Accelerated Depreciation
11.25 7.50 10.37
Kilowatt scale PV projects
With Accelerated Depreciation
NA 11.14
Without Accelerated Depreciation
12.44
Source: BRIDGE TO INDIA
5 BRIDGE TO INDIA's November 2012 edition of the INDIA SOLAR HANDBOOK
are expected to be commissioned by the end of 2013. The lowest bid received was at ` 7.94 (€0.12)/kWh while the highest winning bid received was at ` 8.50 (€0.13)/kWh. Karnataka has abolished all wheeling and transmission charges in order to promote investment in solar energy. The solar policy does not mandate a DCR. The policy aims to add another 120 MW over the next five years.
RAJASTHAN SOLAR POLICYThe Rajasthan solar policy was expected to be announced in early 2012. Due to delays, the Request for Proposal (RfP) of the policy was announced only in November 2012. The policy expects an allocation of 150 MW (100 MW of utility-scale projects and 50 MW of rooftop projects). The policy aims at achieving an additional 200MW of capacity addition until 2017.
MADHYA PRADESH SOLAR POLICYThe Madhya Pradesh solar policy was approved by the state cabinet in July 2012. It is expected that the state will allocate 800MW of solar power under the policy. The projects will be divided into four solar parks of 200MW each. However the policy document does not
Unlike the NSM, Gujarat has not opted
for reverse bidding as a means to allocate
projects, nor does the policy have a DCR.
It is expected that Madhya Pradesh will
allocate 800MW of solar power under its
policy.
© BRIDGE TO INDIA, 2012 04
offer any clarity on the total targeted capacity addition, the time frame for the execution of the policy, eligible entities and the method of allocating projects or the incentives under the policy. As the policy does not clarify the allocations, Table 1 assumes that one solar park of capacity 200MW will be available each year between the period 2013 to 2016.
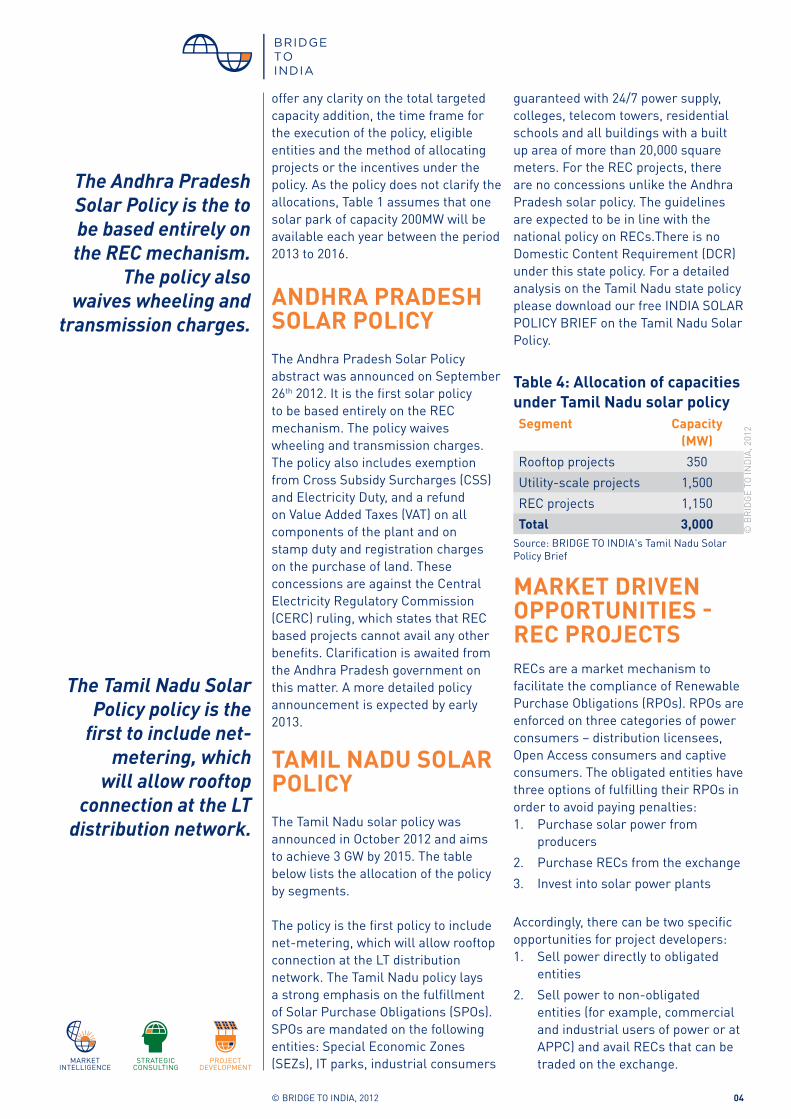
ANDHRA PRADESH SOLAR POLICYThe Andhra Pradesh Solar Policy abstract was announced on September 26th 2012. It is the first solar policy to be based entirely on the REC mechanism. The policy waives wheeling and transmission charges. The policy also includes exemption from Cross Subsidy Surcharges (CSS) and Electricity Duty, and a refund on Value Added Taxes (VAT) on all components of the plant and on stamp duty and registration charges on the purchase of land. These concessions are against the Central Electricity Regulatory Commission (CERC) ruling, which states that REC based projects cannot avail any other benefits. Clarification is awaited from the Andhra Pradesh government on this matter. A more detailed policy announcement is expected by early 2013.
TAMIL NADU SOLAR POLICYThe Tamil Nadu solar policy was announced in October 2012 and aims to achieve 3 GW by 2015. The table below lists the allocation of the policy by segments.
The policy is the first policy to include net-metering, which will allow rooftop connection at the LT distribution network. The Tamil Nadu policy lays a strong emphasis on the fulfillment of Solar Purchase Obligations (SPOs). SPOs are mandated on the following entities: Special Economic Zones (SEZs), IT parks, industrial consumers
Table 4: Allocation of capacities under Tamil Nadu solar policySegment Capacity
(MW)Rooftop projects 350Utility-scale projects 1,500REC projects 1,150Total 3,000
guaranteed with 24/7 power supply, colleges, telecom towers, residential schools and all buildings with a built up area of more than 20,000 square meters. For the REC projects, there are no concessions unlike the Andhra Pradesh solar policy. The guidelines are expected to be in line with the national policy on RECs.There is no Domestic Content Requirement (DCR) under this state policy. For a detailed analysis on the Tamil Nadu state policy please download our free INDIA SOLAR POLICY BRIEF on the Tamil Nadu Solar Policy.
Source: BRIDGE TO INDIA's Tamil Nadu Solar Policy Brief
© B
RID
GE
TO IN
DIA
, 201
2
MARKET DRIVEN OPPORTUNITIES - REC PROJECTSRECs are a market mechanism to facilitate the compliance of Renewable Purchase Obligations (RPOs). RPOs are enforced on three categories of power consumers – distribution licensees, Open Access consumers and captive consumers. The obligated entities have three options of fulfilling their RPOs in order to avoid paying penalties:1. Purchase solar power from
producers2. Purchase RECs from the exchange3. Invest into solar power plants
Accordingly, there can be two specific opportunities for project developers:1. Sell power directly to obligated
entities 2. Sell power to non-obligated
entities (for example, commercial and industrial users of power or at APPC) and avail RECs that can be traded on the exchange.
The Andhra Pradesh Solar Policy is the to be based entirely on the REC mechanism.
The policy also waives wheeling and
transmission charges.
The Tamil Nadu Solar Policy policy is the
first to include net-metering, which
will allow rooftop connection at the LT
distribution network.

© BRIDGE TO INDIA, 2012 05
Option 1: Sell power directly to obligated entitiesIn this option, the project developer must identify obligated entities across India. There are three entities that are obligated to fulfill RPOs - Distribution Companies (DISCOMS), Open Access Consumers and Captive Consumers. The obligations are specified as a percentage of the total energy consumed or distributed by the entity. The obligations vary according to states and are set by the State Electricity Regulatory Commission (SERC). Table 5 shows the state wise obligations.
available solar power price in the market. This is currently at ` 7.00(€ 0.10)/kWh from the reverse bidding held in the state of Odisha February 20126. Alternatively, obligated entities can purchase RECs on the exchange. The prices for solar RECs are fixed by the Central Electricity Regulatory Commission (CERC) for the years 2012-2017. The floor price is fixed at ` 9,300 (€ 143.08) and the forbearance (ceiling) price at ` 13,400 (€206.15) per REC. However, there is no guarantee that the RECs are actually sold at the floor price, if there is a lack in demand.
The key driver for point 2 would be the robustness of the REC market. This is dependent on the demand of solar RECs from the obligated entities. The current REC prices deter obligated entities from purchasing RECs to meet their RPO goals. BRIDGE TO INDIA believes that this should induce the CERC to come out with a correction on the prices soon.
BRIDGE TO INDIA expects the above REC prices7. For a detailed analysis of the price forecast, refer to BRIDGE TO INDIA's India Solar Decision Brief on the 'REC Mechanism: Viability of solar projects in India'.
Table 6 shows that the REC prices are expected to fall by 60% for the control period 2017-2022. REC prices are expected to be zero after 2022 as grid parity with the APPC is expected to be reached across all states of India by 2022.
Option 2: Sell power to non-obligated entitiesIn this option, developers can have a Power Purchase Agreement (PPA) with any entity that requires power. The key driver for these business models is the identification of the power off-taker. Since these entities are not obligated to purchase power, the only incentive to shift to solar power is the price.
Table 5: Solar purchase obligations - selected statesState Solar RPO
(2012-2013)Andhra Pradesh 0.25%Gujarat 1.00%Haryana 0.50%Himachal Pradesh 0.25%Karnataka 0.25%Kerala 0.25%Madhya Pradesh 0.60%Maharashtra 0.25%Punjab 0.07%Tamil Nadu 0.05%Uttar Pradesh 1.00%Uttarakhand 0.25%
© BRIDGE TO INDIA, 2012
6 BRIDGE TO INDIA's India Solar Compass, July 2012. Available online here.7 For further details refer to BRIDGE TO INDIA’s INDIA SOLAR DECISON BRIEF on 'The REC Mechanism: Viability of solar projects in India'
Source: BRIDGE TO INDIA, State Electricity Regulatory Commission (SERC) orders
The financial attractiveness of such projects for project developers is linked to two factors:1. Price at which power can be sold to
obligated entities2. Price at which RECs can be traded
on the exchange - over the lifetime of the project
The key driver for point 1 will be the solar prices benchmarked by the reverse bidding auctions of the NSM and other state policies. Obligated entities are likely to demand the lowest
There are three entities that are
obligated to fulfill RPOs - Distribution
Companies (DISCOMS), Open Access
Consumers and Captive Consumers.
The current REC prices deter obligated entities
from purchasing RECs to meet their RPO
goals.

© BRIDGE TO INDIA, 2012 06
Therefore, in this model, the price of solar power must be cost competitive.
India’s power tariff structure is non-uniform. Commercial and industrial consumers of power cross-subsidize residential and agricultural consumers. From a project developer’s point-of-view, the most attractive projects will be the highest paying consumers. The table below shows power prices by state and by categories of consumers.
The power price structure in India is non-uniform due to cross-subsidies. Domestic and agricultural are cross-subsidized by industrial and
Table 6: REC prices forecast(2012-2017) (2017-2022) (2022- )
Floor Forbearance Floor Forbearance Floor Forbearance` 9,300 (€ 155)
` 13,400 (€ 223)
` 2,200(€ 34)
` 4,000(€ 62)
0 0
© B
RID
GE
TO IN
DIA
, 201
2
Source: BRIDGE TO INDIA
commercial consumers of power. In order to meet the rising cost of procuring power, the DISCOMs have been forced to raise power prices by 20-30% across all cosumer categories in 2012.
In addition to the sale of power, RECs can be availed. The REC price projection is discussed under Option 1.
For more information on the viability of the REC mechanism, download our free INDIA SOLAR DECISION BRIEF on the 'REC Mechanism: Viability of solar projects in India'.
Table 7: State-wise power tariff across consumer categoriesState Discom Electricity Prices for Consumer Category
(`/kWh)Commercial Industrial Domestic
LT HT (11 KV)Gujarat All 4.30 5.50 5.50 3.60Karnataka All 6.70 4.56 5.25 4.00Rajasthan All 5.95 4.96 5.33 3.36Madhya Pradesh All 5.70 4.90 5.10 4.28Andhra Pradesh All 6.50 5.20 4.95 5.20Tamil Nadu TANGEDCO 7.00 4.75 5.50 3.61Chhattisgarh CSPDCL 4.80 3.30 3.80 3.40Maharashtra MSEDCL 9.78 7.19 4.53
© B
RID
GE
TO IN
DIA
, 201
2
Source: BRIDGE TO INDIA, SERC Tariff Orders [Data applicable as of 2012]
The power price structure in India
is non-uniform due to cross-subsidies.
Domestic and agricultural are cross-
subsidized by industrial and commercial
consumers of power.
The only incentive to shift to solar power is
the price. Therefore, the price of solar
power must be cost competitive.

© BRIDGE TO INDIA, 2012 07
3. PROJECT DEVELOPMENT
PROCESS
3.1. FEASIBILITY STUDYThe Indian solar market offers many opportunities to develop projects under different policies. Since the market is still emerging, many regulatory details are not yet clarified. The challenge for a project developer is to make the right decision given the myriad of contrasting information available. Different policies and power off-take options create manifold opportunities to develop a project with diverse impact on its profitability and bankability. Commercial feasibility and bankability do not necessarily go hand in hand. Thus, a detailed feasibility study helps to assess the project properly with regard to the best suitable option. It saves both time and money in the long run.
A project always has to be developed from the bank’s/investor’s perspective. It has to meet their requirements in terms of profitability, structure, documentation and bankability.Compromises on quality in favor of better profitability should be avoided. The investor’s expectation for a reasonable return must be met, but it is the nature of renewable energy projects that the investment gets paid back over a longer time. Hence, the project and stakeholder structure (e.g.
power off-takers, land owners, O&M contractors, EPC providers) has to be sustainable in order to pay off lenders and sponsors.
In order to make the right choice, one has to understand the impact of different parameters on the profitability of the project. A sensitivity analysis helps to prioritize input factors, especially when trade-offs have to be made under a competitive scenario. The following example shows a sensitivity analysis performed on different parameters for a typical project under the NSM for an average radiation in India.
Table 8 gives the assumptions used for the sensitivity analysis. The
��
“Go-No-go” decision
Evaluation of profitability
� Selection of EPC and technology
��
Reverse bidding, allocation, REC registration
PPA, land, license and permits
Feasibility
study
EPC and
technology
selection
Project
Development
Sour
ce: B
RID
GE
TO IN
DIA
Table 8: Assumption for the sensitivity study Parameter Assumed value for
calculationCAPEX ` 75m (€ 1.15m)/ MWTariff offered : ` 8.20 (€ 0.13)/ kWh8
CUF: 18.00%
Interest rate: 12.00%Grid availability:
99.00%
Grid losses: 9.00%Wheeling charges:
` 0.21 (€ 0.32 cents)/kWh
Cross subsidy surcharge:
` 0.84 (€ 1.29 cents)/kWh
© B
RID
GE
TO IN
DIA
, 201
2©
BR
IDG
E TO
IND
IA, 2
012
8 Average tariff under the Phase 1 Batch 2 NSM
A project always has to be developed from the bank’s/investor’s
perspective.
The challenge for a project developer is to
make the right decision given the myriad of
contrasting information available.
© BRIDGE TO INDIA, 2012 08
8 Average tariff under the Phase 1 Batch 2 NSM 9 BRIDGE TO INDIA. Financial Model Template, 14.11.2012
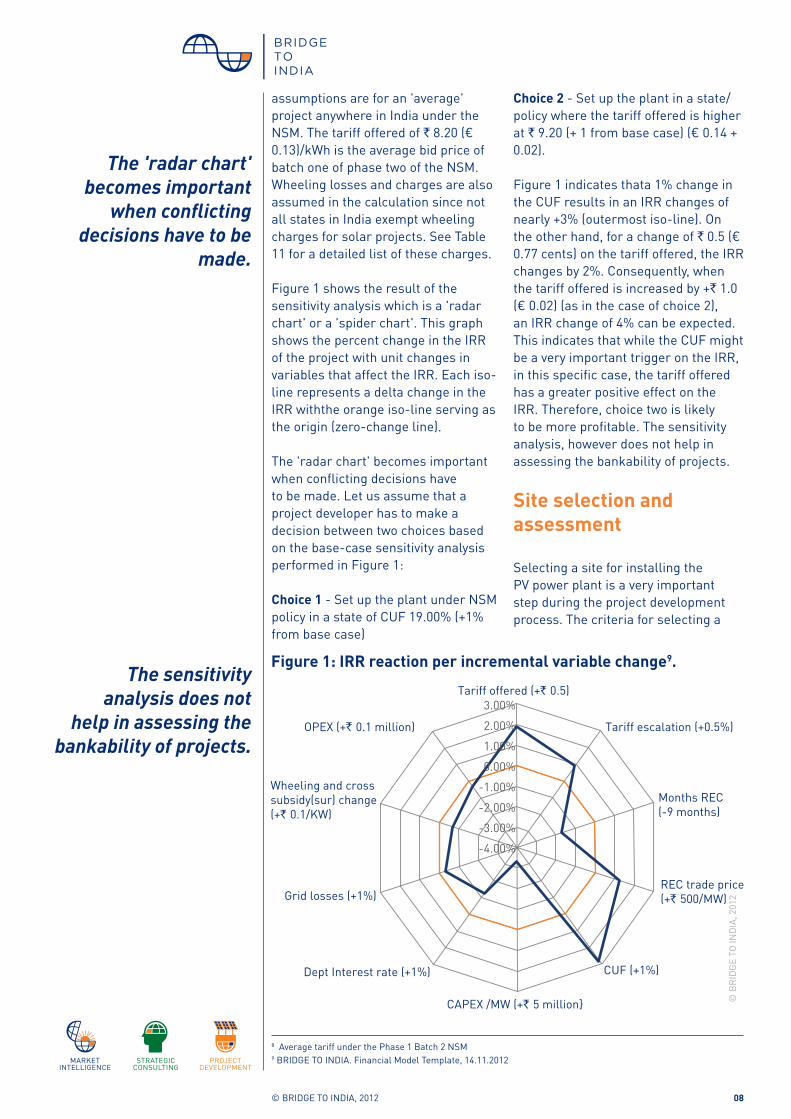
assumptions are for an 'average' project anywhere in India under the NSM. The tariff offered of ` 8.20 (€ 0.13)/kWh is the average bid price of batch one of phase two of the NSM. Wheeling losses and charges are also assumed in the calculation since not all states in India exempt wheeling charges for solar projects. See Table 11 for a detailed list of these charges.
Figure 1 shows the result of the sensitivity analysis which is a 'radar chart' or a 'spider chart'. This graph shows the percent change in the IRR of the project with unit changes in variables that affect the IRR. Each iso-line represents a delta change in the IRR withthe orange iso-line serving as the origin (zero-change line).
The 'radar chart' becomes important when conflicting decisions have to be made. Let us assume that a project developer has to make a decision between two choices based on the base-case sensitivity analysis performed in Figure 1:
Choice 1 - Set up the plant under NSM policy in a state of CUF 19.00% (+1% from base case)
Choice 2 - Set up the plant in a state/policy where the tariff offered is higher at ` 9.20 (+ 1 from base case) (€ 0.14 + 0.02).
Figure 1 indicates thata 1% change in the CUF results in an IRR changes of nearly +3% (outermost iso-line). On the other hand, for a change of ` 0.5 (€ 0.77 cents) on the tariff offered, the IRR changes by 2%. Consequently, when the tariff offered is increased by +` 1.0 (€ 0.02) (as in the case of choice 2), an IRR change of 4% can be expected. This indicates that while the CUF might be a very important trigger on the IRR, in this specific case, the tariff offered has a greater positive effect on the IRR. Therefore, choice two is likely to be more profitable. The sensitivity analysis, however does not help in assessing the bankability of projects.
Site selection and assessment
Selecting a site for installing the PV power plant is a very important step during the project development process. The criteria for selecting a
© B
RID
GE
TO IN
DIA
, 201
2
Figure 1: IRR reaction per incremental variable change9.The sensitivity
analysis does not help in assessing the
bankability of projects.
The 'radar chart' becomes important
when conflicting decisions have to be
made.
OPEX (+` 0.1 million)
Wheeling and cross subsidy(sur) change (+` 0.1/KW)
Grid losses (+1%)
Dept Interest rate (+1%)
CAPEX /MW (+` 5 million}
CUF (+1%)
REC trade price(+` 500/MW)
Months REC (-9 months)
Tariff escalation (+0.5%)
Tariff offered (+` 0.5)3.00%
2.00%
1.00%
0.00%
-1.00%
-2.00%
-3.00%
-4.00%
© BRIDGE TO INDIA, 2012 9
10 Central Electricity RegulatoryCommission.Petition No. 242/SM//201211 DR. B D SHARMA, Performance of Solar Power Plants India, 201112 Land prices are only estimated values, analysis is done by interviews with local land developers across India.13 Definition of Scaling: 1=difficult, 2=moderate, 3=streamlined14 Centre for Wind Energy Technology, Solar Data Sharing and Accessibility Policy (SDSAP-2012)
site are the following:1. Land acquisition2. Radiation assessment3. Grid connectivity feasibility
Land Acquisition
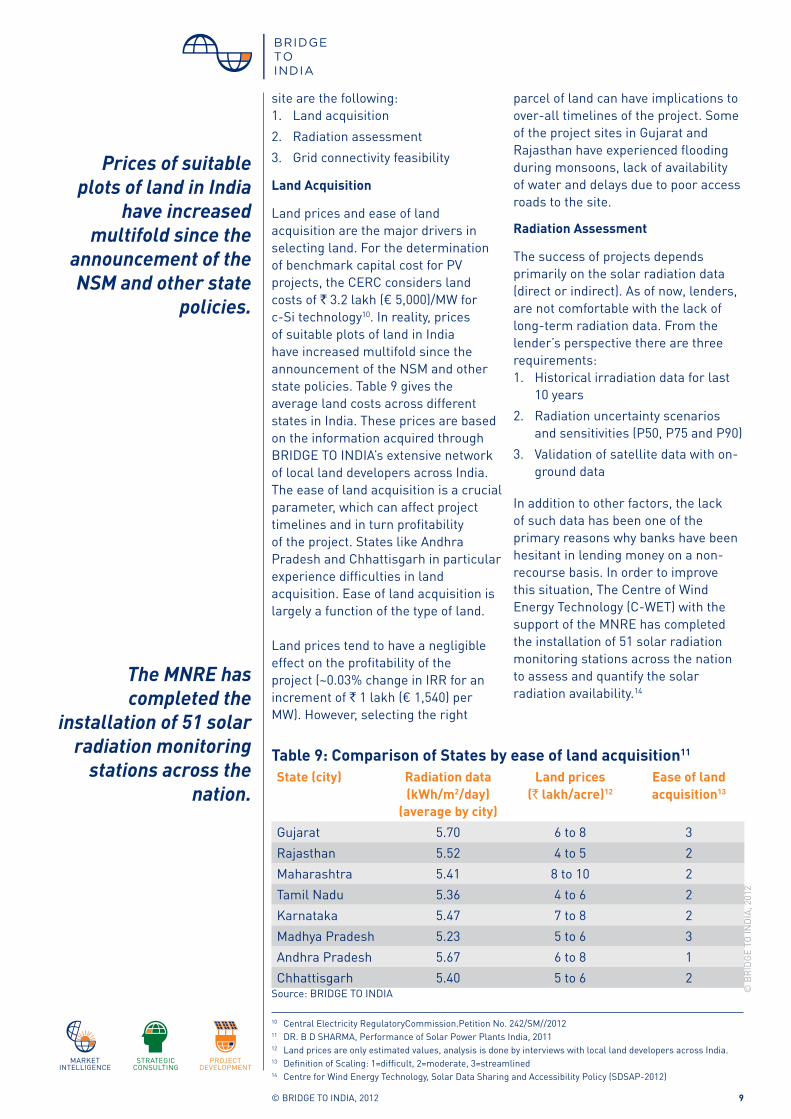
Land prices and ease of land acquisition are the major drivers in selecting land. For the determination of benchmark capital cost for PV projects, the CERC considers land costs of ` 3.2 lakh (€ 5,000)/MW for c-Si technology10. In reality, prices of suitable plots of land in India have increased multifold since the announcement of the NSM and other state policies. Table 9 gives the average land costs across different states in India. These prices are based on the information acquired through BRIDGE TO INDIA’s extensive network of local land developers across India. The ease of land acquisition is a crucial parameter, which can affect project timelines and in turn profitability of the project. States like Andhra Pradesh and Chhattisgarh in particular experience difficulties in land acquisition. Ease of land acquisition is largely a function of the type of land.
Land prices tend to have a negligible effect on the profitability of the project (~0.03% change in IRR for an increment of ` 1 lakh (€ 1,540) per MW). However, selecting the right
Table 9: Comparison of States by ease of land acquisition11 State (city) Radiation data
(kWh/m2/day) (average by city)
Land prices (` lakh/acre)12
Ease of land acquisition13
Gujarat 5.70 6 to 8 3Rajasthan 5.52 4 to 5 2Maharashtra 5.41 8 to 10 2Tamil Nadu 5.36 4 to 6 2Karnataka 5.47 7 to 8 2Madhya Pradesh 5.23 5 to 6 3Andhra Pradesh 5.67 6 to 8 1Chhattisgarh 5.40 5 to 6 2
Source: BRIDGE TO INDIA
parcel of land can have implications to over-all timelines of the project. Some of the project sites in Gujarat and Rajasthan have experienced flooding during monsoons, lack of availability of water and delays due to poor access roads to the site.
Radiation Assessment
The success of projects depends primarily on the solar radiation data (direct or indirect). As of now, lenders, are not comfortable with the lack of long-term radiation data. From the lender’s perspective there are three requirements:1. Historical irradiation data for last
10 years2. Radiation uncertainty scenarios
and sensitivities (P50, P75 and P90)3. Validation of satellite data with on-
ground data
In addition to other factors, the lack of such data has been one of the primary reasons why banks have been hesitant in lending money on a non-recourse basis. In order to improve this situation, The Centre of Wind Energy Technology (C-WET) with the support of the MNRE has completed the installation of 51 solar radiation monitoring stations across the nation to assess and quantify the solar radiation availability.14
© B
RID
GE
TO IN
DIA
, 201
2
The MNRE has completed the
installation of 51 solar radiation monitoring
stations across the nation.
Prices of suitable plots of land in India
have increased multifold since the
announcement of the NSM and other state
policies.

© BRIDGE TO INDIA, 2012 10
15 BRIDGE TO INDIA. Financial Model Template, 14.11.2012 DR. B D SHARMA. Performance of Solar Power Plants India, (http://bit.ly/RCB924). 2011 RETSCREEN. Solar Radiation tool, available on http://www.retscreen.net
Source: BRIDGE TO INDIA financial model, RETSCREEN, CERC – Performance of solar plants in India
The solar radiation data is one of the biggest triggers for the profitability of a project. Past experience in India has shown that measured CUF hasoften been significantly below the expected CUF. For every 1.0% change in the CUF, the IRR of the project can be affected by as high as 3.0% (see sensitivity analysis – figure 1 from previous chapter).
Table 10 shows the variation of average radiation across different states. These are averaged radiation values reported from monitoring stations located across the states. The plant output is based on a poly-crystalline cell of efficiency of 13%.
Grid connectivity and availability
The grid connectivity and the charges associated with connecting the plant to the grid play an important role in determining the profitability of the project. Any site chosen, must be based on the connectivity of the grid at an appreciable distance from the project site. The additional costs from the land and transmission can increase the CAPEX by ` 2m (€ 30,000) per MW which can affect the IRR by -2.0% (see Figure 1).
Table 10: Average Radiation and CUF by different States15
State Average Radiation (kWh/m2)
Ambient Temperature
(°C)
Plant Output (MWh)16
CUF (%)
Delhi 5,09 25.10 1,337.90 18.40Gujarat 5.70 27.20 1,743.20 19.90Maharashtra 5.41 24.70 1,648.50 18.82Andhra Pradesh
5.67 26.70 1,707.00 19.47
Tamil Nadu 5.36 28.80 1,560.40 17.81Karnataka 5.47 24.10 1,642.90 18.75Madhya Pradesh
5.23 25.30 1,635.35 18.67
Chhattisgarh 5.40 26.60 1,601,00 18.50Rajasthan 5.52 26.10 1,741.10 19.88
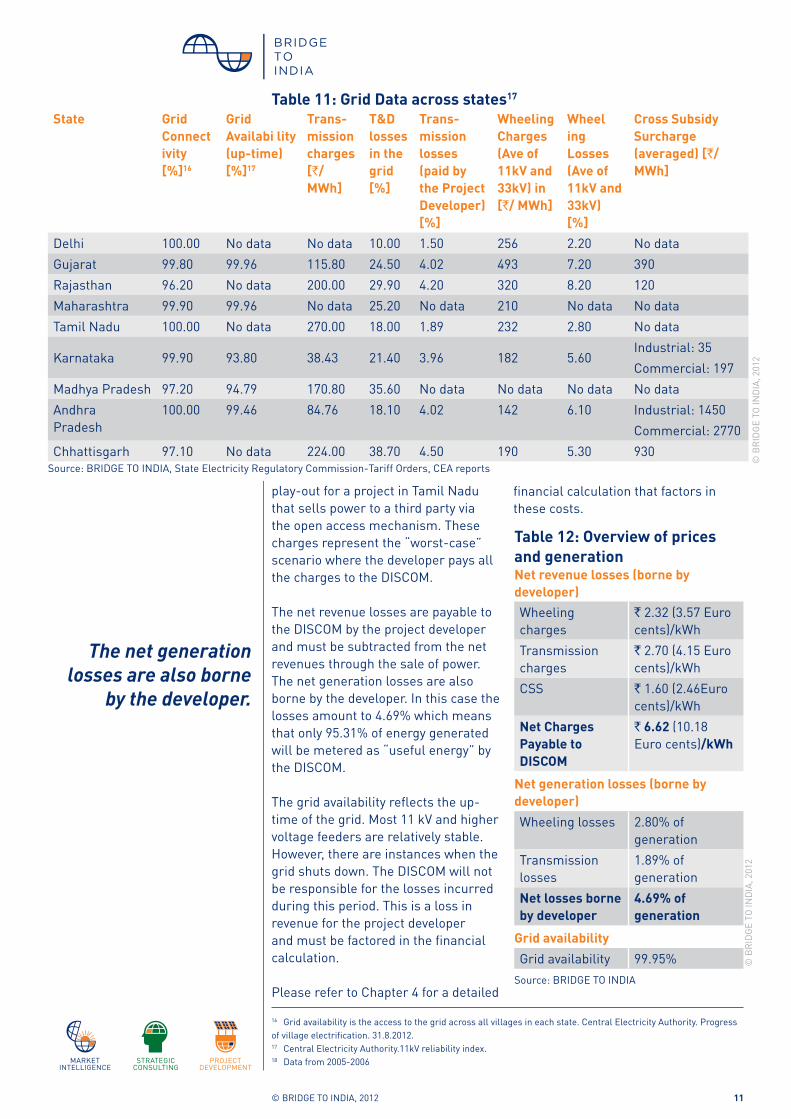
Additionally, grid availability data pertaining to the down-time of the 11kV/33kv grid must be considered. The project developer must bear all costs listed in Table 11. This includes wheeling charges, transmission charges, wheeling losses, transmission losses, loss due to grid down-time and cross subsidy charges. Table 11 also lists grid connectivity which is a metric that determines the availability of the grid in all districts on the state.
The charges mentioned in Table 11 are highly dependent on the business model of the project location, policy and off-taker. Some states like Andhra Pradesh and Karnataka have provided waivers to solar projects. However, these exemptions are provided on a case-to-case basis. For example: REC projects in Karnataka that have a third party sale of power are likely to be levied with wheeling charges and CSS charges although the state policy grants an exemption for such projects.
These charges are important considerations during the financial evaluation of projects (see Chapter 4). The table below describes how they
© B
RID
GE
TO IN
DIA
, 201
2
The project developer must bear wheeling
charges, transmission charges, wheeling
losses, transmission losses, loss due to grid
down-time and cross subsidy charges.
The solar radiation data is one of the
biggest triggers for the profitability of a
project.
© BRIDGE TO INDIA, 2012 11
play-out for a project in Tamil Nadu that sells power to a third party via the open access mechanism. These charges represent the “worst-case” scenario where the developer pays all the charges to the DISCOM.
The net revenue losses are payable to the DISCOM by the project developer and must be subtracted from the net revenues through the sale of power. The net generation losses are also borne by the developer. In this case the losses amount to 4.69% which means that only 95.31% of energy generated will be metered as “useful energy” by the DISCOM.
The grid availability reflects the up-time of the grid. Most 11 kV and higher voltage feeders are relatively stable. However, there are instances when the grid shuts down. The DISCOM will not be responsible for the losses incurred during this period. This is a loss in revenue for the project developer and must be factored in the financial calculation.
Please refer to Chapter 4 for a detailed
State Grid
Connect ivity [%]16
Grid Availabi lity (up-time) [%]17
Trans-mission charges [`/MWh]
T&D losses in the grid [%]
Trans-mission losses (paid by the Project Developer) [%]
Wheeling Charges (Ave of 11kV and 33kV) in [`/ MWh]
Wheel ing Losses (Ave of 11kV and 33kV) [%]
Cross Subsidy Surcharge (averaged) [`/MWh]
Delhi 100.00 No data No data 10.00 1.50 256 2.20 No dataGujarat 99.80 99.96 115.80 24.50 4.02 493 7.20 390Rajasthan 96.20 No data 200.00 29.90 4.20 320 8.20 120Maharashtra 99.90 99.96 No data 25.20 No data 210 No data No dataTamil Nadu 100.00 No data 270.00 18.00 1.89 232 2.80 No data
Karnataka 99.90 93.80 38.43 21.40 3.96 182 5.60Industrial: 35Commercial: 197
Madhya Pradesh 97.20 94.79 170.80 35.60 No data No data No data No dataAndhra Pradesh
100.00 99.46 84.76 18.10 4.02 142 6.10 Industrial: 1450Commercial: 2770
Chhattisgarh 97.10 No data 224.00 38.70 4.50 190 5.30 930
16 Grid availability is the access to the grid across all villages in each state. Central Electricity Authority. Progress of village electrification. 31.8.2012. 17 Central Electricity Authority.11kV reliability index.18 Data from 2005-2006
Source: BRIDGE TO INDIA, State Electricity Regulatory Commission-Tariff Orders, CEA reports
© B
RID
GE
TO IN
DIA
, 201
2
financial calculation that factors in these costs.
Wheeling charges
` 2.32 (3.57 Euro cents)/kWh
Transmission charges
` 2.70 (4.15 Euro cents)/kWh
CSS ` 1.60 (2.46Euro cents)/kWh
Net Charges Payable to DISCOM
` 6.62 (10.18 Euro cents)/kWh
Net generation losses (borne by developer)Wheeling losses 2.80% of
generationTransmission losses
1.89% of generation
Net losses borne by developer
4.69% of generation
Grid availabilityGrid availability 99.95%
Table 12: Overview of prices and generationNet revenue losses (borne by developer)
Source: BRIDGE TO INDIA
© B
RID
GE
TO IN
DIA
, 201
2
Table 11: Grid Data across states17
The net generation losses are also borne
by the developer.
© BRIDGE TO INDIA, 2012 12
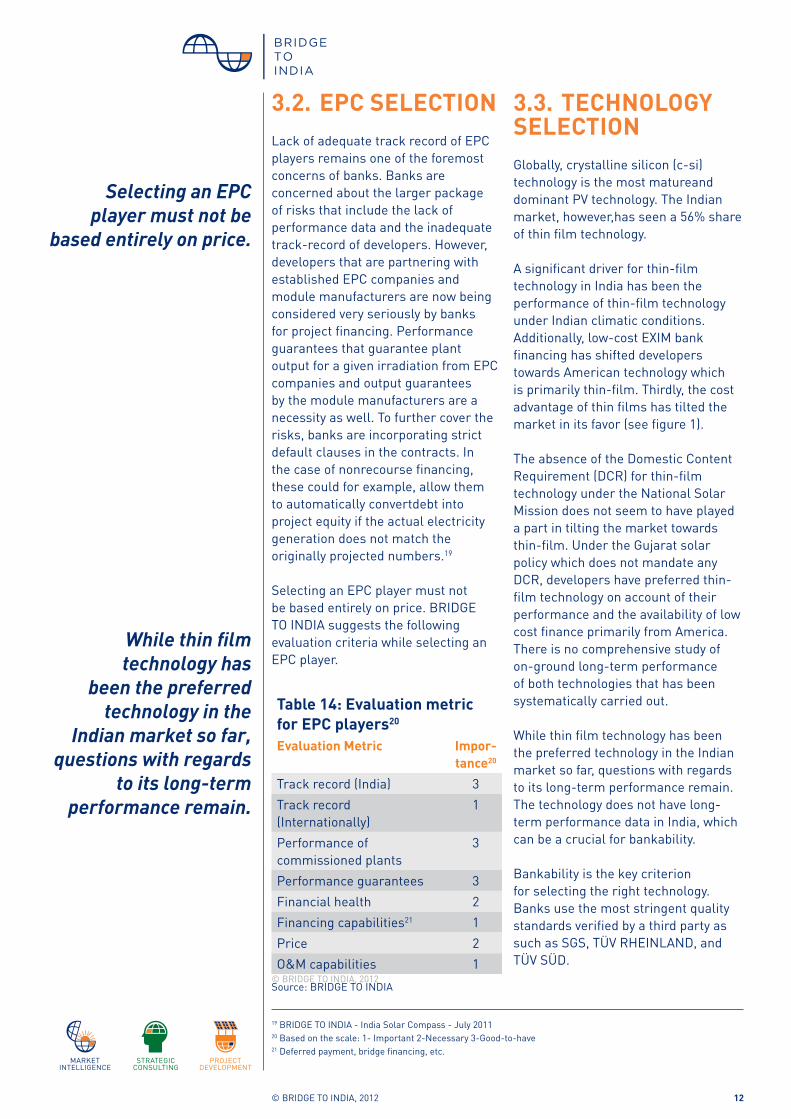
3.2. EPC SELECTIONLack of adequate track record of EPC players remains one of the foremost concerns of banks. Banks are concerned about the larger package of risks that include the lack of performance data and the inadequate track-record of developers. However, developers that are partnering with established EPC companies and module manufacturers are now being considered very seriously by banks for project financing. Performance guarantees that guarantee plant output for a given irradiation from EPC companies and output guarantees by the module manufacturers are a necessity as well. To further cover the risks, banks are incorporating strict default clauses in the contracts. In the case of nonrecourse financing, these could for example, allow them to automatically convertdebt into project equity if the actual electricity generation does not match the originally projected numbers.19
Selecting an EPC player must not be based entirely on price. BRIDGE TO INDIA suggests the following evaluation criteria while selecting an EPC player.
Table 14: Evaluation metric for EPC players20
Evaluation Metric Impor-tance20
Track record (India) 3Track record (Internationally)
1
Performance of commissioned plants
3
Performance guarantees 3Financial health 2Financing capabilities21 1Price 2O&M capabilities 1
3.3. TECHNOLOGY SELECTIONGlobally, crystalline silicon (c-si) technology is the most matureand dominant PV technology. The Indian market, however,has seen a 56% share of thin film technology.
A significant driver for thin-film technology in India has been the performance of thin-film technology under Indian climatic conditions. Additionally, low-cost EXIM bank financing has shifted developers towards American technology which is primarily thin-film. Thirdly, the cost advantage of thin films has tilted the market in its favor (see figure 1).
The absence of the Domestic Content Requirement (DCR) for thin-film technology under the National Solar Mission does not seem to have played a part in tilting the market towards thin-film. Under the Gujarat solar policy which does not mandate any DCR, developers have preferred thin-film technology on account of their performance and the availability of low cost finance primarily from America. There is no comprehensive study of on-ground long-term performance of both technologies that has been systematically carried out.
While thin film technology has been the preferred technology in the Indian market so far, questions with regards to its long-term performance remain. The technology does not have long-term performance data in India, which can be a crucial for bankability.
Bankability is the key criterion for selecting the right technology. Banks use the most stringent quality standards verified by a third party as such as SGS, TÜV RHEINLAND, and TÜV SÜD.
19 BRIDGE TO INDIA - India Solar Compass - July 201120 Based on the scale: 1- Important 2-Necessary 3-Good-to-have21 Deferred payment, bridge financing, etc.
Source: BRIDGE TO INDIA© BRIDGE TO INDIA, 2012
Selecting an EPC player must not be
based entirely on price.
While thin film technology has
been the preferred technology in the
Indian market so far, questions with regards
to its long-term performance remain.

© BRIDGE TO INDIA, 2012 13
Sour
ce: B
RID
GE
TO IN
DIA
, Sol
ogic
o
22 Price based on average international spot prices
Most common standards for PV modules performance are:IEC 61215:2005 Crystalline silicon
43.39% 56.61%
Market Share - Gujarat State Solar Policy
Market Share - NSM
44.44% 55.56%
Market Share - Overall India
43.69% 56.31%
Market Share - Worldwide
89%
11%
Figure 2: Market share of c-Si and thin-film technologies
Thin Film C-Si
module type qualificationIEC 61646:2008 Thin film modules type qualification.
Figure 3: Historic price of c-Si and thin-film on the spot market22
Source: BRIDGE TO INDIA
© B
RID
GE
TO IN
DIA
, 201
2©
BR
IDG
E TO
IND
IA, 2
012
Jan 09
0.5
1.0
1.5
2.0
2.5Average c-Si
Jul 12Jan 12Jul 11Jan 11Jul 10Jan 10Jul 09
Average thin film

© BRIDGE TO INDIA, 2012 14
Source: BRIDGE TO INDIA analysis
3.4. PROCESS - PPA, LICENSES, PERMITS
FiT based projects
FiT projects in India are allocated by central and state authorities. For the National Solar Mission (NSM) phase one and phase two, projects are allocated by NTPC Vidyut Vyapar Nigam (NVVN). For state allocations, the state renewable energy department or the power distribution
Table 14: Procedure for allocation of a typical project under a national/state policy Steps Process with concerned
departmentsGovernment Fee
STEP-ILand selection for preliminary planning
Site approval Zero expenditure
STEP-IIPre- registration with Nodal Agency23
Detailed Project Report + Site + Evacuation Map
Registration fee varies from state to state [Approx. ` 50,000 to ` 1,00,000 (€ 770 to € 1,540)]
STEP-IIIApplication process for allocation of government land
Nodal Agency → district administration → town administration → village administration → town administration → district administration → revenue department in state
Varies from state to state [Approx. one time lease charges - ` 2,500 (€ 38) per acre & annual lease of ` 1,000 (€ 15) per acre]
STEP-IVPower evacuation soft approval
Nodal Agency → State Electricity Board (SEB) → local grid survey team → SEB
No Charges
STEP-VForest clearance Forest department → NOC No ChargesSTEP-VIEnvironmental clearance
Consent for noise pollution & air pollution
` 15,000 to ` 20,000 (€ 230 to € 300) per application
MiscellaneousLocal NOCs, depending on site
May vary between ` 15,000 to ` 50,000 (€ 230 to € 770) per application
23 A nodal agency is responsible for coordinating all permits, licenses and approvals required to get the project approved. In most states the nodal agency is the single window clearance agency.
company allocates projects. The PPAs are signed with the power distribution companies. Each allocation process can have its own timeline but most states follow an allocation process similar to that of the NSM.
A step-by-step pre-allocation procedure for projects in Rajasthan under the NSM is shown in table 14 (the procedure for other states is also similar, although specifics may vary with each state).
© B
RID
GE
TO IN
DIA
, 201
2
Each allocation process can have
its own timeline but most states follow
an allocation process similar to that of the
NSM.

© BRIDGE TO INDIA, 2012 15
Allocation process (reverse bidding based)
The allocating authority (central or state) comes out with a Request for Selection (RfS) to invite allocation intent. At this stage, the project developer is required to submit the participant company’s financial documentation and preliminary technical details of the project. The allocating authority scrutinizes the documents to check if the developer meets the minimum technical and financial (net worth) criteria. Financial criteria are listed Table 15.
Table 15: Financial preconditions for eligibility Policy Financial pre-conditions for biddingNSM • Company net worth required: ` 30m (€ 0.46m) per MW
• Non-refundable processing fee of ` 100,000 (€ 1,500)• Earnest Money Deposit (EMD) of ` 2m (€ 30,800) at the
time of participation in the auction• Bid Bond of ` 50,000 (€ 770) per MW at the time of
awarding, depending on the discount offered• Performance Bank Guarantee (PBG) of ` 3m (€ 46,000
at the time of PPA
Rajasthan • Company net worth required: ` 30m (€ 0.46m) per MW• Non-refundable processing fee of ` 50,000 (€ 770)• For projects that do not sell their electricity to the dis-
tribution companies of Rajasthan:• The RRECL24 levies additional development fees of `
1m per MW• Refundable guarantees of ` 100,000 (€ 1,500) in favor
of the RRECL. Refund upon successful realization of the project
Karnataka • Company’s net worth required: ` 30m (€ 0.46m) per MW
• Non-refundable fee of ` 10,000 (€ 150) towards the cost of the RFP document
• Bid Bond25 of ` 50,000 (€ 770) per MW at the time of awarding, depending on the discount offered
Madhya Pradesh • Company’s net worth required: ` 30m (€ 0.46m) per MW
• Bid processing fee of ` 100,000 (€ 1,500) • Earnest Money Deposit (EMD) of ` 2m (€ 30,800) per
MW
Tamil Nadu • Currently under discussion
24 RRECL – Rajasthan Renewable Energy Corporation Limited25 A bid bond ensures that a bidder who is successful in the bidding process does not walk away from the project.
After a short-list of all eligible bidders is prepared, a Request for Proposal (RfP) is released for inviting bids. Each developer needs to submit a discount on tariff along with the bank guarantees based on the discount provided. A letter of intent is then given to the most competetive bids. The developer can then accept the intent and sign the PPA. For an international project developer, an Indian Special Purpose Vehicle (SPV) needs to be created for signing the PPA.
For typical timelines of the project development process in a Gantt-Chart please refer to Annexure 1.
Source: BRIDGE TO INDIA
© B
RID
GE
TO IN
DIA
, 201
2
The allocating authority scrutinizes
the documents to check if the developer meets the minimum technical
and financial (net worth) criteria.
For an international project developer, an
Indian Special Purpose Vehicle (SPV) needs to be created for signing
the PPA.

© BRIDGE TO INDIA, 2012 16
Allocation process (fixed FiT)
The state of Gujarat is the only state in India that has adopted fixed tariff allocations. There is no bidding process in Gujarat. A state level selection committee scrutinizes the developer’s proposal and financial strength and allocates capacity. The process usually favors financially strong companies.
Project finance
Allocating authorities usually set a deadline for financial closure at the
Table 16: Process timeline for NSM allocation (Most other allocations timelines are similar to the NSM timeline but specifics on dates vary in each Request for Selection (RfS) document)Phase Milestones Deadline Parties InvolvedRfS Request for
SelectionX NVVN
Submission of Proposal
X + 30 days Project Developer
Reselection X + 75 days NVVN
Selection Auction Procedure X + 90 days Project Developer
Awarding X + 120 days NVVN
LOI/ License Letter of Intent (LOI) / License Award
Max: X + 135 days
NVVN, Project Developer
Individual Project Meeting
N/A N/A
Sourcing PPA(Setting up of Indian SPV for international developers to sign the PPA)
Max:X + 165 days
NVVN, Project Developer
Financial Closure Max:X + 345 days
Project Developer
Land Reservation N/A N/A
Final permit N/A N/A
Commissioning Commissioning Max:X + 530 days
Project Developer
Source: BRIDGE TO INDIA
time of PPA signing. This deadline is typically 6-8 months from the date of signing of the PPA. The time required for project financing will depend on the source of finance. International non-recourse financing can take as much as 4-5 months. A balance sheet based recourse financing may take as little as 25 days. Typically, the equity to debt ratio is 30:70. For a detailed analysis of typical project financing structures in India, please refer to BRIDGE TO INDIA's upcoming INDIA SOLAR DECISION BRIEF on Project Financing.
© B
RID
GE
TO IN
DIA
, 201
2
The state of Gujarat is the only state in India
that has adopted fixed tariff allocations.
Allocating authorities usually set a deadline
for financial closure at the time of PPA
signing.

© BRIDGE TO INDIA, 2012 17
REC based projects
Projects under the REC mechanism need to follow a process that involves accreditation and registration. Government agencies involved in the process are the State Load Dispatch Centre (SLDC), the National Load Dispatch Centre (NLDC) as well as the state renewable agency and local
Distributionlicensee
Generator(2)
State agency
SLDC(State load
dispatch center)
(5)NLDC (National load
dispatch center)
Power exchange
(8B)
(8A)
(1)
(3A)
(3B)
(9)
(7)
(4)
(6A)
(3C)
(6B)
(10)
(6D)
(8)
(6C)
(1) Application for accreditation
(2) Verification by state agency
(6C) Intimation of registration (SLDC)
(6D) Intimation of registration (power exchange)
(7) Application for issuance of RECs
(3A) Confirmation of accreditation
(3B) Intimation of accreditation (SLDC)
(3C) Intimation of accreditation (NLDC)
(4) Application for registration
(5) Verification by NLDC
(6A) Confirmation of registration
(6B) Intimation of registration (state agency)
(9) Issuance of REC
(8) RE injection report
(8A) Joint meter reading
(8B) Intimation of meter reading
(10) Intimation of issuance (state agency)
Process steps for REC mechanism
Figure 4: Process steps for the REC mechanism
Source: BRIDGE TO INDIA
Source: BRIDGE TO INDIA
distribution company. The accreditation and registration process takes 45 days.
To be eligible to sell solar RECs, project developer or solar power ‘generator’ needs to follow the accreditation and registration process. Only after the project is registered, solar RECs are issued. The process of accreditation and registration is as shown in Figure 4.
Table 17: Fees and charges
Accreditation fees (paid to State Load Dispatch Center)One-time application processing fee ` 5,000 (€ 77)One-time accreditation charge ` 30,000 (€ 462)Annual charge (to be paid by April 10th) ` 10,000 (€ 154)Revalidation/Extension (end of 5 years) ` 15,000 (€ 230)
Registration fees (paid to National Load Dispatch Center)One time registration fees ` 5,000 (€ 77)One time application processing fee ` 1,000 (€ 15)Annual charge (to be paid by 1st April) ` 1,000 (€ 15)Revalidation/Extension fees (End of 5 years) ` 5,000 (€ 77)
Issuance fees (paid to National Load Dispatch Center)Application for issuance ` 10 per REC (€ 0.15)
© B
RID
GE
TO IN
DIA
, 201
2©
BR
IDG
E TO
IND
IA, 2
012
Government agencies involved in the process
are the State Load Dispatch Centre
(SLDC), the National Load Dispatch Centre (NLDC) as well as the
state renewable agency and local distribution
company.
The accreditation and registration process
takes 45 days.
© BRIDGE TO INDIA, 2012 18
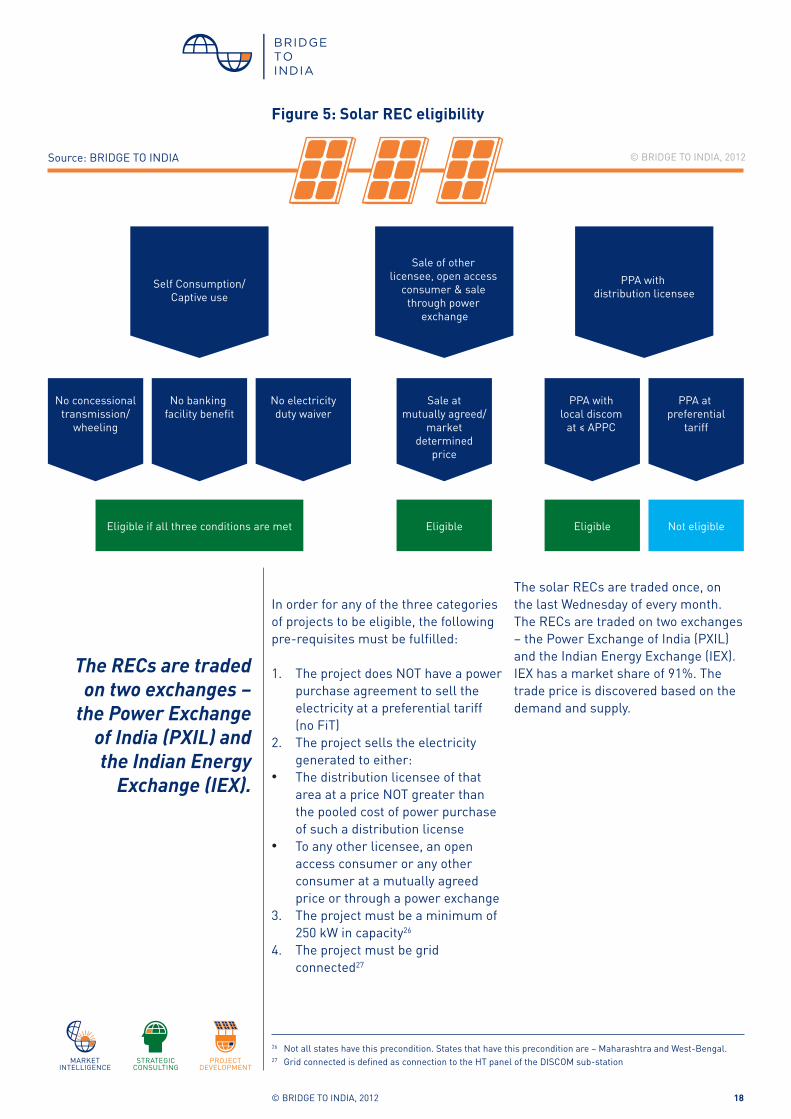
In order for any of the three categories of projects to be eligible, the following pre-requisites must be fulfilled:
1. The project does NOT have a power purchase agreement to sell the electricity at a preferential tariff (no FiT)
2. The project sells the electricity generated to either:
• The distribution licensee of that area at a price NOT greater than the pooled cost of power purchase of such a distribution license
• To any other licensee, an open access consumer or any other consumer at a mutually agreed price or through a power exchange
3. The project must be a minimum of 250 kW in capacity26
4. The project must be grid connected27
The solar RECs are traded once, on the last Wednesday of every month. The RECs are traded on two exchanges – the Power Exchange of India (PXIL) and the Indian Energy Exchange (IEX). IEX has a market share of 91%. The trade price is discovered based on the demand and supply.
26 Not all states have this precondition. States that have this precondition are – Maharashtra and West-Bengal. 27 Grid connected is defined as connection to the HT panel of the DISCOM sub-station
The RECs are traded on two exchanges –
the Power Exchange of India (PXIL) and the Indian Energy
Exchange (IEX).
© BRIDGE TO INDIA, 2012Source: BRIDGE TO INDIA
Figure 5: Solar REC eligibility
© BRIDGE TO INDIA, 2012 19
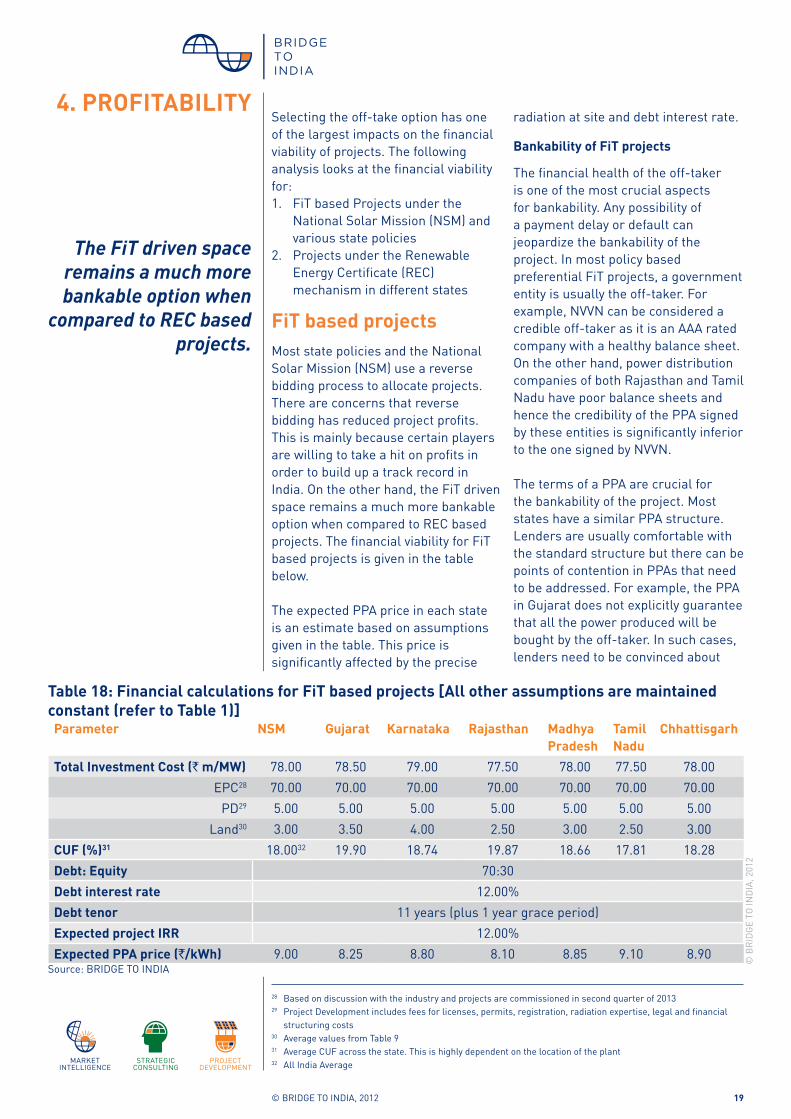
4. PROFITABILITYSelecting the off-take option has one of the largest impacts on the financial viability of projects. The following analysis looks at the financial viability for:1. FiT based Projects under the
National Solar Mission (NSM) and various state policies
2. Projects under the Renewable Energy Certificate (REC) mechanism in different states
FiT based projectsMost state policies and the National Solar Mission (NSM) use a reverse bidding process to allocate projects. There are concerns that reverse bidding has reduced project profits. This is mainly because certain players are willing to take a hit on profits in order to build up a track record in India. On the other hand, the FiT driven space remains a much more bankable option when compared to REC based projects. The financial viability for FiT based projects is given in the table below.
The expected PPA price in each state is an estimate based on assumptions given in the table. This price is significantly affected by the precise
Parameter NSM Gujarat Karnataka Rajasthan Madhya Pradesh
Tamil Nadu
Chhattisgarh
Total Investment Cost (` m/MW) 78.00 78.50 79.00 77.50 78.00 77.50 78.00EPC28 70.00 70.00 70.00 70.00 70.00 70.00 70.00
PD29 5.00 5.00 5.00 5.00 5.00 5.00 5.00Land30 3.00 3.50 4.00 2.50 3.00 2.50 3.00
CUF (%)31 18.0032 19.90 18.74 19.87 18.66 17.81 18.28Debt: Equity 70:30Debt interest rate 12.00%Debt tenor 11 years (plus 1 year grace period)Expected project IRR 12.00%Expected PPA price (`/kWh) 9.00 8.25 8.80 8.10 8.85 9.10 8.90
Table 18: Financial calculations for FiT based projects [All other assumptions are maintained constant (refer to Table 1)]
28 Based on discussion with the industry and projects are commissioned in second quarter of 201329 Project Development includes fees for licenses, permits, registration, radiation expertise, legal and financial structuring costs30 Average values from Table 931 Average CUF across the state. This is highly dependent on the location of the plant32 All India Average
radiation at site and debt interest rate.
Bankability of FiT projects
The financial health of the off-taker is one of the most crucial aspects for bankability. Any possibility of a payment delay or default can jeopardize the bankability of the project. In most policy based preferential FiT projects, a government entity is usually the off-taker. For example, NVVN can be considered a credible off-taker as it is an AAA rated company with a healthy balance sheet. On the other hand, power distribution companies of both Rajasthan and Tamil Nadu have poor balance sheets and hence the credibility of the PPA signed by these entities is significantly inferior to the one signed by NVVN.
The terms of a PPA are crucial for the bankability of the project. Most states have a similar PPA structure. Lenders are usually comfortable with the standard structure but there can be points of contention in PPAs that need to be addressed. For example, the PPA in Gujarat does not explicitly guarantee that all the power produced will be bought by the off-taker. In such cases, lenders need to be convinced about
© B
RID
GE
TO IN
DIA
, 201
2
Source: BRIDGE TO INDIA
The FiT driven space remains a much more bankable option when
compared to REC based projects.

© BRIDGE TO INDIA, 2012 20
the intent of the off-taker or other alternatives to off-take the power.
REC based projects
The REC mechanism provides a profitable alternative to project developers that are looking at alternatives to FiT based projects under reverse bidding. Developers that are willing to take on the REC risk, find that REC projects possibly offer higher returns. There are three possible business models around the REC – APPC+REC, Captive+REC and Third-party sale+REC. Please refer to BRIDGE TO INDIA’s INDIA SOLAR DECISION BRIEF on 'The REC Mechansim: Viability of solar projects in India' for more details on each of these business models.
The profitability of REC based projects are linked to the REC prices over the lifetime of the project. In addition, the PPA price also has a significant impact. One of the important differences between FiT based projects and REC based projects is the payment of open access charges to the DISCOM. Out of the three possible business models, the captive+REC and third-party sale+REC models have to bear the open access charges. The APPC+REC model which involves a PPA with the local DISCOM, does not attract open access charges. The open access charges vary from state to state and are significant triggers to project profitability.
Table 19 below shows the open access charges that must be borne by the developer for the third-party sale+REC model in the state of Tamil Nadu.
The open access charges vary from
Transmission Charges (`/MW/Month)
Wheeling Charges (`/kWh)
Transmission Loss (%)
Wheeling Loss (%)
CSS (`/kWh)
Industry Commercial
83,430 0.14 6.00 6.00 0.80 1.69
Source: BRIDGE TO INDIA
Table 19: Overview of open access charges
state to state and across voltage levels at which the plant is connected. Contact BRIDGE TO INDIA for a detailed analysis on the open access charges across all states in India.
© BRIDGE TO INDIA, 2012
Assumptions
PPA price (`/kWh)34 5REC prices (`/kWh)
2012-2017 9,3002017-2022 2,2002022-2027 0
Date of commissioning
June 1st 2013
Total project cost [` m (€m)]
78 (1.2)
Debt: Equity 70:30:00Debt interest rate 12%Debt tenor 11 years (1 year
grace period)
State Project IRR (%)
Gujarat 14.10Karnataka 14.30Rajasthan 15.10Madhya Pradesh 10.70Tamil Nadu 9.30Chhattisgarh 11.70
Table 20: Assumptions for REC based projects33
Table 21: Financial Analysis of REC projects
33 Refer to the INDIA SOLAR DECISION BRIEF on 'The REC Mechanism: Viability of solar projects in India' 34 Assumed PPA price is the average between APPC (~` 3.0) and Commercial price of electricity (~` 7.0) in India
In order to model the profitability of REC based projects, the following assumptions in table 20 have been made for an example calculation. The PPA price is assumed to be an average between APPC prices [~` 3.0 (€ 0.046)] under the APPC+REC model and commercial tariff [~` 7.0 (€0.11)] under the third-party sale + REC model.
Source: BRIDGE TO INDIA
© B
RID
GE
TO IN
DIA
, 201
2©
BR
IDG
E TO
IND
IA, 2
012
The REC mechanism provides a profitable alternative to project
developers that are looking at alternatives
to FiT based projects under reverse bidding.
One of the important differences between
FiT based projects and REC based projects is
the payment of open access charges to the
DISCOM.

© BRIDGE TO INDIA, 2012 21
For specific profitability evaluations contact BRIDGE TO INDIA.
Bankability of FiT projects
The bankability of REC based projects depend on the PPA strength and the risks associated with the REC mechanism. PPAs for REC based projects are either with the state DISCOM or with a third-party off-taker. In both cases, PPAs with AAA rated companies are preferred by banks. Alternative off-take opportunities must be presented to the banks in case of a severance of the PPA. One option is the open-access mechanism wherein the power producer uses the transmission network of the DISCOM to wheel the power to any third-party within or outside the state.
The risks surrounding the REC mechanism are twofold:
1. REC price uncertainty – Although the CERC has defined benchmarks within which RECs trade (see Section 2 - Solar Project Opportunities), a long-term price visibility is lacking. BRIDGE TO INDIAs analysis shows that benchmark (and therefore prices) can be fairly accurately predicted.
For a detailed analysis on REC prices contact BRIDGE TO INDIA.
2. Demand for RECs -The demand for RECs is linked to the enforcement of RPO. As on date, there have been no penalties enforced on obligated entities that have not met their RPOs. DISCOMs who contribute nearly 75% of the demand for RECs, have not been meeting their RPO targets. This remains the biggest risk in the entire REC mechanism. For a detailed RPO assessment, contact BRIDGE TO INDIA.
PPAs for REC based projects are either with
the state DISCOM or with a third-party off-
taker.
Although the CERC has defined benchmarks
within which RECs trade a long-term price
visibility is lacking.

© BRIDGE TO INDIA, 2012 22
5. OVERVIEW OF POLICIES
Policy Expected project opportunity (until 2017)
Off-taker Financial Incetives
Exemption of wheeling/ banking/ CSS charges
Single Window Clearnance
DCR Disadvantages Advantages
NSM 3000 RPO obligated en-tity or 3rd party35
Viability gap funding
Dependent on state in which project is executed
Dependent on state in which project is executed
YES • Competitive bidding has made tariffs unviable
• Domestic content requirement
• Phase 2 will not have the backing of NVVN
• Hefty bank guarantees have a negative impact on company balance sheets
• Transparent processes
• Flexibility to choose project location anywhere in India
• Financial incentives (FiT, GBI or VGF) backed by national clean energy fund.
• Apart from incentives given under the NSM, projects can also avail state level incentives.
• Opportunity to develop projects as large as 100MW
Gujarat NA36 State electrical services um-brella company (GUVNL)
Preferen-tial tariff (reverse bidding expected)
No Exemption NO NO • No clarity on future allocations (process or size of allocation)
• Discoms are already meeting their RPO and the state has surplus power, hence there is no real demand for solar. Any new allocations will depend on an induced demand
State Discoms as PPA signing authorities are bankable
Karnataka 160 State distribution companies 37
Preferential tariff based on reverse bidding
No Exemption NO NO • Very limited availability (only 40MW allocations every year till 2017), applications have already been received for 1.7GW
• No wheeling charges applicable
Rajasthan 350 RRECL38 Preferential tariff based on reverse bidding
No Exemption NO NO DISCOMs are in a poor financial state
• No Domestic Content Requirement
• PPAs are not signed with DISCOMs directly.
Madhya Pradesh
800 Under Discussion
NA NA NA NA NA NA
Andhra Pradesh
0 RPO obligated entity or 3rd party
None Exemptions available
YES NO • REC risks (See last column of this table)
• No clarity yet on the policy targets
• The policy has incentives for REC projects that contradict the eligibility rules for REC mechanism. NLDC might not register the project
• No financial support from the government to back the policy.
• Several incentives (Wheeling, Banking, transmission, CSS, etc.)
• Single window clearance
• Policy most suitable for business models where the developer needs to find non-government off-takers for power
Table 22: Overview of policies
Source: BRIDGE TO INDIA
© B
RID
GE
TO IN
DIA
, 201
2

© BRIDGE TO INDIA, 2012 23
35 NVVN is not likely to be the off-taker in Phase 2 of the NSM, given the fact that viability gap funding is being introduced (Read BRIDGE TO INDIA – India Solar Compass, October 2012) 36 Policy unclear as of 21st November 2012. 37 Karnataka’s distribution companies include: BESCOM - Bangalore Electricity Supply Company MESCOM - Mangalore Electricity Supply Company HESOM - Hubli Electricity Supply Company GESCOM – Gulbarga Electricity Supply Company CESCOM - Chamundeshwari Electricity Supply Company39 Rajasthan Renewable Energy Corporation Limited (RRECL), which in turn has independent PPAs with Rajasthan’s state electricity distribution companies that include: JVVNL – Jaipur VidyutVitran Nigam Limited JVVNL – Jodhpur VidyutVitran Nigam Limited AVVNL – Ajmer VidyutVitran Nigam Limited39 With the exception of the state of Andhra Pradesh40 With the exception of the state of Andhra Pradesh
Policy Expected project opportunity (until 2017)
Off-taker Financial Incetives
Exemption of wheeling/ banking/ CSS charges
Single Window Clearnance
DCR Disadvantages Advantages
Tamil Nadu
3000 RPO obligated entity or 3rd party
Preferential tariff based bidding (for a part of the target)
No Exemption YES NO • PPA with DISCOMs is not bankable
• The demand creation for SPOs will depend on the on-ground implementation.
• Demand to be created by mostly commercial and industrial consumers but there is no concession on wheeling, transmission, open charges to streamline the process.
• No financial support from the government to back the policy
• Significant demand induced through obligations (if implemented)
• Net metering allowed at various voltage levels, thus opens up the rooftop space.
• GBI given to domestic rooftop installations for 6 years
Chhatis-garh
1000 RPO obligated entity or 3rd party
None Electricity Duty exemption
YES NO • No financial support from the government
• Single Window clearance
• Government to promote infrastructure by setting up solar parks
REC Mecha-nism
0 DISCOM (@APPC) or 3rd
party
None39 None40 NO NO • Uncertainty of REC prices
• Lack of compliance by RPO entities
• Bankability issues• Grid-connectivity
issues
• Financially, the most attractive off-take option today
• Streamlined processes for registration of project
• Potential for a significant demand creation if obligations are enforced.
Source: BRIDGE TO INDIA
© B
RID
GE
TO IN
DIA
, 201
2

© BRIDGE TO INDIA, 2012 24
6. CHALLENGES AND RISKS Challenges
The Indian solar market is still emerging and is faced with specific challenges on several fronts. Challenges like debt financing, land acquisition, plant connectivity and grid infrastructure are risks to successful project execution in India. Learning effects from past projects have minimized these risks to some extent. Several project developers are using innovative strategies to
mitigate such risks. Example: the agreement between Kiran Energy and the Government of Gujarat. Kiran Energy secured a guarantee by the government against possible penalties for delays in executing their project due to non-availability of transmission lines from Gujarat Energy Transmission Corporation Limited (GETCO)41.
Figure 7 shows challenges, hurdles and local issues in project execution.
Figure 7: Project Execution Challenges in India
41 BRIDGE TO INDIA, India Solar Compass July Edition, 2012
© B
RID
GE
TO IN
DIA
, 201
2
Challenges like debt financing, land
acquisition, plant connectivity and grid
infrastructure are risks to successful project
execution in India.
Learning effects from past projects have
minimized these risks to some extent.
© BRIDGE TO INDIA, 2012 25
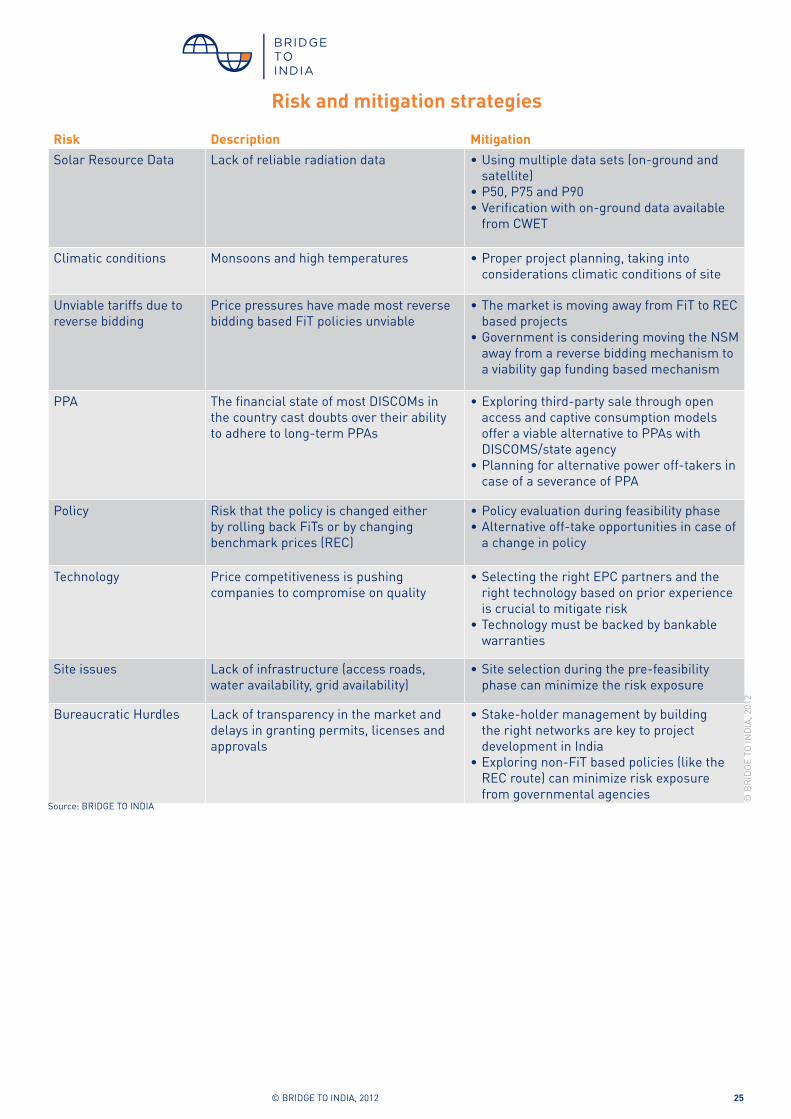
Risk Description MitigationSolar Resource Data Lack of reliable radiation data •Using multiple data sets (on-ground and
satellite)•P50, P75 and P90•Verification with on-ground data available
from CWET
Climatic conditions Monsoons and high temperatures •Proper project planning, taking into considerations climatic conditions of site
Unviable tariffs due to reverse bidding
Price pressures have made most reverse bidding based FiT policies unviable
•The market is moving away from FiT to REC based projects
•Government is considering moving the NSM away from a reverse bidding mechanism to a viability gap funding based mechanism
PPA The financial state of most DISCOMs in the country cast doubts over their ability to adhere to long-term PPAs
•Exploring third-party sale through open access and captive consumption models offer a viable alternative to PPAs with DISCOMS/state agency
•Planning for alternative power off-takers in case of a severance of PPA
Policy Risk that the policy is changed either by rolling back FiTs or by changing benchmark prices (REC)
•Policy evaluation during feasibility phase•Alternative off-take opportunities in case of
a change in policy
Technology Price competitiveness is pushing companies to compromise on quality
•Selecting the right EPC partners and the right technology based on prior experience is crucial to mitigate risk
•Technology must be backed by bankable warranties
Site issues Lack of infrastructure (access roads, water availability, grid availability)
•Site selection during the pre-feasibility phase can minimize the risk exposure
Bureaucratic Hurdles Lack of transparency in the market and delays in granting permits, licenses and approvals
•Stake-holder management by building the right networks are key to project development in India
•Exploring non-FiT based policies (like the REC route) can minimize risk exposure from governmental agencies
Risk and mitigation strategies
Source: BRIDGE TO INDIA
© B
RID
GE
TO IN
DIA
, 201
2

© BRIDGE TO INDIA, 2012 26
Processes/ Timeline
M 01
M 02
M 03
M 04
M 05
M 06
M 07
M 08
M 09
M 10
M 11
M 12
M 13
M 14
M 15
M 16
M 17
M 18
M 19
M 20
7. ANNEXURETimelines of a typical FIT based project in India
Planning Project planning
Internal technical analysis
Pre-regis-tration at state level
Allocation Announce-ment of Request for Selection (RfS)
Documenta-tion to meet techno-financial require-ments
Invitation to Request for Proposal (RfP) / Bids
Tariff dis-counting and submission of bid
Issue of Letter of Interest (LOI) after suc-cessful bid
Formation of Indian en-tity for PPA signing
Injection of equity into the Indian entity
Signing of PPA
Develop-ment
Land selec-tion
Land allot-ment/pur-chase and industrial conversion
All contrac-tual negotia-tions
Signing of vendor/EPC contracts
Apply for duty exemption on modules import
Source: BRIDGE TO INDIA
© B
RID
GE
TO IN
DIA
, 201
2

© BRIDGE TO INDIA, 2012 27
Finance Finance
applications
and closure
Execution
and
commis-
sioning
Import of
modules/
supply of
other equip-
ment
Construction
Request for
interconnec-
tion
Interconnec-
tion
Testing com-
missioningSource: BRIDGE TO INDIA
© B
RID
GE
TO IN
DIA
, 201
2

© BRIDGE TO INDIA, 2012 28
7.2. GLOSSARY OF TERMSAPPC Average Pooled Purchase Cost
AD Accelerated DepreciationCAPEX Capital ExpenditureCEA Central Electricity AuthorityCERC Central Electricity Regulatory CommissionCSS Cross Subsidy SurchargeCUF Capacity Utilization FactorDCR Domestic Content RequirementDISCOM Distribution CompanyEIRR Equity Internal Rate of ReturnEPC Engineering Procurement and ConstructionFiT Feed-in-TariffIRR Internal Rate of ReturnNLDC National Load Dispatch CenterNSM National Solar MissionNTPC National Thermal Power CorporationNVVN NTPC Vidyut Vyapar NigamPPA Power Purchase AgreementREC Renewable Energy CertificateRFP Request for ProposalRPO Renewable Purchase Obligation
© BRIDGE TO INDIA, 2012 29
8. GUEST ARTICLE
‘SOLARGUIDELINES.IN’: A TOOL FOR THE DEVELOPMENT OF SOLAR ENERGY PROJECTS IN INDIAWith the continuous efforts of the Central and State Governments, India has witnessed the installed solar power generation capacity of 1,045 MW41. The results so far have shown that the solar capacities have been developed by the involvement of both, experienced as well as less experienced project developers. It has been observed that the successful implementation and timely commissioning of projects requires numerous stages of approvals and clearances from multiple agencies, especially for the availability of land, permission for evacuation of power, permissions for construction and operation, and its financing etc. Financial closure remains the biggest hurdle in the timely commissioning of a project as the project developers have to fulfill necessary formalities for receiving a loan commitment from a financial institution which includes requirement of specific approvals and clearances from different agencies and organizations.
In order to meet the targets envisaged under the National Solar Mission and various policies announced by state governments, it was envisaged to streamline the process of project development by providing relevant and easily accessible information over a convenient and publically accessible platform. Accordingly, in line with the vision of providing an investor friendly mechanism envisaged under the Jawaharlal Nehru National Solar Mission, Dr Farooq Abdullah, Minister of New and Renewable Energy inaugurated the web based platform
‘Solar Guidelines’. ‘Solar Guidelines’ focuses on the legal-administrative-regulatory processes that are a part of project development as well as those pertaining to financial closure.It is a joint effort of Ministry of New and Renewable Energy, Government of India and Deutsche Gesellschaft für Internationale Zusammenarbeit (GIZ) GmbH.
The first phase of ‘Solar Guidelines’ undertook comprehensive research and consultations across the value chain for solar power generation projects proposed to be implemented in the State of Rajasthan following schemes announced under JNNSM and State Solar Policy. The second phase of the ‘Solar Guidelines’ will aim at replicating the concept to at least 10 more union states of India and will aim at including process requirements for grid connected as well as off-grid solar energy projects.
The ‘Solar Guidelines’ tool therefore aims at:• Analyzing the development
path from project idea to implementation (applications, certifications, clearances, approvals, agreements e.g. PPA, PSA, their interdependencies, costs and typical lead-time) for different size of projects, solar segments and states
• Analyzing the user expectations and requirements of project developers, nodal agencies, utilities, authorizsation bodies, finance institutions
• Streamlining the solar project proposals and make them time and cost efficient, enabling a qualified and professional solar market in India
India has provided a clear vision for creating a conducive environment for encouraging the deployment of
GIZ is a federal enterprise, which supports the German Government
in achieving its objectives in the field of international cooperation for
sustainable development.
GIZ operates in many fields: economic development and employment
promotion; governance and democracy; security, reconstruction,
peace building and civil conflict transformation; food security,
health and basic education; and environmental protection, resource
conservation and climate change mitigation. We support our partners
with management and logistical services, and act as an intermediary,
balancing diverse interests in sensitive contexts.
Tel: +49 61 96 79-0Fax: +49 61 96 79-11 15
www.giz.de
41 As on September 30th, 2012

© BRIDGE TO INDIA, 2012 30
solar energy. None the less, there is a necessity to make project development related information easily accessible. This will assist companies in taking informed business decisions and support investment in the segment. Recently, many states have come forward and announced the policies for development of solar energy projects. The web based tool ‘Solar Guidelines’ will facilitate the developers with relevant step by step information on various aspects related to successful and timely implementation of the project by creating more transparency in the Indian solar market and its stakeholders. The basis for the
development is the long-term experience of the developers gained in successful European solar markets and with similar tools.
After the successful implementation of Phase I focused on projects proposed for development in the State of Rajasthan, the Solar Guidelines will be transferred to Solar Energy Cooperation of India (SECI). During Phase II the tool will be developed for an additional ten States.
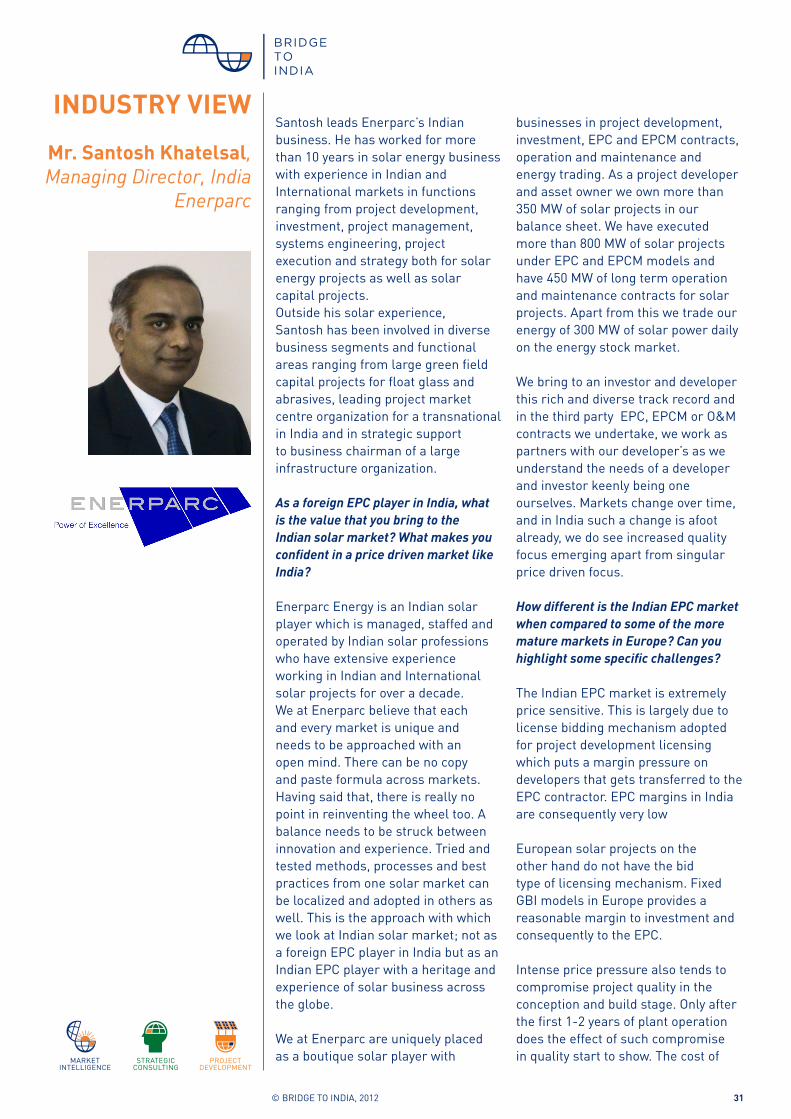
© BRIDGE TO INDIA, 2012 31
Santosh leads Enerparc’s Indian business. He has worked for more than 10 years in solar energy business with experience in Indian and International markets in functions ranging from project development, investment, project management, systems engineering, project execution and strategy both for solar energy projects as well as solar capital projects.Outside his solar experience, Santosh has been involved in diverse business segments and functional areas ranging from large green field capital projects for float glass and abrasives, leading project market centre organization for a transnational in India and in strategic support to business chairman of a large infrastructure organization.
As a foreign EPC player in India, what is the value that you bring to the Indian solar market? What makes you confident in a price driven market like India?
Enerparc Energy is an Indian solar player which is managed, staffed and operated by Indian solar professions who have extensive experience working in Indian and International solar projects for over a decade. We at Enerparc believe that each and every market is unique and needs to be approached with an open mind. There can be no copy and paste formula across markets. Having said that, there is really no point in reinventing the wheel too. A balance needs to be struck between innovation and experience. Tried and tested methods, processes and best practices from one solar market can be localized and adopted in others as well. This is the approach with which we look at Indian solar market; not as a foreign EPC player in India but as an Indian EPC player with a heritage and experience of solar business across the globe.
We at Enerparc are uniquely placed as a boutique solar player with
businesses in project development, investment, EPC and EPCM contracts, operation and maintenance and energy trading. As a project developer and asset owner we own more than 350 MW of solar projects in our balance sheet. We have executed more than 800 MW of solar projects under EPC and EPCM models and have 450 MW of long term operation and maintenance contracts for solar projects. Apart from this we trade our energy of 300 MW of solar power daily on the energy stock market.
We bring to an investor and developer this rich and diverse track record and in the third party EPC, EPCM or O&M contracts we undertake, we work as partners with our developer’s as we understand the needs of a developer and investor keenly being one ourselves. Markets change over time, and in India such a change is afoot already, we do see increased quality focus emerging apart from singular price driven focus.
How different is the Indian EPC market when compared to some of the more mature markets in Europe? Can you highlight some specific challenges?
The Indian EPC market is extremely price sensitive. This is largely due to license bidding mechanism adopted for project development licensing which puts a margin pressure on developers that gets transferred to the EPC contractor. EPC margins in India are consequently very low
European solar projects on the other hand do not have the bid type of licensing mechanism. Fixed GBI models in Europe provides a reasonable margin to investment and consequently to the EPC.
Intense price pressure also tends to compromise project quality in the conception and build stage. Only after the first 1-2 years of plant operation does the effect of such compromise in quality start to show. The cost of
Mr. Santosh Khatelsal,Managing Director, India
Enerparc
INDUSTRY VIEW

© BRIDGE TO INDIA, 2012 32
quality leading to higher downtime and reduced energy generation would bring in a culture to look at quality seriously which has already happened in Europe and in India has started in some cases.
New markets will always see an influx of EPC businesses. India is in such a phase now with many players in EPC space. The market in India is also enlarging and provides space for EPC players. Over time, there might be some consolidation happening.
Solar development is also seeing a change in India, moving partly from the bidding, licensing models to merchant and REC based revenue models. This will also bring in changes in the way developers look at quality and price tradeoffs.
How do you see the EPC business models evolving in India? Do you see Indian project developers acquiring EPC capabilities to become more integrated along the value chain? Or do you foresee a market for specific services such as EPCm?
Markets where solar business exists for a while like in Europe have moved away from turnkey EPC models to move cost effective and agile EPCM or EPC lite models and also manufacturer plays an active role in these emerging markets In the initial years when a new business like solar commences in a market, lack of awareness will normally compel developers to adopt a turnkey EPC model with liabilities and guarantees thrust on the EPC contractor. Partly financial institutes also prefer this approach to de risk investment owing to their lack of experience in solar. As markets start to mature, both the developers and the financing institutions starts to understand the nuances of the business and its risks. Cost effective build models like EPCM, EC or EPC lite then emerges as a dominant approach. We are already seeing this emerge in India and expect these models to be the dominant vehicle in future
for project execution in India given that this market is extremely price sensitive.
Developers especially IPPs with a clear focus in solar would prefer to do a good part of design and procurement activities in house. Once experience of the first few projects is acquired by a developer, it makes sense to utilize the same and move away from an expensive turnkey EPC solution to an EPCM or EC model with some of the activities in the value chain being handled by the developer.
We observe huge discrepancies if it comes to plant performance in India. Can you talk about the importance of engineering and design in the overall EPC?
Solar photovoltaic is a business where standardization in systems design and energy estimation is not yet happened. Take for example energy estimation. There are many resource datasets to choose from and they do present differing values of resource for a specific location. There are also different simulation tools and software available and the outputs of energy simulation between these various tools differ.
Technology choices between crystalline and thin films, between plant configuration, inverter choice, mounting system choice etc are all dependent on the assumptions used in design which like any design practice is partly driven by experience and partly analytical.
A solar project conceived in its initial stages using incorrect assumptions on say energy, degradation, capex or O&M costs will no doubt look good on paper but operational realities and consequently the profitability of such investments becomes suspect. Design and engineering is consequently a very important part of a solar project

© BRIDGE TO INDIA, 2012 33
What are the technology trends that you observe in the market given regulations such as the DCR? Do you think that thin-film technology deserves the market share it currently enjoys? What are the specific changes in trends that you observe (if any)?
As we discuss the subject of domestic content, there are changes being proposed for the same in India. The existing DCR stipulations are being revised and one needs to await the outcome of these deliberations on DCR requirements.
Choice of a technology and the market share it gains is in the end a commercial and project investment economics decision depending on location of the project, the cost, temperature and insolation conditions and financing facilitation. Every technology has its rightful place in the market and market forces will obviously drive choices made.
Solar modules are increasingly getting commoditized. The percentage of project cost that solar modules represent is reducing over the past few years. Balance of systems costs have hence started to play a significant part in project investment economics. In majority of the projects, balance of systems is sourced locally.
Since the Indian market is largely driven by price sensitivity, there can be a tendency to go with the technology provider that offers the lowest price.How do you make technology choices? What are the trade-off’s if any?
This is very much an investor specific decision. Some investors who are in the business for the long run and who
rely on generation based revenues to justify investments do make technology choices different from other types of investors who may be looking at mid-term valuation of assets as key driver for decision.
Having said that, there are a few levers on technology choice that needs to be considered. Initial capex investment for the entire project including land and developer’s expense is one parameter. A tendency to look at module level costs to decide on technology will be faulty as land requirement and balance of systems needs vary across technologies. The second aspect to consider is temperature coefficient. In hotter climate some technologies loses power faster with increasing ambient temperature than others. The third factor to consider is year on year power degradation. The fourth parameter to consider is the interest rate and debt financing support.
Life cycle energy generation and life cycle costs are the parameters on which an assessment on technology choices will be done.
Among the factors stated above, a given technology will score well in some and less in other factors for a given project location. The only choice driver can be project economics, IRR and NPV assessment for various technologies and its sensitivities. This choice tends to be location and project specific.

© BRIDGE TO INDIA, 2012 34
Mr. Hemant Bhatnagar,Technical Expert -
ComSolar, Indo-German Energy
Program, GIZ
Hemant has been extensively working on areas for promotion of solar energy in India. He has an in-depth understanding of policy and regulatory framework for promotion of the renewable energy sector in India. Recently, he has supported the Ministry of New and Renewable Energy in preparing a database for development of solar energy projects called ‘solarguidelines.in’. He had advised regulators, utilities, renewable energy project developers on a variety of issues including matters related to policy and regulations, financial feasibility of projects, market and project development, appropriate off-take arrangements etc. He has written papers on prominent issues related to promotion of solar energy in India.
What can India learn from mature solar markets like Germany and where does India need to find its own solutions?
India has launched its ambitious programme, the Jawaharlal Nehru National Solar Mission, dedicated to encourage the solar energy market. The first phase of the mission has showcased and built confidence in large scale solar energy. A small capacity of 100 MW was dedicated for small scale solar energy projects. However, now, the need of the hour is to formulate suitable policies to increase use of solar energy at the consumer level with majority of roofs installing solar facilities of suitable capacities in each city.
Here, India can draw experience from Germany which has devised transparent framework for penetration of rooftop photovoltaic facilities. Germany followed a feed-in-tariff mechanism together with specifying appropriate grid protocol. Germany had an installed capacity of around 1 GW in 2004 which grew to more than 31 GW, in 2012. It is worth mentioning that more than half of the capacities are installed in the rooftop and small scale solar segments. The feed-in-tariff route
has already been recognised in other European countries active in pursuing deployment of solar energy for electricity generation.
India may also adopt such a framework after suitable modification as per the Indian legal framework.
Is the introduction of global trade barriers, such as punitive tariffs, detrimental to competition and innovation in the field of solar power?
Phase I of the NSM has seen a tremendous decrease in prices following the unrestricted trade of solar components in certain technology segments. This also led to the lowering of the cost of solar energy generation, translating to a reduced impact on consumer tariffs. Specifying a framework focusing on the use of domestic content would certainly enable the development of a market for components manufactured indigenously. However, this may require ramping up existing manufacturing capacity so as to follow the targets envisaged under the frameworks specified for promotion of solar energy in India.
In the short term, India may consider allowing the trade of components with a larger focus on developing domestically manufactured capacities in th e coming years. With consideration to domestically manufactured components, the need is also to maintain the prices which JNNSM has discovered in different rounds of bidding. Next, the standards may also be specified assuring the quality of components.
The mission has a clear mandate to create favourable conditions for solar manufacturing facilities together with creating an enabling environment for attracting international finance and technology transfer. The Government may consider providing appropriate incentives to global manufacturers for making investments in creating manufacturing facilities to create

© BRIDGE TO INDIA, 2012 35
an environment for international investments and technology development.
What is needed for the commercialization of solar energy in urban and industrial areas?
Suitable and proven business models which make economic sense are needed to commercialise and adopt solar energy in urban and industrial areas. Secondly, Governments’ should aim at creating a competitive environment translating to the reduction in cost of technology. This will enable its easy adoption in the various consumer categories and not only in urban and industrial areas.
The photovoltaic power generation market in India has been highly competitive following which the selling price of electricity has seen a steep decline from one round of bidding to another, ultimately benefiting the consumers of electricity. A similar environment should also be introduced for Concentrated Solar Thermal technology application in industrial sector.
GIZ, in its cooperation with the MNRE is aiming at demonstrating solar thermal application in pulp & paper, textile, pharmaceuticals and food processing sectors. Receiving mixed responses from the stakeholders of these industrial sectors we realised that assured capital subsidy along with tax incentives and other benefits are not enough to attract stakeholders adopting solar thermal application in the high temperature segment for their industrial processes. Stakeholders are looking for lower payback period than envisaged by us. This would only be achieved when there is enough competition and service providers in the segment. Further, facilitating the loans at subsidised interest rates for promoting such facilities may also be counted as one step forward for supporting the commercialisation of concentrating solar thermal
technologies in the industrial sector.
Large ground-mounted PV or rooftop PV; where should India focus in the short to mid-term?
The German market has evolved following photovoltaic installations on the roofs of the consumers of electricity. However, the requirements for project implementation in India are far different to that in Germany.India has distinct factors for the development of solar projects including better solar insolation levels, gap in demand and supply of electricity, abundance of land, subsidies and incentives available under policies etc. Thus in the short to medium term, in my opinion, India should focus on developing large scale projects. This would also aid in making the market mature and ensure lowering the upfront investment cost. This would also support in transfer of technology and aid in the adoption of rooftop photovoltaic facilities in the future.
Nonetheless, an opportunity exists for adopting rooftop photovoltaic facilities within a few consumer categories, especially commercial consumers who are paying around 8~9 Rs/ kWh. Deploying rooftop solar photovoltaic facilities for self-consumption may be a suitable proposition for them. It would also ensure a lesser dependence on the distribution company and lowering in the electricity bill to some extent. Thus for the short-term the Government may also focus for introducing net metering or billing or similar mechanism after assessing its economic sense in a few consumer categories to encourage the rooftop solar photovoltaic market.
According to you, what are the key hurdles facing adoption of distributed solar power in India? How can they be overcome?
Regulations on technical standards for connectivity with the grid would play a significant role. These regulations will

© BRIDGE TO INDIA, 2012 36
provide the necessary guidance to the stakeholders for following standard procedure providing connectivity to the rooftop projects.
Second challenge would be dealing with variable and uncertain grid availability. The distributed solar facilities of small capacity would be connected to the distribution network and in the absence of the lectricity grid, the facility should be allowed to switch off or else advance methods needs to be applied to control the load, which will again increase upfront investment cost. The framework needs to be specified by the regulator which ensures for the compensation of deemed generation in the absence of the grid.
A third major challenge involves addressing the impacts of distributed solar generation on the electricity distribution network. Unless a robust framework is in place it would be cumbersome to manage the grid with distributed solar generation, that is infirm in nature.

© BRIDGE TO INDIA, 2012 37
Dr. Tobias Engelmeier founded BRIDGE TO INDIA in 2008 as an integrated Indian solar service provider. He was awarded a doctorate in political science from the South Asia Institute of the University of Heidelberg for his thesis on the relationship between identity and strategy in Indian politics. Prior to his doctorate, he worked for a leading strategy consultancy, where he advised large European utilities on how to engage with the fast-rising market for renewable energies. At BRIDGE TO INDIA, he has provided consultancy services to multinationals as well as SMEs, to institutions, governments and to investors. He has published many reports, articles as well as two books on the topics of India and energy.
Mr. Oliver Herzog joined BRIDGE TO INDIA in July 2011 as Director. He studied Business Administration with a focus on accounting/controlling and general management at the University of Applied Science in Cologne. During his studies he worked for an international consultancy company with a focus on strategic management and restructuring. After his studies, in January 2004, he joined a leading global renewable energy company, where he worked for eight years. During the last two years he headed the operations of the project development and financing arm in Singapore and India. He set up a trust worth €200m with GE Financial, to invest into renewable energy projects across Asia and built a project pipeline of more than 400MW of PV, wind, small hydro and biogas projects in India.
What is the significance of solar as a resource for India?
Dr. Engelmeier
Solar in India is crucial. For one, it is the only credible long-term power supply strategy. Fossil fuels are limited, nuclear power has not kept
Mr. Oliver HerzogDirector, Bridge To India
its promises and wind, biomass and hydropower are limited in potential. In order to meet India’s enormous energy demands, India needs solar power. In addition, solar power can already today help India achieve a better power supply. Irradiation levels are amongst the highest in the world. There is an electricity deficit in India that will cause blackouts for many years to come. So, the fundamentals of solar power in India make sense. This drives the industry.
Mr. Herzog It is important to note that solar power in India has already reached grid parity in many places. That means that for certain tariff groups and in certain locations, it already makes sense to add solar power to the overall power mix and thereby reduce the cost of energy, hedge against future tariff hikes and increase the security of power supply. The process to make solar commercially viable has begun and it will spread to the larger parts of the market from here. In our view, this is the real market to look out for. At the same time, however, there are numerous project opportunities available for multi-MW scale projects under various governmental feed-in-tariff schemes. Here, we work with international investors to develop projects for them as a “remittance” project developer. What makes the Indian solar market different from the other new as well as existing global markets?
Mr. Herzog
India, at the moment, is not able to meet its energy requirements. Hence there is a crucial need for every kWh that can be produced. India needs to produce affordable power and not replace power. This makes the Indian market different from any of the early solar markets in Europe or the US. Solar power in India is a necessity, not a choice.
Dr. Tobias Engelmeier Founder, Managing
Director, Bridge To India
© BRIDGE TO INDIA, 2012 38
Dr. Engelmeier
Over the last two years, the cost of solar has fallen dramatically. While this is a global phenomenon, India has, through the auction process, been able to closely mirror that drop in prices and reduced margins to a bare minimum. All players along the value chain have stretched themselves more than ever before. This has advanced the case for solar power as it has brought it into the vicinity of parity with other sources of power and has strengthened the case for this technology in India.
What is the market potential of the Indian solar industry? How realistic are the growth projections?
Mr. Herzog
The NSM and various state policies at present have capacity addition plans of more than 20GW until 2022. While still at an early stage with currently around 1GW of installed capacity, we believe that India is on course to reach that target. Commercial parity will further boost the solar market. Our estimate is that by 2016 we will have a total, cumulative installed capacity of more than 12GW across various market segments. Currently, the overall energy structure under the NSM is focussed on larger MW-scale power plants feeding into the grid. The captive market will take off, once a stronger regulatory framework with e.g. net-metering is in place.
Dr. Engelmeier
Reaching grid parity or commercial parity is going to change the
market significantly. This will be an inflection point, and will reset the market potential of solar industry in India, given India’s massive energy demand. Innovation in energy storage technologies will bring a second inflexion point which will boost the decentral systems further. In the short term, a lot will also depend on whether the Renewable Purchase Obligations market will take off and whether there will be a domestic content requirement. We have just written reports on these topics to analyse them in-depth.
What are the challenges for the industry at the moment and what can be done to overcome them?
Dr. Engelmeier
The greatest push would come from a further de-regulation of electricity prices. India’s electricity prices at present are not reflecting the actual costs of generation. A liberation of this market would have two profound effects: it would lead to significant and much-needed investment into grid-infrastructure and it would lead to a rise in power prices, thus making solar a more attractive option.
Mr. Herzog
The Indian government should also invest more in research. For India to become a global technology leader, the focus should be on de-central applications, low cost applications, mini-grids, rural applications, and storage. Around these challenges and skills, a world class industry can be formed, with a view to replicating Indian models internationally.
Over the last two years, the cost of
solar has fallen dramatically.
The Indian government should also invest more in research.
For India to become a global technology
leader, the focus should be on de-
central applications, low cost applications,
mini-grids, rural applications, and
storage.
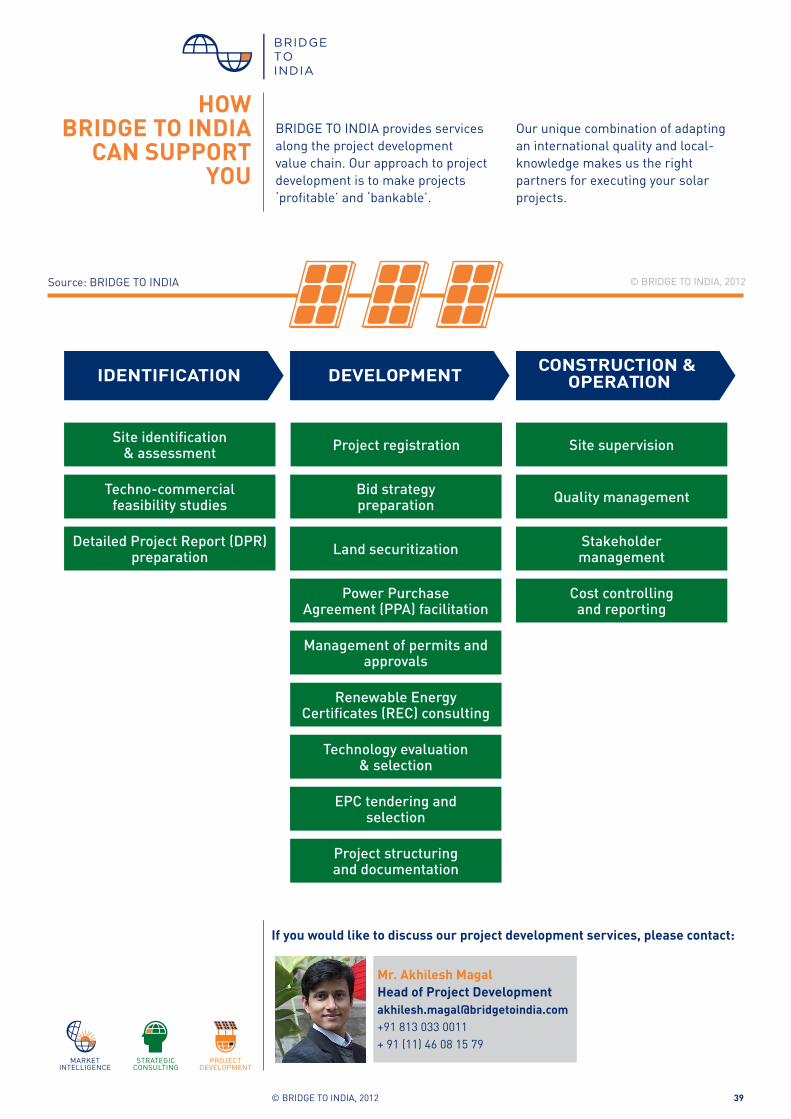
© BRIDGE TO INDIA, 2012 39
HOW BRIDGE TO INDIA
CAN SUPPORT YOU
© BRIDGE TO INDIA, 2012Source: BRIDGE TO INDIA
BRIDGE TO INDIA provides services along the project development value chain. Our approach to project development is to make projects ‘profitable’ and ‘bankable’.
DEVELOPMENT CONSTRUCTION & OPERATIONIDENTIFICATION
Site identification & assessment Project registration Site supervision
Quality management
Stakeholder management
Cost controlling and reporting
Management of permits and approvals
Bid strategy preparation
Land securitization
Power Purchase Agreement (PPA) facilitation
Renewable Energy Certificates (REC) consulting
Technology evaluation & selection
EPC tendering and selection
Project structuring and documentation
Techno-commercial feasibility studies
Detailed Project Report (DPR) preparation
Our unique combination of adapting an international quality and local-knowledge makes us the right partners for executing your solar projects.
Mr. Akhilesh MagalHead of Project [email protected]+91 813 033 0011+ 91 (11) 46 08 15 79
If you would like to discuss our project development services, please contact:

© BRIDGE TO INDIA, 2012 40
BUILD YOUR
BRAND
BRIDGE TO INDIA is a key knowledge disseminator on the Indian solar market. Having tracked the market since 2010, our regularly published analysis reaches more than 10,000 readers from various segments of the global solar industry.
OUR REPORTS
GET MAXIMUM COVERAGE
3-4 articles monthly in international online and print publications
PRESS 6,300subscribers
NEWSLETTER
9,000 visitors per month
WEBSITE
More than 9,500 readers
REPORTS
2 – 3 new posts weekly,1000 readers per week
BLOGCONFERENCES Speakers at more than 11
international events
SOCIAL MEDIA Nearly 650 members on LinkedIn group - India’s Solar Future
INDIA SOLAR POLICY BRIEF-National Solar Mission[March 2013]A detailed overview on phase two of the NSM
INDIA SOLAR COMPASS [January 2013] A quarterly in-depth analsys of the Indian solar market, policy, financing and reports.
© BRIDGE TO INDIA, 2012Illustration by Kavya Bagga
INDIA SOLAR
COMPASSOctober 2012 Edition
Market DashboardA snapshot of the market’s
fundamentals
Latest Market In-sightsAn analysis of the policies,
projects, industry and finance
A Key Question AnsweredHow will viability gap funding
under phase two of the NSM impact the market?
OutlookQuarterly projections for the
Indian solar PV market
SPONSORED BY
CONTACT USMohit Anand
[email protected]+91 11 46 08 15 79
INDIA SOLAR DECISION BRIEF - FINANCING [February 2013]Detailed research on financial structuring of solar projects in India.
The REC Mechanism
Viability of solar projects in India
ASSOCIATE SPONSORS
LEAD SPONSOR
FINANCING FOR SOLAR PROJECTS
IN INDIA
© BRIDGE TO INDIA, 2012Original illustration by Dwarka Nath Sinha
INDIA SOLARDECISION BRIEF
MORE THAN
READERS THROUGHDOWNLOADS
READERS THROUGHPHYSICAL DISTRIBUTION
2,000
36,000
INDIA SOLAR POLICY BRIEF-
NSM
© BRIDGE TO INDIA, 2012 41
BRIDGE TO INDIA is a consulting company with an entrepreneurial approach based in New Delhi, Munich and Hamburg. Founded in 2008, the company focuses on renewable energy technologies in the Indian market. BRIDGE TO INDIA offers market intelligence, strategic consulting and project development services to Indian and international investors, companies and institutions. Through customized solutions for its clients, BRIDGE TO INDIA contributes to a sustainable world by implementing the latest technological and systemic innovations where their impact is the highest.
www.bridgetoindia.comFollow us on facebook.com/bridgetoindia
www.bridgetoindia.com/blog


