22
Bridging the Gap between idealized and realistic numerical river plume simulations Robert Hetland Texas A&M University
| Date post: | 19-Dec-2015 |
| Category: |
Documents |
| View: | 217 times |
| Download: | 1 times |

Bridging the Gap between idealized and realistic numerical river plume
simulations
Robert HetlandTexas A&M University

Feedback between idealized and realistic modeling
Idealiz
ed
modelin
g
Realis
tic
mod
elin
g
Numerical consistency
Physical consistency
Metrics(Depends on user
requirements)

Transition to operational models
• What are the requirements of the model end-user?– A metric that embodies this requirement.
• How do you quantify good model performance?– Skill assessment measures model’s ability to
reproduce the desired metric.

Metric - Fresh water flux
• Broad, integrative metric for buoyancy flow as a whole.
• Depends on definition of reference salinity.
• Also interested in the nature of the fresh water flux (e.g., what kind of water carries the fresh water?)

Model skill - ‘Synoptic skill’

Anatomy of a river plume
• Assume that the plume may be divided into dynamically distinct regions:– Near field where advection of
momentum is important.– Far field where wind forcing and the
earth’s rotation are the dominant physics.

Dynamically definedplume regions - cross section

Dynamically definedplume regions - cross section

Plume structure - Day 8.3 (mean flow, no wind)
Surface salinity Fresh water thickness

Mixing and the Froude # Max. vertical salt flux Froude number

Dynamically definedplume regions - cross section

Plume structure
Upwelling Downwelling DownwellingUpwelling
Surface salinity Fresh water thickness

Vertical salt flux - with windupwelling downwelling No wind

Integrated vertical salt fluxWind/no wind comparison
Wind
No wind
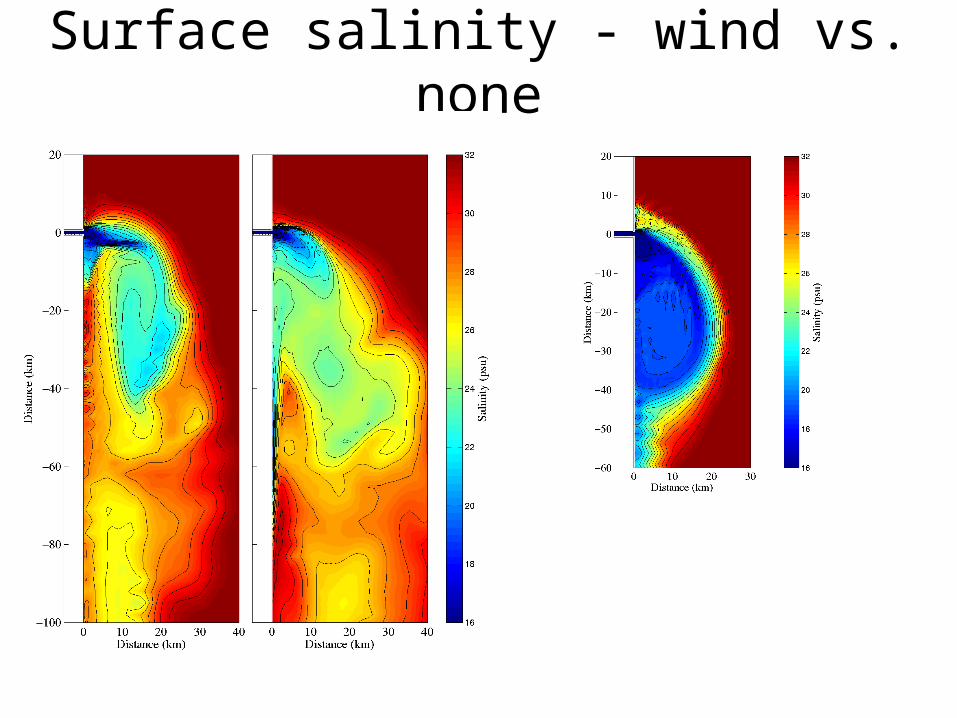
Surface salinity - wind vs. none

QuickTime™ and aGIF decompressorare needed to see this picture.
Gulf o
f M
ain
eSea s
urf
ace
salin
ity
Hetl
and &
Sig
nell

Fresh water flux EMCC

Fresh water flux WMCC
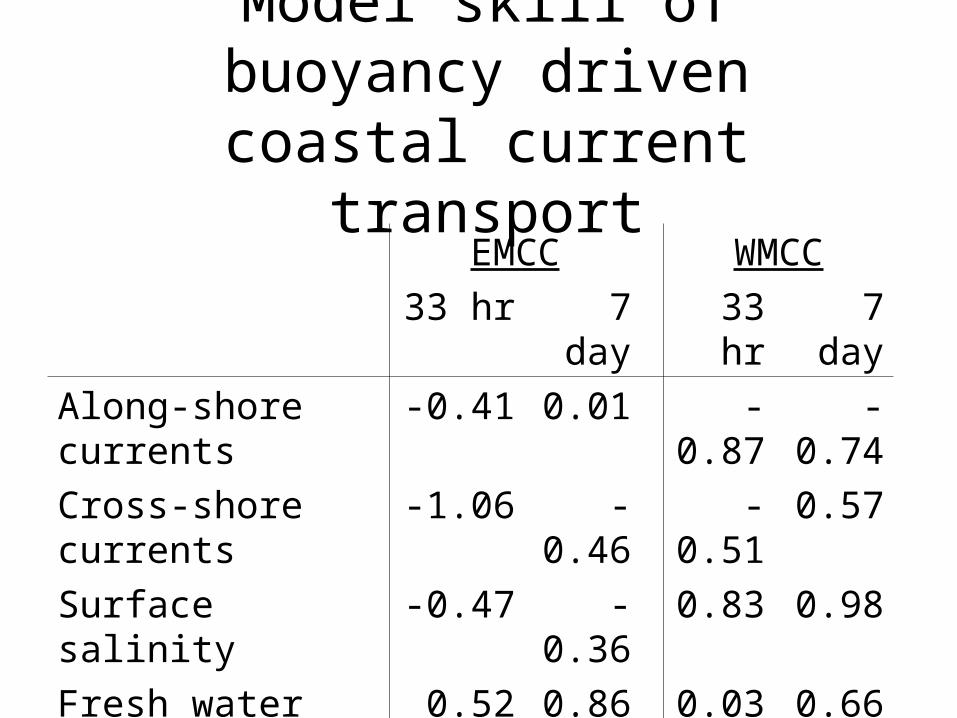
Model skill of buoyancy driven coastal current transport
EMCC WMCC
33 hr 7 day 33 hr 7 day
Along-shore currents -0.41 0.01 -0.87 -0.74
Cross-shore currents -1.06 -0.46 -0.51 0.57
Surface salinity -0.47 -0.36 0.83 0.98
Fresh water flux 0.52 0.86 0.03 0.66

Realistic model conclusions
• While the model does not have high skill at point-by-point comparisons, the model is good at simulating the large ‘whole plume’ scale.
• The model resolution is not high enough to resolve the estuary/near field regime, but still simulates the fresh water transport correctly.
Wind forcing must reduce the sensitivity to the source

Fresh water (salinity class)Q
f = 1
000
m3 s
-1
max= 0.1 m2 s-2Q
f = 3
000
m3 s
-1
max= 0.2 m2 s-2
Future direction
• Idealized modeling:– How does wind control the plume salinity
and spatial dimensions?– How do other types forcing (background
flow, pulsing discharge) influence water mass modification by the wind.
• Realistic modeling: – What are reasonable ranges in parameter
space?– What is required to resolve the small-scale
features of the plume?


