AAAS Analysis: Federal R&D and Sequestration AAAS | September 27, 2012 | www.aaas.org/spp/rd Page 1 of 20 Brief: Federal R&D and Sequestration In The First Five Years By Matt Hourihan KEY FINDINGS: • Through 2017, sequestration could reduce federal R&D expenditures by $57.5 billion, or 8.4 percent. The reduction would average $11.5 billion per year, and total $12.1 billion in the first year. 1 • Defense R&D could be reduced by a total of $35.6 billion, or 9.1 percent, averaging $7.1 billion per year. This would be roughly equivalent to FY 2002 levels. • Nondefense R&D, including funding at the National Institutes of Health, the National Science Foundation, the Departments of Energy and Agriculture, and NASA, could be cut by a total of $21.9 billion over five years, or 7.6 percent per agency. The budgets for many agencies would be at their lowest point in a decade or more. • Under a nondefense-only scenario, nondefense R&D could be cut by $50.8 billion, or 17.2 percent, averaging $10.2 billion per year total. i Sequestration – the large, automatic, across-the-board reductions in federal funding set to begin in January of 2013 – remains a major concern for many inside and outside Washington. The cuts, established in the Budget Control Act of 2011, are intended to reduce the federal deficit by $1.2 trillion over the next decade. These savings will be achieved through annual cuts of $55 billion to defense discretionary spending and up to $38 billion to nondefense discretionary spending. In the first year, these cuts amount to 9.4 percent for defense and 8.2 percent for nondefense; over nine years, actual spending cuts would amount to $984 billion. Cuts of this magnitude would no doubt have significant impacts on federal funding of science, research, and innovation. They also come at a time when 1 Note: sequestration extends through 2021, but we only cover the first five years to allow for adjustment for inflation, based on OMB’s price deflators through 2017. Estimated R&D Cuts Under Balanced Sequestration, FY 2013-2017 (budget authority in millions of constant 2012 dollars) 2013 2014 2015 2016 2017 Total Cut 5-Year Percent Dept of Defense -6,928 -6,818 -6,696 -6,585 -6,495 -33,524 -9.1% HHS -2,528 -2,429 -2,333 -2,241 -2,155 -11,685 -7.6% NIH -2,439 -2,343 -2,251 -2,162 -2,079 -11,274 -7.6% Dept of Energy -972 -944 -916 -889 -865 -4,585 -8.2% Natl Sci Foundation -456 -438 -421 -404 -388 -2,106 -7.6% NASA -763 -733 -704 -676 -650 -3,527 -7.6% Dept of Agr -189 -182 -175 -168 -161 -875 -7.6% Dept of Commerce -103 -98 -95 -91 -87 -474 -7.6% Dept of the Interior -65 -62 -60 -57 -55 -299 -7.6% EPA -46 -44 -43 -41 -39 -213 -7.6% Homeland Security -50 -48 -46 -44 -43 -232 -7.6% Total R&D Cut -12,099 -11,796 -11,488 -11,196 -10,939 -57,519 -8.4% Source: AAAS estimates of R&D, based on CBO and OMB analyses of the Budget Control Act. Constant dollar conversions based on OMB's GDP deflators from the FY 2013 budget.
Transcript
AAAS Analysis: Federal R&D and Sequestration
AAAS | September 27, 2012 | www.aaas.org/spp/rd Page 1 of 20
Brief: Federal R&D and Sequestration In The First Five Years
By Matt Hourihan
KEY FINDINGS:
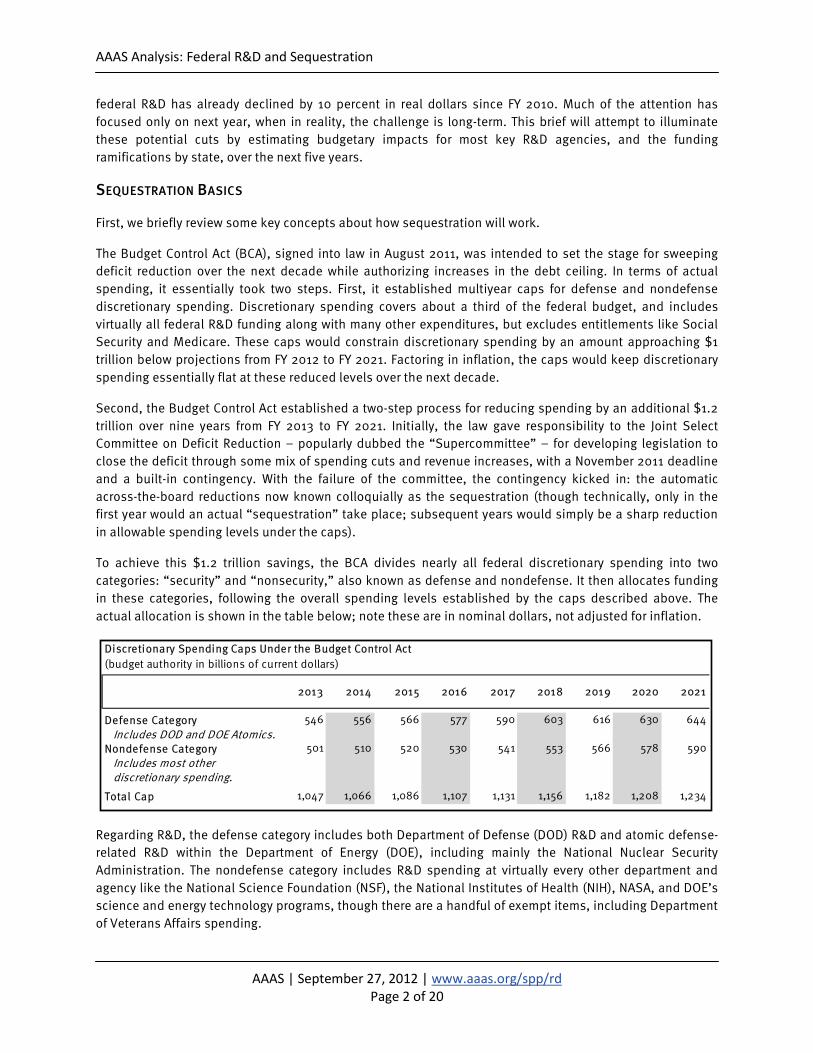
• Through 2017, sequestration could reduce federal R&D expenditures by $57.5 billion, or 8.4 percent. The reduction would average $11.5 billion per year, and total $12.1 billion in the first year.1
• Defense R&D could be reduced by a total of $35.6 billion, or 9.1 percent, averaging $7.1 billion per year. This would be roughly equivalent to FY 2002 levels.
• Nondefense R&D, including funding at the National Institutes of Health, the National Science Foundation, the Departments of Energy and Agriculture, and NASA, could be cut by a total of $21.9 billion over five years, or 7.6 percent per agency. The budgets for many agencies would be at their lowest point in a decade or more.
• Under a nondefense-only scenario, nondefense R&D could be cut by $50.8 billion, or 17.2 percent, averaging $10.2 billion per year total.i
Sequestration – the large, automatic, across-the-board reductions in federal funding set to begin in January of 2013 – remains a major concern for many inside and outside Washington. The cuts, established in the Budget Control Act of 2011, are intended to reduce the federal deficit by $1.2 trillion over the next decade. These savings will be achieved through annual cuts of $55 billion to defense discretionary spending and up to $38 billion to nondefense discretionary spending. In the first year, these cuts amount to 9.4 percent for defense and 8.2 percent for nondefense; over nine years, actual spending cuts would amount to $984 billion. Cuts of this magnitude would no doubt have significant impacts on federal funding of science, research, and innovation. They also come at a time when
1 Note: sequestration extends through 2021, but we only cover the first five years to allow for adjustment for inflation, based on OMB’s price deflators through 2017.
Estimated R&D Cuts Under Balanced Sequestration, FY 2013-2017(budget authority in millions of constant 2012 dollars)
Source: AAAS estimates of R&D, based on CBO and OMB analyses of the Budget Control Act.Constant dollar conversions based on OMB's GDP deflators from the FY 2013 budget.
AAAS Analysis: Federal R&D and Sequestration
AAAS | September 27, 2012 | www.aaas.org/spp/rd Page 2 of 20
federal R&D has already declined by 10 percent in real dollars since FY 2010. Much of the attention has focused only on next year, when in reality, the challenge is long-term. This brief will attempt to illuminate these potential cuts by estimating budgetary impacts for most key R&D agencies, and the funding ramifications by state, over the next five years.
SEQUESTRATION BASICS
First, we briefly review some key concepts about how sequestration will work.
The Budget Control Act (BCA), signed into law in August 2011, was intended to set the stage for sweeping deficit reduction over the next decade while authorizing increases in the debt ceiling. In terms of actual spending, it essentially took two steps. First, it established multiyear caps for defense and nondefense discretionary spending. Discretionary spending covers about a third of the federal budget, and includes virtually all federal R&D funding along with many other expenditures, but excludes entitlements like Social Security and Medicare. These caps would constrain discretionary spending by an amount approaching $1 trillion below projections from FY 2012 to FY 2021. Factoring in inflation, the caps would keep discretionary spending essentially flat at these reduced levels over the next decade.
Second, the Budget Control Act established a two-step process for reducing spending by an additional $1.2 trillion over nine years from FY 2013 to FY 2021. Initially, the law gave responsibility to the Joint Select Committee on Deficit Reduction – popularly dubbed the “Supercommittee” – for developing legislation to close the deficit through some mix of spending cuts and revenue increases, with a November 2011 deadline and a built-in contingency. With the failure of the committee, the contingency kicked in: the automatic across-the-board reductions now known colloquially as the sequestration (though technically, only in the first year would an actual “sequestration” take place; subsequent years would simply be a sharp reduction in allowable spending levels under the caps).
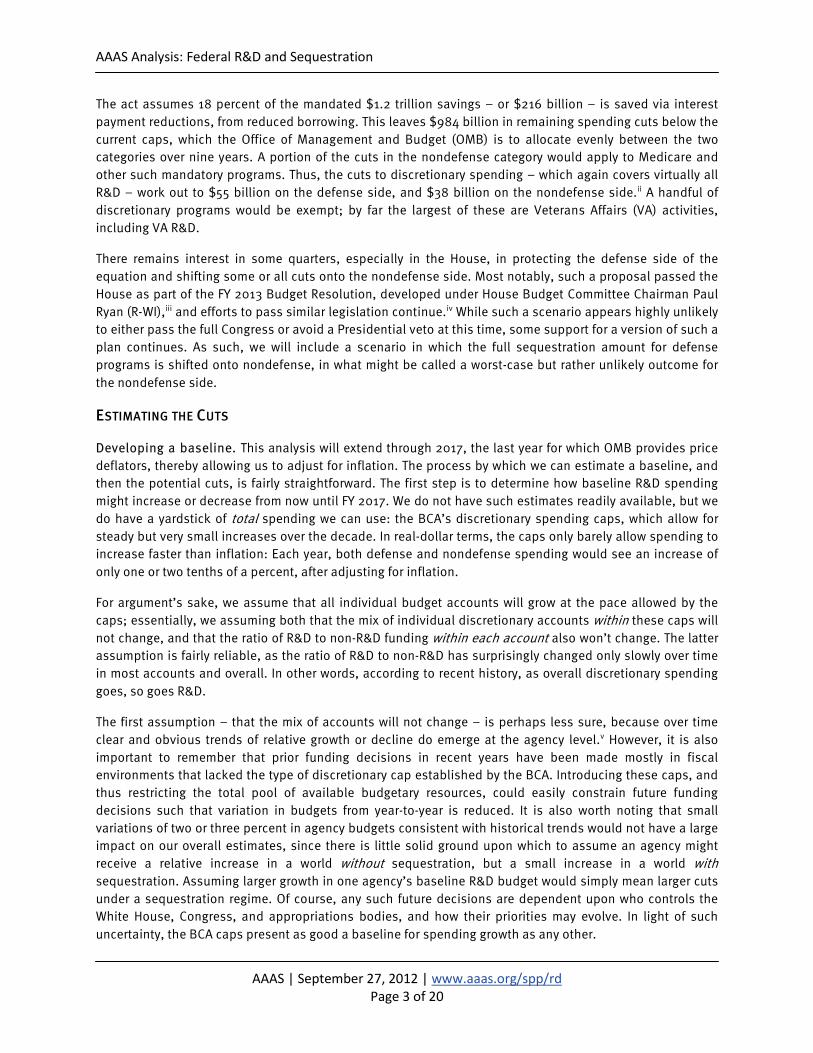
To achieve this $1.2 trillion savings, the BCA divides nearly all federal discretionary spending into two categories: “security” and “nonsecurity,” also known as defense and nondefense. It then allocates funding in these categories, following the overall spending levels established by the caps described above. The actual allocation is shown in the table below; note these are in nominal dollars, not adjusted for inflation.
Regarding R&D, the defense category includes both Department of Defense (DOD) R&D and atomic defense-related R&D within the Department of Energy (DOE), including mainly the National Nuclear Security Administration. The nondefense category includes R&D spending at virtually every other department and agency like the National Science Foundation (NSF), the National Institutes of Health (NIH), NASA, and DOE’s science and energy technology programs, though there are a handful of exempt items, including Department of Veterans Affairs spending.
Discretionary Spending Caps Under the Budget Control Act(budget authority in billions of current dollars)
2013 2014 2015 2016 2017 2018 2019 2020 2021
Defense Category 546 556 566 577 590 603 616 630 644Includes DOD and DOE Atomics.
Total Cap 1,047 1,066 1,086 1,107 1,131 1,156 1,182 1,208 1,234
AAAS Analysis: Federal R&D and Sequestration
AAAS | September 27, 2012 | www.aaas.org/spp/rd Page 3 of 20
The act assumes 18 percent of the mandated $1.2 trillion savings – or $216 billion – is saved via interest payment reductions, from reduced borrowing. This leaves $984 billion in remaining spending cuts below the current caps, which the Office of Management and Budget (OMB) is to allocate evenly between the two categories over nine years. A portion of the cuts in the nondefense category would apply to Medicare and other such mandatory programs. Thus, the cuts to discretionary spending – which again covers virtually all R&D – work out to $55 billion on the defense side, and $38 billion on the nondefense side.ii A handful of discretionary programs would be exempt; by far the largest of these are Veterans Affairs (VA) activities, including VA R&D.
There remains interest in some quarters, especially in the House, in protecting the defense side of the equation and shifting some or all cuts onto the nondefense side. Most notably, such a proposal passed the House as part of the FY 2013 Budget Resolution, developed under House Budget Committee Chairman Paul Ryan (R-WI),iii and efforts to pass similar legislation continue.iv While such a scenario appears highly unlikely to either pass the full Congress or avoid a Presidential veto at this time, some support for a version of such a plan continues. As such, we will include a scenario in which the full sequestration amount for defense programs is shifted onto nondefense, in what might be called a worst-case but rather unlikely outcome for the nondefense side.
ESTIMATING THE CUTS
Developing a baseline. This analysis will extend through 2017, the last year for which OMB provides price deflators, thereby allowing us to adjust for inflation. The process by which we can estimate a baseline, and then the potential cuts, is fairly straightforward. The first step is to determine how baseline R&D spending might increase or decrease from now until FY 2017. We do not have such estimates readily available, but we do have a yardstick of total spending we can use: the BCA’s discretionary spending caps, which allow for steady but very small increases over the decade. In real-dollar terms, the caps only barely allow spending to increase faster than inflation: Each year, both defense and nondefense spending would see an increase of only one or two tenths of a percent, after adjusting for inflation.
For argument’s sake, we assume that all individual budget accounts will grow at the pace allowed by the caps; essentially, we assuming both that the mix of individual discretionary accounts within these caps will not change, and that the ratio of R&D to non-R&D funding within each account also won’t change. The latter assumption is fairly reliable, as the ratio of R&D to non-R&D has surprisingly changed only slowly over time in most accounts and overall. In other words, according to recent history, as overall discretionary spending goes, so goes R&D.
The first assumption – that the mix of accounts will not change – is perhaps less sure, because over time clear and obvious trends of relative growth or decline do emerge at the agency level.v However, it is also important to remember that prior funding decisions in recent years have been made mostly in fiscal environments that lacked the type of discretionary cap established by the BCA. Introducing these caps, and thus restricting the total pool of available budgetary resources, could easily constrain future funding decisions such that variation in budgets from year-to-year is reduced. It is also worth noting that small variations of two or three percent in agency budgets consistent with historical trends would not have a large impact on our overall estimates, since there is little solid ground upon which to assume an agency might receive a relative increase in a world without sequestration, but a small increase in a world with sequestration. Assuming larger growth in one agency’s baseline R&D budget would simply mean larger cuts under a sequestration regime. Of course, any such future decisions are dependent upon who controls the White House, Congress, and appropriations bodies, and how their priorities may evolve. In light of such uncertainty, the BCA caps present as good a baseline for spending growth as any other.
AAAS Analysis: Federal R&D and Sequestration
AAAS | September 27, 2012 | www.aaas.org/spp/rd Page 4 of 20
Estimating R&D funding. Once we have adopted these growth rates, we can apply them to current R&D funding levels. Again, it is entirely possible – and indeed likely – that in some instances, R&D funding will grow faster or slower than total funding within some accounts; but recent history suggests that such changes will likely not be large.
We base our projections on AAAS estimates of current (FY 2012) R&D funding coupled with some modifications based on the FY 2013 continuing resolution recently passed by Congress. We avoid using the figures in the President’s FY 2013 request for a few obvious reasons. First and foremost, given the continuing resolution’s extension through March 2012, the Administration’s proposals do not apply at the moment, and may not apply at all depending on the outcome of fiscal cliff negotiations. Second, as any appropriator will tell you, the Administration’s proposed budget can change dramatically as Congress considers its disparate elements during the appropriations cycle. Neither the Administration’s FY 2013 request nor its proposed outyear funding levels have been fully through this Congressional vetting process, and thus only reflect Administration priorities. Conversely, the modified FY 2012 figures have been through the Congressional ringer, and thus more accurately account for both Administration and Congressional priorities.
Thus, we start with our FY 2012 R&D estimates,vi and adjust upward slightly by 0.61 percent to account for the overall increase provided in the continuing resolution. The continuing resolution also grants additional increases to accounts in DOE’s atomic weapons R&D portfolio, and we incorporate these in our baseline as well. For argument’s sake, we assume these levels extend for the full year, rather than six months as prescribed in the resolution.
It is also worth noting that we are leaving out a few R&D accounts for ease of calculation. The largest of these is the Department of Transportation. Due to the agency’s budgeting structure, R&D qualifies under a mix of discretionary and nondiscretionary spending, and separating out the potential impacts is problematic. We are also leaving out R&D at the Department of Education, the Smithsonian, the FBI, and assorted other accounts that together add up to roughly $1 billion, but individually are quite small. Our analysis covers more than 98 percent of all federal R&D.
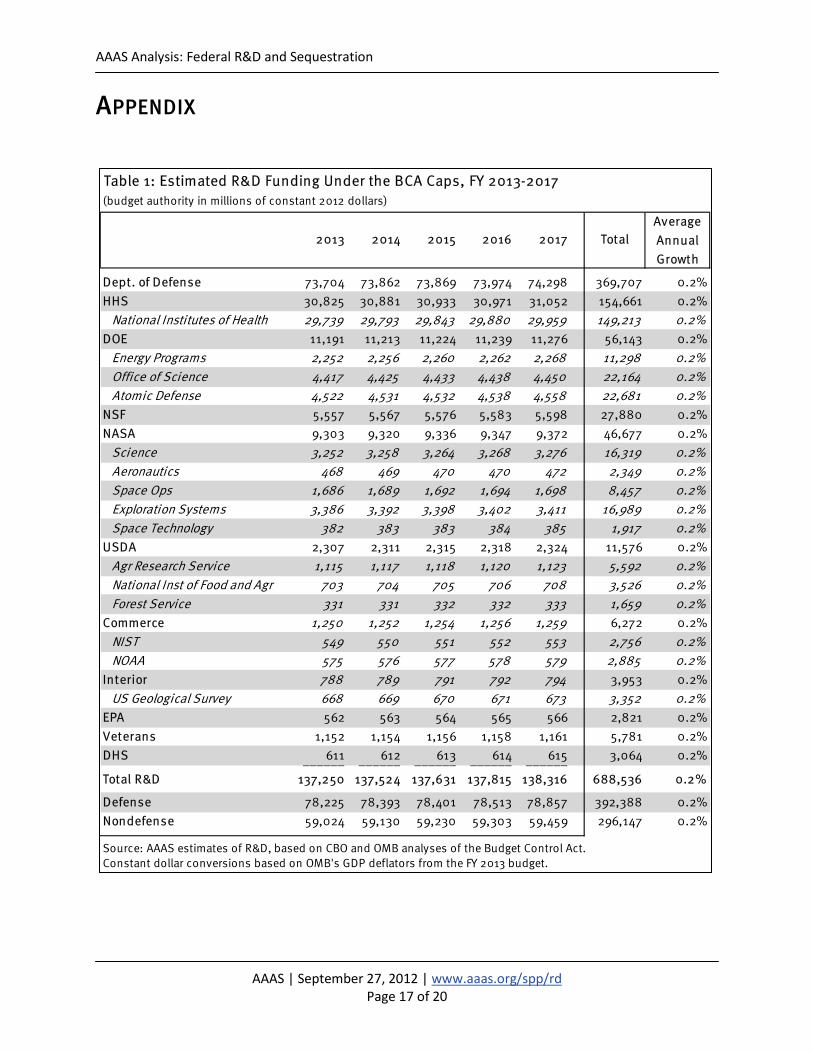
We take our current estimates with the adjustments described above, adjust for inflation in FY 2013, and then apply the annual growth rate for discretionary spending under the caps for each year. The results of this step are shown in Appendix Table 1. Essentially, the average growth in all accounts rounds off to 0.2 percent per year, similar to the overall growth rate allowable under the BCA caps.
Estimating funding levels under sequestration. Once we have these amounts in hand, we can estimate the new funding levels under sequestration, and determine the amounts cut. Again, there are two scenarios: one with defense and nondefense cuts allocated equally, and one with all cuts shifted onto nondefense discretionary (NDD) spending.
Under the equal allocation scenario, we know per the Congressional Budget Office (CBO) that the relative size of the cuts will decline at a fairly steady rate every year, since the BCA caps will increase while the amounts to cut will not.vii We also know, per OMB’s September estimates, that the first year of cuts will include 8.2 percent for nondefense discretionary spending and 9.4 percent for defense discretionary spending. These funding levels include exemptions for veterans, military personnel, and other select items. Marrying OMB’s first-year cuts to CBO’s expected rate of decline yields average cuts of 7.6 percent and 9.1 percent for defense and nondefense, respectively, with the largest proportional cuts coming in the first year.
For the nondefense discretionary-only (NDD) scenario, we start by reallocating the $55 billion annual defense cuts onto nondefense. According to OMB’s September report, 87.2 percent of the sequestrable nondefense base is discretionary spending, with the rest falling under mandatory spending. We multiply
AAAS Analysis: Federal R&D and Sequestration
AAAS | September 27, 2012 | www.aaas.org/spp/rd Page 5 of 20
this ratio by the $55 billion reallocated sequestration amount each year, under the assumption that it will still roughly apply, and add the new totals to the annual nondefense reductions previously derived. We then divide these new annual figures by the nondefense discretionary base identified by OMB, adjusted for expected growth under the BCA caps, to determine the percentage cuts every year. Under this NDD-only scenario, the cuts for most nondefense agencies would average 17.5 percent per year, with the highest (18.5 percent) in the first year.
RESULTS
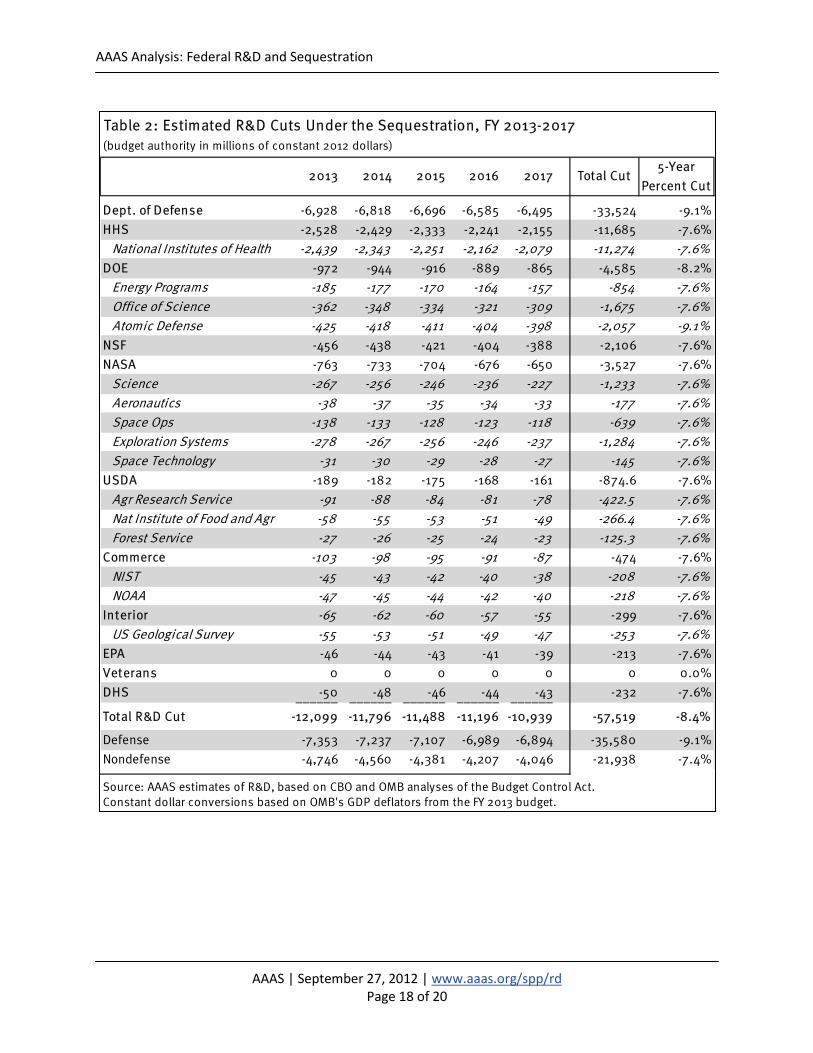
The full results are shown in Tables 2 and 3 in the Appendix (page 15), and summarized in the graphs below. All figures are presented in inflation-adjusted 2012 dollars.
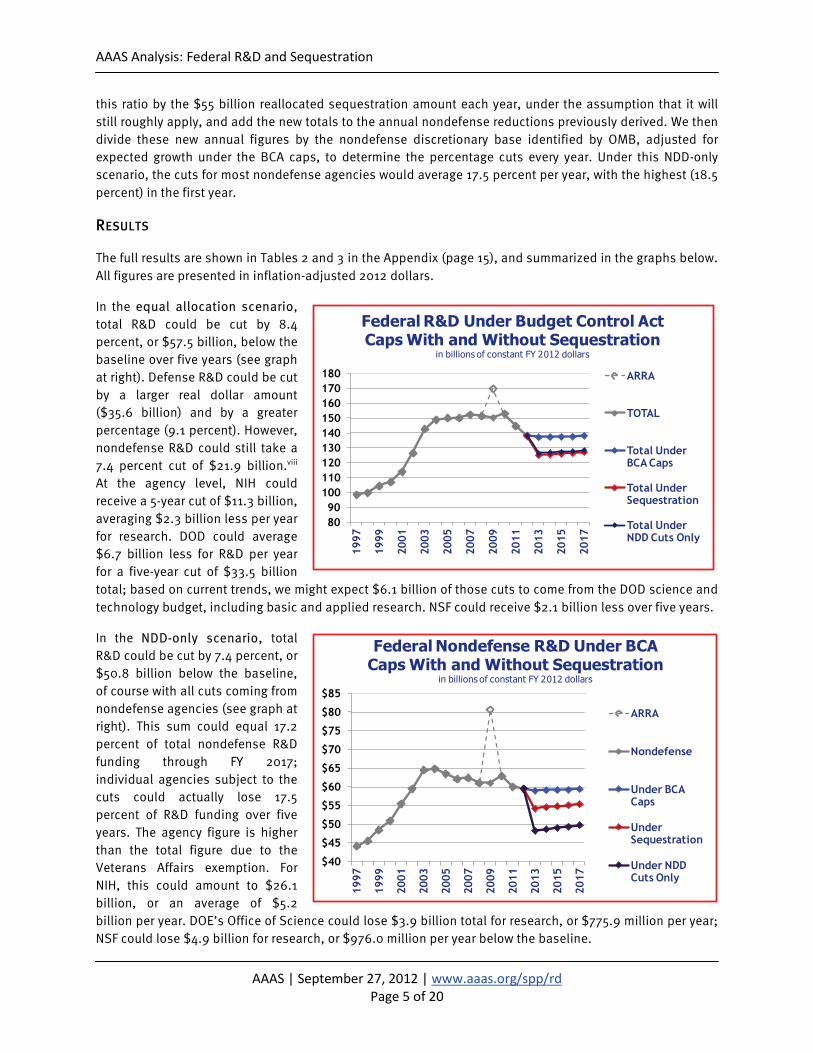
In the equal allocation scenario, total R&D could be cut by 8.4 percent, or $57.5 billion, below the baseline over five years (see graph at right). Defense R&D could be cut by a larger real dollar amount ($35.6 billion) and by a greater percentage (9.1 percent). However, nondefense R&D could still take a 7.4 percent cut of $21.9 billion.viii At the agency level, NIH could receive a 5-year cut of $11.3 billion, averaging $2.3 billion less per year for research. DOD could average $6.7 billion less for R&D per year for a five-year cut of $33.5 billion total; based on current trends, we might expect $6.1 billion of those cuts to come from the DOD science and technology budget, including basic and applied research. NSF could receive $2.1 billion less over five years.
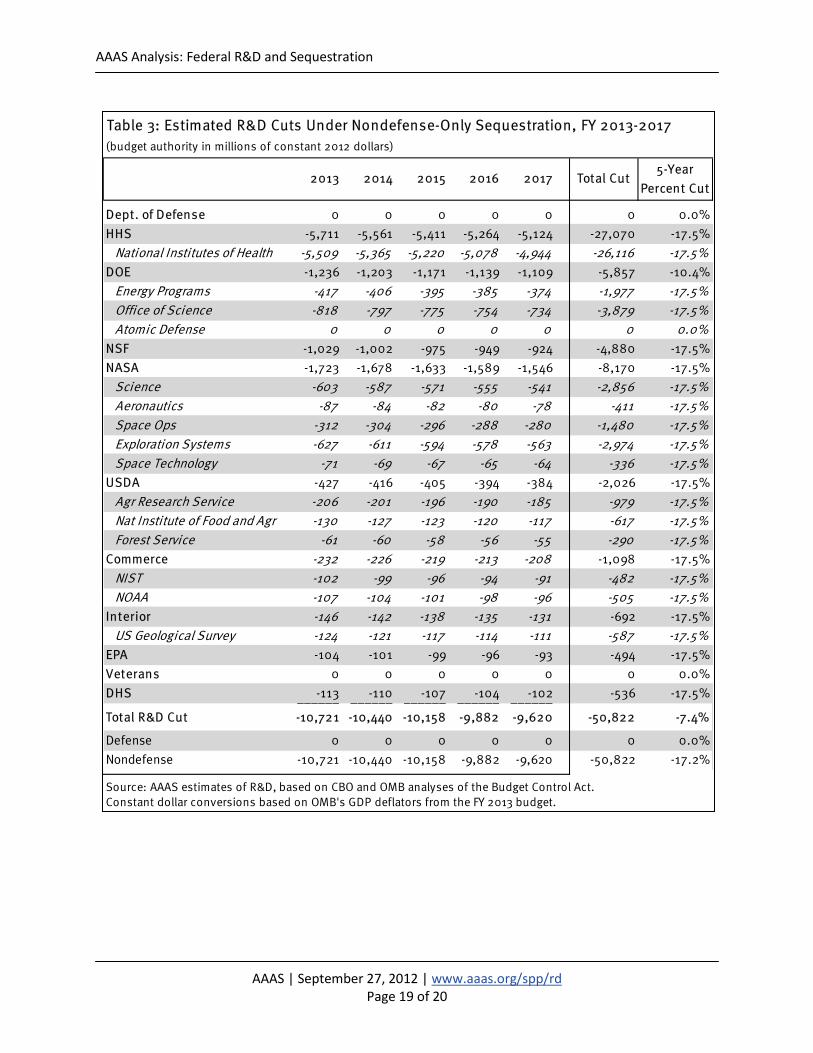
In the NDD-only scenario, total R&D could be cut by 7.4 percent, or $50.8 billion below the baseline, of course with all cuts coming from nondefense agencies (see graph at right). This sum could equal 17.2 percent of total nondefense R&D funding through FY 2017; individual agencies subject to the cuts could actually lose 17.5 percent of R&D funding over five years. The agency figure is higher than the total figure due to the Veterans Affairs exemption. For NIH, this could amount to $26.1 billion, or an average of $5.2 billion per year. DOE’s Office of Science could lose $3.9 billion total for research, or $775.9 million per year; NSF could lose $4.9 billion for research, or $976.0 million per year below the baseline.
8090
100110120130140150160170180
1997
1999
2001
2003
2005
2007
2009
2011
2013
2015
2017
Federal R&D Under Budget Control Act Caps With and Without Sequestration
in billions of constant FY 2012 dollars
ARRA
TOTAL
Total Under BCA Caps
Total Under Sequestration
Total Under NDD Cuts Only
$40
$45
$50
$55
$60
$65
$70
$75
$80
$85
1997
1999
2001
2003
2005
2007
2009
2011
2013
2015
2017
Federal Nondefense R&D Under BCA Caps With and Without Sequestration
in billions of constant FY 2012 dollars
ARRA
Nondefense
Under BCA Caps
Under Sequestration
Under NDD Cuts Only
AAAS Analysis: Federal R&D and Sequestration
AAAS | September 27, 2012 | www.aaas.org/spp/rd Page 6 of 20
For additional detail, we will briefly review the six largest agencies next. First, an important note: while it is tempting to estimate additional impacts on university grants awarded, researchers employed, patents generated, or other such effects, there is significant uncertainty in such estimation, since the agencies will likely have a fair level of discretion in how they may adapt to specific funding reductions over time. In some instances, the number of grants may be reduced proportionally. In others, agencies may choose to modify grant terms to reduce the value of individual grants but keep the number of awards higher than it would be otherwise, as NIH has done recently.ix Agencies may also reduce or terminate select programs, capital projects, or overhead, and each of these choices may have diverse effects on researchers or contractors depending on the nature of the project. As such, this level of prognostication is best left to others – especially the agencies themselves or OMB. In many ways, we won’t really know what the agencies will do until they do it, or at least make known their plans. What we do know, in any event, is that agencies will undoubtedly have less to spend on R&D – in some instances, much less.
Thus, each section below will review our estimates of cuts, and then draw comparisons with funding levels for individual offices or programs, to attempt to place these abstract numbers in context for the reader.
DEPARTMENT OF DEFENSE
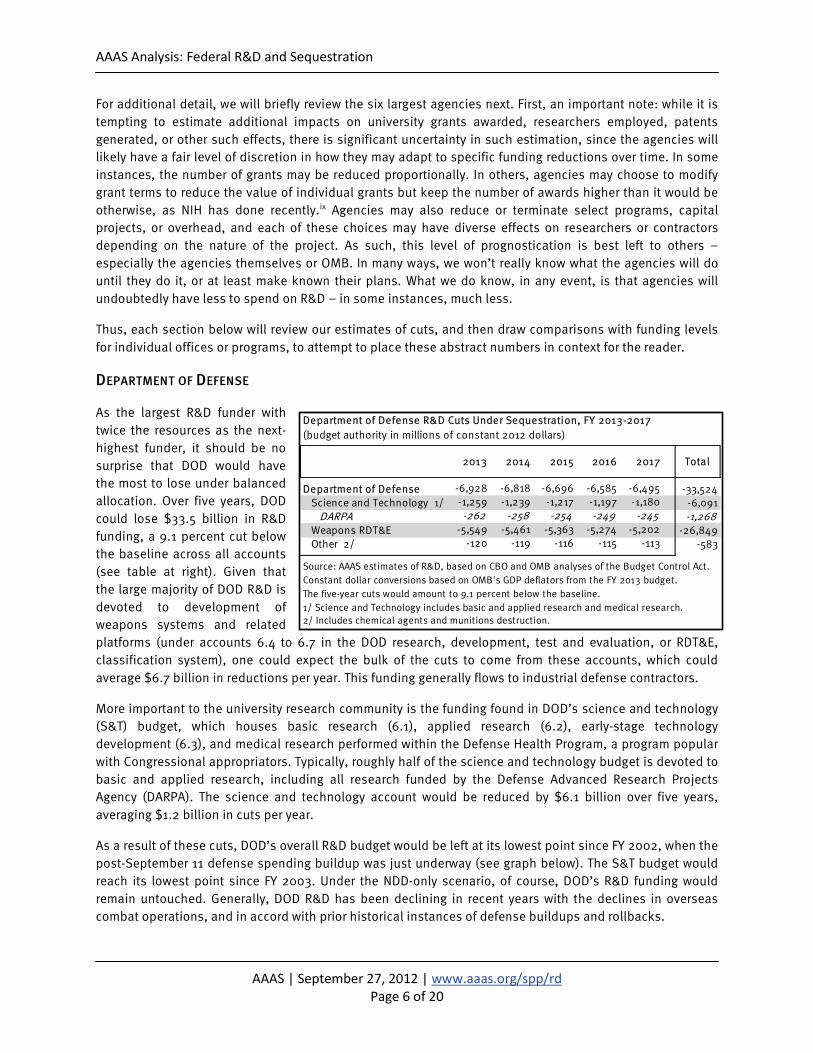
As the largest R&D funder with twice the resources as the next-highest funder, it should be no surprise that DOD would have the most to lose under balanced allocation. Over five years, DOD could lose $33.5 billion in R&D funding, a 9.1 percent cut below the baseline across all accounts (see table at right). Given that the large majority of DOD R&D is devoted to development of weapons systems and related platforms (under accounts 6.4 to 6.7 in the DOD research, development, test and evaluation, or RDT&E, classification system), one could expect the bulk of the cuts to come from these accounts, which could average $6.7 billion in reductions per year. This funding generally flows to industrial defense contractors.
More important to the university research community is the funding found in DOD’s science and technology (S&T) budget, which houses basic research (6.1), applied research (6.2), early-stage technology development (6.3), and medical research performed within the Defense Health Program, a program popular with Congressional appropriators. Typically, roughly half of the science and technology budget is devoted to basic and applied research, including all research funded by the Defense Advanced Research Projects Agency (DARPA). The science and technology account would be reduced by $6.1 billion over five years, averaging $1.2 billion in cuts per year.
As a result of these cuts, DOD’s overall R&D budget would be left at its lowest point since FY 2002, when the post-September 11 defense spending buildup was just underway (see graph below). The S&T budget would reach its lowest point since FY 2003. Under the NDD-only scenario, of course, DOD’s R&D funding would remain untouched. Generally, DOD R&D has been declining in recent years with the declines in overseas combat operations, and in accord with prior historical instances of defense buildups and rollbacks.
Department of Defense R&D Cuts Under Sequestration, FY 2013-2017(budget authority in millions of constant 2012 dollars)
2013 2014 2015 2016 2017 Total
Department of Defense -6,928 -6,818 -6,696 -6,585 -6,495 -33,524Science and Technology 1/ -1,259 -1,239 -1,217 -1,197 -1,180 -6,091
Source: AAAS estimates of R&D, based on CBO and OMB analyses of the Budget Control Act.Constant dollar conversions based on OMB's GDP deflators from the FY 2013 budget.The five-year cuts would amount to 9.1 percent below the baseline.1/ Science and Technology includes basic and applied research and medical research.2/ Includes chemical agents and munitions destruction.
AAAS Analysis: Federal R&D and Sequestration
AAAS | September 27, 2012 | www.aaas.org/spp/rd Page 7 of 20
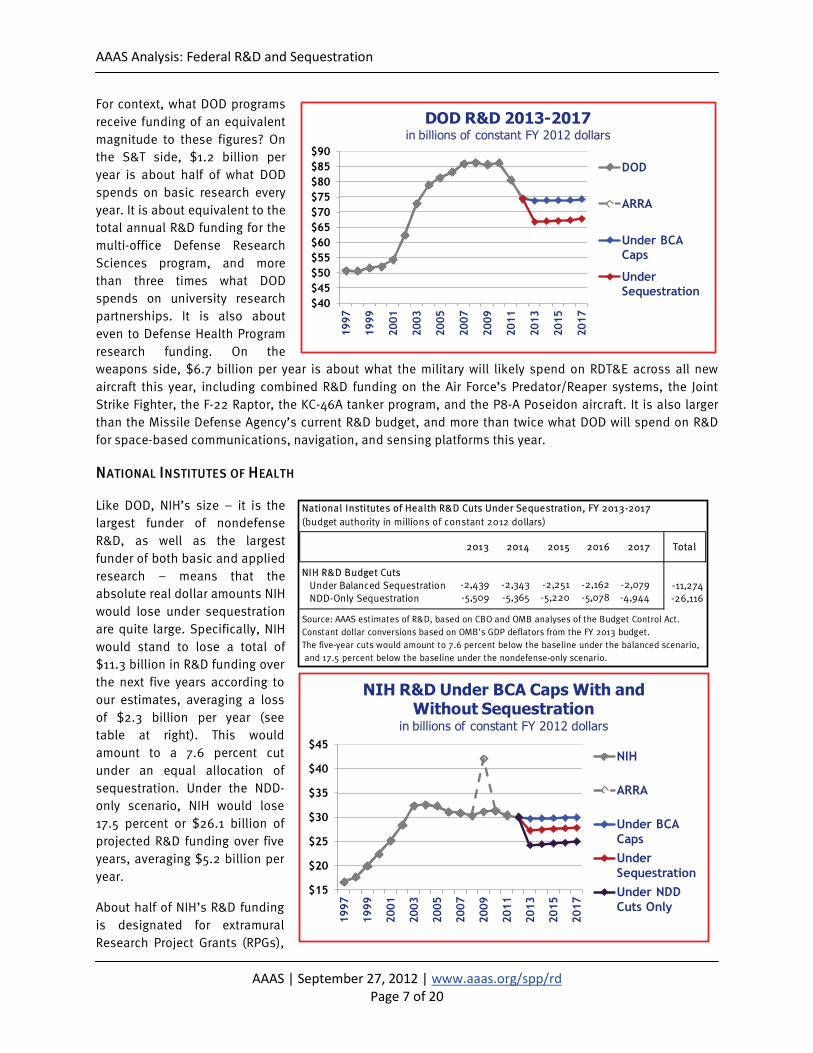
For context, what DOD programs receive funding of an equivalent magnitude to these figures? On the S&T side, $1.2 billion per year is about half of what DOD spends on basic research every year. It is about equivalent to the total annual R&D funding for the multi-office Defense Research Sciences program, and more than three times what DOD spends on university research partnerships. It is also about even to Defense Health Program research funding. On the weapons side, $6.7 billion per year is about what the military will likely spend on RDT&E across all new aircraft this year, including combined R&D funding on the Air Force’s Predator/Reaper systems, the Joint Strike Fighter, the F-22 Raptor, the KC-46A tanker program, and the P8-A Poseidon aircraft. It is also larger than the Missile Defense Agency’s current R&D budget, and more than twice what DOD will spend on R&D for space-based communications, navigation, and sensing platforms this year.
NATIONAL INSTITUTES OF HEALTH
Like DOD, NIH’s size – it is the largest funder of nondefense R&D, as well as the largest funder of both basic and applied research – means that the absolute real dollar amounts NIH would lose under sequestration are quite large. Specifically, NIH would stand to lose a total of $11.3 billion in R&D funding over the next five years according to our estimates, averaging a loss of $2.3 billion per year (see table at right). This would amount to a 7.6 percent cut under an equal allocation of sequestration. Under the NDD-only scenario, NIH would lose 17.5 percent or $26.1 billion of projected R&D funding over five years, averaging $5.2 billion per year.
About half of NIH’s R&D funding is designated for extramural Research Project Grants (RPGs),
$40$45$50$55$60$65$70$75$80$85$90
1997
1999
2001
2003
2005
2007
2009
2011
2013
2015
2017
DOD R&D 2013-2017in billions of constant FY 2012 dollars
DOD
ARRA
Under BCA Caps
Under Sequestration
National Institutes of Health R&D Cuts Under Sequestration, FY 2013-2017(budget authority in millions of constant 2012 dollars)
Source: AAAS estimates of R&D, based on CBO and OMB analyses of the Budget Control Act.Constant dollar conversions based on OMB's GDP deflators from the FY 2013 budget.The five-year cuts would amount to 7.6 percent below the baseline under the balanced scenario, and 17.5 percent below the baseline under the nondefense-only scenario.
$15
$20
$25
$30
$35
$40
$45
1997
1999
2001
2003
2005
2007
2009
2011
2013
2015
2017
NIH R&D Under BCA Caps With and Without Sequestration
in billions of constant FY 2012 dollars
NIH
ARRA
Under BCA CapsUnder SequestrationUnder NDD Cuts Only
AAAS Analysis: Federal R&D and Sequestration
AAAS | September 27, 2012 | www.aaas.org/spp/rd Page 8 of 20
issued by individual institutes within NIH. Most NIH R&D funding ultimately goes to universities, and is split roughly evenly between basic and applied research. NIH experienced a Congressionally-driven and White House-supported budget doubling between 1998 and 2003, though since then agency funding has flattened out and the agency has experienced an inflation-adjusted R&D decline of 8.7 percent. Under the equal allocation scenario, NIH funding would be returned to roughly FY 2002 levels. The NDD-only scenario would return NIH R&D funding to below FY 2001 levels, erasing much of the prior doubling (see graph above).
For context, what NIH programs receive funding of an equivalent magnitude to these figures? OMB has already estimated that the first year of cuts could result in 700 fewer research grants,x while the Department of Health and Human Services puts the figure over 2,000.xi Several other organizations have also performed their own estimates of the potential impacts of NIH cuts.xii The $2.3 billion figure for average cuts under the balanced scenario is more than the agency spends for research on any one of several fields, including diabetes, neurological disorders, child health, or mental health; twice what it spends on either aging or drug abuse-related research; and more than three times what it devotes to vision research, arthritis research, or studies of the human genome. Under the NDD scenario, the $5.3 billion figure is larger than the annual research budget for the National Cancer Institute, NIH’s largest individual research institute.
DEPARTMENT OF ENERGY
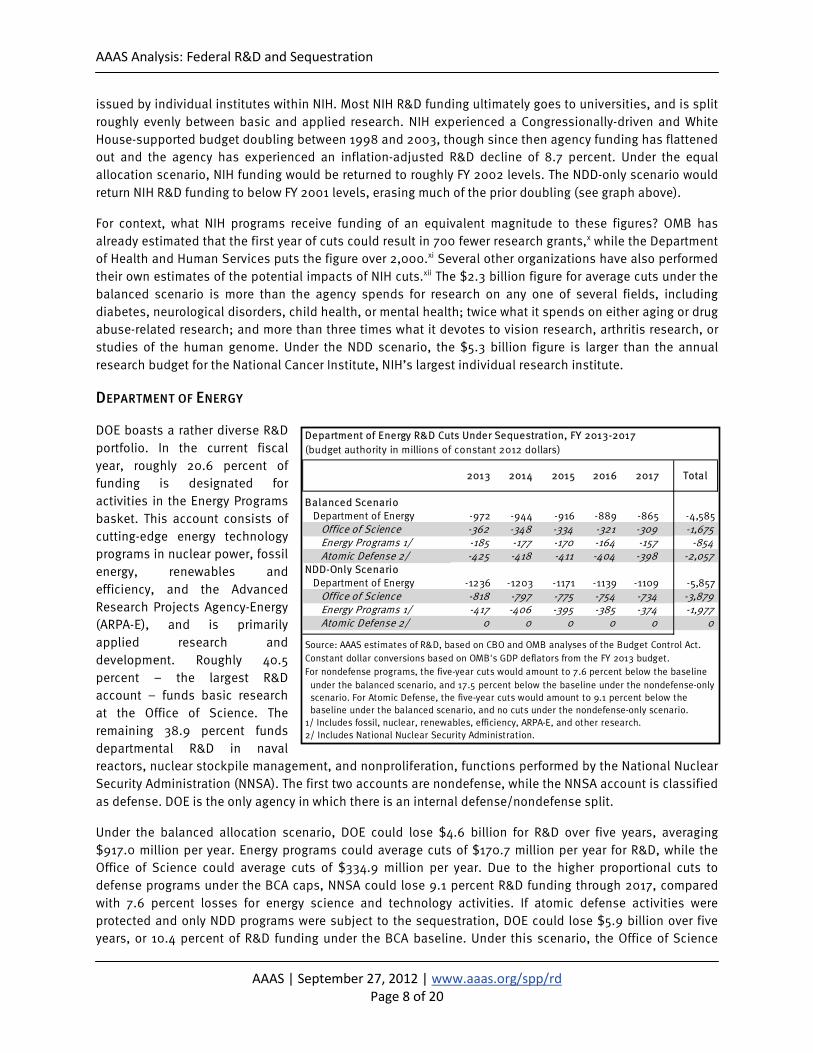
DOE boasts a rather diverse R&D portfolio. In the current fiscal year, roughly 20.6 percent of funding is designated for activities in the Energy Programs basket. This account consists of cutting-edge energy technology programs in nuclear power, fossil energy, renewables and efficiency, and the Advanced Research Projects Agency-Energy (ARPA-E), and is primarily applied research and development. Roughly 40.5 percent – the largest R&D account – funds basic research at the Office of Science. The remaining 38.9 percent funds departmental R&D in naval reactors, nuclear stockpile management, and nonproliferation, functions performed by the National Nuclear Security Administration (NNSA). The first two accounts are nondefense, while the NNSA account is classified as defense. DOE is the only agency in which there is an internal defense/nondefense split.
Under the balanced allocation scenario, DOE could lose $4.6 billion for R&D over five years, averaging $917.0 million per year. Energy programs could average cuts of $170.7 million per year for R&D, while the Office of Science could average cuts of $334.9 million per year. Due to the higher proportional cuts to defense programs under the BCA caps, NNSA could lose 9.1 percent R&D funding through 2017, compared with 7.6 percent losses for energy science and technology activities. If atomic defense activities were protected and only NDD programs were subject to the sequestration, DOE could lose $5.9 billion over five years, or 10.4 percent of R&D funding under the BCA baseline. Under this scenario, the Office of Science
Department of Energy R&D Cuts Under Sequestration, FY 2013-2017(budget authority in millions of constant 2012 dollars)
2013 2014 2015 2016 2017 Total
Balanced ScenarioDepartment of Energy -972 -944 -916 -889 -865 -4,585
Source: AAAS estimates of R&D, based on CBO and OMB analyses of the Budget Control Act.Constant dollar conversions based on OMB's GDP deflators from the FY 2013 budget.For nondefense programs, the five-year cuts would amount to 7.6 percent below the baseline under the balanced scenario, and 17.5 percent below the baseline under the nondefense-only scenario. For Atomic Defense, the five-year cuts would amount to 9.1 percent below the baseline under the balanced scenario, and no cuts under the nondefense-only scenario.1/ Includes fossil, nuclear, renewables, efficiency, ARPA-E, and other research.2/ Includes National Nuclear Security Administration.
AAAS Analysis: Federal R&D and Sequestration
AAAS | September 27, 2012 | www.aaas.org/spp/rd Page 9 of 20
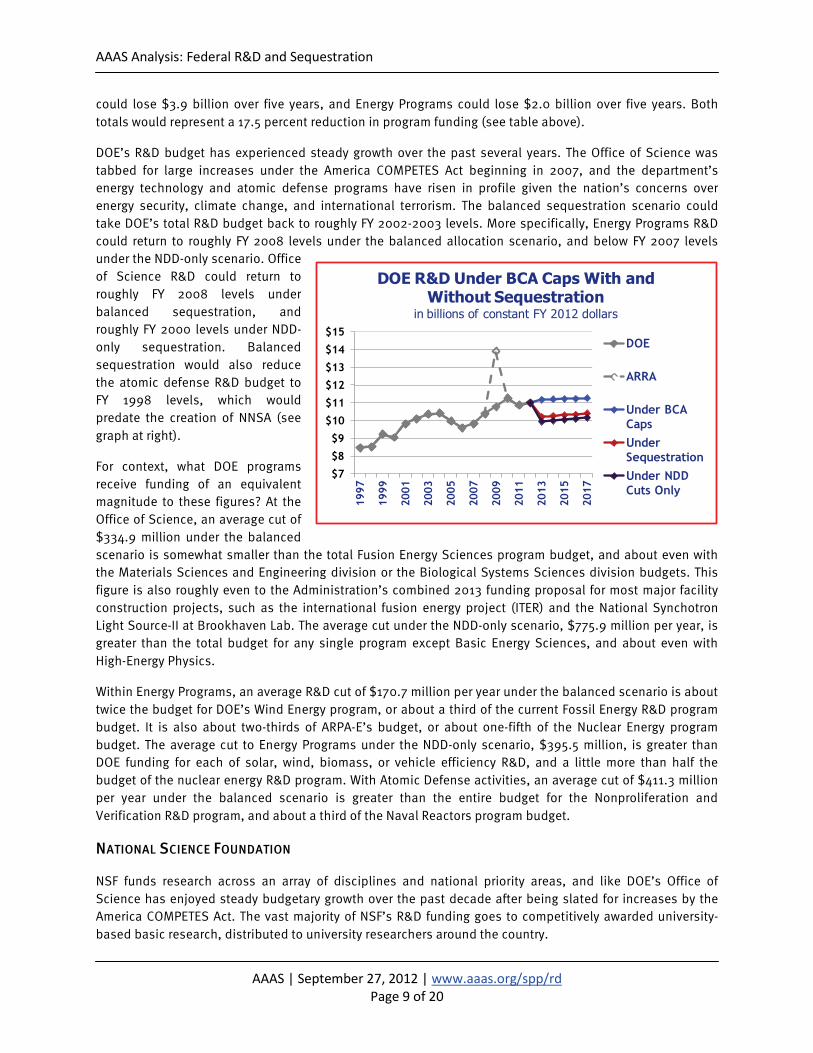
could lose $3.9 billion over five years, and Energy Programs could lose $2.0 billion over five years. Both totals would represent a 17.5 percent reduction in program funding (see table above).
DOE’s R&D budget has experienced steady growth over the past several years. The Office of Science was tabbed for large increases under the America COMPETES Act beginning in 2007, and the department’s energy technology and atomic defense programs have risen in profile given the nation’s concerns over energy security, climate change, and international terrorism. The balanced sequestration scenario could take DOE’s total R&D budget back to roughly FY 2002-2003 levels. More specifically, Energy Programs R&D could return to roughly FY 2008 levels under the balanced allocation scenario, and below FY 2007 levels under the NDD-only scenario. Office of Science R&D could return to roughly FY 2008 levels under balanced sequestration, and roughly FY 2000 levels under NDD-only sequestration. Balanced sequestration would also reduce the atomic defense R&D budget to FY 1998 levels, which would predate the creation of NNSA (see graph at right).
For context, what DOE programs receive funding of an equivalent magnitude to these figures? At the Office of Science, an average cut of $334.9 million under the balanced scenario is somewhat smaller than the total Fusion Energy Sciences program budget, and about even with the Materials Sciences and Engineering division or the Biological Systems Sciences division budgets. This figure is also roughly even to the Administration’s combined 2013 funding proposal for most major facility construction projects, such as the international fusion energy project (ITER) and the National Synchotron Light Source-II at Brookhaven Lab. The average cut under the NDD-only scenario, $775.9 million per year, is greater than the total budget for any single program except Basic Energy Sciences, and about even with High-Energy Physics.
Within Energy Programs, an average R&D cut of $170.7 million per year under the balanced scenario is about twice the budget for DOE’s Wind Energy program, or about a third of the current Fossil Energy R&D program budget. It is also about two-thirds of ARPA-E’s budget, or about one-fifth of the Nuclear Energy program budget. The average cut to Energy Programs under the NDD-only scenario, $395.5 million, is greater than DOE funding for each of solar, wind, biomass, or vehicle efficiency R&D, and a little more than half the budget of the nuclear energy R&D program. With Atomic Defense activities, an average cut of $411.3 million per year under the balanced scenario is greater than the entire budget for the Nonproliferation and Verification R&D program, and about a third of the Naval Reactors program budget.
NATIONAL SCIENCE FOUNDATION
NSF funds research across an array of disciplines and national priority areas, and like DOE’s Office of Science has enjoyed steady budgetary growth over the past decade after being slated for increases by the America COMPETES Act. The vast majority of NSF’s R&D funding goes to competitively awarded university-based basic research, distributed to university researchers around the country.
$7
$8
$9
$10
$11
$12
$13
$14
$15
1997
1999
2001
2003
2005
2007
2009
2011
2013
2015
2017
DOE R&D Under BCA Caps With and Without Sequestration
in billions of constant FY 2012 dollars
DOE
ARRA
Under BCA CapsUnder SequestrationUnder NDD Cuts Only
AAAS Analysis: Federal R&D and Sequestration
AAAS | September 27, 2012 | www.aaas.org/spp/rd Page 10 of 20
$3
$4
$5
$6
$7
$8
$919
97
1999
2001
2003
2005
2007
2009
2011
2013
2015
2017
NSF R&D Under BCA Caps With and Without Sequestration
in billions of constant FY 2012 dollars
NSF
ARRA
Under BCA Caps
Under Sequestration
Under NDD Cuts Only
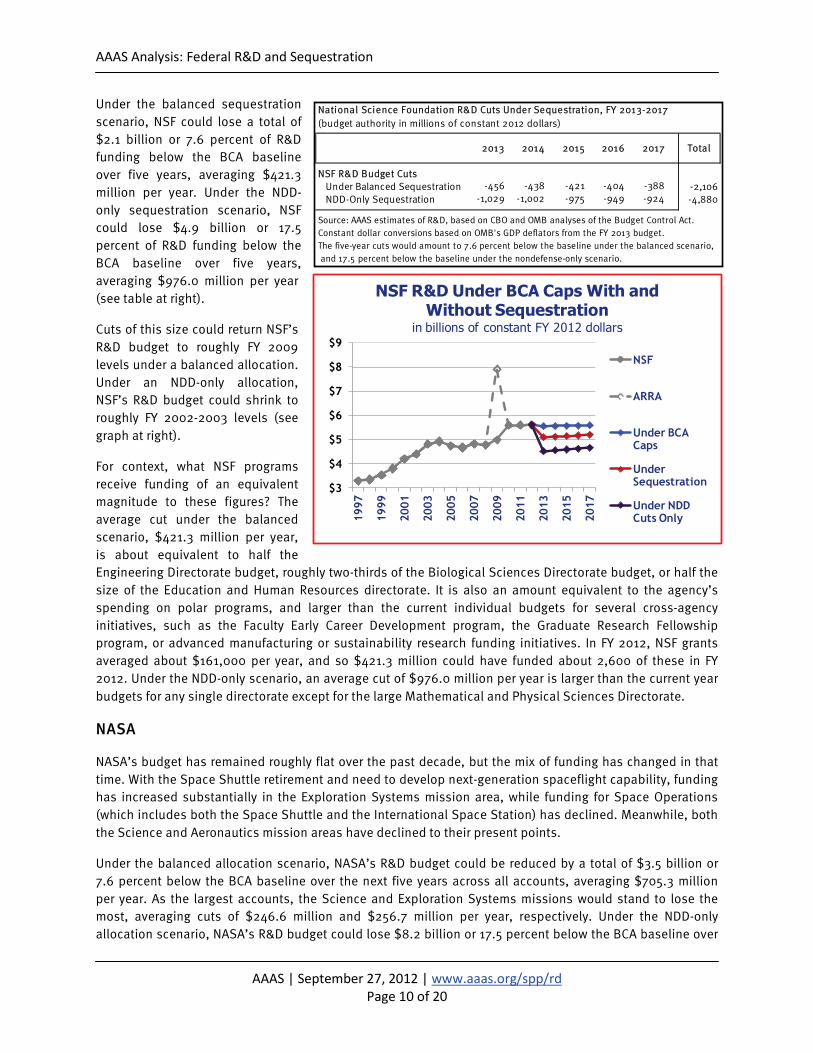
Under the balanced sequestration scenario, NSF could lose a total of $2.1 billion or 7.6 percent of R&D funding below the BCA baseline over five years, averaging $421.3 million per year. Under the NDD-only sequestration scenario, NSF could lose $4.9 billion or 17.5 percent of R&D funding below the BCA baseline over five years, averaging $976.0 million per year (see table at right).
Cuts of this size could return NSF’s R&D budget to roughly FY 2009 levels under a balanced allocation. Under an NDD-only allocation, NSF’s R&D budget could shrink to roughly FY 2002-2003 levels (see graph at right).
For context, what NSF programs receive funding of an equivalent magnitude to these figures? The average cut under the balanced scenario, $421.3 million per year, is about equivalent to half the Engineering Directorate budget, roughly two-thirds of the Biological Sciences Directorate budget, or half the size of the Education and Human Resources directorate. It is also an amount equivalent to the agency’s spending on polar programs, and larger than the current individual budgets for several cross-agency initiatives, such as the Faculty Early Career Development program, the Graduate Research Fellowship program, or advanced manufacturing or sustainability research funding initiatives. In FY 2012, NSF grants averaged about $161,000 per year, and so $421.3 million could have funded about 2,600 of these in FY 2012. Under the NDD-only scenario, an average cut of $976.0 million per year is larger than the current year budgets for any single directorate except for the large Mathematical and Physical Sciences Directorate.
NASA
NASA’s budget has remained roughly flat over the past decade, but the mix of funding has changed in that time. With the Space Shuttle retirement and need to develop next-generation spaceflight capability, funding has increased substantially in the Exploration Systems mission area, while funding for Space Operations (which includes both the Space Shuttle and the International Space Station) has declined. Meanwhile, both the Science and Aeronautics mission areas have declined to their present points.
Under the balanced allocation scenario, NASA’s R&D budget could be reduced by a total of $3.5 billion or 7.6 percent below the BCA baseline over the next five years across all accounts, averaging $705.3 million per year. As the largest accounts, the Science and Exploration Systems missions would stand to lose the most, averaging cuts of $246.6 million and $256.7 million per year, respectively. Under the NDD-only allocation scenario, NASA’s R&D budget could lose $8.2 billion or 17.5 percent below the BCA baseline over
National Science Foundation R&D Cuts Under Sequestration, FY 2013-2017(budget authority in millions of constant 2012 dollars)
Source: AAAS estimates of R&D, based on CBO and OMB analyses of the Budget Control Act.Constant dollar conversions based on OMB's GDP deflators from the FY 2013 budget.The five-year cuts would amount to 7.6 percent below the baseline under the balanced scenario, and 17.5 percent below the baseline under the nondefense-only scenario.
AAAS Analysis: Federal R&D and Sequestration
AAAS | September 27, 2012 | www.aaas.org/spp/rd Page 11 of 20
$10
$12
$14
$16
$18
$20
$22
1997
1999
2001
2003
2005
2007
2009
2011
2013
2015
2017
NASA Budget Under BCA Caps With and Without Sequestration
in billions of constant FY 2012 dollars
NASA
ARRA
Under BCA CapsUnder SequestrationUnder NDD Cuts Only
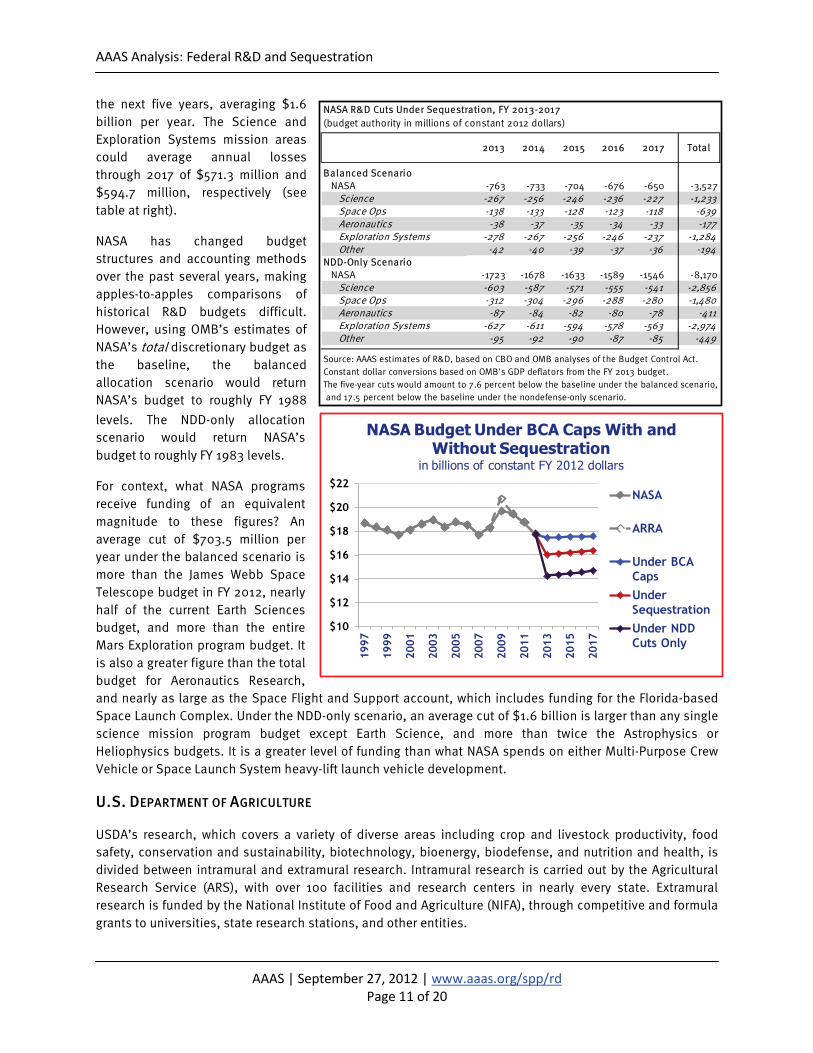
the next five years, averaging $1.6 billion per year. The Science and Exploration Systems mission areas could average annual losses through 2017 of $571.3 million and $594.7 million, respectively (see table at right).
NASA has changed budget structures and accounting methods over the past several years, making apples-to-apples comparisons of historical R&D budgets difficult. However, using OMB’s estimates of NASA’s total discretionary budget as the baseline, the balanced allocation scenario would return NASA’s budget to roughly FY 1988 levels. The NDD-only allocation scenario would return NASA’s budget to roughly FY 1983 levels.
For context, what NASA programs receive funding of an equivalent magnitude to these figures? An average cut of $703.5 million per year under the balanced scenario is more than the James Webb Space Telescope budget in FY 2012, nearly half of the current Earth Sciences budget, and more than the entire Mars Exploration program budget. It is also a greater figure than the total budget for Aeronautics Research, and nearly as large as the Space Flight and Support account, which includes funding for the Florida-based Space Launch Complex. Under the NDD-only scenario, an average cut of $1.6 billion is larger than any single science mission program budget except Earth Science, and more than twice the Astrophysics or Heliophysics budgets. It is a greater level of funding than what NASA spends on either Multi-Purpose Crew Vehicle or Space Launch System heavy-lift launch vehicle development.
U.S. DEPARTMENT OF AGRICULTURE
USDA’s research, which covers a variety of diverse areas including crop and livestock productivity, food safety, conservation and sustainability, biotechnology, bioenergy, biodefense, and nutrition and health, is divided between intramural and extramural research. Intramural research is carried out by the Agricultural Research Service (ARS), with over 100 facilities and research centers in nearly every state. Extramural research is funded by the National Institute of Food and Agriculture (NIFA), through competitive and formula grants to universities, state research stations, and other entities.
NASA R&D Cuts Under Sequestration, FY 2013-2017(budget authority in millions of constant 2012 dollars)
Source: AAAS estimates of R&D, based on CBO and OMB analyses of the Budget Control Act.Constant dollar conversions based on OMB's GDP deflators from the FY 2013 budget.The five-year cuts would amount to 7.6 percent below the baseline under the balanced scenario, and 17.5 percent below the baseline under the nondefense-only scenario.
AAAS Analysis: Federal R&D and Sequestration
AAAS | September 27, 2012 | www.aaas.org/spp/rd Page 12 of 20
$1.5
$1.7
$1.9
$2.1
$2.3
$2.5
$2.7
$2.9
$3.1
1997
1999
2001
2003
2005
2007
2009
2011
2013
2015
2017
USDA R&D Under BCA Caps With and Without Sequestration
in billions of constant FY 2012 dollars
USDA
ARRA
Under BCA CapsUnder SequestrationUnder NDD Cuts Only
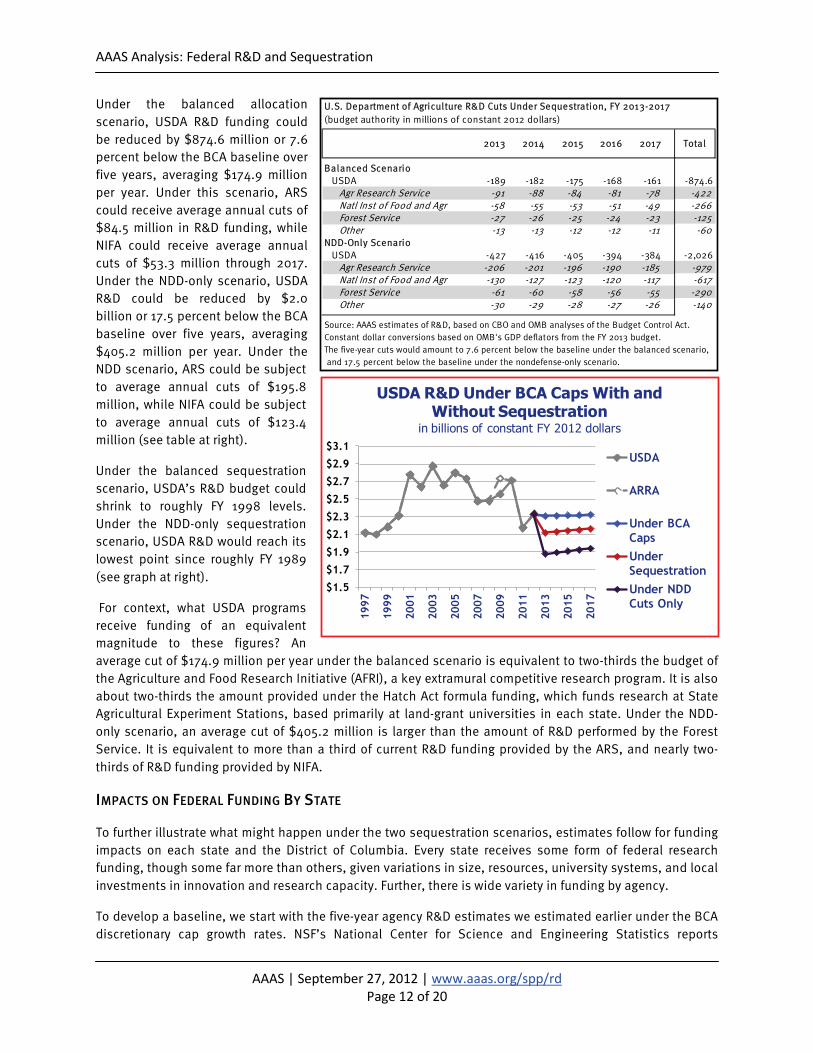
Under the balanced allocation scenario, USDA R&D funding could be reduced by $874.6 million or 7.6 percent below the BCA baseline over five years, averaging $174.9 million per year. Under this scenario, ARS could receive average annual cuts of $84.5 million in R&D funding, while NIFA could receive average annual cuts of $53.3 million through 2017. Under the NDD-only scenario, USDA R&D could be reduced by $2.0 billion or 17.5 percent below the BCA baseline over five years, averaging $405.2 million per year. Under the NDD scenario, ARS could be subject to average annual cuts of $195.8 million, while NIFA could be subject to average annual cuts of $123.4 million (see table at right).
Under the balanced sequestration scenario, USDA’s R&D budget could shrink to roughly FY 1998 levels. Under the NDD-only sequestration scenario, USDA R&D would reach its lowest point since roughly FY 1989 (see graph at right).
For context, what USDA programs receive funding of an equivalent magnitude to these figures? An average cut of $174.9 million per year under the balanced scenario is equivalent to two-thirds the budget of the Agriculture and Food Research Initiative (AFRI), a key extramural competitive research program. It is also about two-thirds the amount provided under the Hatch Act formula funding, which funds research at State Agricultural Experiment Stations, based primarily at land-grant universities in each state. Under the NDD-only scenario, an average cut of $405.2 million is larger than the amount of R&D performed by the Forest Service. It is equivalent to more than a third of current R&D funding provided by the ARS, and nearly two-thirds of R&D funding provided by NIFA.
IMPACTS ON FEDERAL FUNDING BY STATE
To further illustrate what might happen under the two sequestration scenarios, estimates follow for funding impacts on each state and the District of Columbia. Every state receives some form of federal research funding, though some far more than others, given variations in size, resources, university systems, and local investments in innovation and research capacity. Further, there is wide variety in funding by agency.
To develop a baseline, we start with the five-year agency R&D estimates we estimated earlier under the BCA discretionary cap growth rates. NSF’s National Center for Science and Engineering Statistics reports
U.S. Department of Agriculture R&D Cuts Under Sequestration, FY 2013-2017(budget authority in millions of constant 2012 dollars)
Agr Research Service -206 -201 -196 -190 -185 -979Natl Inst of Food and Agr -130 -127 -123 -120 -117 -617Forest Service -61 -60 -58 -56 -55 -290Other -30 -29 -28 -27 -26 -140
Source: AAAS estimates of R&D, based on CBO and OMB analyses of the Budget Control Act.Constant dollar conversions based on OMB's GDP deflators from the FY 2013 budget.The five-year cuts would amount to 7.6 percent below the baseline under the balanced scenario, and 17.5 percent below the baseline under the nondefense-only scenario.
AAAS Analysis: Federal R&D and Sequestration
AAAS | September 27, 2012 | www.aaas.org/spp/rd Page 13 of 20
historical agency funding data broken down by state. We can use this data from FY 2003 to FY 2008 (leaving out FY 2009, the most recent year for which data are available, to avoid distortion from Recovery Act funding) to develop averages, and apply these averages to agency estimates through FY 2017. This provides a working baseline. We can then apply these averages to the lower spending levels under a balanced allocation sequestration to estimate what might happen.
The reader should note that we are refraining from attempting state-level estimates under the NDD-only scenario, due in part to the complex nature of DOE funding. More than a third of DOE’s R&D funding falls under the defense category, and thus would not be touched under the NDD-only scenario. However, the state distribution of DOE’s defense and nondefense R&D can vary widely, and while general appropriations data are available, exact R&D data are not. For instance, New Mexico will receive approximately $4.5 billion in DOE funding in FY 2012, the vast majority of which is related to atomic weapons activities at the two major labs there, Los Alamos and Sandia. On the other hand, states like Idaho, Illinois, and Colorado will receive billion-dollar funding allocations, but with a much greater focus on nondefense functions like nuclear and renewable energy or fundamental science. Different sequestration scenarios would impact these states in very different ways, and small changes in the estimates can have big impacts for any individual state, but without accurate defense/nondefense R&D funding data, estimation becomes difficult. Thus, we focus specifically on balanced sequestration in the next section.
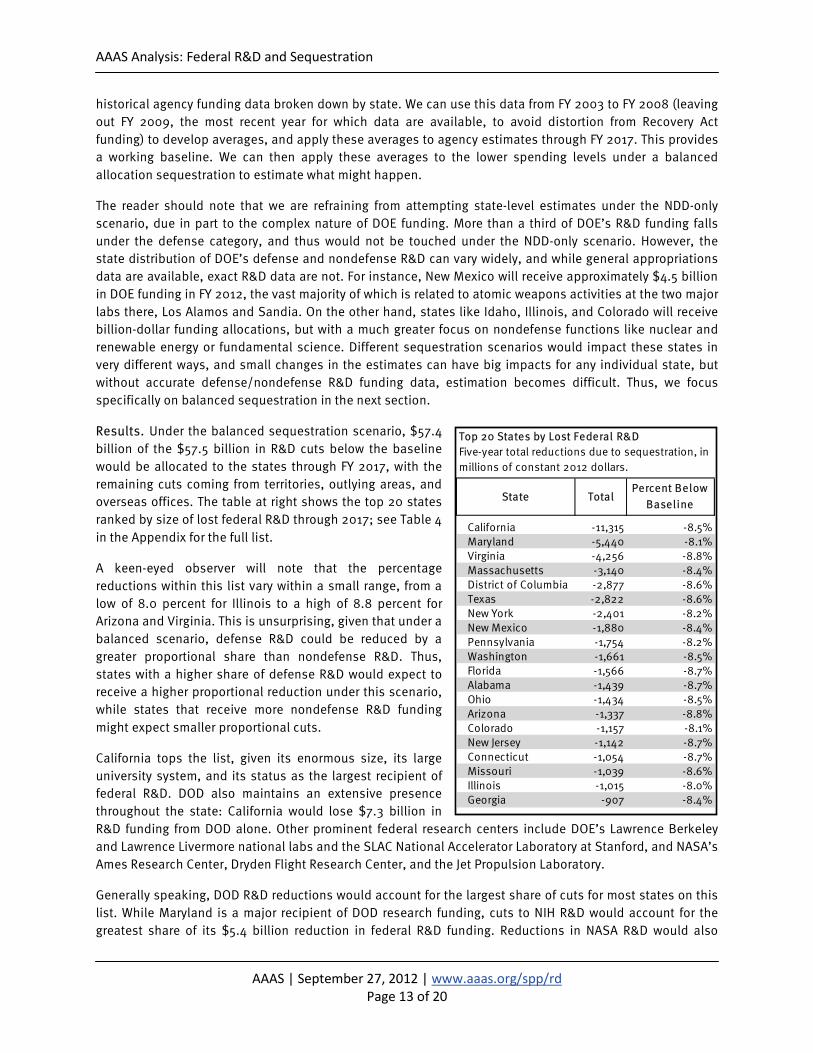
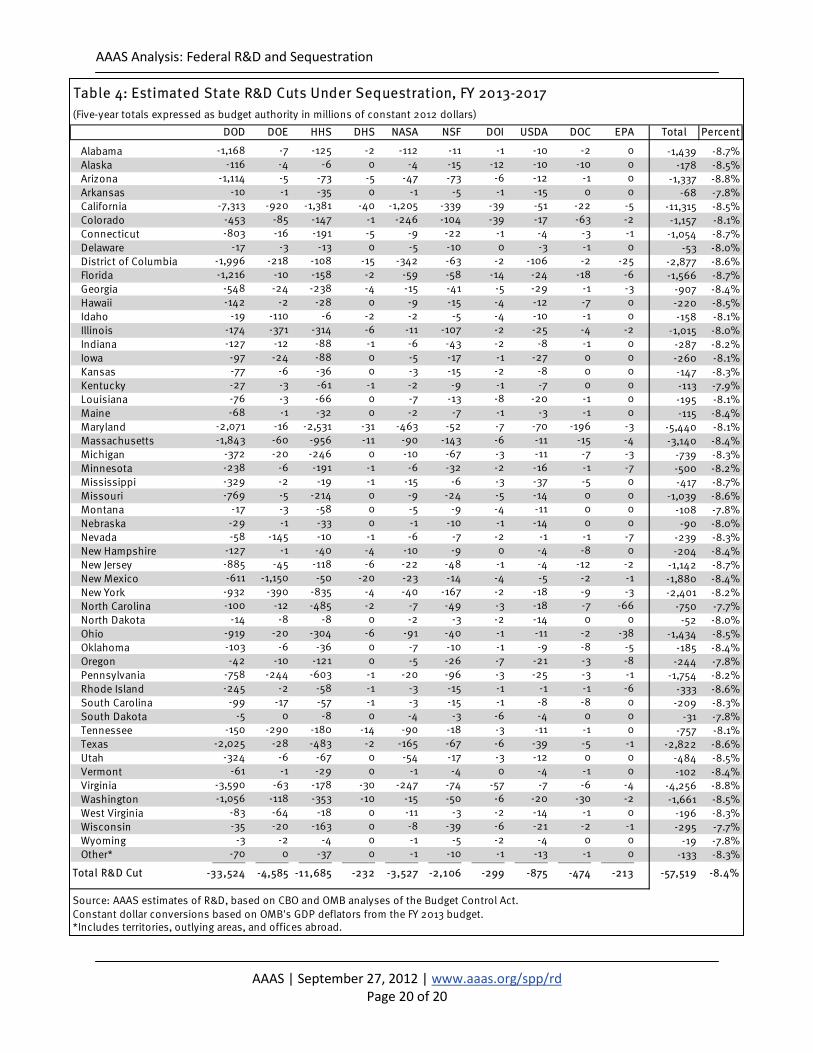
Results. Under the balanced sequestration scenario, $57.4 billion of the $57.5 billion in R&D cuts below the baseline would be allocated to the states through FY 2017, with the remaining cuts coming from territories, outlying areas, and overseas offices. The table at right shows the top 20 states ranked by size of lost federal R&D through 2017; see Table 4 in the Appendix for the full list.
A keen-eyed observer will note that the percentage reductions within this list vary within a small range, from a low of 8.0 percent for Illinois to a high of 8.8 percent for Arizona and Virginia. This is unsurprising, given that under a balanced scenario, defense R&D could be reduced by a greater proportional share than nondefense R&D. Thus, states with a higher share of defense R&D would expect to receive a higher proportional reduction under this scenario, while states that receive more nondefense R&D funding might expect smaller proportional cuts.
California tops the list, given its enormous size, its large university system, and its status as the largest recipient of federal R&D. DOD also maintains an extensive presence throughout the state: California would lose $7.3 billion in R&D funding from DOD alone. Other prominent federal research centers include DOE’s Lawrence Berkeley and Lawrence Livermore national labs and the SLAC National Accelerator Laboratory at Stanford, and NASA’s Ames Research Center, Dryden Flight Research Center, and the Jet Propulsion Laboratory.
Generally speaking, DOD R&D reductions would account for the largest share of cuts for most states on this list. While Maryland is a major recipient of DOD research funding, cuts to NIH R&D would account for the greatest share of its $5.4 billion reduction in federal R&D funding. Reductions in NASA R&D would also
Top 20 States by Lost Federal R&DFive-year total reductions due to sequestration, inmillions of constant 2012 dollars.
State TotalPercent Below
Baseline
California -11,315 -8.5% Maryland -5,440 -8.1% Virginia -4,256 -8.8% Massachusetts -3,140 -8.4% District of Columbia -2,877 -8.6% Texas -2,822 -8.6% New York -2,401 -8.2% New Mexico -1,880 -8.4% Pennsylvania -1,754 -8.2% Washington -1,661 -8.5% Florida -1,566 -8.7% Alabama -1,439 -8.7% Ohio -1,434 -8.5% Arizona -1,337 -8.8% Colorado -1,157 -8.1% New Jersey -1,142 -8.7% Connecticut -1,054 -8.7% Missouri -1,039 -8.6% Illinois -1,015 -8.0% Georgia -907 -8.4%
AAAS Analysis: Federal R&D and Sequestration
AAAS | September 27, 2012 | www.aaas.org/spp/rd Page 14 of 20
contribute a large share given in part the presence of Goddard Space Flight Center, as would cuts to the Department of Commerce (primarily the National Institute of Standards and Technology and the National Oceanic and Atmospheric Administration). In contrast, reductions in federal R&D for Maryland’s neighbor Virginia are almost entirely due to DOD-related cuts, given the prominence of both the military and military contractors in the state. The District of Columbia is in much the same boat.
As one of the more innovative regions in the country with strong universities, Massachusetts would be disproportionately impacted by both NIH and NSF funding reductions, as would New York. The Empire State is also home to Brookhaven National Lab, a major performer of fundamental science research. New Mexico is somewhat unique given the presence of Sandia and Los Alamos national labs, described above. Because of these facilities, DOE R&D cuts might be larger here than anywhere else. Illinois’ profile is also somewhat unique, given low levels of DOD funding relative to other agencies like NSF and the presence of Argonne National Laboratory and Fermilab. Otherwise, expected cuts to DOD and NIH would be the main drivers of R&D reductions in most other states on the list.
THE CUTS IN CONTEXT
Even without the sequestration, the discretionary spending caps have reduced expected future spending by $1 trillion, and have begun to depress federal spending, including R&D. Between FY 2011 and FY 2012 – the first year the caps were put in place – federal R&D declined by 4.4 percent, adjusted for inflation. This was primarily driven by a decline in defense R&D – especially for weapons development – but nondefense R&D also declined slightly, by .8 percent. These declines followed a 5.4 percent overall cut between FY 2010 to FY 2011, and a 4.5 percent cut to nondefense R&D. In FY 2012, estimated federal funding for R&D is at its lowest point since 2002, adjusted for inflation.
In the regular appropriations cycle, aggregate federal expenditures for R&D have remained largely flat for the past decade. There is of course one major exception to this pattern: federal R&D funding in the American Recovery and Reinvestment Act. This funding amounted to $19.6 billion for R&D in inflation-adjusted dollars for FY 2009, though of course it was paid out over a multiyear period. Roughly half of this amount went to NIH, while DOE, NSF, and the National Oceanic and Atmospheric Administration received most of the rest. The additional R&D funding provided by the Recovery Act is equal to slightly less than two years’ worth of estimated cuts under balanced sequestration. Stated differently, over five years, estimated R&D cuts under sequestration would amount to roughly three times the Recovery Act R&D funding amount.
As regular appropriations for R&D funding have either remained flat or declined for most of the past decade, federal R&D as a share of the economy has also declined – partly because the economy has simply grown faster, but more recently due to the decline of actual dollars. As a share of the economy, federal R&D is 16.7 percent smaller than it was a decade ago, and 29.7 percent smaller than it was in the 1970s. Massive growth of the NIH budget in the late 1990s and early 2000s helped to slow this decline. At the same time, private sector R&D has grown significantly, in large part supplanting public R&D.
In one sense, we should consider private-sector R&D growth a good thing: an innovative economy requires the dynamic creation and application of knowledge, and R&D investment is one of the primary contributors to that function, wherever it may originate. As such, private R&D is a vital component of the national innovation ecosystem. But at the same time, it is important to remember that three-quarters of private R&D is focused on latter-stage product development oriented towards nearer-term rewards, whereas public R&D – especially nondefense R&D – is far more focused on basic and applied research, which necessarily requires longer-term investments and higher tolerance for risk and uncertainty, and a willingness to accept knowledge spillovers. Federal funding is a central lifeline for fundamental research at the cutting edge of every key knowledge area. Reduced public R&D means fewer investments in the pursuit of fundamental
AAAS Analysis: Federal R&D and Sequestration
AAAS | September 27, 2012 | www.aaas.org/spp/rd Page 15 of 20
knowledge and ways to apply it. Such a move would run counter to the advice of major experts and bodies as diverse as the National Academies and the Bowles-Simpson deficit reduction commission.xiii
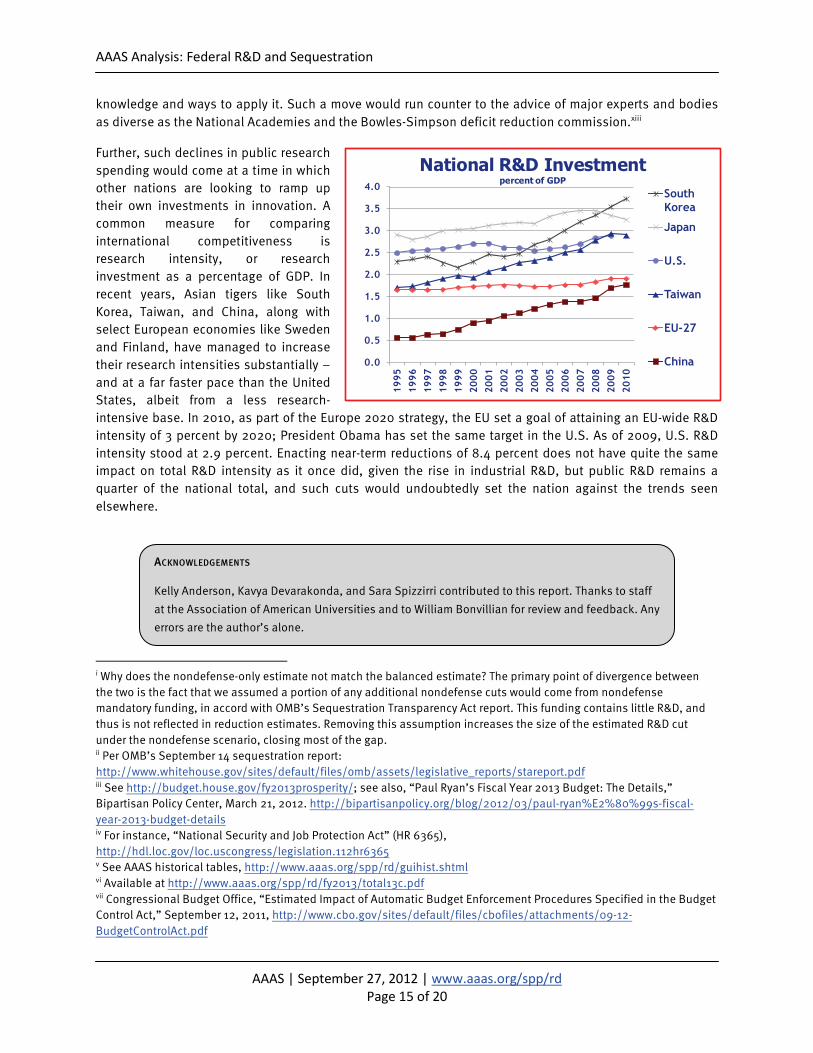
Further, such declines in public research spending would come at a time in which other nations are looking to ramp up their own investments in innovation. A common measure for comparing international competitiveness is research intensity, or research investment as a percentage of GDP. In recent years, Asian tigers like South Korea, Taiwan, and China, along with select European economies like Sweden and Finland, have managed to increase their research intensities substantially – and at a far faster pace than the United States, albeit from a less research-intensive base. In 2010, as part of the Europe 2020 strategy, the EU set a goal of attaining an EU-wide R&D intensity of 3 percent by 2020; President Obama has set the same target in the U.S. As of 2009, U.S. R&D intensity stood at 2.9 percent. Enacting near-term reductions of 8.4 percent does not have quite the same impact on total R&D intensity as it once did, given the rise in industrial R&D, but public R&D remains a quarter of the national total, and such cuts would undoubtedly set the nation against the trends seen elsewhere.
i Why does the nondefense-only estimate not match the balanced estimate? The primary point of divergence between the two is the fact that we assumed a portion of any additional nondefense cuts would come from nondefense mandatory funding, in accord with OMB’s Sequestration Transparency Act report. This funding contains little R&D, and thus is not reflected in reduction estimates. Removing this assumption increases the size of the estimated R&D cut under the nondefense scenario, closing most of the gap. ii Per OMB’s September 14 sequestration report: http://www.whitehouse.gov/sites/default/files/omb/assets/legislative_reports/stareport.pdf iii See http://budget.house.gov/fy2013prosperity/; see also, “Paul Ryan’s Fiscal Year 2013 Budget: The Details,” Bipartisan Policy Center, March 21, 2012. http://bipartisanpolicy.org/blog/2012/03/paul-ryan%E2%80%99s-fiscal-year-2013-budget-details iv For instance, “National Security and Job Protection Act” (HR 6365), http://hdl.loc.gov/loc.uscongress/legislation.112hr6365 v See AAAS historical tables, http://www.aaas.org/spp/rd/guihist.shtml vi Available at http://www.aaas.org/spp/rd/fy2013/total13c.pdf vii Congressional Budget Office, “Estimated Impact of Automatic Budget Enforcement Procedures Specified in the Budget Control Act,” September 12, 2011, http://www.cbo.gov/sites/default/files/cbofiles/attachments/09-12-BudgetControlAct.pdf
0.0
0.5
1.0
1.5
2.0
2.5
3.0
3.5
4.0
1995
1996
1997
1998
1999
2000
2001
2002
2003
2004
2005
2006
2007
2008
2009
2010
National R&D Investmentpercent of GDP
South Korea
Japan
U.S.
Taiwan
EU-27
China
ACKNOWLEDGEMENTS
Kelly Anderson, Kavya Devarakonda, and Sara Spizzirri contributed to this report. Thanks to staff at the Association of American Universities and to William Bonvillian for review and feedback. Any errors are the author’s alone.
AAAS Analysis: Federal R&D and Sequestration
AAAS | September 27, 2012 | www.aaas.org/spp/rd Page 16 of 20
viii The percentage reduction figures over five years are less than those projected for FY 2013 alone because, as stated, the proportion of annual funding cuts is expected to decline relative to the BCA caps over time. ix See AAAS Report XXXVII: R&D in FY 2013, Chapter 7, http://www.aaas.org/spp/rd/rdreport2013/13pch07.pdf x Under Threat: Sequestration’s Impact on Nondefense Jobs and Services, Sen. Harkin (D-IA), http://harkin.senate.gov/documents/pdf/500ff3554f9ba.pdf xi Letter from HHS Assistant Secretary for Financial Resources Ellen Murray to Rep. Ed Markey (D-MA), June 29, 2012, http://markey.house.gov/sites/markey.house.gov/files/documents/HHS%20response%20on%20sequester%20cuts.pdf xii For a list of these, see http://publichealthfunding.org/index.php/ndd_united1/impact_examples_health/ xiii National Academies, Rising Above the Gathering Storm, http://www.nap.edu/catalog.php?record_id=11463; National Commission on Fiscal Responsibility and Reform, http://www.fiscalcommission.gov/news/moment-truth-report-national-commission-fiscal-responsibility-and-reform
AAAS Analysis: Federal R&D and Sequestration
AAAS | September 27, 2012 | www.aaas.org/spp/rd Page 17 of 20
APPENDIX
Table 1: Estimated R&D Funding Under the BCA Caps, FY 2013-2017(budget authority in millions of constant 2012 dollars)
Source: AAAS estimates of R&D, based on CBO and OMB analyses of the Budget Control Act.Constant dollar conversions based on OMB's GDP deflators from the FY 2013 budget.
AAAS Analysis: Federal R&D and Sequestration
AAAS | September 27, 2012 | www.aaas.org/spp/rd Page 18 of 20
Table 2: Estimated R&D Cuts Under the Sequestration, FY 2013-2017(budget authority in millions of constant 2012 dollars)
Source: AAAS estimates of R&D, based on CBO and OMB analyses of the Budget Control Act.Constant dollar conversions based on OMB's GDP deflators from the FY 2013 budget.
AAAS Analysis: Federal R&D and Sequestration
AAAS | September 27, 2012 | www.aaas.org/spp/rd Page 19 of 20
Table 3: Estimated R&D Cuts Under Nondefense-Only Sequestration, FY 2013-2017(budget authority in millions of constant 2012 dollars)
Source: AAAS estimates of R&D, based on CBO and OMB analyses of the Budget Control Act.Constant dollar conversions based on OMB's GDP deflators from the FY 2013 budget.
AAAS Analysis: Federal R&D and Sequestration
AAAS | September 27, 2012 | www.aaas.org/spp/rd Page 20 of 20
Table 4: Estimated State R&D Cuts Under Sequestration, FY 2013-2017(Five-year totals expressed as budget authority in millions of constant 2012 dollars)
DOD DOE HHS DHS NASA NSF DOI USDA DOC EPA Total Percent
Source: AAAS estimates of R&D, based on CBO and OMB analyses of the Budget Control Act.Constant dollar conversions based on OMB's GDP deflators from the FY 2013 budget.*Includes territories, outlying areas, and offices abroad.