savills.co.jp/research 01 Briefing Residential leasing Q2 2017 Savills World Research Tokyo SUMMARY Rental growth has continued in the C5W, and slow gradual increases are expected. Average mid-market asking rents in Tokyo’s 23 wards (23W) stood at JPY3,654 per sq m, down 0.4% quarter-on-quarter (QoQ) but still up 0.4% year-on-year (YoY). Average asking rents in the central five wards (C5W) stood at JPY4,298 per sq m, up 0.9% QoQ and 0.8% YoY. Tokyo’s Inner North and Outer East areas continue to outperform other areas, registering 2.1% and 1.6% growth YoY respectively. The C5W’s rental premium over the 23-ward average continues to increase, and stands at 16.9%. Though there have been minor fluctuations, average occupancy rates continue to remain above 95%. Overall, average rents of upscale residential units in the C5W in Q1/2017 were still 9% lower than the 2007 value. Shinjuku and Minato have continued rental growth against the 2016 averages. “Mid-market asking rents in the C5W continued to see gradual rental increases in Q2/2017. With occupancy comfortably above 95%, residential demand in Tokyo appears to remain strong. Average rents of upscale apartments have continued to grow in Shinjuku and Minato.” Savills Research & Consultancy Image: The Parkhouse Shirokane Chojamaru
Transcript
savills.co.jp/research 01
BriefingResidential leasing Q2 2017
Savills World Research Tokyo
SUMMARYRental growth has continued in the C5W, and slow gradual increases are expected.
Average mid-market asking rents in Tokyo’s 23 wards (23W) stood at JPY3,654 per sq m, down 0.4% quarter-on-quarter (QoQ) but still up 0.4% year-on-year (YoY).
Average asking rents in the central five wards (C5W) stood at JPY4,298 per sq m, up 0.9% QoQ and 0.8% YoY.
Tokyo’s Inner North and Outer East areas continue to outperform other areas, registering 2.1% and 1.6% growth YoY respectively.
The C5W’s rental premium over the 23-ward average continues to increase, and stands at 16.9%.
Though there have been minor fluctuations, average occupancy rates continue to remain above 95%.
Overall, average rents of upscale residential units in the C5W in Q1/2017 were still 9% lower than the 2007 value. Shinjuku and Minato have continued rental growth against the 2016 averages.
“Mid-market asking rents in the C5W continued to see gradual rental increases in Q2/2017. With occupancy comfortably above 95%, residential demand in Tokyo appears to remain strong. Average rents of upscale apartments have continued to grow in Shinjuku and Minato.” Savills Research & Consultancy
Image: The Parkhouse Shirokane Chojamaru
Briefing | Tokyo residential leasing Q2 2017
savills.co.jp/research 02
MAP 1
Tokyo’s 23 wards by survey area
Source: Savills Research & Consultancy
Suginami
Nerima
Itabashi
Kita
Adachi
Nakano
Toshima
Shibuya
MeguroShinagawa
Ota
Minato
Chiyoda
Chuo Koto
TaitoSumida
Edogawa
Katsushika
Arakawa
Tokyo Station
Setagaya
Shibuya
Meguro
Minato
Chiyoda
Chuo
Bunkyo
Shinjuku
Tokyo Station
Central 5 Wards 944,000,
10.4%(1.58 pph)
South2,240,000,
24.7%(1.89 pph)
West 1,590,000,
17.5%(1.85 pph)
Inner North 504,000,
5.6%(1.66 pph)
Outer North 875,000,
9.6%(1.85 pph)
Inner East 913,000,
10.1%(1.92 pph)
Outer East2,008,000,
22.1%(2.09 pph)
Central 5 Wards
South
West
Inner North
Outer North
Inner East
Outer East
Tokyo 23 wardstotal population:
9.07 million(1.87 pph)
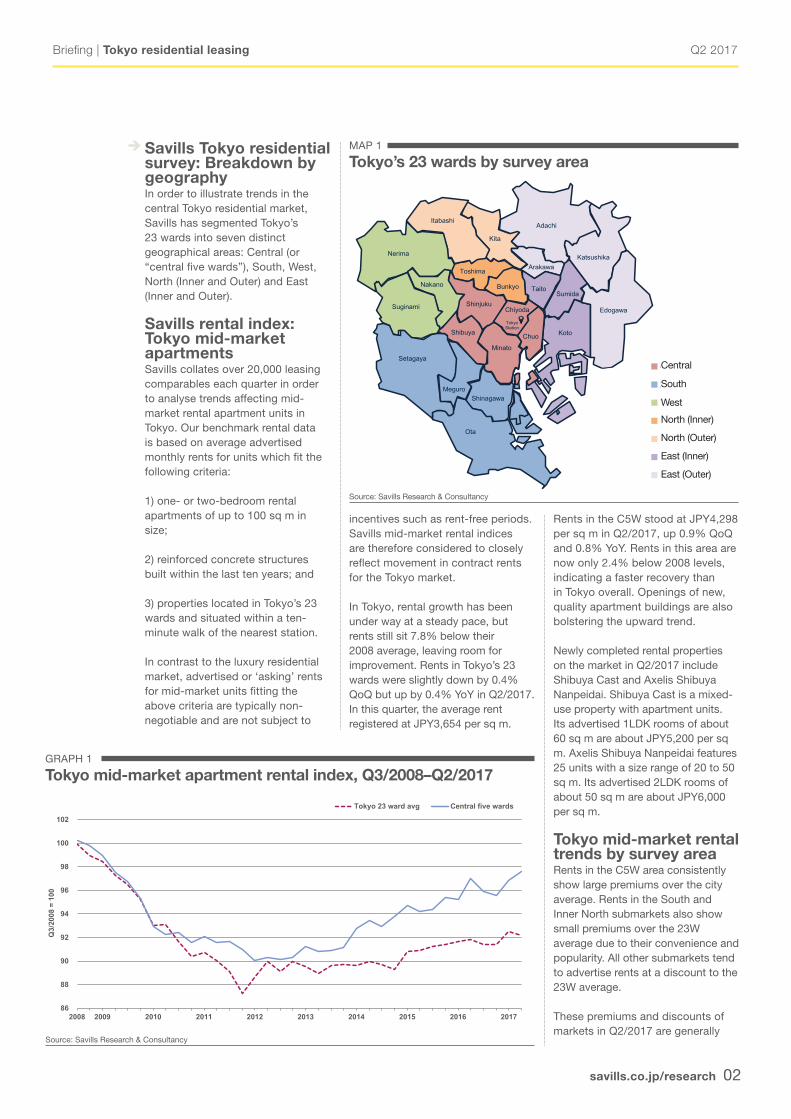
Savills Tokyo residential survey: Breakdown by geographyIn order to illustrate trends in the central Tokyo residential market, Savills has segmented Tokyo’s 23 wards into seven distinct geographical areas: Central (or “central five wards”), South, West, North (Inner and Outer) and East (Inner and Outer).
Savills rental index: Tokyo mid-market apartmentsSavills collates over 20,000 leasing comparables each quarter in order to analyse trends affecting mid-market rental apartment units in Tokyo. Our benchmark rental data is based on average advertised monthly rents for units which fit the following criteria:
1) one- or two-bedroom rental apartments of up to 100 sq m in size;
2) reinforced concrete structures built within the last ten years; and
3) properties located in Tokyo’s 23 wards and situated within a ten-minute walk of the nearest station.
In contrast to the luxury residential market, advertised or ‘asking’ rents for mid-market units fitting the above criteria are typically non-negotiable and are not subject to
incentives such as rent-free periods. Savills mid-market rental indices are therefore considered to closely reflect movement in contract rents for the Tokyo market.
In Tokyo, rental growth has been under way at a steady pace, but rents still sit 7.8% below their 2008 average, leaving room for improvement. Rents in Tokyo’s 23 wards were slightly down by 0.4% QoQ but up by 0.4% YoY in Q2/2017. In this quarter, the average rent registered at JPY3,654 per sq m.
Rents in the C5W stood at JPY4,298 per sq m in Q2/2017, up 0.9% QoQ and 0.8% YoY. Rents in this area are now only 2.4% below 2008 levels, indicating a faster recovery than in Tokyo overall. Openings of new, quality apartment buildings are also bolstering the upward trend.
Newly completed rental properties on the market in Q2/2017 include Shibuya Cast and Axelis Shibuya Nanpeidai. Shibuya Cast is a mixed-use property with apartment units. Its advertised 1LDK rooms of about 60 sq m are about JPY5,200 per sq m. Axelis Shibuya Nanpeidai features 25 units with a size range of 20 to 50 sq m. Its advertised 2LDK rooms of about 50 sq m are about JPY6,000 per sq m.
Tokyo mid-market rental trends by survey areaRents in the C5W area consistently show large premiums over the city average. Rents in the South and Inner North submarkets also show small premiums over the 23W average due to their convenience and popularity. All other submarkets tend to advertise rents at a discount to the 23W average.
These premiums and discounts of markets in Q2/2017 are generally
GRAPH 1
Tokyo mid-market apartment rental index, Q3/2008–Q2/2017
Source: Savills Research & Consultancy
86
88
90
92
94
96
98
100
102
2008 2009 2010 2011 2012 2013 2014 2015 2016 2017
Q3/
2008
= 1
00
Tokyo 23 ward avg Central five wards
Central
South
West
North (Inner)
North (Outer)
East (Inner)
East (Outer)
Q2 2017
savills.co.jp/research 03
Briefing | Tokyo residential leasing
GRAPH 2
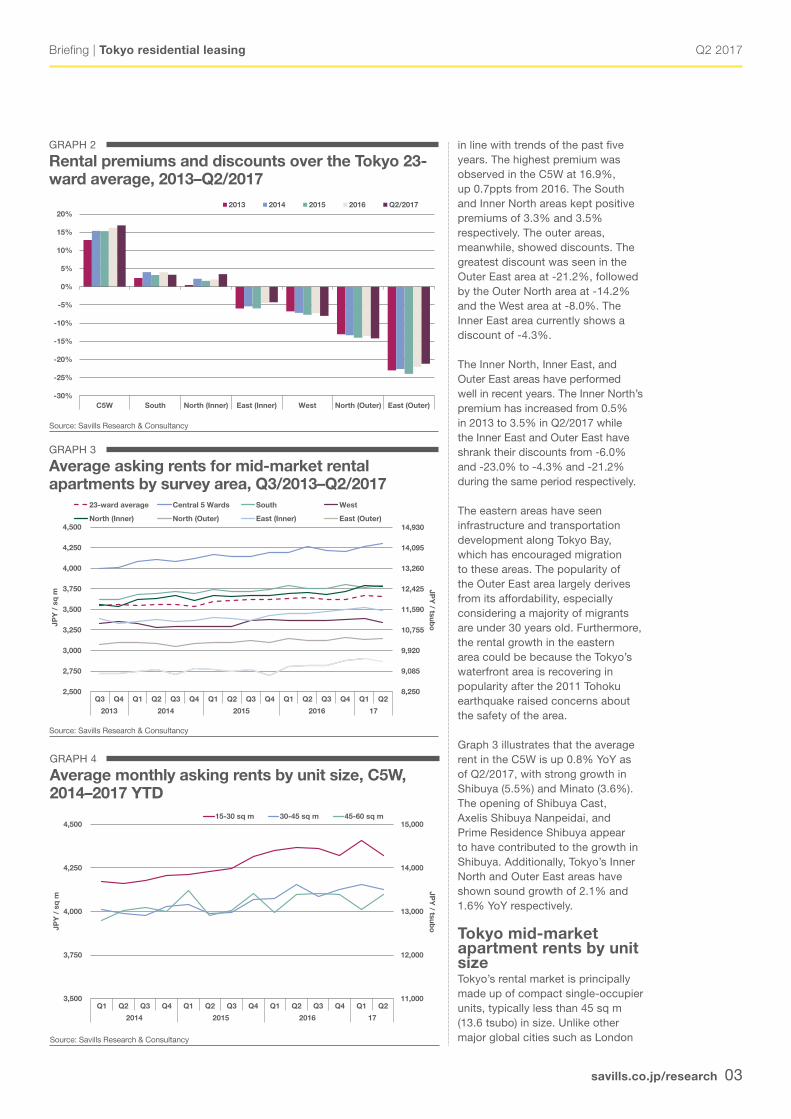
Rental premiums and discounts over the Tokyo 23-ward average, 2013–Q2/2017
Source: Savills Research & Consultancy
-30%
-25%
-20%
-15%
-10%
-5%
0%
5%
10%
15%
20%
C5W South North (Inner) East (Inner) West North (Outer) East (Outer)
2013 2014 2015 2016 Q2/2017
GRAPH 3
Average asking rents for mid-market rental apartments by survey area, Q3/2013–Q2/2017
Source: Savills Research & Consultancy
8,250
9,085
9,920
10,755
11,590
12,425
13,260
14,095
14,930
2,500
2,750
3,000
3,250
3,500
3,750
4,000
4,250
4,500
Q3 Q4 Q1 Q2 Q3 Q4 Q1 Q2 Q3 Q4 Q1 Q2 Q3 Q4 Q1 Q2
2013 2014 2015 2016 17
JPY
/ tsuboJP
Y /
sq
m
23-ward average Central 5 Wards South West
North (Inner) North (Outer) East (Inner) East (Outer)
GRAPH 4
Average monthly asking rents by unit size, C5W, 2014–2017 YTD
Source: Savills Research & Consultancy
11,000
12,000
13,000
14,000
15,000
3,500
3,750
4,000
4,250
4,500
Q1 Q2 Q3 Q4 Q1 Q2 Q3 Q4 Q1 Q2 Q3 Q4 Q1 Q2
2014 2015 2016 17
JPY
/ tsuboJP
Y /
sq
m
15-30 sq m 30-45 sq m 45-60 sq m
in line with trends of the past five years. The highest premium was observed in the C5W at 16.9%, up 0.7ppts from 2016. The South and Inner North areas kept positive premiums of 3.3% and 3.5% respectively. The outer areas, meanwhile, showed discounts. The greatest discount was seen in the Outer East area at -21.2%, followed by the Outer North area at -14.2% and the West area at -8.0%. The Inner East area currently shows a discount of -4.3%.
The Inner North, Inner East, and Outer East areas have performed well in recent years. The Inner North’s premium has increased from 0.5% in 2013 to 3.5% in Q2/2017 while the Inner East and Outer East have shrank their discounts from -6.0% and -23.0% to -4.3% and -21.2% during the same period respectively.
The eastern areas have seen infrastructure and transportation development along Tokyo Bay, which has encouraged migration to these areas. The popularity of the Outer East area largely derives from its affordability, especially considering a majority of migrants are under 30 years old. Furthermore, the rental growth in the eastern area could be because the Tokyo’s waterfront area is recovering in popularity after the 2011 Tohoku earthquake raised concerns about the safety of the area.
Graph 3 illustrates that the average rent in the C5W is up 0.8% YoY as of Q2/2017, with strong growth in Shibuya (5.5%) and Minato (3.6%). The opening of Shibuya Cast, Axelis Shibuya Nanpeidai, and Prime Residence Shibuya appear to have contributed to the growth in Shibuya. Additionally, Tokyo’s Inner North and Outer East areas have shown sound growth of 2.1% and 1.6% YoY respectively.
Tokyo mid-market apartment rents by unit size Tokyo’s rental market is principally made up of compact single-occupier units, typically less than 45 sq m (13.6 tsubo) in size. Unlike other major global cities such as London
Q2 2017
savills.co.jp/research 04
Briefing | Tokyo residential leasing
GRAPH 5
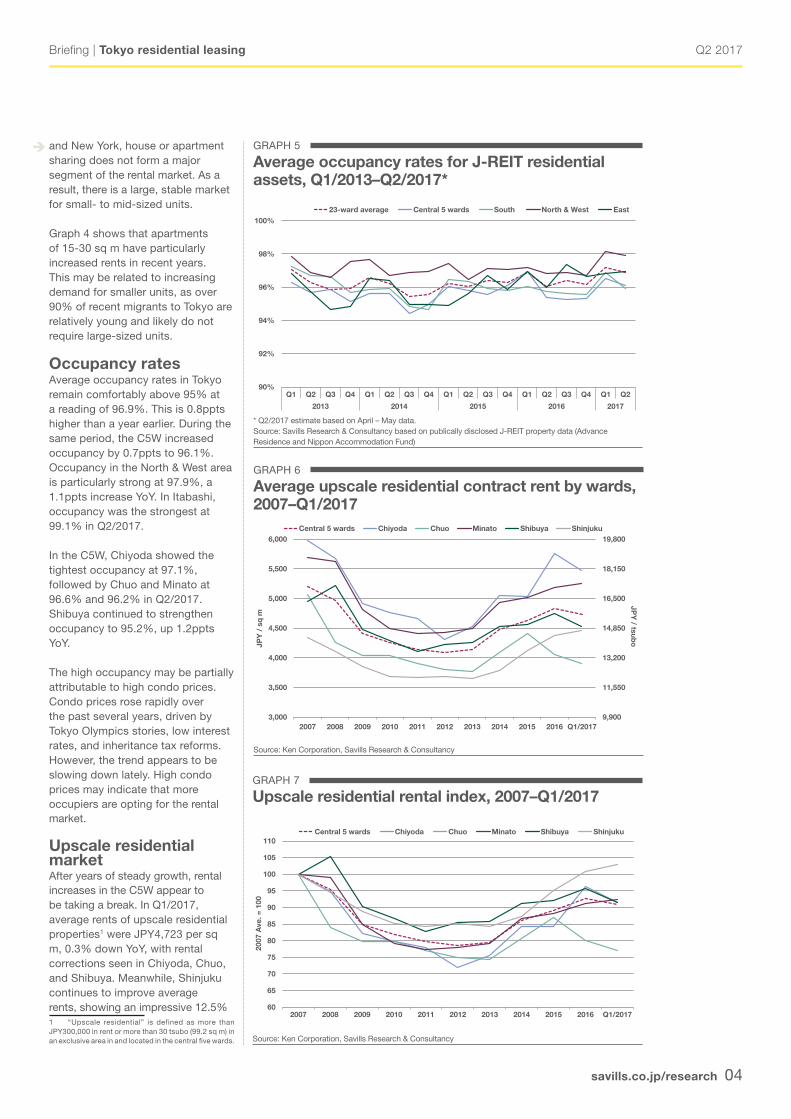
Average occupancy rates for J-REIT residential assets, Q1/2013–Q2/2017*
* Q2/2017 estimate based on April – May data. Source: Savills Research & Consultancy based on publically disclosed J-REIT property data (Advance Residence and Nippon Accommodation Fund)
Central 5 wards Chiyoda Chuo Minato Shibuya Shinjuku
and New York, house or apartment sharing does not form a major segment of the rental market. As a result, there is a large, stable market for small- to mid-sized units.
Graph 4 shows that apartments of 15-30 sq m have particularly increased rents in recent years. This may be related to increasing demand for smaller units, as over 90% of recent migrants to Tokyo are relatively young and likely do not require large-sized units.
Occupancy ratesAverage occupancy rates in Tokyo remain comfortably above 95% at a reading of 96.9%. This is 0.8ppts higher than a year earlier. During the same period, the C5W increased occupancy by 0.7ppts to 96.1%. Occupancy in the North & West area is particularly strong at 97.9%, a 1.1ppts increase YoY. In Itabashi, occupancy was the strongest at 99.1% in Q2/2017.
In the C5W, Chiyoda showed the tightest occupancy at 97.1%, followed by Chuo and Minato at 96.6% and 96.2% in Q2/2017. Shibuya continued to strengthen occupancy to 95.2%, up 1.2ppts YoY.
The high occupancy may be partially attributable to high condo prices. Condo prices rose rapidly over the past several years, driven by Tokyo Olympics stories, low interest rates, and inheritance tax reforms. However, the trend appears to be slowing down lately. High condo prices may indicate that more occupiers are opting for the rental market.
Upscale residential marketAfter years of steady growth, rental increases in the C5W appear to be taking a break. In Q1/2017, average rents of upscale residential properties1 were JPY4,723 per sq m, 0.3% down YoY, with rental corrections seen in Chiyoda, Chuo, and Shibuya. Meanwhile, Shinjuku continues to improve average rents, showing an impressive 12.5% 1 “Upscale residential” is defined as more than JPY300,000 in rent or more than 30 tsubo (99.2 sq m) in an exclusive area in and located in the central five wards.
Q2 2017
savills.co.jp/research 05
Briefing | Tokyo residential leasing
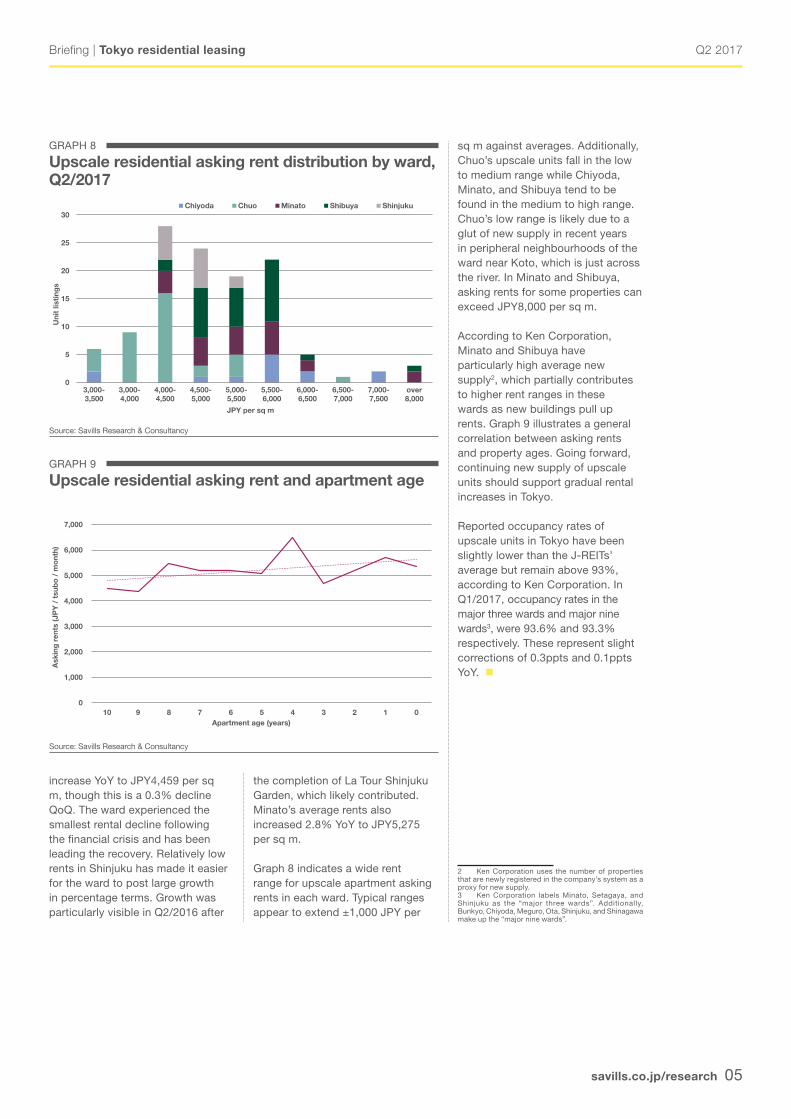
GRAPH 8
Upscale residential asking rent distribution by ward, Q2/2017
Source: Savills Research & Consultancy
0
5
10
15
20
25
30
3,000-3,500
3,000-4,000
4,000-4,500
4,500-5,000
5,000-5,500
5,500-6,000
6,000-6,500
6,500-7,000
7,000-7,500
over8,000
Uni
t lis
ting
s
JPY per sq m
Chiyoda Chuo Minato Shibuya Shinjuku
increase YoY to JPY4,459 per sq m, though this is a 0.3% decline QoQ. The ward experienced the smallest rental decline following the financial crisis and has been leading the recovery. Relatively low rents in Shinjuku has made it easier for the ward to post large growth in percentage terms. Growth was particularly visible in Q2/2016 after
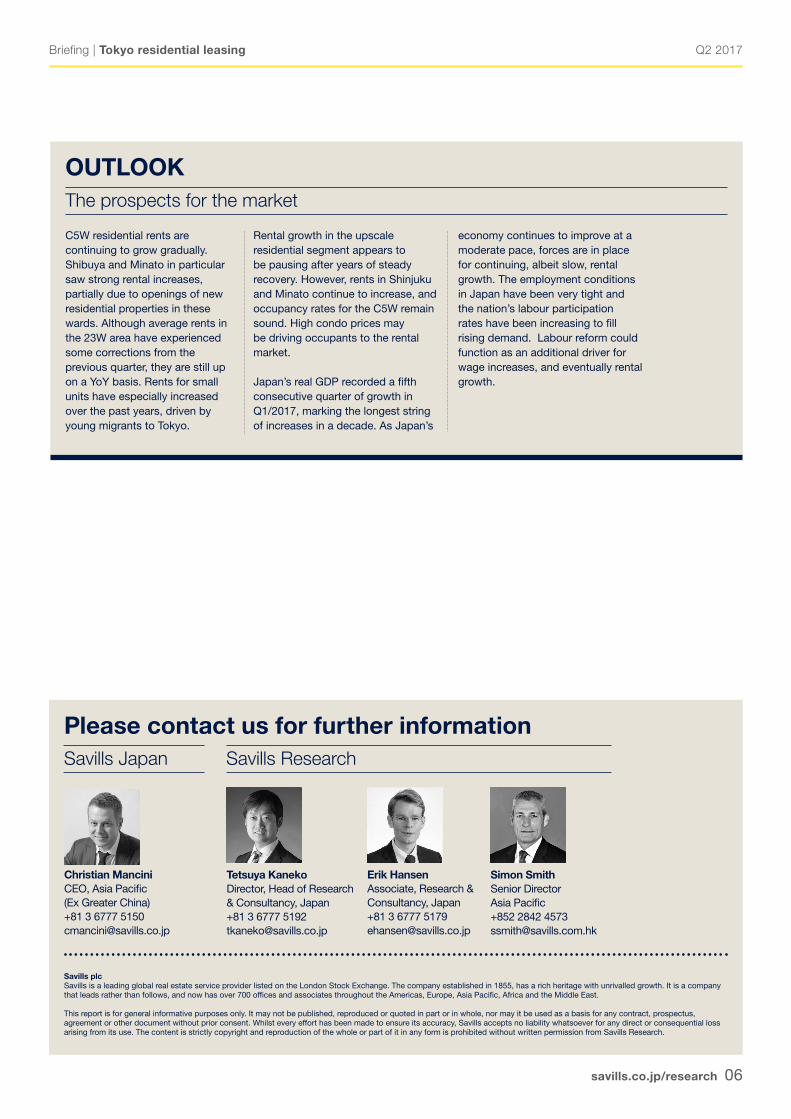
GRAPH 9
Upscale residential asking rent and apartment age
Source: Savills Research & Consultancy
0
1,000
2,000
3,000
4,000
5,000
6,000
7,000
10 9 8 7 6 5 4 3 2 1 0
Ask
ing
ren
ts (J
PY
/ t
sub
o /
mo
nth)
Apartment age (years)
sq m against averages. Additionally, Chuo’s upscale units fall in the low to medium range while Chiyoda, Minato, and Shibuya tend to be found in the medium to high range. Chuo’s low range is likely due to a glut of new supply in recent years in peripheral neighbourhoods of the ward near Koto, which is just across the river. In Minato and Shibuya, asking rents for some properties can exceed JPY8,000 per sq m.
According to Ken Corporation, Minato and Shibuya have particularly high average new supply2, which partially contributes to higher rent ranges in these wards as new buildings pull up rents. Graph 9 illustrates a general correlation between asking rents and property ages. Going forward, continuing new supply of upscale units should support gradual rental increases in Tokyo.
Reported occupancy rates of upscale units in Tokyo have been slightly lower than the J-REITs’ average but remain above 93%, according to Ken Corporation. In Q1/2017, occupancy rates in the major three wards and major nine wards3, were 93.6% and 93.3% respectively. These represent slight corrections of 0.3ppts and 0.1ppts YoY.
2 Ken Corporation uses the number of properties that are newly registered in the company’s system as a proxy for new supply.3 Ken Corporation labels Minato, Setagaya, and Shinjuku as the “major three wards”. Additionally, Bunkyo, Chiyoda, Meguro, Ota, Shinjuku, and Shinagawa make up the “major nine wards”.
the completion of La Tour Shinjuku Garden, which likely contributed. Minato’s average rents also increased 2.8% YoY to JPY5,275 per sq m.
Graph 8 indicates a wide rent range for upscale apartment asking rents in each ward. Typical ranges appear to extend ±1,000 JPY per
Q2 2017
savills.co.jp/research 06
Briefing | Tokyo residential leasing
Savills plcSavills is a leading global real estate service provider listed on the London Stock Exchange. The company established in 1855, has a rich heritage with unrivalled growth. It is a company that leads rather than follows, and now has over 700 offices and associates throughout the Americas, Europe, Asia Pacific, Africa and the Middle East.
This report is for general informative purposes only. It may not be published, reproduced or quoted in part or in whole, nor may it be used as a basis for any contract, prospectus, agreement or other document without prior consent. Whilst every effort has been made to ensure its accuracy, Savills accepts no liability whatsoever for any direct or consequential loss arising from its use. The content is strictly copyright and reproduction of the whole or part of it in any form is prohibited without written permission from Savills Research.
Savills Japan
Please contact us for further informationSavills Research
Christian ManciniCEO, Asia Pacific (Ex Greater China)+81 3 6777 [email protected]
Tetsuya KanekoDirector, Head of Research & Consultancy, Japan+81 3 6777 [email protected]
Erik HansenAssociate, Research & Consultancy, Japan+81 3 6777 [email protected]
OUTLOOKThe prospects for the market
C5W residential rents are continuing to grow gradually. Shibuya and Minato in particular saw strong rental increases, partially due to openings of new residential properties in these wards. Although average rents in the 23W area have experienced some corrections from the previous quarter, they are still up on a YoY basis. Rents for small units have especially increased over the past years, driven by young migrants to Tokyo.
Rental growth in the upscale residential segment appears to be pausing after years of steady recovery. However, rents in Shinjuku and Minato continue to increase, and occupancy rates for the C5W remain sound. High condo prices may be driving occupants to the rental market.
Japan’s real GDP recorded a fifth consecutive quarter of growth in Q1/2017, marking the longest string of increases in a decade. As Japan’s
economy continues to improve at a moderate pace, forces are in place for continuing, albeit slow, rental growth. The employment conditions in Japan have been very tight and the nation’s labour participation rates have been increasing to fill rising demand. Labour reform could function as an additional driver for wage increases, and eventually rental growth.