BrightnESS Building a research infrastructure and synergies for highest scientific impact on ESS H2020-INFRADEV-1-2015-1 Grant Agreement Number: 676548 Deliverable Report: [D4.3 - Natural and enriched Gadolinium converters design] 1 Ref. Ares(2016)6768428 - 02/12/2016
Transcript
BrightnESS
Building a research infrastructure and synergies for highestscientific impact on ESS
H2020-INFRADEV-1-2015-1
Grant Agreement Number: 676548
Deliverable Report: [D4.3 − Natural and enriched Gadolinium convertersdesign]
1
Ref. Ares(2016)6768428 - 02/12/2016
Project Deliverable Information Sheet
BrightnESS Project
Project Ref. No. 676548Project Title: BrigthnESS - Building a research infrastructure andsynergies for highest scientific impact on ESSProject Website: brightness.esss.seDeliverable No.: D4.3Deliverable Type: ReportDissemination Level: To ECProject Officer
4.1 Schematic representation of the detector used in backwards configuration. . . 7
5.1 Kinetic energy of conversion electrons (bin size 1 keV) as simulated with Geant4. 85.2 Simulated spectrum of conversion electrons in drift (bin size 1 keV) and de-
posited energy in drift depending on the drift space . . . . . . . . . . . . . . . . 95.3 Properties of natural Gd, 155Gd and 157Gd converters . . . . . . . . . . . . . . 105.4 Mean deposited energy of gammas in backwards configuration depending on
varying converter thickness and drift length. . . . . . . . . . . . . . . . . . . . . 125.5 Gamma detection probability for 50 µm converter thickness without a threshold
and after the application of a threshold that cuts away 5% of the conversionelectron detection efficiency. . . . . . . . . . . . . . . . . . . . . . . . . . . . . . 13
5.6 Gamma detection probability for 50 µm converter thickness after the applicationof a threshold that cuts away 10% or 25% of the conversion electron detectionefficiency. . . . . . . . . . . . . . . . . . . . . . . . . . . . . . . . . . . . . . . . 13
5.7 Ultrasonic welding of a Gd foil to an Aluminium frame. . . . . . . . . . . . . . . 15
Contents
1 Project Deliverable Information Sheet 2
2 Document Control Sheet 2
3 Executive Summary 5
4 Report on Natural and enriched Gadolinium converters design 6
This deliverable, D4.3: Natural and enriched Gadolinium converters design, is about determin-ing a viable approved design for Gadolinium convertors for detectors. It establishes a designand engineering technique baseline for the detectors. There are three main aspects to thisdeliverable:
1. The requirements for the converters layers by understanding the desired properties.
2. Established a mechanical technique, by which relatively large areas (up to 60x60 cm2)of thin Gadolinium foils can be produced.
3. Present isoptope-enriched Gadolinium as a possible future upgrade for the detectors, bydetermining that there is a limited, but realistic strategic availability of the material.
The development of Gadolinium (Gd) based GEM detectors for the NMX instrument atthe European Spallation Source ERIC (ESS) in Lund, Sweden is funded by the EuropeanUnion through the BrightnESS project. Simulations and first measurements, taken duringexperiments at CERN and at the R2D2 beamline at IFE, Norway, demonstrate that the Gd-GEM detector will be able to successfully tackle the position resolution challenge. A positionresolution of around 200µm is achievable, which is below state-of-the-art of ca. 1mm positionresolution.
Large progress has been made in the understanding of the properties of Gd converters,leading to the determination of the appropriate converter and drift thickness. The detectedgamma background will be higher than for a 10B or 3He based detector, but with around 0.1%,depending on the incoming gamma energy, this is reasonable. This meets the detector re-quirements for the NMX instrument at ESS in Lund, Sweden.
The strategic availability of enriched Gadolinium has been ascertained. Two potential sup-pliers, who have access to limited stocks of this enriched material, have been identified, andan industrial collaboration with Goodfellow Ltd (UK) and Neonest AB (SE) is ongoing to studythe subsequent manufacturing of enriched Gd converters. This collaboration has determinedthat it is possible to produce thin foils of Gadolinium with almost no production losses, whichis important for the economic viability of the process. Any such upgrade of the detectors usingenriched Gadolinium would take place after the operation phase at ESS has started, how-ever it is important to determine whether this represents a viable future upgrade path for thedetectors, or whether an upgrade by expanding the available area is a better direction.
As producing a single Gd foil of 60x60cm2 is not possible, there is a performance risk ifseveral foils cannot be joined without a seam, and into a mechanically stable structure thatcan be mounted into the detector. Ultrasonic welding using a machine by Branson Ultrasonics(CH and ES) has been identified as suitable technology to produce a 60 x 60 cm2 natural Gdcathode. Welding Gd is novel, and was investigated jointly with the industrial producer. Amechanically reliable and affordable cathode can be produced in this manner.
The complete work on Gd converters is presently being summarised for a future journalpublication on this topic.
The work and contents of this deliverable establish a baseline for the Gadolinium convertercathodes needed for the NMX instrument at the ESS, in Lund, Sweden.
5
Report on Natural and enriched Gadolinium converters design
Efficient neutron converters are a key component of a neutron detector. A good neutron con-verter has to have a high neutron capture cross section and has to produce with a high proba-bility charged secondary particles. Further, the charged secondary particles should be able toescape from the converter and to reach the active volume of the detector, where they deposita large amount of energy. Ideally, the charged secondaries are fully contained in the detector,i.e. they loose all their energy in the active volume.
Gadolinium, a chemical element with symbol Gd and atomic number 64, is a light rareearth metal. Named after the Finnish chemist Johan Gadolin, it is a silvery-white, malleableand ductile metal that occurs in nature only in salt form. The primary source of Gadolinium arethe Bastnasite ore deposits in China, Russia and the US. Gadolinium is one of the rare-earthelements, and has a few specialized industrial uses. It is used for example as contrast agent forMRI examinations, or due to its magneto-caloric properties as refrigerant in magnetic refriger-ation. A small percentage of Gadolinium added to a metallic alloy improves its workability andresistance to high temperature oxidation. Since Gadolinium has an exceptionally high neutroncapture cross section, it is used for shielding in neutron radiography and in nuclear reactors.Gadolinium has also fluorescent properties and is therefore used as scintillator material.
Natural Gadolinium contains 14.80% of 155Gd and 15.65% of 157Gd, the remainder are Gdisotopes without significant cross section for thermal neutrons. 155Gd has a capture crosssection for thermal neutrons of 60740.1 barns, whereas the capture cross section of 157Gdeven amounts to 252928 barns [1]. Despite the very large neutron capture cross section,Gd is not a popular converter due to the nature and the energy of the secondary particlesproduced after the neutron capture. In fact, Gadolinium releases prompt γs with an energy ofup to 9 MeV and conversion electrons with energies ranging from 29 keV to 250 keV.
Neutron detectors consisting of Gas electron multipliers (GEMs) [2] and natural Gd con-verters are the baseline detector technology for the Macromolecular Diffractometer (NMX) [3]instrument at ESS. Whereas macromolecular crystallography instruments at reactor sourcestypically use neutron image plates [4] with around 200 µm spatial resolution, spallation sourceinstruments require time resolution that the image plates lack altogether. Scintillation baseddetectors [5, 6] are currently limited to around 1 mm spatial resolution. For these instrumentssolid converters in combination with Micro Pattern Gaseous Detectors (MPGDs) [7] are apromising option, as they fill the gap of detectors with a position resolution below 1 mm andgood time resolution. A position resolution of better than 250 µm has been obtained with10B4C [8] and natural Gd converters [9].
GEM detectors with Gd cathode are usually used in backwards configuration, i.e. the neu-tron beam, impinging orthogonally to the detector, crosses the readout board and the GEMsbefore reaching the cathode (figure 4.1). In this way the conversion electrons do not needto traverse the entire gadolinium thickness in order to reach the active volume (the so-calleddrift space), which leads to a higher neutron detection efficiency. In forwards configurationthe neutron impinges directly on the cathode, and the majority of the conversion electronshave to transverse the converter. Since most of the neutrons interact in the first few hundrednanometres of the converter, a smaller percentage of the conversion electrons manages toreach the drift space of the detector. The detection efficiency in forwards configuration is thusalways lower than in backwards configuration. If a very thin Gd converter is used, a second
6
550 kΩ
500 kΩ
450 kΩ
1 MΩ
1 MΩ
1 MΩ
10 MΩ
2 mm
2 mm2 mm
……
10 MΩ
10 MΩ
10 mmconversion electron
neutron
HV1: 4000 V
HV2: 3300 VGd sheet (250 um)
Figure 4.1. Schematic representation of the detector used in backwards configuration.
mirrored detector that uses the same Gd cathode as the first detector can be added. In thisway the maximum number of conversion electrons reaches the active volume, but the resultingdetector is more complex and costly. All studies in the next chapter therefore assume only oneneutron detector with a cathode used in backwards configuration.
Technical Content
5.1 Properties of Gd converters
The converter simulations were carried out with Geant4 [11] version 10.1 using the high-precision neutron data G4NDL4.5.PUB, the gamma level data PhotonEvaporation3.1, theflag G4NEUTRONHP USE ONLY PHOTONEVAPORATION and NTP conditions 1. The wave-length of the neutrons in the simulation was set to 1.8 A. In all cases, sufficient statistics wereobtained in the simulation to ensure that the statistical uncertainty on the presented results issmall.
Figure 5.1 shows the simulated kinetic energy distribution of the conversion electrons afterthe neutron capture in a 250 µm thick natural Gd converter, and at the moment when they areleaving the converter. Since the conversion electrons loose energy in the Gd, the discreteenergy distribution present in the converter smears out and turns into a more continuousspectrum when the conversion electrons leave the converter. The mean kinetic energy ofthe conversion electrons escaping from the converter is 70 keV.
The conversion electron spectrum of natural Gd contains conversion electrons from the1Normal Temperature and Pressure is defined as a temperature of 293.15 K and a pressure of 1 atm.
7
neutron capture of 157Gd and 155Gd. The most intense conversion electrons emitted duringthe de-excitation of 158Gd∗ and 156Gd∗ come from internal conversion in the K,L and M shellsduring the two lowest E2 transitions to the ground state. The energy of a conversion electronis equal to the transition energy minus the binding energy of the shell. Therefore for 157Gd,the main conversion electron energies are 29 keV, 71 keV, 78 keV, 131 keV, 173 keV, 180 keVand 228 keV, whereas for 155 they are 39 keV,81 keV,88 keV,149 keV,191 keV,198 keV and 246keV [10].
Kinetic Energy [keV]0 50 100 150 200 250
Con
vers
ion
Ele
ctro
ns [%
]
0
2
4
6
8
10
12
14
16
18
(a) In Gd before interaction with converter
Kinetic Energy [keV]0 50 100 150 200 250
Con
vers
ion
Ele
ctro
ns [%
]
0
0.5
1
1.5
2
2.5
(b) Leaving converter (backwards configuration)
Figure 5.1. Kinetic energy of conversion electrons (bin size 1 keV) as simulated with Geant4.
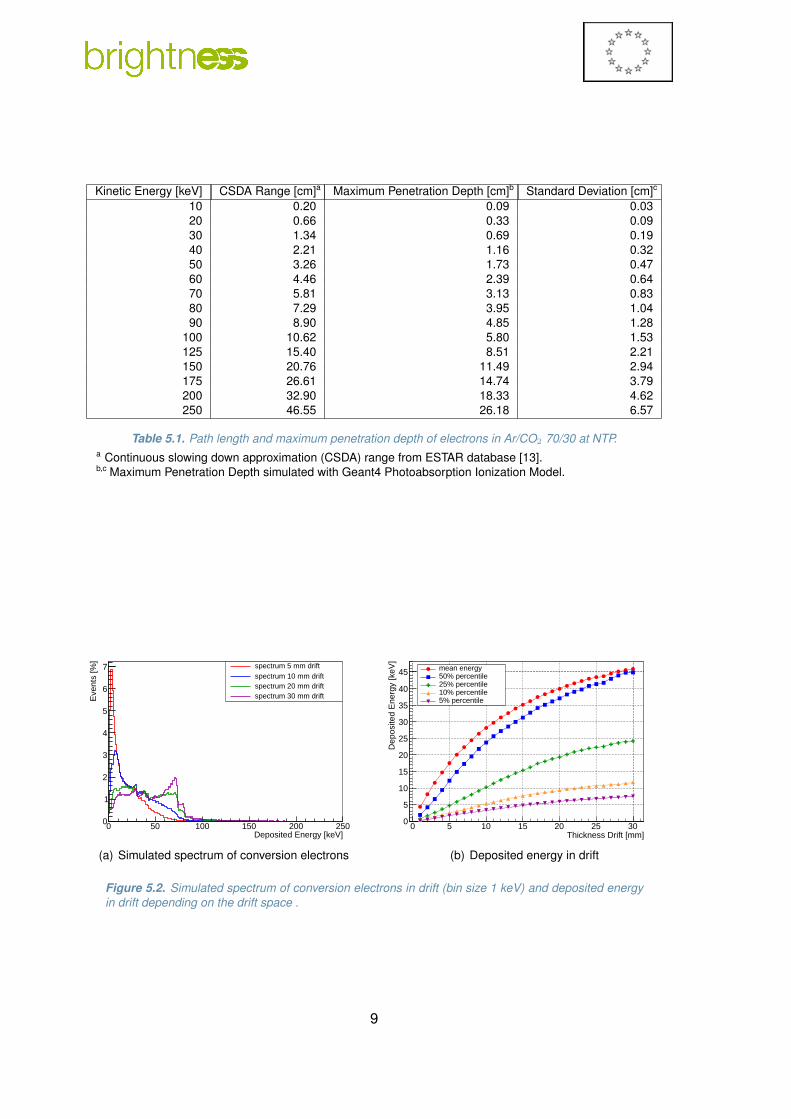
Table 5.1 shows the Continuous Slowing Down Approximation (CSDA) range and the max-imum penetration depth of electrons between 10 keV and 250 keV in Ar/CO2 70/30 at NormalTemperature and Pressure (NTP). Whereas the CSDA range is defined as the mean pathlength of a charged particle in an absorber, the maximum penetration depth is defined as thedepth in the absorbing medium beyond which no particles are observed to penetrate [12]. Inthe gaseous detector under study, the absorbing material is the 10 mm long drift volume filledwith Ar/CO2 70/30 (figure 4.1). The conversion electron track is fully contained in the driftspace if its maximum penetration depth is smaller than the drift length. Conversion electronsbetween 10 keV and 250 keV have a maximum penetration depth between 1 mm and 26 cm.Therefore, depending on the initial position and angle and the size of the drift volume, only afraction of the conversion electrons tracks will be fully contained in the detector.
Figure 5.2 confirms that the energy deposit of the conversion electrons highly dependson the size of the drift. To detect the 70 keV peak that dominates the spectrum in figure5.1(b) in the spectrum of the deposited energies, the drift space would have to be around30 mm long. For a 10 mm drift, only tracks of conversion electrons with an energy of up to30 keV will be fully contained. Figure 5.2(b) depicts the mean deposited energy and the 5%,10%, 25% and 50% percentiles depending on the drift size. For a 10 mm drift, Gd conversionelectrons on average deposit only 28 keV in the drift space by ionizing the Ar/CO2. The mostprobable energy deposition is 24 keV, and an energy threshold of 5 keV will cut away 10% ofthe conversion electron signal.
The deposited energy of the conversion electrons is thus small when compared to thesecondaries from 3He, 6Li, and 10B converters. Additionally, the Gd conversion electrons havealso on average a far larger range, and do not leave a straight ionization track. The long curvedtracks of the conversion electrons make it more difficult to determine the start of the track andthus the interaction point of the neutron with the converter. The µTPC data analysis technique,
8
Kinetic Energy [keV] CSDA Range [cm]a Maximum Penetration Depth [cm]b Standard Deviation [cm]c
Table 5.1. Path length and maximum penetration depth of electrons in Ar/CO2 70/30 at NTP.a Continuous slowing down approximation (CSDA) range from ESTAR database [13].b,c Maximum Penetration Depth simulated with Geant4 Photoabsorption Ionization Model.
Deposited Energy [keV]0 50 100 150 200 250
Eve
nts
[%]
0
1
2
3
4
5
6
7 spectrum 5 mm driftspectrum 10 mm driftspectrum 20 mm driftspectrum 30 mm drift
(a) Simulated spectrum of conversion electrons
Thickness Drift [mm]0 5 10 15 20 25 30
Dep
osite
d E
nerg
y [k
eV]
0
5
10
15
20
25
30
35
40
45 mean energy50% percentile25% percentile10% percentile5% percentile
(b) Deposited energy in drift
Figure 5.2. Simulated spectrum of conversion electrons in drift (bin size 1 keV) and deposited energyin drift depending on the drift space .
9
which is based on the principle of the Time Projection Chamber (TPC), has been developed toovercome this problem [9], and a position resolution of better than 250µm has been obtained.
The neutron capture probability for thermal neutrons depends on the thickness of the con-verter. Figure 5.3 shows the result of Geant4 simulations that compare the neutron captureprobability in natural Gd, 155Gd and 157Gd. Due to the huge neutron capture cross section, 8µm of 157Gd already capture more than 99 % of all thermal neutrons, whereas 30 µm of 155Gdor 40 µm of natural Gd are needed to capture the same percentage.
According to the simulations, 127 conversion electrons per 100 captured neutron are pro-duced in a 155Gd converter, and 52 conversion electrons per 100 captured neutron in a 157Gdconverter. Harms and McCormack [14] determined that 61.7 conversion electrons are pro-duced per 100 captured neutrons in 155Gd, and 59.56 in 157Gd. Hargrove et al. [15] on theother hand based on the gamma level schemes in the work of Backlin et al. [16] and Green-wood et al. [17], state a value of 79 for 155Gd, and 61 for 157Gd. Apparently the numbersobtained with Geant4 are much too large for 155Gd and too small for 157Gd. The simulatedneutron detection efficiency that depends on the number of conversion electrons per capturedneutron, is thus not correct for 155Gd and 157Gd. For natural Gadolinium though, 65.6 conver-sion electrons are created per 100 captured neutrons, which seems reasonable compared tothe values found in the literature. A number of 59.91 conversion electrons per 100 capturedneutrons can be found in the work of Harms and McCormack, whereas Hargrove et al. arriveat 66.
To calculate the neutron detection efficiency of the detector, it is not the number of con-version electrons per captured neutron that is relevant, but the probability that at least oneconversion electron is produced and reaches the drift. The simulated probability for the pro-duction of at least one conversion electron in a natural Gd converter amounts to 51.1%. Thisnumber is lower than the number of conversion electrons per 100 neutrons, because in somecases more than one conversion electron is produced during the neutron capture. Data on theconversion electron coincidence is difficult to obtain from literature.
converter thickness [um]1 10 210
prob
abili
ty [%
]
0
20
40
60
80
100
Gd neutron captured
Gd ce produced converter
Gd ce detected total
Gd ce detected backwards
Gd ce detected forwards
(a) natural Gd
converter thickness [um]1 10 210
prob
abili
ty [%
]
0
20
40
60
80
100
Gd neutron captured155
Gd ce produced converter155
Gd ce detected total155
Gd ce detected backwards155
Gd ce detected forwards155
(b) 155Gd
converter thickness [um]1 10 210
prob
abili
ty [%
]
0
20
40
60
80
100
Gd neutron captured157
Gd ce produced converter157
Gd ce detected total157
Gd ce detected backwards157
Gd ce detected forwards157
(c) 157Gd
Figure 5.3. Properties of natural Gd, 155Gd and 157Gd converters
Bruckner et al. calculated the detection efficiency for a 100% efficient Si detector with a Gdconverter of 25 µm thickness in backwards configuration [18]. For neutrons with 1.8 A wave-length, the calculated efficiency was around 11.6% for natural Gd, 18% for 155Gd and 23% for157Gd. According to Abdushukurov, the calculated detection efficiency amounts to 15.2% fornatural Gd and 31% for 157Gd [19]. Geant4 arrives at a detection efficiency of 13.9% for naturalGd, the values for 155Gd and 157Gd cannot be used as explained above. The simulated effi-
10
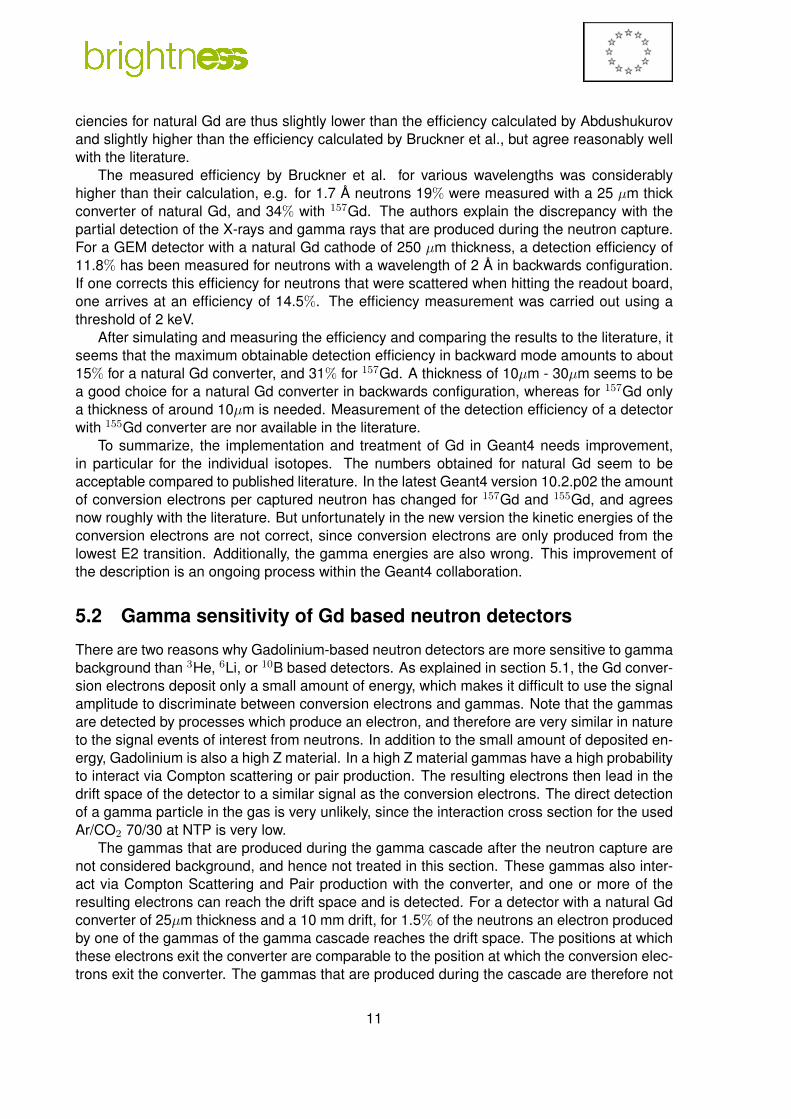
ciencies for natural Gd are thus slightly lower than the efficiency calculated by Abdushukurovand slightly higher than the efficiency calculated by Bruckner et al., but agree reasonably wellwith the literature.
The measured efficiency by Bruckner et al. for various wavelengths was considerablyhigher than their calculation, e.g. for 1.7 A neutrons 19% were measured with a 25 µm thickconverter of natural Gd, and 34% with 157Gd. The authors explain the discrepancy with thepartial detection of the X-rays and gamma rays that are produced during the neutron capture.For a GEM detector with a natural Gd cathode of 250 µm thickness, a detection efficiency of11.8% has been measured for neutrons with a wavelength of 2 A in backwards configuration.If one corrects this efficiency for neutrons that were scattered when hitting the readout board,one arrives at an efficiency of 14.5%. The efficiency measurement was carried out using athreshold of 2 keV.
After simulating and measuring the efficiency and comparing the results to the literature, itseems that the maximum obtainable detection efficiency in backward mode amounts to about15% for a natural Gd converter, and 31% for 157Gd. A thickness of 10µm - 30µm seems to bea good choice for a natural Gd converter in backwards configuration, whereas for 157Gd onlya thickness of around 10µm is needed. Measurement of the detection efficiency of a detectorwith 155Gd converter are nor available in the literature.
To summarize, the implementation and treatment of Gd in Geant4 needs improvement,in particular for the individual isotopes. The numbers obtained for natural Gd seem to beacceptable compared to published literature. In the latest Geant4 version 10.2.p02 the amountof conversion electrons per captured neutron has changed for 157Gd and 155Gd, and agreesnow roughly with the literature. But unfortunately in the new version the kinetic energies of theconversion electrons are not correct, since conversion electrons are only produced from thelowest E2 transition. Additionally, the gamma energies are also wrong. This improvement ofthe description is an ongoing process within the Geant4 collaboration.
5.2 Gamma sensitivity of Gd based neutron detectors
There are two reasons why Gadolinium-based neutron detectors are more sensitive to gammabackground than 3He, 6Li, or 10B based detectors. As explained in section 5.1, the Gd conver-sion electrons deposit only a small amount of energy, which makes it difficult to use the signalamplitude to discriminate between conversion electrons and gammas. Note that the gammasare detected by processes which produce an electron, and therefore are very similar in natureto the signal events of interest from neutrons. In addition to the small amount of deposited en-ergy, Gadolinium is also a high Z material. In a high Z material gammas have a high probabilityto interact via Compton scattering or pair production. The resulting electrons then lead in thedrift space of the detector to a similar signal as the conversion electrons. The direct detectionof a gamma particle in the gas is very unlikely, since the interaction cross section for the usedAr/CO2 70/30 at NTP is very low.
The gammas that are produced during the gamma cascade after the neutron capture arenot considered background, and hence not treated in this section. These gammas also inter-act via Compton Scattering and Pair production with the converter, and one or more of theresulting electrons can reach the drift space and is detected. For a detector with a natural Gdconverter of 25µm thickness and a 10 mm drift, for 1.5% of the neutrons an electron producedby one of the gammas of the gamma cascade reaches the drift space. The positions at whichthese electrons exit the converter are comparable to the position at which the conversion elec-trons exit the converter. The gammas that are produced during the cascade are therefore not
11
compromising the position resolution of the detector.Figure 5.4 shows the mean deposited energy of gamma particles of different energies that
impinge in the backwards direction on the converter. Figure 5.4(a) proves that the mean de-posited energy per gamma depends only weakly on the thickness of the converter. In general,the thinner the converter the smaller the mean deposited energy, but this effect is only ap-parent for gammas between 200 keV and 10 MeV. With a mean energy deposit of 23 keVto 27 keV, the mean energy deposition of the gammas between 50 keV and 300 keV is verysimilar to the mean energy deposited by the conversion electrons for the same drift thickness(5.2(b)). Figure 5.4(b) illustrates that the larger the drift space of the detector, the larger themean deposited energy of gammas with an energy of 40 keV or larger.
gamma energy [MeV]
2−10 1−10 1 10 210 310 410
mea
n de
posi
ted
ener
gy [k
eV]
0
5
10
15
20
25
backwards modeGd 6 um - 10 mm driftGd 10 um - 10 mm driftGd 25 um - 10 mm driftGd 50 um - 10 mm driftGd 250 um - 10 mm drift
(a) Varying converter thickness,10 mm drift length
gamma energy [MeV]
2−10 1−10 1 10 210 310 410
mea
n de
posi
ted
ener
gy [k
eV]
0
5
10
15
20
25
30
35 backwards modeGd 50 um - 5 mm driftGd 50 um - 10 mm driftGd 50 um - 15 mm driftGd 50 um - 20 mm drift
Figure 5.4. Mean deposited energy of gammas in backwards configuration depending on varyingconverter thickness and drift length.
In figures 5.5 and 5.6 the influence of different energy thresholds on the gamma detectionprobability is studied. Without an energy threshold, the gamma sensitivity lies between 10−3
and 10−2. The sensitivity of the detector is the highest for X-rays between 20 keV and 60keV and for fast gammas with energies over 5 MeV. Except for the X-rays between 20keV and60 keV, the gamma sensitivity is basically independent of the drift thickness. Subsequentlyfor each of the drift thicknesses, an energy threshold is applied that cuts away 5%, 10% and25% of the conversion electron signal. This threshold has been derived from the percentilesin figure 5.2(b). Figure 5.6(b) shows that only a high threshold that cuts away 25% of theconversion electron signal significantly reduces the gamma sensitivity to X-rays below 100keV, and to gammas above 1 GeV. Whereas without a threshold the sensitivity in this range is10−2, the 25% threshold reduces it to 5 · 10−3 for the X-rays and 10−3 for the fast gammas.Gammas with an energy between 1 MeV and 100 MeV are already considerably affected bythe 5% and 10% thresholds.
If possible, the gamma background at the NMX instruments should be reduced and adaptedto the sensitivity of the detectors. Especially X-rays under 100 keV should be avoided. Underthese conditions, a gamma threshold that reduces the conversion electron signal by 5% isrealistic. For the most common gamma energy range of 100 keV up to 10 MeV the resultinggamma sensitivity amounts to 2 · 10−3.
Measurements using a 5% threshold confirmed a gamma sensitivity of 2 · 10−3 for 511keV and 1274.5 keV gammas from a 511Na source, and a gamma sensitivity of 6 · 10−3 for59.5 keV gammas from a 241Am source. The results from measurements and simulations
12
gamma energy [MeV]
1−10 1 10 210 310 410
dete
ctio
n pr
obab
ility
4−10
3−10
2−10
backwards modeGd 50 um, 5 mm drift, 0 keVGd 50 um, 10 mm drift, 0 keVGd 50 um, 15 mm drift, 0 keVGd 50 um, 20 mm drift, 0 keV
(a) Without threshold
gamma energy [MeV]
1−10 1 10 210 310 410
dete
ctio
n pr
obab
ility
4−10
3−10
2−10
backwards modeGd 50 um, 5 mm drift, 2 keVGd 50 um, 10 mm drift, 3.5 keVGd 50 um, 15 mm drift, 5 keVGd 50 um, 20 mm drift, 6 keV
(b) 5 % energy threshold
Figure 5.5. Gamma detection probability for 50 µm converter thickness without a threshold and afterthe application of a threshold that cuts away 5% of the conversion electron detection efficiency.
suggest that Boron should be used as shielding material and material for the beam dump.The Boron neutron capture reaction produces with a probability of 94 % a 478 keV gamma.This is preferable to obtaining multiple high energy gammas (MeV range) from Cadmium orGadolinium shielding, since the gamma sensitivity to the 478 keV gamma is lower than thesensitivity to gammas in the MeV range.
gamma energy [MeV]
1−10 1 10 210 310 410
dete
ctio
n pr
obab
ility
4−10
3−10
2−10
backwards modeGd 50 um, 5 mm drift, 2.5 keVGd 50 um, 10 mm drift, 5 keVGd 50 um, 15 mm drift, 7.5 keVGd 50 um, 20 mm drift, 9.5 keV
(a) 10 % energy threshold
gamma energy [MeV]
1−10 1 10 210 310 410
dete
ctio
n pr
obab
ility
4−10
3−10
2−10
backwards modeGd 50 um, 5 mm drift, 5 keVGd 50 um, 10 mm drift, 10 keVGd 50 um, 15 mm drift, 15 keVGd 50 um, 20 mm drift, 19 keV
(b) 25 % energy threshold
Figure 5.6. Gamma detection probability for 50 µm converter thickness after the application of a thresh-old that cuts away 10% or 25% of the conversion electron detection efficiency.
5.3 Studies of enriched Gd converters
Natural Gadolinium powder, sputter targets and foils can be obtained from several suppliers.Enriched 157Gd and 155Gd on the other hand is difficult to obtain [20]. The initial detector forthe NMX instrument at ESS, Lund, Sweden, will be constructed using a natural Gadoliniumconverter. However, in view of a potential future performance upgrade of the detector duringthe operations phase, it is desirable to investigate the viability of an enriched Gadoliniumcathode.
13
CERN and ESS are in contact with the Swedish company Neonest AB [21] that offersenriched 157Gd as metallic powder. Enriched 155Gd is only available as oxide in powder form,and would have first to be converted to a metal. Therefore and due to the higher detectionefficiency attainable with 157Gd, the focus lies on enriched 157Gd. Isotope enriched materialsare strategic supplies. Whilst China is the main producer of rare-earth elements, it does notisotope enrich them. There are worldwide two historical producers of isotope enriched Gd:The US and Russia. In the US production has now ceased, but there is a remaining stockpileavailable for strategic use, and managed as part of the strategic isotope supply coordinated bythe US Department of Energy. There is little information on the size of the Russian stockpile,but the enriched Gd offered by Neonest AB originally comes from Russia. Prices are ca 5USD/mg for small quantities. As there is almost no demand for the isotope enriched material,this availability should remain into the near future.
To create a converter from the metallic 157Gd powder, the powder has to be melted andan ingot has to be produced. This ingot can then be rolled into a foil. Companies like Good-fellow [22] that roll Gadolinium foils usually start from large rectangular ingots. Due to thehigh price of the enriched Gd, the production of a large ingot is out of the budget scope forthis project. Presently a collaboration is ongoing with Goodfellow to test the melting of 5 g ofnatural Gd powder to produce an ingot. If the manufacturing of the ingot works, two ingots willbe produced to assess the risk of production with this valuable material. From one of thema 10 µm thick foil will be rolled, from the other one a 25µm thick foil. If the melting tests andthe rolling of the foils are successful, another experiment will determine the minimum amountof Gd powder necessary to produce a foil. Assuming only relatively small losses during theproduction process, the experiment will then be repeated with this amount of enriched Gdpowder from Neonest AB. The aim is to obtain a small enriched Gd cathode that can be usedto measure the achievable detection efficiency and to refine the simulation. Depending on theresults of these measurements, the use of enriched Gd converters will be considered as anupgrade option for the NMX detectors. The exact amount of material needed depends on thelosses during the fabrication process of the cathodes, but amounts in any case to at least 220g of enriched Gd.
5.4 Manufacturing of large Gd cathode
For the small 10 x 10 cm2 detector prototypes, the Gd cathodes were produced at CERN, aspart of its activities in BrightnESS WP4, by glueing a 10 x 10 cm2 Gd foil produced by Good-fellow to a frame. Goodfellow rolls Gd foils in the standard thicknesses of 10µm, 25µm, 50µm,100µm and 250µm. Taking into consideration the detection efficiency, gamma sensitivity androbustness of the detector design, the preferred converter thickness is 10µm or 25µm. Since itis not trivial to create a Gd coating of such a thickness, foil production methods are preferred.Foil production also offers a higher material efficiency than physical vapour deposition meth-ods, which first require the production of a sputter target. With regard to the elevated cost ofenriched Gd material, this is especially relevant for the production of enriched Gd cathodes.Thin coatings of Gadolinium also have the tendency to oxidize through. This process can bearrested by applying a capping layer of ZrN to the coating [24]. Oxidization studies of foils onthe other hand show that foils only oxidise at the surface. An oxidization layer of a few 100 nmthickness is quickly formed, subsequently the foils remain stable over decades.
The maximum available foil size in 10µm and 25µm thickness is 10 x 20 cm2. To producea 60 x 60 cm2 cathode, 18 pieces of 10 x 20 cm2 foils or 36 pieces of 10 x 10 cm2 foils haveto be joined. To achieve maximum mechanical stability and durability, the idea is to produce a
14
grid-like 60 x 60 cm2 Aluminium frame with 36 openings of 9.5 x 9.5 cm2. The 36 pieces of the10 x 10 cm2 Gd foils are then welded to the frame.
Ultrasonic welding tests were carried out at branches of Branson Ultrasonics in Genevaand Barcelona [23]. Ultrasonic welding of Gadolinium is novel and unstudied. Whereas 10µmthick Gd foils could not be welded without destroying the foil, figure 5.7(a) shows the success-ful welding of a 25µm thick Gd foil to a Al support. Attempts to weld Gd to Gd have not beensuccessful. Figure 5.7(b) shows the finished cathode. As next step measurements with thewelded cathode are foreseen to check whether the weld has an influence on detection effi-ciency and position resolution. Subsequently the welding of a larger size cathode composedof several quadratic foils in planned. The tests so far show that ultrasonic welding can createa build-able and durable 60 x 60 cm2 natural Gd cathode of a suitable thickness. This cathodemeets the requirements for the detector for the NMX instrument and is feasible and affordable.
(a) Ultrasonic welding (b) Welded Gd cathode
Figure 5.7. Ultrasonic welding of a Gd foil to an Aluminium frame.
15
Summary & Conclusion
The development of Gadolinium based GEM detectors for the NMX instrument at ESS, Lund,Sweden is funded by the European Union through the BrightnESS project. Simulations andfirst measurements demonstrate that the Gd-GEM will be able to successfully tackle the posi-tion resolution challenge. A position resolution of around 200µm is achievable. Large progresshas been made in the understanding of the properties of Gd converters, leading to the deter-mination of the appropriate converter and drift thickness. This constitutes the framework forthe final design of the converter. The GEANT4 simulation of the relevant properties of Gd isonly partially reliable, and needs tuning. Some experimental results are available to be usedfrom the literature. The gamma background will be higher than for a 10B or 3He based detector,but with around 10−3 depending on the incoming gamma energy still acceptable. This meetsthe detector requirements for the NMX instrument.
The strategic availability of enriched Gadolinium has been investigated, as a potential fu-ture upgrade of the detectors. Two potential suppliers have been identified, and 2 industrialcollaborations with Goodfellow and Neonest AB are ongoing to study the cost-efficient manu-facturing of enriched Gd converters.
Ultrasonic welding using a machine by Branson Ultrasonics has been identified as suitabletechnology to produce a 60 x 60 cm2 natural Gd cathode. Welding Gd is novel. A mechanicallyreliable and affordable cathode can be produced in this manner.
The complete work on Gd converters is presently being summarised for a future journalpublication on this topic.
16
Bibliography
[1] Evaluated Nuclear Data File (ENDF), https://www-nds.iaea.org/exfor/endf.htm.
[2] F. Sauli, GEM: A new concept for electron amplification in gas detectors, Nuclear Instru-ments and Methods in Physics Research A 386 (1997) 531-534.
[3] S. Peggs et al., ESS Technical Design Report, ESS-2013-0001 (2013).
[4] N. Niimura et al., An imaging plate neutron detector, Nuclear Instruments and Methods inPhysics Research A 349 (1994) 521-525.
[5] T. Hosoya et al., Development of a new detector and DAQ systems for iBIX, Nuclear In-struments and Methods in Physics Research A 600 (2009) 217-219.
[6] L. Coates et al., The macromolecular neutron diffractometer (MaNDi) at the SpallationNeutron Source, Oak Ridge: enhanced optics design, high-resolution neutron detectorsand simulated diffraction, Journal of Applied Crystallography 43 (2010) 570-577.
[7] M. Titov and L. Ropelewski, Micro-pattern gaseous detector technologies and RD51 col-laboration, Modern Physics Letters A 28 (2013) 1340022.
[8] D. Pfeiffer et al., The µTPC method: improving the position resolution of neutron detectorsbased on MPGDs, Journal of Instrumentation 10 (2015) P04004.
[9] D. Pfeiffer et al., First measurements with new high-resolution gadolinium-GEM neutrondetectors, Journal of Instrumentation 11 (2016) P05011.
[10] P. Kandlakunta and L.R. Cao and P. Mulligan, Measurement of internal conversion elec-trons from Gd neutron capture, Nuclear Instruments and Methods in Physics Research A705 (2013) 36–41.
[11] S. Agostinelli et al., GEANT4: A Simulation toolkit, Nuclear Instruments and Methods inPhysics Research A 506 (2003) 250-303.
[12] E. B.Podgorsak, Radiation Physics for Medical Physicists, Springer 2010, 261-262.
[13] Berger, M.J., Coursey, J.S., Zucker, M.A., and Chang, J. (2005), ESTAR, PSTAR, and AS-TAR: Computer Programs for Calculating Stopping-Power and Range Tables for Electrons,Protons, and Helium Ions (version 1.2.3). [Online] Available: http://physics.nist.gov/Star[2016, 1 12]. National Institute of Standards and Technology, Gaithersburg, MD.
[14] A.A. Harms and G. McCormack, Isotopic conversion in Gadolinium-exposure neutronimaging, Nuclear Instruments and Methods in Physics Research 118 (1974) 583-587.
[15] C.K. Hargrove et al., Use of Gd in gas counters as neutron detectors in SNO, NuclearInstruments and Methods in Physics Research A 357 (1995) 157-169.
[16] A. Backlin et al., Isotopic Conversion in Gadolinium-Exposure Neutron Imaging, NuclearPhysics A380 (1982) 189-260.
[17] R.C. Greenwood et al., Collective and two-quasiparticle states in 158Gd observedthrough study of radiative neutron capture in 157Gd, Nuclear Physics A304 (1978) 327-428.
[18] G. Bruckner et al., Position sensitive detection of thermal neutrons with solid state de-tectors (Gd Si planar detectors), Nuclear Instruments and Methods in Physics Research A424 (1999) 183-189.
[19] D.A. Abdushukurov, Mathematical Modeling of the Efficiency Gadolinium Based NeutronConverters, Applied Mathematics Vol. 4 No. 8A (2013) 27-33.
[20] Federal supply and demand of isotopes workshops,http://science.energy.gov/np/community-resources/workshops/2015-workshop-on-isotope-federal-supply-and-demand/.
[24] C. Hoglund et al., Growth and oxidization stability of cubic Zr1-xGdxN solid solution thinfilms, Journal of Applied Physics 117(19), (2015), 195301.