BRITISH MOBILE PHONE MARKET ANALYSIS 2015 Britain Today Number of fixed landlines in the UK(including ISDN channels) Number of UK residential fixed landlines Number of UK mobile subscriptions(including M2M) Number of 4G mobile subscriptions in UK Adults who personally own/use a mobile phone in the UK Adults who live in a mobile-only home END OF 2013 END OF 2014 GROWTH 33.3 million 33.2 million -1% END OF 2013 END OF 2014 GROWTH 25 million 25.5 million 2% END OF 2013 END OF 2014 GROWTH % GROWTH 88.4 million 89.9 million 1.7% 1.5 .million END 2013 END 2014 GROWTH 2.7 million 23.6 million 775% Q1 2013 Q1 2014 GROWTH 93% 93% 0% Q1 2014 Q1 2015 GROWTH 16% 15% -1%
Transcript
BRITISH MOBILE PHONE MARKET ANALYSIS 2015
Britain Today Number of fixed landlines in the UK(including ISDN channels)
Number of UK residential fixed landlines
Number of UK mobile subscriptions(including M2M)
Number of 4G mobile subscriptions in UK
Adults who personally own/use a mobile phone in the UK
Adults who live in a mobile-only home
END OF 2013 END OF 2014 GROWTH
33.3 million
33.2 million
-1%
END OF 2013 END OF 2014 GROWTH
25 million
25.5 million
2%
END OF 2013 END OF 2014 GROWTH % GROWTH
88.4 million
89.9 million
1.7%
1.5 .million
END 2013 END 2014 GROWTH
2.7 million
23.6 million
775%
Q1 2013 Q1 2014 GROWTH
93%
93%
0%
Q1 2014 Q1 2015 GROWTH
16%
15%
-1%
DEVICES MARKET The UK mobile industry finish 5 million mobile devices sale on 2014.
Smartphone unit sales dropped 20 per cent year-on-year[2014].
Tablet, which broke all records in previous quarters, slumped by 17 per cent.
Expected Tablets sales on 2017 is 50 Million.
Communication Devices penetration has now reached almost 80% in UK Devices owned & handset type – 2014
HAND SET TYPE
34%
66% Smartphone Feature phone
UK adults with a smart phone
UK Smartphone brand break up
Apple Samsung HTC Nokia Sony Black Berry Motorola LG Other Nbrands
Platform UK2014 UK 2013 UK change England Scotland Wales N Ireland
Fixed line
100% 100% 0 100% 100% 100% 100%
2G mobile1
99.7% 99.7% 0 99.8% 99.5% 98.9% 98.9%
3G mobile2
99.3% 99.2% 0.1 99.6% 97.1% 97.9% 98.6%
4G mobile3
89.5% 71.8% 17.7 92.1% 79.7% 62.8% 91.1%
Every day Device usage by age wise break up
16+ 16-24 25-34 35-44 45-54 55-64 65-74 75+
Smartphone ownership, by age wise: 2014-2015
2014 AV -59.6% 2015 AV 65.16% GROWTH 5.56%
16+ 16-24 25-34 35-54 55-64 65+
Brand of smartphone owned ….. Proportion of smartphone owners (%)
Apple Samsung Nokia Sony HTC
16+ 16 - 24 25 - 34 35 - 44 45 - 54 55+
59% 50% 40% 32% 30%
11% 3% 2%
90% 87% 88% +2% 84% +3% 80% 66% 72% +8% 61% +5%
50%
39% +11%
18%
14% +4%
51 50 41 39 34
33 34 27 32
23 22 26 8 9 11 9 9 11 8 8
6 7 7 5 5 5 4 4 6 4
Activities on a smartphone in an average day, by age
65+ 16 - 24 16+
0% 20% 40% 60% 80% 100%
Communications activities Games
Reading / browsing activities Watching activities
Listening activities
Device most often used to take photos Mobile Phone
16+ 16 – 50 50+
Smartphones across the UK 1Q 2015 & Growth % compared to 1Q 2014
UK England Scotland Wales Ireland
72%
19%
7%
2%
74%
13%
7%
4%
2%
72%
14%
7%
5%
89%
60%
14%
5% 6% 1% 6% 8%
66%
67%
63%
63%
63%
September 2014September 2014September 2012September 2012September 2012 September 2013September 2013
Tablet across the UK 1Q 2015 & Growth % compared to 1Q 2014
UK England Scotland Wales Ireland
Future UK Economic Optimism uk
Improve Stay the same Get worse Don’t know
UK Socio-economic group
10% 10% 10% 15% 9%
54%
54%
52%
60%
54%
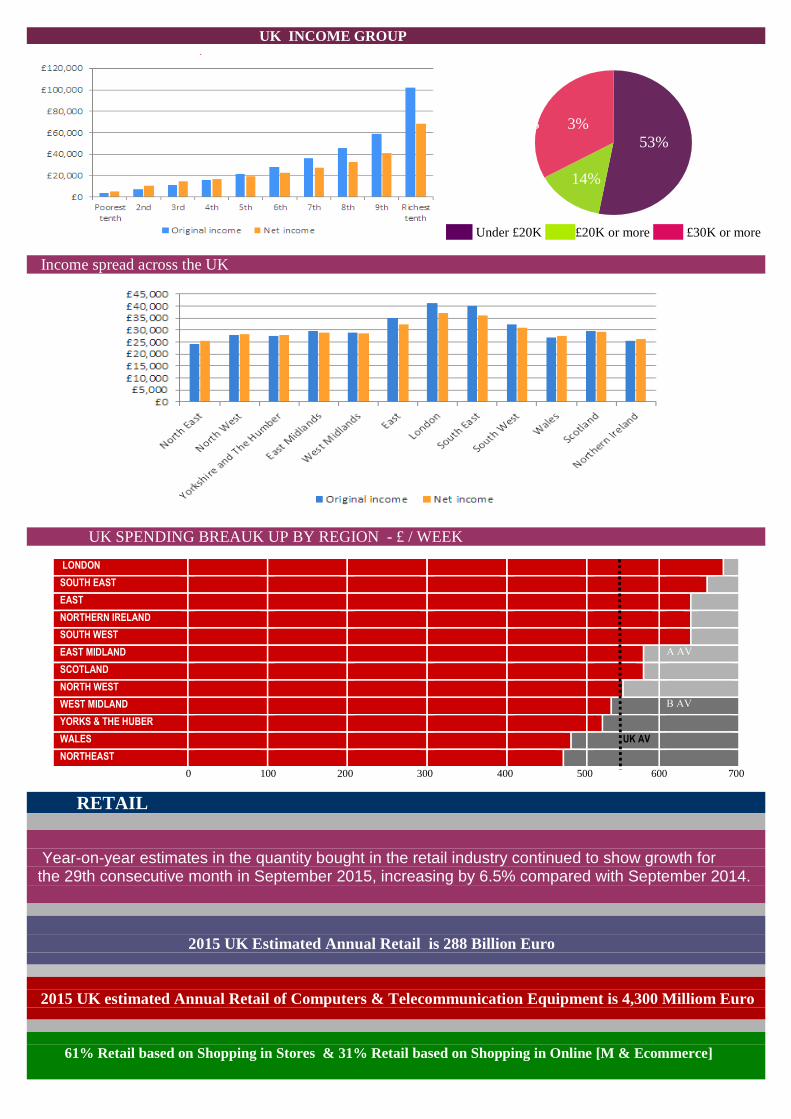
UK INCOME GROUP
3 3%
53%
14%
Under £20K £20K or more £30K or more
Income spread across the UK
UK SPENDING BREAUK UP BY REGION - £ / WEEK
0 100 200 300 400 500 600 700
RETAIL
Year-on-year estimates in the quantity bought in the retail industry continued to show growth for the 29th consecutive month in September 2015, increasing by 6.5% compared with September 2014.
2015 UK Estimated Annual Retail is 288 Billion Euro
2015 UK estimated Annual Retail of Computers & Telecommunication Equipment is 4,300 Milliom Euro
61% Retail based on Shopping in Stores & 31% Retail based on Shopping in Online [M & Ecommerce]
LONDON
SOUTH EAST
EAST
NORTHERN IRELAND
SOUTH WEST
EAST MIDLAND A AV
SCOTLAND
NORTH WEST
WEST MIDLAND B AV
YORKS & THE HUBER
WALES UK AV
NORTHEAST
RETAIL IN UK 2014-2015
Retail sales values break up - Sep 2015 and Sep 2014 Average annual sales regional break up
UK Current Average Computers & Telecommunication Equipments Retail Sale / YEAR - £4,295m UK Index Point of sales per week and percentage change
UK MOBILE & TABLET SALES AND SALES FORECAST- 2015 – 2016 - 2017
UK RETAIL LANDSCAPE 2015
CHANNEL BREAK UP HOME WARE-AVG. SALES BY REGION / Y