28
www.pwc.com/ca British Columbia’s Forest Industry and the B.C. Economy in 2016 September 2017
www.pwc.com/ca
British Columbia’s Forest Industry and the B.C. Economy in 2016
September 2017
PwC i
Table of Contents
1. Executive Summary 2
2. Approach 5
2.1. Background and Study Objectives 5
2.2. Scope of Review 5
2.3. Methodology 5
2.4. Limitations 7
3. B.C. Forest Industry Overview 8
3.1. Description of the Industry 8
3.2. Key Sectors of the Industry 8
3.3. Largest B.C. Forest Companies 10
4. Economic Indicators 11
4.1. Benefits of Operating Activities 11
4.2. Government Revenues 11
4.3. Employment 12
4.4. Capital investment 15
4.5. Export and Trade 16
5. Other Important Contributions of British Columbia’s Forest Industry 19
5.1. Transportation 19
5.2. Community Investment 19
5.3. Sustainability 20
5.4. Innovation 21
5.5. Value Added Sector 22
Appendix A: Assumptions 24
Appendix B: Sources Used 25
Appendix C: Companies participating in the Survey 27
This publication has been prepared for general guidance on matters of interest only, and does not constitute professional advice. You should not act upon the information contained in this publication without obtaining specific professional advice. No representation or warranty (express or implied) is given as to the accuracy or completeness of the information contained in this publication, and, to the extent permitted by law, PricewaterhouseCoopers LLP, its members, employees and agents do not accept or assume any liability, responsibility or duty of care for any consequences of you or anyone else acting, or refraining to act, in reliance on the information contained in this publication or for any decision based on it.
PwC 2
1. Executive Summary This Report (the “Report”) presents the results of an economic impact Study (the “Study”) of the British Columbia Forest Industry (the “B.C. Forest Industry”) for calendar 2016. For purposes of this Report, the B.C. Forest
Industry includes both the coast and interior regions, and is defined to include the following three industry
subsectors:
- Forestry and Logging
- Wood Product Manufacturing
- Paper Manufacturing
PwC was retained by the member companies of the BC Council of Forest Industries, BC Lumber Trade Council,
Coast Forest Products Association and Interior Lumber Manufacturers’ Association (“the Associations”) to conduct
the Study to identify the economic impacts of the B.C. Forest Industry to the province in 2016 and prepare this
Report on our findings. The Associations represent the majority of the B.C. Forest Industry, including forestry and
logging; lumber; veneer, plywood and engineered and other wood products; and pulp and paper. Specifically, this
Study assesses the economic impact of the B.C. Forest Industry’s ongoing operations, employment and capital
spending in the province.
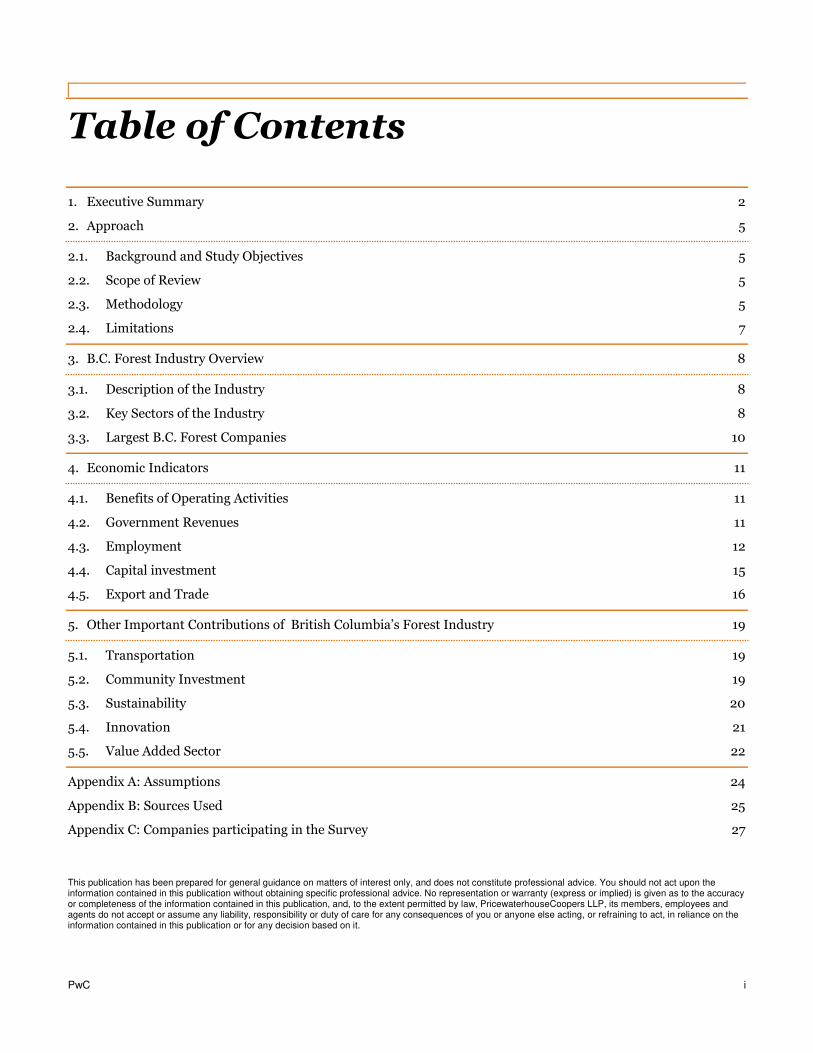
The following four steps summarize our Study methodology:
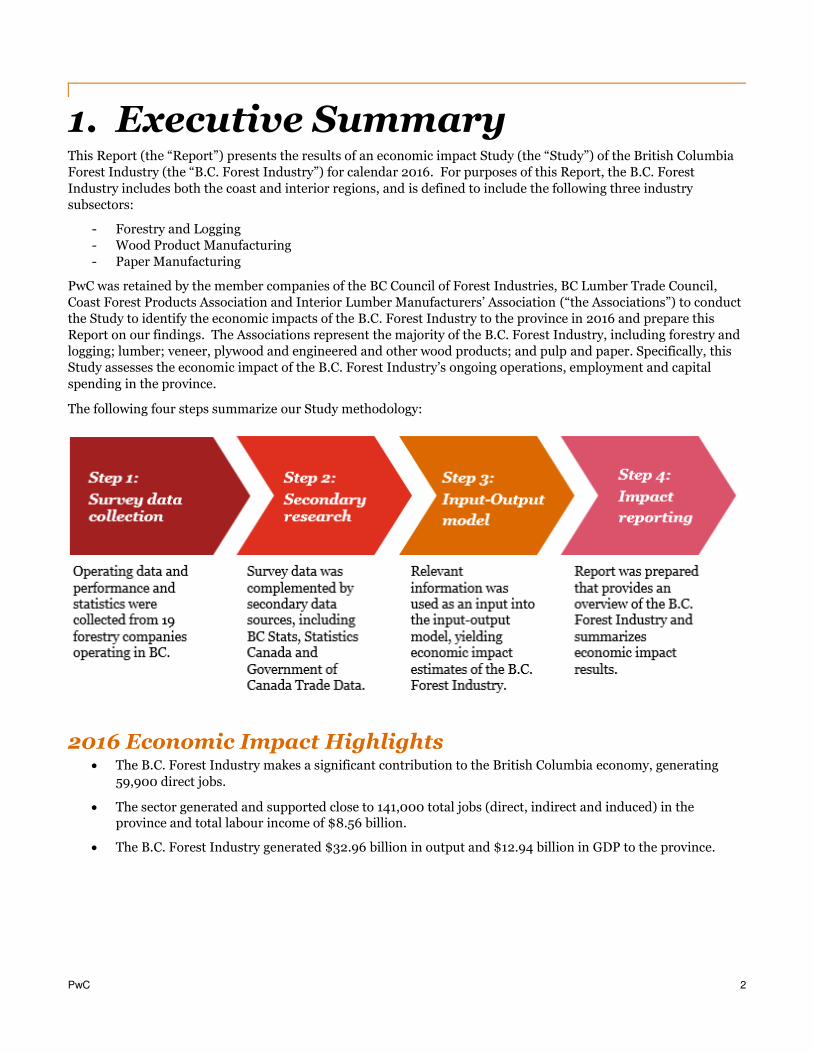
2016 Economic Impact Highlights The B.C. Forest Industry makes a significant contribution to the British Columbia economy, generating
59,900 direct jobs.
The sector generated and supported close to 141,000 total jobs (direct, indirect and induced) in the province and total labour income of $8.56 billion.
The B.C. Forest Industry generated $32.96 billion in output and $12.94 billion in GDP to the province.
PwC 3
Figure 11: B.C. Forest Industry Economic Highlights
The payments of municipal, provincial and federal taxes resulting from the industry’s operating activities, as well as other payments to the provincial government, totalled $4.12 billion.
1 Note that numbers throughout the Report may not add up due to rounding.
41,471
39,357
59,900
140,728 Jobs
$3.75bn
$3.87bn
$5.32bn
$12.94bn GDP
$7.43bn
$6.86bn
$18.68bn
$32.96bn Output
$2.42bn
$1.94bn
$4.20bn
$8.56bn Labour Income

PwC 4
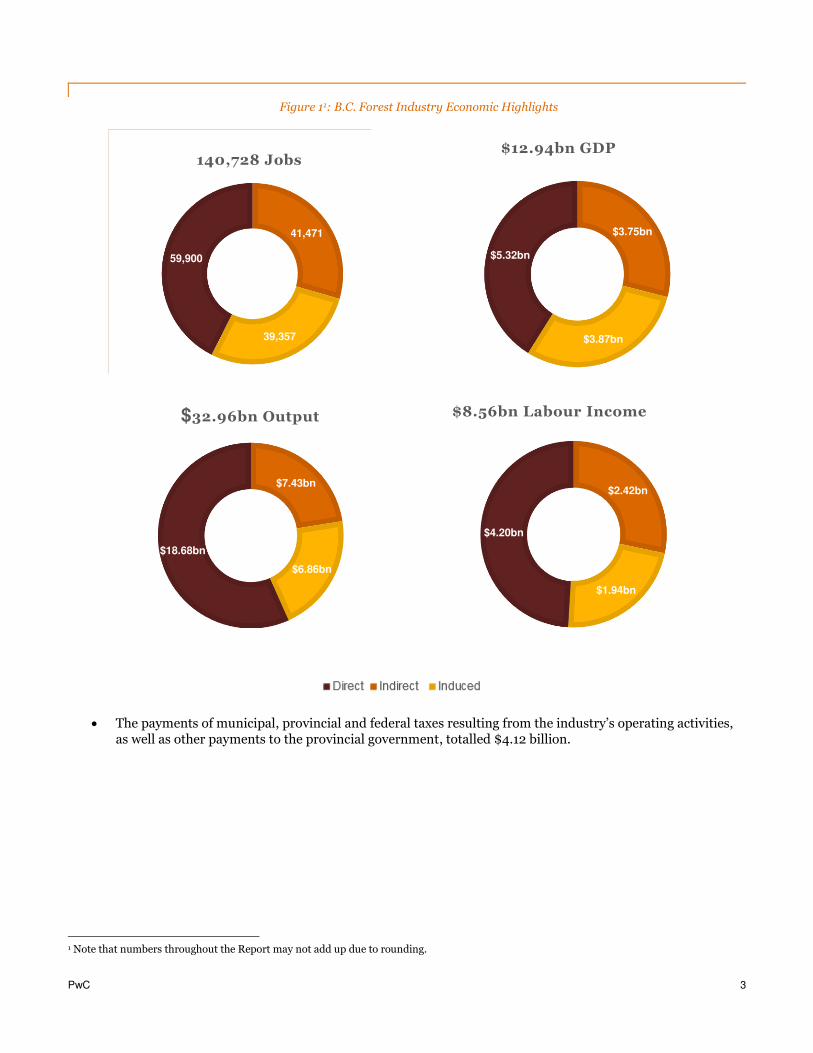
Figure 2: B.C. Forest Industry’s Contributions to Government Revenues
1 in 17 jobs in the province was created due to the B.C. Forest Industry’s operating activities. In addition, 1 in 4 of provincial manufacturing jobs came from the manufacturing sectors of the B.C. Forest Industry.
$1.36bn
$2.56bn
$0.20bn
$4.12bn Government Revenue
Federal Provincial Municipal

PwC 5
2. Approach 2.1. Background and Study Objectives This Report (the “Report”) presents the results of an economic study (the “Study”) of the British Columbia Forest Industry (the “B.C. Forest Industry”). The B.C. Forest Industry includes the following three industry subsectors
and the Report provides a summary of the industry’s contributions to the economy in 2016:
- Forestry, Logging and Support (NAICS 11N)
- Wood Product Manufacturing (NAICS 321)
- Paper Manufacturing (NAICS 322)
PwC was retained by the member companies of the BC Council of Forest Industries, BC Lumber Trade Council,
Coast Forest Products Association and Interior Lumber Manufacturers’ Association (“the Associations”) to conduct the Study to identify the benefits of the economic impacts of the B.C. Forest Industry to the province in 2016 and
prepare this Report on our findings. The Associations represent the majority of the B.C. Forest Industry, including
forestry and logging; lumber; veneer, plywood and engineered and other wood products; and pulp and paper.
Specifically, this Study assesses the economic impact of the B.C. Forest Industry’s ongoing operations and capital spending in the province, and outlines various other features benefitting the province.
We understand that this report will be used by Associations for the purpose of assessing the economic contribution
that the B.C. Forest Industry facilitates in the province, as well as revenues to federal, provincial and municipal
governments. We further realize that the report will be used by the Associations for public education and informing
the policymaking process in Canada and B.C.
Unless otherwise noted, all dollar amounts in this report are expressed in Canadian currency.
2.2. Scope of Review This Study was prepared using:
information provided by the Associations,
discussions with the Associations’ staff,
the results of a Survey (“the Survey”) sent to forest companies operating in B.C., of which 19 responded,
and
PwC research.
A complete list of the documents and sources we have reviewed is listed in Appendix B.
2.3. Methodology The fundamental philosophy behind economic impact analysis is that spending on goods and services has attendant impacts throughout the economy. For instance, wood product manufacturing will generate demand for the inputs to this process (such as tools and labour) that in turn generates additional demand that extends beyond the initial spending. Our analysis permits the estimation of this cascading effect by using the multipliers calculated based on Statistics Canada’s input-output table of the B.C. economy.
The input-output model used for the purpose of this report estimates the relationship between a particular economic activity for a given good or service and the resulting impacts throughout the economy (including demand for other goods and services and tax revenues).
For the purpose of this report economic factors were estimated for the following measures of economic activity:
PwC 6
Output – the total gross value of goods and services produced, measured by the price paid to the producer.2 Output double counts the value of intermediate inputs and so GDP is usually a preferable measure of economic activity.3
Value added or GDP – the value added to the economy, or the output valued at basic prices less intermediate consumption4 valued at purchasers’ prices. GDP includes only final goods to avoid double counting of products sold during a certain accounting period.
Employment – the number of jobs created or supported.
Taxes on Production and Products – the amount of tax revenues generated from taxes on products (e.g., trading profits, gas tax, sales taxes, and excise taxes) and taxes on production at the federal, provincial and municipal levels (e.g., property taxes).
Personal Income Tax – the amount of provincial tax revenues generated from taxes on the income of employees and self-employed individuals.
Corporate Income Tax – the amount of provincial tax revenues generated from taxes on the profits of corporations.
Economic impacts are typically estimated at the direct, indirect and induced levels:
Direct impacts result from company’s spending on suppliers and employees.
Indirect impacts arise from the activities of the firms providing inputs to company’s suppliers (in other words, the suppliers of its suppliers).
Induced impacts are the result of consumer spending by employees of the businesses stimulated by direct and indirect expenditures.
The total economic impact equals the sum of the direct, indirect, and induced economic impacts.
We have used the results of the Survey5 completed by participating B.C. Forest Industry companies in conjunction with secondary data sources to estimate revenues and employment breakdown of each of the following segments of the B.C. Forest Industry: forestry and logging; lumber; veneer, plywood and engineered and other wood products; and pulp and paper. The Survey represents responses from 19 companies across the coast and interior regions, as listed in Appendix C. According to BC Stats, the aggregate direct employment of the B.C. Forest Industry in 2016 was 59,9006 and we have estimated the industry’s revenues (or output) to be $18,680 million7. Both the direct employment and revenue were estimated using external sources, while the sectoral breakdown was estimated based on employment breakdown reported in the Survey. For the purpose of this report, we have assumed that the employment breakdown reported in the Survey approximates that of the industry. Revenues and employment were then used as inputs to the input-output model to produce economic impact estimates.
When performing the economic impact analysis for the forest industry, we avoided double counting, which can
occur if we simply sum the direct, indirect and induced impacts of each of the sectors without adjusting for the
linkages between these sectors. For example, the outputs of certain forest industry sectors, such as lumber, are used
as inputs in other sectors, such as pulp and paper. Thus, simply adding the outputs of these two sectors will result
an overestimate of the total output. Economic impact estimates included in this report fully address the
aforementioned issue.
2 Note that for imported goods and services, only the margins realised above and beyond the initial payment to the foreign supplier have an effect on the Canadian economy. 3 For example, when a consumer purchases a car, the value of the car is added to GDP, but the measure “Output” would include the value of the car, as well as the value of items that were purchased by the car manufacturer from other suppliers such as tires, steering wheel, and engine (i.e., intermediate inputs), thus double-counting these values. 4 Defined as the value of goods and services used or transformed as inputs by a process of production. 5 Survey respondents represent 41% of employment and 45% of sales of the entire industry. Survey respondents include major forest companies based in B.C. 6 Based on B.C. Stats, 2017. Sectors that constitute the forest industry are Forestry and Logging with support activities; Wood Product Manufacturing; Paper Manufacturing 7 Statistics Canada CANSIM 379-0030 in conjunction with own calculations. The same sectors were used as above.
PwC 7
2.4. Limitations Data limitations: PwC has relied on the information provided by participating B.C. companies regarding the operating and capital expenses of companies’ business operations in B.C. PwC has relied upon the completeness, accuracy, and fair presentation of all information and data obtained from participating B.C. companies and the various data sources set out in Appendix B, which were not audited or otherwise verified. The findings in this report are conditional upon such completeness, accuracy, and fair presentation, which have not been verified independently by PwC. Accordingly, we provide no opinion, attestation or other form of assurance with respect to the results of this study.
Where the information or data provided is not sufficient to conduct the analysis that has been requested, we have made assumptions, as set out in Appendix A.
Receipt of new data or facts: PwC reserves the right at its discretion to withdraw or make revisions to this report should we receive additional data or be made aware of facts existing at the date of the report that were not known to us when we prepared this report. The findings are as of August 2017 and exclude any subsequent significant events (e.g., impact of wildfires). PwC is under no obligation to advise any person of any change or matter brought to its attention after such date, which would affect our findings.
Input-output analysis: Input-output analysis (a model used to estimate economic impacts) does not address whether the inputs have been used in the most productive manner or whether the use of these inputs in this industry promotes economic growth by more than their use in another industry or economic activity. Nor does input-output analysis evaluate whether these inputs might be employed elsewhere in the economy if they were not employed in this industry at the time of the analysis. Input-output analysis calculates the direct, indirect and induced economic impacts that can reasonably be expected to affect the economy based on historical relationships within the economy. This analysis does not take into account fundamental shifts in the relationships within the economy that may have taken place since the estimation of multipliers by Statistics Canada, nor shifts that may take place in the future.
Use limitations: This report has been prepared solely for the use and benefit of, and pursuant to a client relationship exclusively with the Associations. We understand that the Associations intend to make our report publicly available upon its submission. The Associations can release this report only in its entirety and any commentary or interpretation in relation to this report that the Associations intends to release to the public either requires PwC’s written consent or has to be clearly identified as the Associations’ own interpretation of the report. PwC accepts no duty of care, obligation or liability, if any, suffered by the Associations or any third party as a result of an interpretation made by the Associations of this report.
Further, no other person or entity shall place any reliance upon the accuracy or completeness of the statements made herein. In no event shall PwC have any liability for damages, costs or losses suffered by reason of any reliance upon the contents of this report by any person other than the Associations.
This report and related analysis must be considered as a whole: Selecting only portions of the analysis or the factors considered by us, without considering all factors and analysis together, could create a misleading view of our findings. The preparation of our analysis is a complex process and is not necessarily susceptible to partial analysis or summary description. Any attempt to do so could lead to undue emphasis on any particular factor or analysis.
PwC 8
3. B.C. Forest Industry Overview 3.1. Description of the Industry The B.C. Forest Industry is a cornerstone of the provincial economy, generating an estimated $12.9 billion contribution to the total provincial GDP. The B.C. Forest Industry exported $13.7 billion worth of forest products in 2016, accounting for 34% of all provincial exports. For purposes of this Report, the B.C. Forest Industry is defined as the Forestry and Logging, Wood Product Manufacturing and Paper Manufacturing sectors, and includes such products as lumber, engineered wood, panels, veneers, wood pulp, and paper, amongst others. Additional sectors within the industry, such as the value added sector, are not included in the above definition due to difficulties in obtaining accurate measurements for their contribution to the economy; this is further detailed in section 5.5.
The forestry industry supports employment and economic opportunities close to 141,000 total jobs, produces significant government revenue and has developed partnerships with First Nations Communities. The B.C. Forest Industry is highly integrated with the rest of the provincial economy. The Ministry of Forests, Lands and Natural Resource Operations (“FLNRO”) has determined that there are 140 communities in B.C. that rely on the forest industry and are considered forest dependent, i.e., they are communities with mills, community forests, or significant logging operations8.
B.C. has significant forest resources, with roughly 60% of B.C.’s land base (55 million hectares) being productive forest land, providing rich, diverse, and abundant wood fibre.9 These forests contain approximately 11 billion cubic meters of standing timber. The majority of the land is publicly owned; the provincial government issues land tenures, giving companies the right to harvest in exchange for fees and management responsibilities. Approximately 20% of the provincial Crown allowable annual cut is managed through B.C. Timber Sales, which auctions timber harvested from public land in B.C. The mandate of BCTS is to provide price and cost benchmark data for the Market Pricing System through auctions of timber harvested from public land in British Columbia.10
The B.C. Forestry Industry operates in the coast and interior regions of the province. The five softwood species that grow in the coastal region are Western hemlock, Douglas fir, Western red cedar, Yellow cedar and Sitka spruce. Due to the high costs of accessing fibre in the coast region, the industry focuses on maximizing the value from the forest by producing high quality products. Interior region mills are generally wood processing plants able to use the entirety of a harvested tree in producing lumber in a variety of grades and sizes, pulp and paper, panels and other wood products (e.g., pellets). Predominant tree species in the area include softwood varieties such as spruce, pine, and fir (SPF).
The interior forest region has managed two decades of mountain pine beetle epidemics. According to Natural Resources Canada, the mountain pine beetle epidemics in B.C. started in the 1990’s and peaked in 2005. During these epidemics, over 18 million hectares of forest were impacted, resulting in a loss of approximately 723 million cubic meters (53%) of merchantable pine volume through 2012. It is estimated by 2017, the total projected affected merchantable pine volume will be 752 million cubic meters (58%). The annual allowable cuts are now being reduced as the majority of the beetle damaged timber has been salvaged.
3.2. Key Sectors of the Industry The B.C. forest industry is highly integrated and strives to utilize 100% of the harvested log. These logs may be manufactured to make a number of products including: high quality lumber, structural grade lumber; residual wood chips for pulp, paper and panels; sawdust, shavings and bark for biofuel, electricity and wood pellets; and engineered wood and solid wood products - to name just a few. Key sectors of the industry can be categorized as follows:
8 Ministry of Forests, Lands and Natural Resource, December 2016 9 Trade and Invest British Columbia, 2017 10 https://for.gov.bc.ca/bcts/
PwC 9
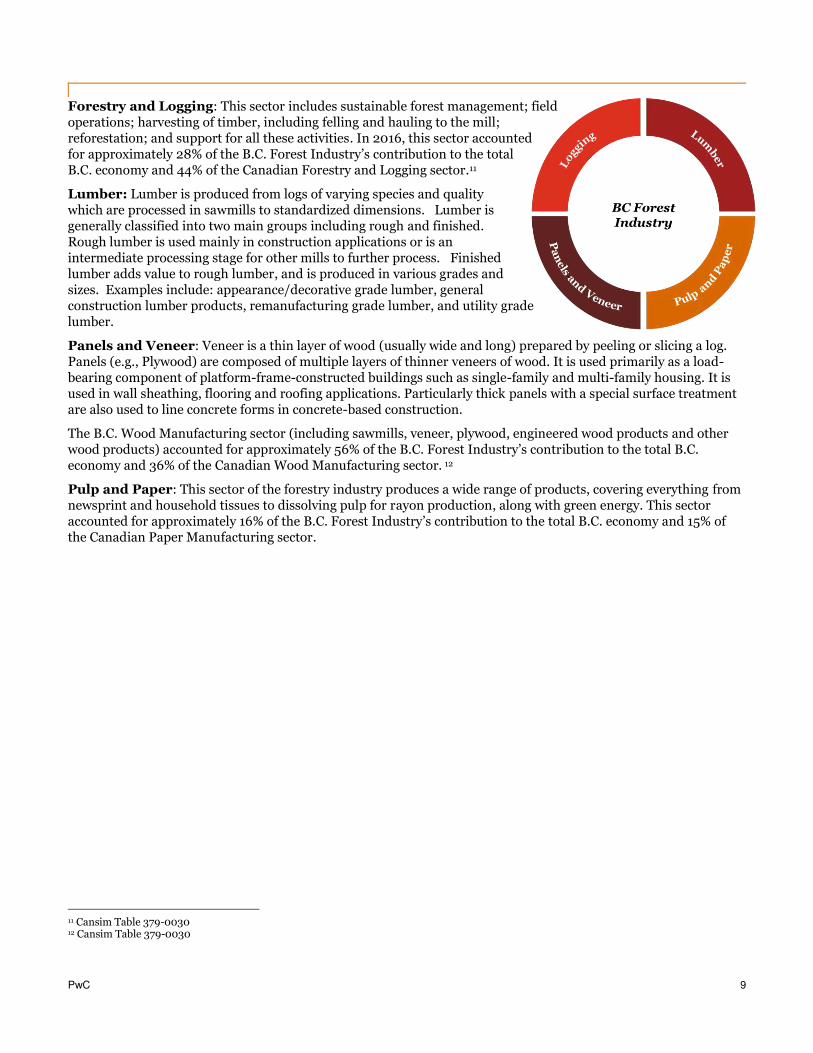
Forestry and Logging: This sector includes sustainable forest management; field operations; harvesting of timber, including felling and hauling to the mill; reforestation; and support for all these activities. In 2016, this sector accounted for approximately 28% of the B.C. Forest Industry’s contribution to the total B.C. economy and 44% of the Canadian Forestry and Logging sector.11
Lumber: Lumber is produced from logs of varying species and quality which are processed in sawmills to standardized dimensions. Lumber is generally classified into two main groups including rough and finished. Rough lumber is used mainly in construction applications or is an intermediate processing stage for other mills to further process. Finished lumber adds value to rough lumber, and is produced in various grades and sizes. Examples include: appearance/decorative grade lumber, general construction lumber products, remanufacturing grade lumber, and utility grade lumber.
Panels and Veneer: Veneer is a thin layer of wood (usually wide and long) prepared by peeling or slicing a log. Panels (e.g., Plywood) are composed of multiple layers of thinner veneers of wood. It is used primarily as a load-bearing component of platform-frame-constructed buildings such as single-family and multi-family housing. It is used in wall sheathing, flooring and roofing applications. Particularly thick panels with a special surface treatment are also used to line concrete forms in concrete-based construction.
The B.C. Wood Manufacturing sector (including sawmills, veneer, plywood, engineered wood products and other wood products) accounted for approximately 56% of the B.C. Forest Industry’s contribution to the total B.C. economy and 36% of the Canadian Wood Manufacturing sector. 12
Pulp and Paper: This sector of the forestry industry produces a wide range of products, covering everything from newsprint and household tissues to dissolving pulp for rayon production, along with green energy. This sector accounted for approximately 16% of the B.C. Forest Industry’s contribution to the total B.C. economy and 15% of the Canadian Paper Manufacturing sector.
11 Cansim Table 379-0030 12 Cansim Table 379-0030

PwC 10
3.3. Largest B.C. Forest Companies Table 1 lists the 15 B.C forest companies employing over 300 employees in 2016.13 The five largest alone directly employ over 13,000 workers. These companies offer a wide array of products and services, ranging from sustainable forest management to lumber to panels to pulp and paper.
Table 1: Largest B.C. Forest Companies by Employment, 2016.
Company B.C. Head
Office B.C. Staff
Canfor Vancouver 4,053
West Fraser Vancouver 3,000
Tolko Industries Vernon 2,602
Western Forest Products Vancouver 2,058
Catalyst Paper Richmond 1,546
Interfor Vancouver 1,162
Paper Excellence Group Richmond 1,120
Teal-Jones Group Surrey 970
Conifex Timber Vancouver 560
PRT Growing Services Victoria 445
Zellstoff Celgar Castlegar 420
Weyerhaeuser Vancouver 405
Richmond Plywood Richmond 381
Domtar Kamloops 330
Daishowa-Marubeni International Vancouver 320
Of the 15 largest B.C.-based forest companies listed above, six (West Fraser, Canfor, Catalyst Paper, Interfor, Western Forest Products and Conifex Timber) were ranked among the 50 largest public companies in the province based on revenue.14 These six companies are domiciled in B.C. and were among the top 100 global forest companies, also based on revenue.15 B.C. based head or regional offices provide head office and corporate jobs in addition to operating and community based jobs, meaning they engage professional services firms such as law firms, accounting firms, and others.
13 Source – Business in Vancouver. 14 https://www.biv.com/datatables/top-100-public-companies-in-bc-in-2016/ 15 https://www.pwc.com/gx/en/industries/assets/pwc-annual-fpp-industry-survey-2016-10.pdf

PwC 11
4. Economic Indicators To assess the economic contribution of B.C. Forest Industry operations in 2016, we have calculated the value to the B.C. economy generated and facilitated by its operating activities. The result of our analysis is a measure of widely considered economic variables and the total contribution to each variable of the industry’s activities. We note that the economic impacts measured are limited to the economy of British Columbia and they do not include economic impacts on other provinces that may be benefiting from such activity in British Columbia.
4.1. Benefits of Operating Activities Using the input-output model, we estimated the total annual economic footprint (i.e., including direct, indirect and induced impacts) generated and facilitated by the B.C. Forest Industry’s 2016 operational spending and employment. Through its direct, indirect and induced impacts, the B.C. Forest Industry generated and facilitated 141,000 total jobs, $12.94 billion of GDP and $32.96 billion of output to the B.C. economy in 2016, as shown below:
Table 2: Economic Benefits of B.C. Forest Industry’s Operating Activities, 2016 ($ millions, except as noted)
Total Operating Activities Direct Indirect Induced Total
Output 18,680 7,425 6,856 32,961
GDP 5,316 3,754 3,874 12,944
Jobs 59,900 41,471 39,357 140,728
Labour Income 4,197 2,417 1,941 8,555
The value of operating activities described above provide benefits province-wide. In many cases the forestry facilities and logging activities are the key drivers of business activity in the rural communities. In addition to the forestry facilities, many of the local communities benefit by providing services to the forestry activities. BC Stats estimates for many towns outside the Lower Mainland forestry activities is one of the main employers by sector (e.g., Forest Districts Campbell River 16%, 100 Mile House 26% and Quesnel 48%)16.
4.2. Government Revenues The B.C. Forest Industry is a significant contributor to government revenues, through production taxes,17 corporate income taxes and other regulatory contributions. We estimate a total contribution to the provincial government of $2.56 billion, including $1.12 billion in provincial taxes; $747 million in stumpage; $86 million in annual rent, logging tax, and fee in lieu of manufacture; and $607 million payments to B.C. Hydro. Furthermore, the industry paid a total of $1.36 billion in federal taxes and $198 million in taxes to municipal governments.
16 2006 Economic Dependency Tables for Forest Districts – February 2009 – BC Stats 17 Production taxes per Statistics Canada are taxes payable on goods and services when they are produced, delivered, sold, transferred or
otherwise disposed by their producers.
PwC 12
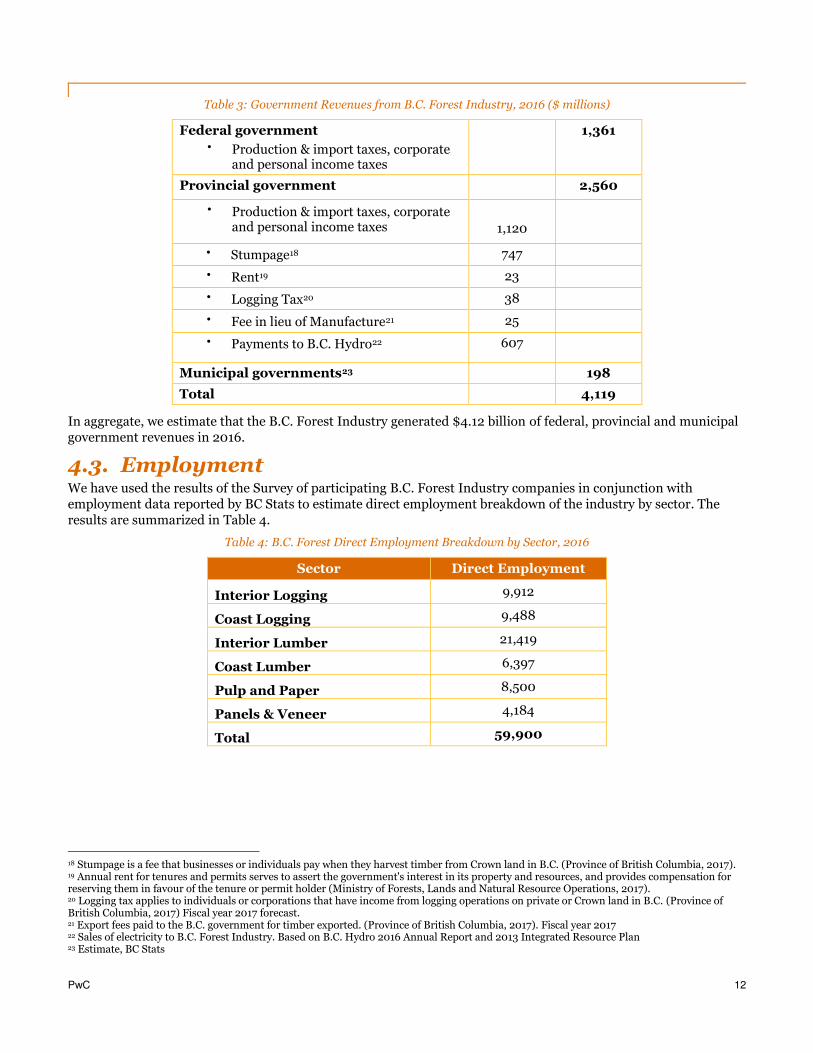
Table 3: Government Revenues from B.C. Forest Industry, 2016 ($ millions)
Federal government Production & import taxes, corporate
and personal income taxes
1,361
Provincial government
2,560
Production & import taxes, corporate and personal income taxes
1,120
Stumpage18 747
Rent19 23
Logging Tax20 38
Fee in lieu of Manufacture21 25
Payments to B.C. Hydro22 607
Municipal governments23 198
Total 4,119
In aggregate, we estimate that the B.C. Forest Industry generated $4.12 billion of federal, provincial and municipal government revenues in 2016.
4.3. Employment We have used the results of the Survey of participating B.C. Forest Industry companies in conjunction with employment data reported by BC Stats to estimate direct employment breakdown of the industry by sector. The results are summarized in Table 4.
Table 4: B.C. Forest Direct Employment Breakdown by Sector, 2016
Sector Direct Employment
Interior Logging 9,912
Coast Logging 9,488
Interior Lumber 21,419
Coast Lumber 6,397
Pulp and Paper 8,500
Panels & Veneer 4,184
Total 59,900
18 Stumpage is a fee that businesses or individuals pay when they harvest timber from Crown land in B.C. (Province of British Columbia, 2017). 19 Annual rent for tenures and permits serves to assert the government's interest in its property and resources, and provides compensation for reserving them in favour of the tenure or permit holder (Ministry of Forests, Lands and Natural Resource Operations, 2017). 20 Logging tax applies to individuals or corporations that have income from logging operations on private or Crown land in B.C. (Province of British Columbia, 2017) Fiscal year 2017 forecast. 21 Export fees paid to the B.C. government for timber exported. (Province of British Columbia, 2017). Fiscal year 2017 22 Sales of electricity to B.C. Forest Industry. Based on B.C. Hydro 2016 Annual Report and 2013 Integrated Resource Plan 23 Estimate, BC Stats
PwC 13
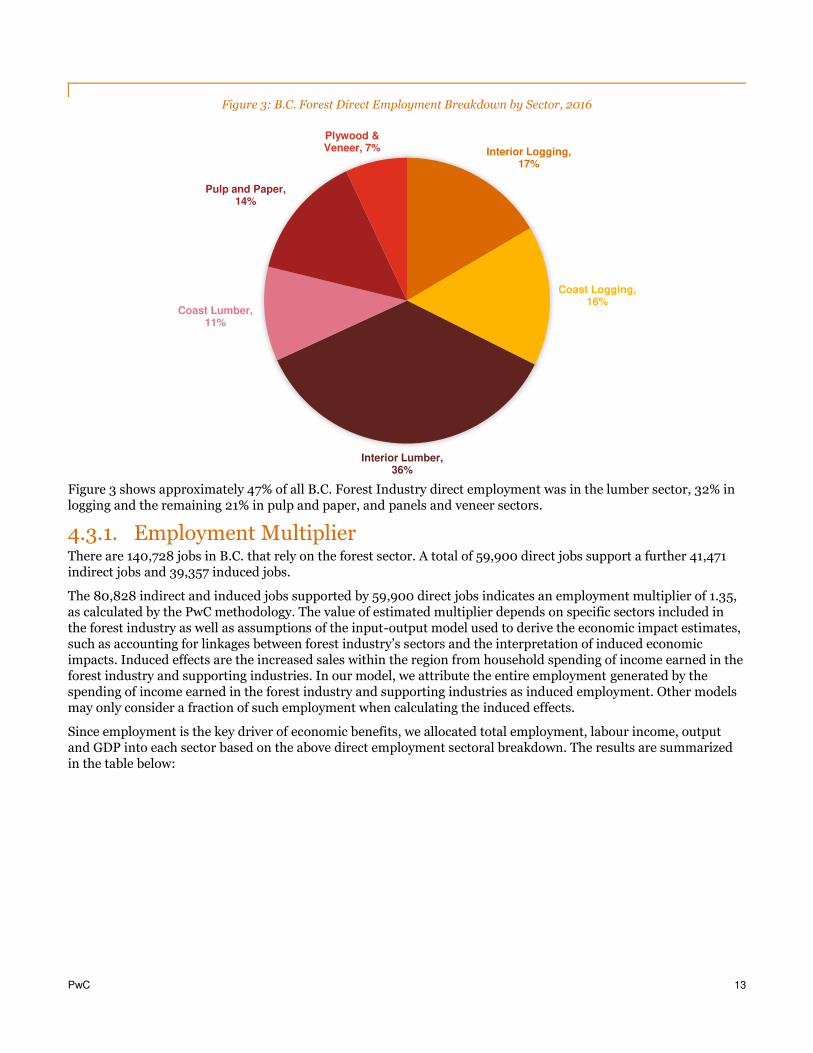
Figure 3: B.C. Forest Direct Employment Breakdown by Sector, 2016
Figure 3 shows approximately 47% of all B.C. Forest Industry direct employment was in the lumber sector, 32% in logging and the remaining 21% in pulp and paper, and panels and veneer sectors.
4.3.1. Employment Multiplier There are 140,728 jobs in B.C. that rely on the forest sector. A total of 59,900 direct jobs support a further 41,471 indirect jobs and 39,357 induced jobs.
The 80,828 indirect and induced jobs supported by 59,900 direct jobs indicates an employment multiplier of 1.35, as calculated by the PwC methodology. The value of estimated multiplier depends on specific sectors included in the forest industry as well as assumptions of the input-output model used to derive the economic impact estimates, such as accounting for linkages between forest industry’s sectors and the interpretation of induced economic impacts. Induced effects are the increased sales within the region from household spending of income earned in the forest industry and supporting industries. In our model, we attribute the entire employment generated by the spending of income earned in the forest industry and supporting industries as induced employment. Other models may only consider a fraction of such employment when calculating the induced effects.
Since employment is the key driver of economic benefits, we allocated total employment, labour income, output and GDP into each sector based on the above direct employment sectoral breakdown. The results are summarized in the table below:
Interior Logging, 17%
Coast Logging, 16%
Interior Lumber, 36%
Coast Lumber, 11%
Pulp and Paper, 14%
Plywood & Veneer, 7%
PwC 14
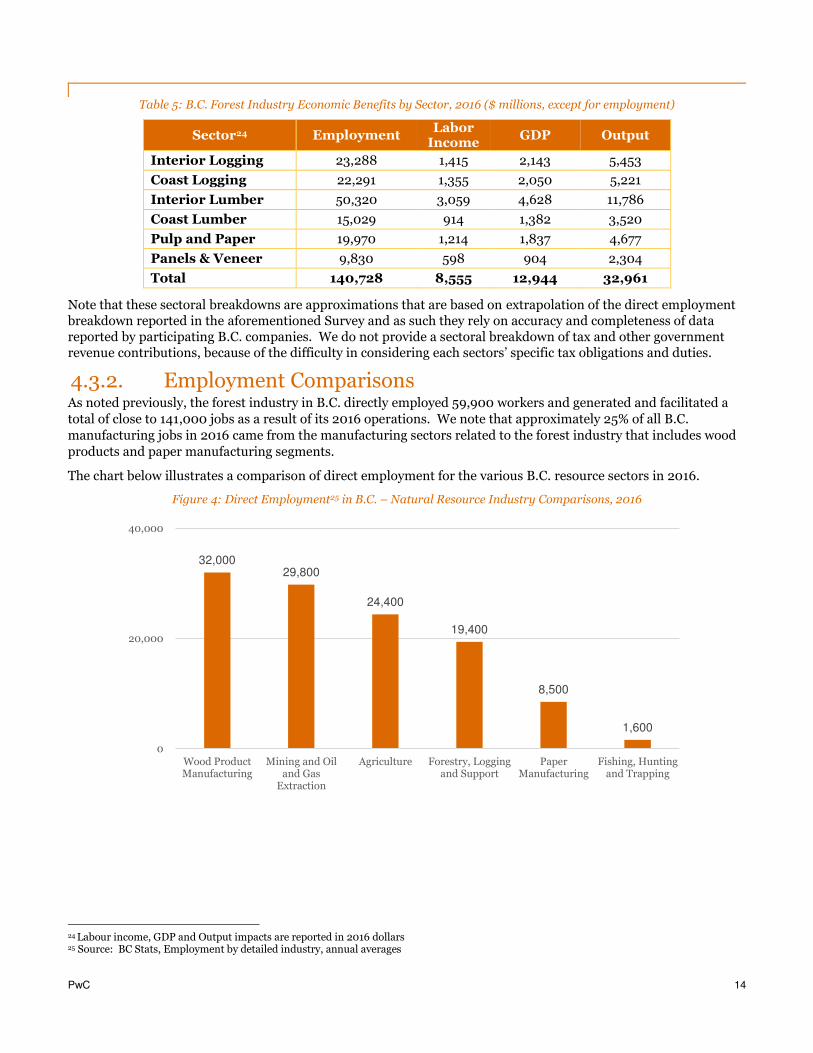
Table 5: B.C. Forest Industry Economic Benefits by Sector, 2016 ($ millions, except for employment)
Sector24 Employment Labor
Income GDP Output
Interior Logging 23,288 1,415 2,143 5,453
Coast Logging 22,291 1,355 2,050 5,221
Interior Lumber 50,320 3,059 4,628 11,786
Coast Lumber 15,029 914 1,382 3,520
Pulp and Paper 19,970 1,214 1,837 4,677
Panels & Veneer 9,830 598 904 2,304
Total 140,728 8,555 12,944 32,961
Note that these sectoral breakdowns are approximations that are based on extrapolation of the direct employment breakdown reported in the aforementioned Survey and as such they rely on accuracy and completeness of data reported by participating B.C. companies. We do not provide a sectoral breakdown of tax and other government revenue contributions, because of the difficulty in considering each sectors’ specific tax obligations and duties.
4.3.2. Employment Comparisons As noted previously, the forest industry in B.C. directly employed 59,900 workers and generated and facilitated a
total of close to 141,000 jobs as a result of its 2016 operations. We note that approximately 25% of all B.C.
manufacturing jobs in 2016 came from the manufacturing sectors related to the forest industry that includes wood
products and paper manufacturing segments.
The chart below illustrates a comparison of direct employment for the various B.C. resource sectors in 2016.
Figure 4: Direct Employment25 in B.C. – Natural Resource Industry Comparisons, 2016
24 Labour income, GDP and Output impacts are reported in 2016 dollars 25 Source: BC Stats, Employment by detailed industry, annual averages
32,00029,800
24,400
19,400
8,500
1,600
0
20,000
40,000
Wood ProductManufacturing
Mining and Oiland Gas
Extraction
Agriculture Forestry, Loggingand Support
PaperManufacturing
Fishing, Huntingand Trapping
PwC 15
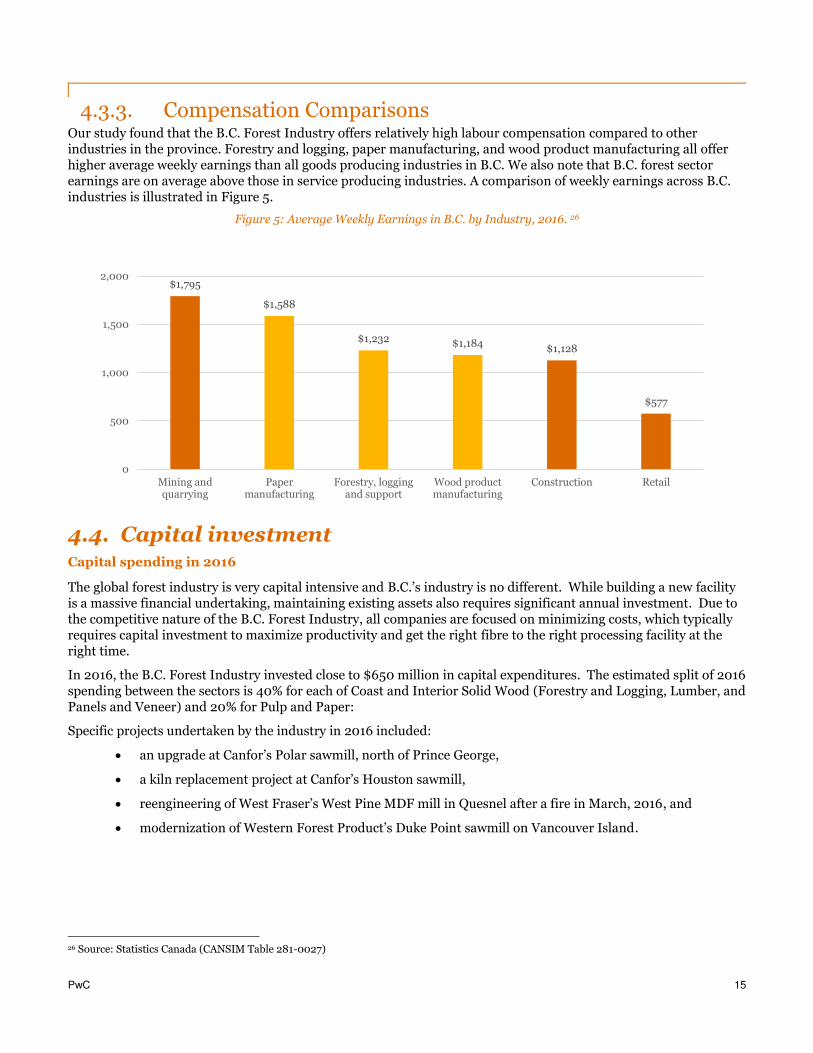
4.3.3. Compensation Comparisons Our study found that the B.C. Forest Industry offers relatively high labour compensation compared to other industries in the province. Forestry and logging, paper manufacturing, and wood product manufacturing all offer higher average weekly earnings than all goods producing industries in B.C. We also note that B.C. forest sector earnings are on average above those in service producing industries. A comparison of weekly earnings across B.C. industries is illustrated in Figure 5.
Figure 5: Average Weekly Earnings in B.C. by Industry, 2016. 26
4.4. Capital investment Capital spending in 2016
The global forest industry is very capital intensive and B.C.’s industry is no different. While building a new facility is a massive financial undertaking, maintaining existing assets also requires significant annual investment. Due to the competitive nature of the B.C. Forest Industry, all companies are focused on minimizing costs, which typically requires capital investment to maximize productivity and get the right fibre to the right processing facility at the right time.
In 2016, the B.C. Forest Industry invested close to $650 million in capital expenditures. The estimated split of 2016 spending between the sectors is 40% for each of Coast and Interior Solid Wood (Forestry and Logging, Lumber, and Panels and Veneer) and 20% for Pulp and Paper:
Specific projects undertaken by the industry in 2016 included:
an upgrade at Canfor’s Polar sawmill, north of Prince George,
a kiln replacement project at Canfor’s Houston sawmill,
reengineering of West Fraser’s West Pine MDF mill in Quesnel after a fire in March, 2016, and
modernization of Western Forest Product’s Duke Point sawmill on Vancouver Island.
26 Source: Statistics Canada (CANSIM Table 281-0027)
$1,795
$1,588
$1,232 $1,184$1,128
$577
0
500
1,000
1,500
2,000
Mining andquarrying
Papermanufacturing
Forestry, loggingand support
Wood productmanufacturing
Construction Retail
PwC 16
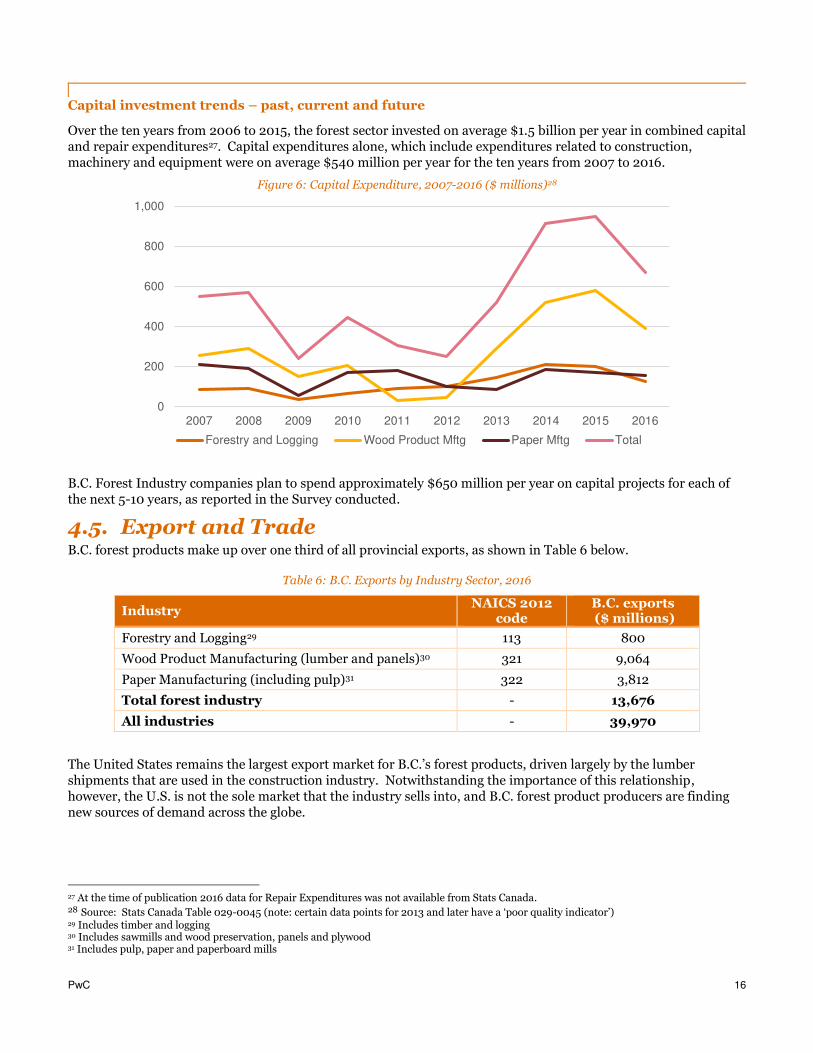
Capital investment trends – past, current and future
Over the ten years from 2006 to 2015, the forest sector invested on average $1.5 billion per year in combined capital and repair expenditures27. Capital expenditures alone, which include expenditures related to construction, machinery and equipment were on average $540 million per year for the ten years from 2007 to 2016.
Figure 6: Capital Expenditure, 2007-2016 ($ millions)28
B.C. Forest Industry companies plan to spend approximately $650 million per year on capital projects for each of the next 5-10 years, as reported in the Survey conducted.
4.5. Export and Trade B.C. forest products make up over one third of all provincial exports, as shown in Table 6 below.
Table 6: B.C. Exports by Industry Sector, 2016
Industry NAICS 2012
code B.C. exports ($ millions)
Forestry and Logging29 113 800
Wood Product Manufacturing (lumber and panels)30 321 9,064
Paper Manufacturing (including pulp)31 322 3,812
Total forest industry - 13,676
All industries - 39,970
The United States remains the largest export market for B.C.’s forest products, driven largely by the lumber shipments that are used in the construction industry. Notwithstanding the importance of this relationship, however, the U.S. is not the sole market that the industry sells into, and B.C. forest product producers are finding new sources of demand across the globe.
27 At the time of publication 2016 data for Repair Expenditures was not available from Stats Canada. 28 Source: Stats Canada Table 029-0045 (note: certain data points for 2013 and later have a ‘poor quality indicator’) 29 Includes timber and logging 30 Includes sawmills and wood preservation, panels and plywood 31 Includes pulp, paper and paperboard mills
0
200
400
600
800
1,000
2007 2008 2009 2010 2011 2012 2013 2014 2015 2016
Forestry and Logging Wood Product Mftg Paper Mftg Total

PwC 17
The top export markets are the United States and China; 53% of all B.C. forest products are shipped to the US and
24% to China. Japan, the UK, and South Korea make up the other significant export market, as indicated in Table 7
and Figure 7 below.
Table 7: Top 5 B.C. Forest Industry Exports by Country, 2016
Destination Exports ($ million) Share of total exports
United States 7,191 53%
China 3,296 24%
Japan 1,226 9%
South Korea 320 2%
United Kingdom 304 2%
Total all countries 13,676 100%
The BC industry has been a leader in developing offshore markets and continues to explore opportunities in Asia,
ASEAN countries, and the newly emerging Indian market; the province has a greater percentage of forestry product
exports going to markets outside of the US than does the rest of Canada, as can be seen in comparing Figure 7 with
Figure 8.
Figure 7: B.C. Forest Product Exports by Destination, 2007 - 2016 ($ millions)
0
2,000
4,000
6,000
8,000
10,000
12,000
14,000
2007 2008 2009 2010 2011 2012 2013 2014 2015 2016
US China Japan EU Korea Taiwan India
PwC 18
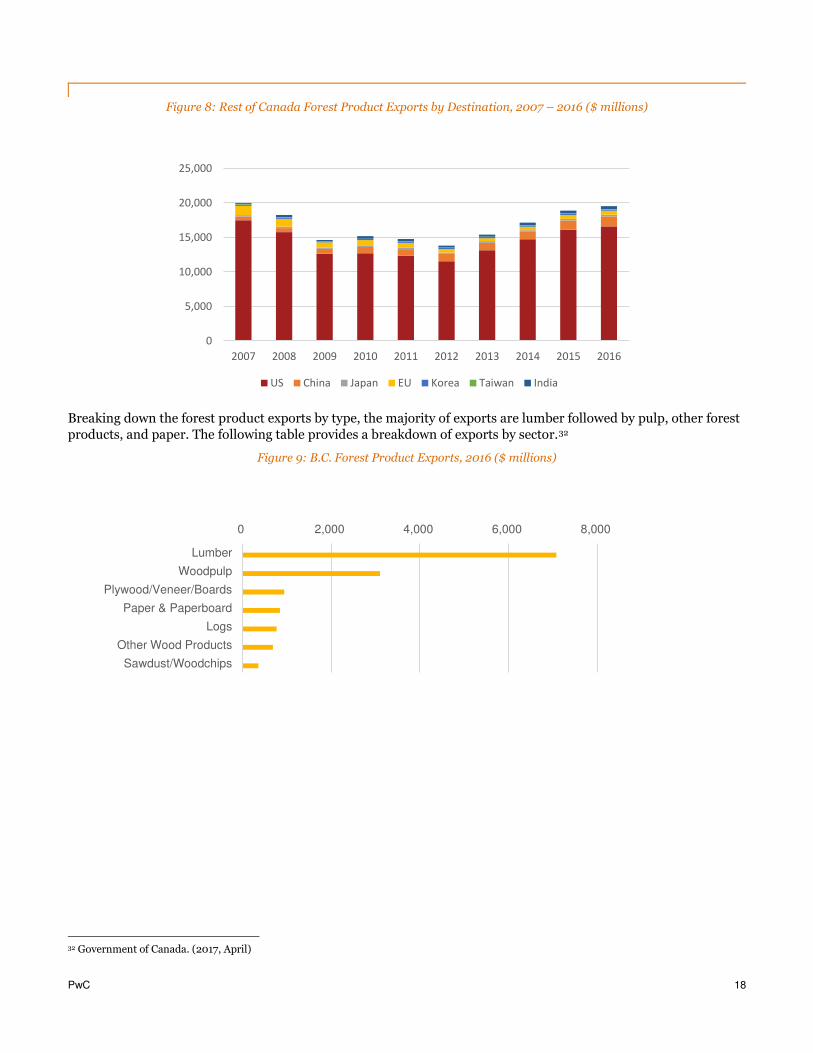
Figure 8: Rest of Canada Forest Product Exports by Destination, 2007 – 2016 ($ millions)
Breaking down the forest product exports by type, the majority of exports are lumber followed by pulp, other forest
products, and paper. The following table provides a breakdown of exports by sector.32
Figure 9: B.C. Forest Product Exports, 2016 ($ millions)
32 Government of Canada. (2017, April)
0
5,000
10,000
15,000
20,000
25,000
2007 2008 2009 2010 2011 2012 2013 2014 2015 2016
US China Japan EU Korea Taiwan India
0 2,000 4,000 6,000 8,000
Lumber
Woodpulp
Plywood/Veneer/Boards
Paper & Paperboard
Logs
Other Wood Products
Sawdust/Woodchips
PwC 19
5. Other Important Contributions of British Columbia’s Forest Industry
This section of the report has been created to highlight the unique and ongoing contribution of the B.C. Forest Industry to the communities in which it operates. This section includes data from many secondary sources.
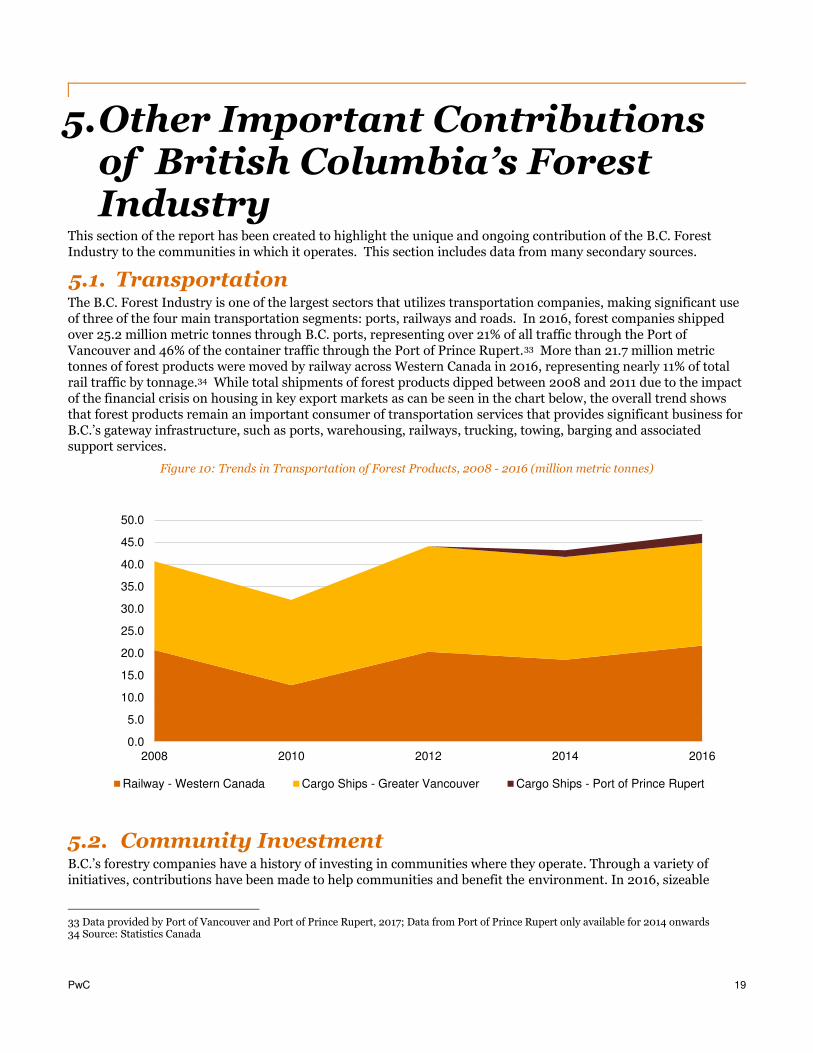
5.1. Transportation The B.C. Forest Industry is one of the largest sectors that utilizes transportation companies, making significant use of three of the four main transportation segments: ports, railways and roads. In 2016, forest companies shipped over 25.2 million metric tonnes through B.C. ports, representing over 21% of all traffic through the Port of Vancouver and 46% of the container traffic through the Port of Prince Rupert.33 More than 21.7 million metric tonnes of forest products were moved by railway across Western Canada in 2016, representing nearly 11% of total rail traffic by tonnage.34 While total shipments of forest products dipped between 2008 and 2011 due to the impact of the financial crisis on housing in key export markets as can be seen in the chart below, the overall trend shows that forest products remain an important consumer of transportation services that provides significant business for B.C.’s gateway infrastructure, such as ports, warehousing, railways, trucking, towing, barging and associated support services.
Figure 10: Trends in Transportation of Forest Products, 2008 - 2016 (million metric tonnes)
5.2. Community Investment B.C.’s forestry companies have a history of investing in communities where they operate. Through a variety of initiatives, contributions have been made to help communities and benefit the environment. In 2016, sizeable
33 Data provided by Port of Vancouver and Port of Prince Rupert, 2017; Data from Port of Prince Rupert only available for 2014 onwards 34 Source: Statistics Canada
0.0
5.0
10.0
15.0
20.0
25.0
30.0
35.0
40.0
45.0
50.0
2008 2010 2012 2014 2016
Railway - Western Canada Cargo Ships - Greater Vancouver Cargo Ships - Port of Prince Rupert

PwC 20
donations were made to charities such as the United Way, where 90 cents of every dollar donated is reinvested into programs and services35, and to environmental conservation efforts throughout B.C. The 19 companies surveyed reported total donations of just over $2 million.
Donations (cash and in kind) are often made by forestry companies to support social, cultural and environmental causes and initiatives prioritized by communities. This includes improvement or renovation of arenas, swimming pools, community centres, fitness centres, outdoor public facilities or playgrounds. As well, land and resources are often donated for recreational uses such as camping, trails for the enjoyment of hikers and cyclists, and preservation or conservation for stakeholder benefit.
5.3. Sustainability
5.3.1. Forest Management and Certification B.C. is recognized a global leader in sustainable forest management, meeting the environmental, social, and economic needs of current and future generations. Stringent forest laws, skilled forestry professionals, comprehensive monitoring, compliance and enforcement strengthen B.C.’s role in forest management and sustainability.
Forest lands across B.C. are largely located on crown land. Making up 95% of the provincial land base, the provincial government legislates and regulates forest practices and sets harvest levels on crown land. Their activities include: collecting and maintaining a comprehensive forest inventory; projecting growth; conducting strategic analyses; developing policy initiatives; conducting Timber Supply Reviews; and setting timber harvest levels across the province given, biological, economic and social objectives.36 Less than 1% of B.C. forest land is harvested annually.37
Roughly 2% of B.C.’s forest land is privately owned, which amounts to about 1.6 million hectares, 822,000 hectares of which are considered managed forest land.38 These landowners set their own harvest levels but must adhere to the rules set forth by the Private Managed Forest Land Regulation. Forest resources from B.C.’s public and private forest lands support jobs in forest operations, sawmilling and pulp and paper industries.
Reforestation is critical to sustaining B.C.’s forest resources. For decades, forest licensees have been legally required to reforest the areas that they harvest, using a mix of native tree species to help maintain ecosystem processes, resilience and diverse habitats. In 2016, about 259 million trees were planted in B.C.39 On average, this amounts to three seedlings planted for every tree harvested in B.C. 40
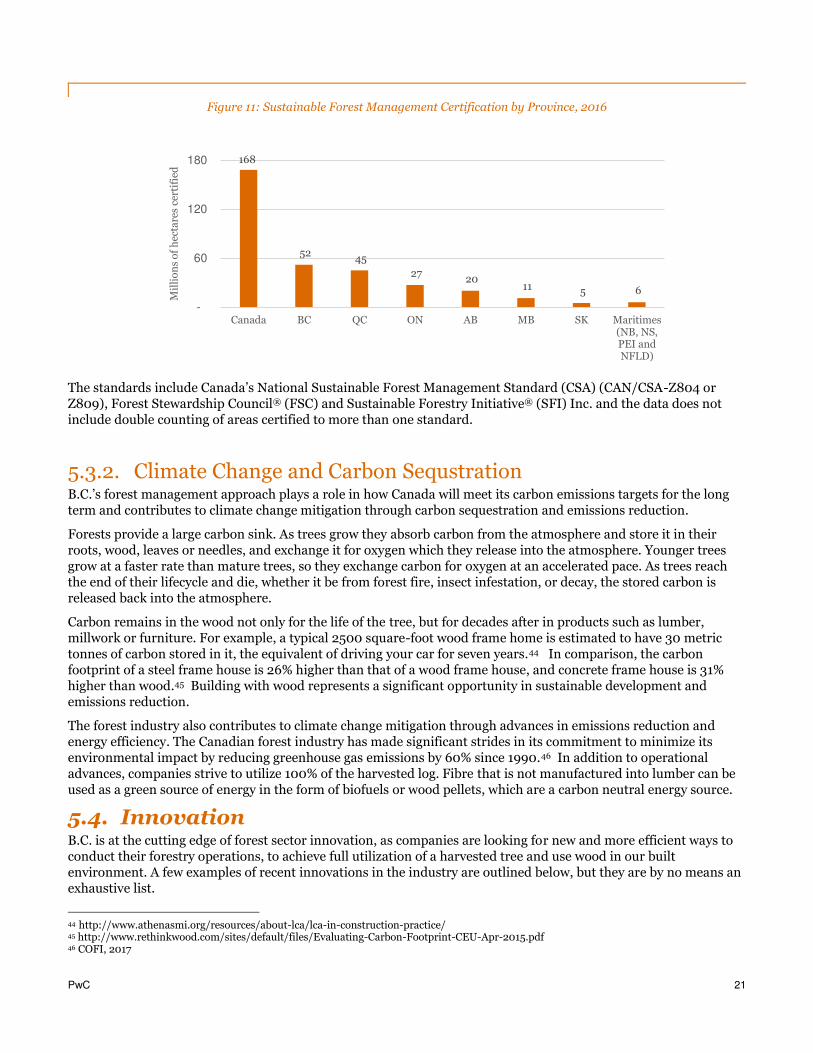
In addition to the stringent forest management laws set out by the provincial government, Canada is an international leader in 3rd party forest certification (e.g., Forest Stewardship Council (FSC), Program for the Endorsement of Forest Certification (PEFC), Sustainable Forestry Initiative (SFI), etc.), with over 168 million hectares or 37% of the world’s certified forests.41 In 2014, only about 10% of the world’s forests were certified. The significance of these certifications is that these voluntarily certifications are above and beyond those regulated by governments, and provide reasonable assurance that long-term harvests are sustainable and authorized, wildlife habitat is preserved, and soil quality is maintained.42 B.C. contributes more than any other province to Canada’s reputation as an international leader in independent forest certification, with over 52 million hectares of certified forests,43 accounting for approximately 14% of the world’s certified forests.
35 https://www.unitedwaynbc.ca/index.php/how-we-help/ 36 https://www.for.gov.bc.ca/hts/aactsa.htm 37 http://www.naturallywood.com/sites/default/files/documents/resources/sustainable_forest_management_-_web.pdf 38 http://www.pfla.bc.ca/managed-forest-land/ 39 https://news.gov.bc.ca/factsheets/factsheet-reforestation-in-bc 40COFI, 2017 41 http://www.nrcan.gc.ca/forests/canada/certification/17474 42 FPAC, 2015 43 http://certificationcanada.org/en/statistics/canadian-statistics/
PwC 21
Figure 11: Sustainable Forest Management Certification by Province, 2016
The standards include Canada’s National Sustainable Forest Management Standard (CSA) (CAN/CSA-Z804 or Z809), Forest Stewardship Council® (FSC) and Sustainable Forestry Initiative® (SFI) Inc. and the data does not include double counting of areas certified to more than one standard.
5.3.2. Climate Change and Carbon Sequstration B.C.’s forest management approach plays a role in how Canada will meet its carbon emissions targets for the long term and contributes to climate change mitigation through carbon sequestration and emissions reduction.
Forests provide a large carbon sink. As trees grow they absorb carbon from the atmosphere and store it in their roots, wood, leaves or needles, and exchange it for oxygen which they release into the atmosphere. Younger trees grow at a faster rate than mature trees, so they exchange carbon for oxygen at an accelerated pace. As trees reach the end of their lifecycle and die, whether it be from forest fire, insect infestation, or decay, the stored carbon is released back into the atmosphere.
Carbon remains in the wood not only for the life of the tree, but for decades after in products such as lumber, millwork or furniture. For example, a typical 2500 square-foot wood frame home is estimated to have 30 metric tonnes of carbon stored in it, the equivalent of driving your car for seven years.44 In comparison, the carbon footprint of a steel frame house is 26% higher than that of a wood frame house, and concrete frame house is 31% higher than wood.45 Building with wood represents a significant opportunity in sustainable development and emissions reduction.
The forest industry also contributes to climate change mitigation through advances in emissions reduction and energy efficiency. The Canadian forest industry has made significant strides in its commitment to minimize its environmental impact by reducing greenhouse gas emissions by 60% since 1990.46 In addition to operational advances, companies strive to utilize 100% of the harvested log. Fibre that is not manufactured into lumber can be used as a green source of energy in the form of biofuels or wood pellets, which are a carbon neutral energy source.
5.4. Innovation B.C. is at the cutting edge of forest sector innovation, as companies are looking for new and more efficient ways to conduct their forestry operations, to achieve full utilization of a harvested tree and use wood in our built environment. A few examples of recent innovations in the industry are outlined below, but they are by no means an exhaustive list.
44 http://www.athenasmi.org/resources/about-lca/lca-in-construction-practice/ 45 http://www.rethinkwood.com/sites/default/files/Evaluating-Carbon-Footprint-CEU-Apr-2015.pdf 46 COFI, 2017
168
52 45
27 20
11 5 6
-
60
120
180
Canada BC QC ON AB MB SK Maritimes(NB, NS,PEI andNFLD)
Mil
lio
ns
of
hec
tare
s ce
rtif
ied

PwC 22
• The B.C. forest sector uses remote sensing technology, which helps companies to make better decisions regarding forest resource management and infrastructure planning. Using technologies such as LiDar (Light Detection and Ranging), companies can gather data related to the quality and dimension of the wood, and plan roads so that they better protect the local environment. LiDAR can also help to estimate topography of an area, which will affect which equipment will be used to harvest.
• There have been many technological advances made in mills. Companies utilize 3D and x-ray scanning of logs to analyze the quality of logs and determine any defects before they are milled in order to optimize the volume and grade of lumber that is produced. 3D curve sawing technology is also used to follow the curve of the log, which improves the grade of lumber. After cut, moisture sensor technology is used to improve kiln drying processes.
• Mill residue is used to produce heat or energy, and mills are increasingly supplying excess of this carbon neutral energy to third parties. Pulp mills are using residues to create bio-chemicals and bio-fibres that can be used in textiles, plastics, rubbers, and pharmaceuticals.
• One of the oldest building materials, wood’s versatility and sustainability make it an ideal component in construction. An environmentally sustainable product, wood can be processed into a variety of shapes and sizes easily adapting to construction needs. Its ability to store, rather than emit, carbon dioxide for the life of the structure and wood’s lower energy consumption during manufacturing47 make it a go-to building material for sustainable construction projects.
• The recent construction of the University of B.C.’s Brock Commons Tallwood House, the world’s tallest wood building with 18 storeys, attests to the high-performance of wood as a building material. The building, a student residence, was constructed using a hybrid of mass wood, steel and concrete. The use of wood as a primary building material is estimated to have led to a 2,400 metric tonne reduction in carbon monoxide, or the equivalent of removing 500 cars from the road for a year.48 The use of prefabricated components meant that construction of the wooden building only took 70 days, once the components arrived on site, whereas similarly sized projects would usually take an additional 120 days. Consisting of 17 storeys of cross laminated timber floors supported on glue laminated timber columns, Brock Commons was built on top of a concrete base and includes a cross laminated timber canopy.
Recognizing the importance of innovation to the industry, organizations such as FPInnovations and Genome BC, among others, have committed resources to researching such areas as the use of remote sensing to improve harvesting, restrictions on traditional fibre sources, and opportunities in bio energy. FPInnovations is a not-for-profit organization that partners with government and industry, and specializes in the creation of innovative scientific solutions in support of the Canadian forest sector’s global competitiveness. Genome BC invests in research, entrepreneurship and commercialization in life sciences to address challenges in key sectors such as health, forestry, fisheries, aquaculture, agri-food, energy, mining and environment.
5.5. Value Added Sector The B.C. forest industry is an integrated sector and is made up of many interconnected sub-sectors. The value-added sub-sector uses wood in innovative ways, manufacturing specialty products such as finger-jointed lumber, decking, siding, engineered wood, plywood, OSB, veneer, windows and doors, pallets, shakes and shingles, and much more.
The contribution of the value-added sector is difficult to measure, as there is no clear definition of the sector. The North American Industry Classification System (NAICS), which is a standard industry classification code for different products, has no unique identifier for value-added wood products.49 However, in November 2013 the Coast Forest Products Association conducted a Remanufacturers – Supply Chain (RSC) Project. The objective of the RSC Project was to gain a greater understanding of the interconnectedness of the segments of the coastal forestry industry in British Columbia. The secondary manufacturing (value-added) segment of the coastal B.C.
47 http://www.naturallywood.com/emerging-trends/tall-wood/ubc-brock-commons 48 Global News, September 15, 2016, http://globalnews.ca/news/2943184/worlds-tallest-wood-building-completed-at-ubc/
49 http://www2.gov.bc.ca/assets/gov/farming-natural-resources-and-industry/forestry/competitive-forest-
industry/value_added_plan_sept_2016.pdf
PwC 23
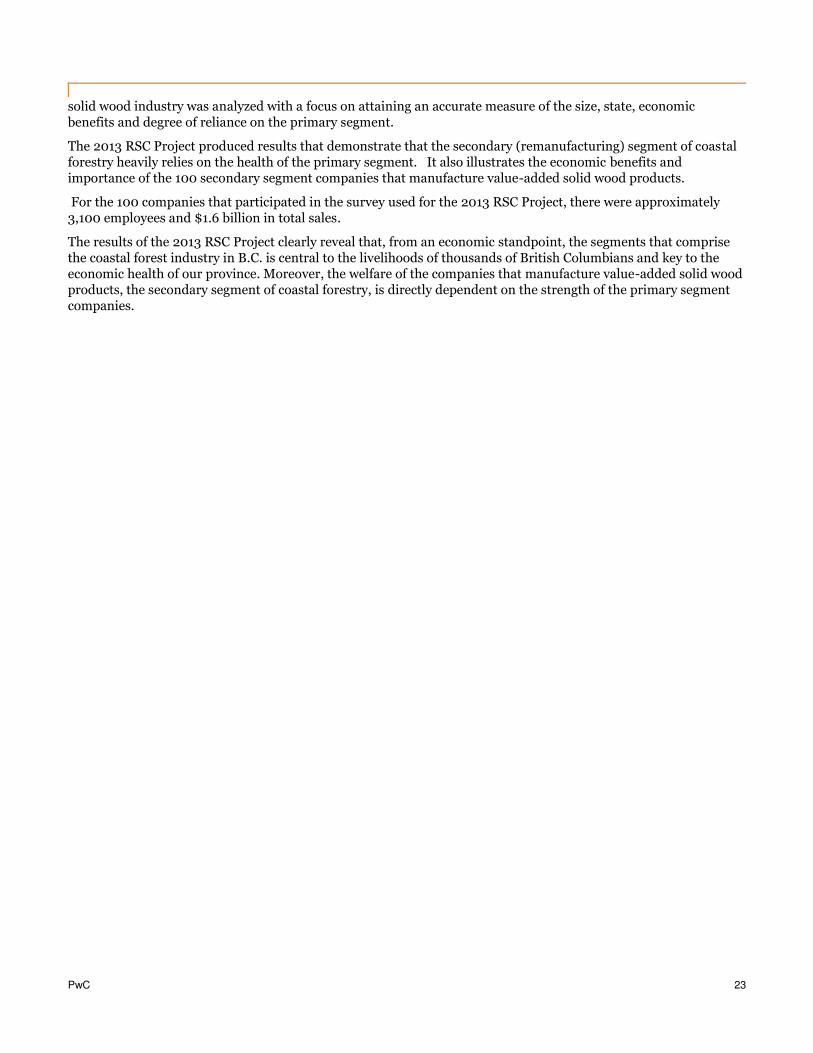
solid wood industry was analyzed with a focus on attaining an accurate measure of the size, state, economic benefits and degree of reliance on the primary segment.
The 2013 RSC Project produced results that demonstrate that the secondary (remanufacturing) segment of coastal forestry heavily relies on the health of the primary segment. It also illustrates the economic benefits and importance of the 100 secondary segment companies that manufacture value-added solid wood products.
For the 100 companies that participated in the survey used for the 2013 RSC Project, there were approximately 3,100 employees and $1.6 billion in total sales.
The results of the 2013 RSC Project clearly reveal that, from an economic standpoint, the segments that comprise the coastal forest industry in B.C. is central to the livelihoods of thousands of British Columbians and key to the economic health of our province. Moreover, the welfare of the companies that manufacture value-added solid wood products, the secondary segment of coastal forestry, is directly dependent on the strength of the primary segment companies.

Appendix A: Assumptions The conclusions expressed and information presented in this report rely on the following major assumptions:
Completeness, reliability, and accuracy of Survey responses collected from participating B.C. forest companies.
Reliability and accuracy of external sources used in this report. All external sources are listed in Appendix B.
The employment breakdown by sector obtained by aggregating responses is representative of the entire B.C. Forest Industry.
It is reasonable to allocate economic impacts of the B.C. Forest Industry related to output, GDP, labour income and employment to each sector within the forest industry using the sectoral employment breakdown obtained by aggregating Survey responses.
The Statistics Canada Input Output table is a reasonable representation of the underlying relationships in
the economy during the relevant periods modelled in the report.
We note that significant deviations from the above listed major assumptions may result in a significant change to our analysis.
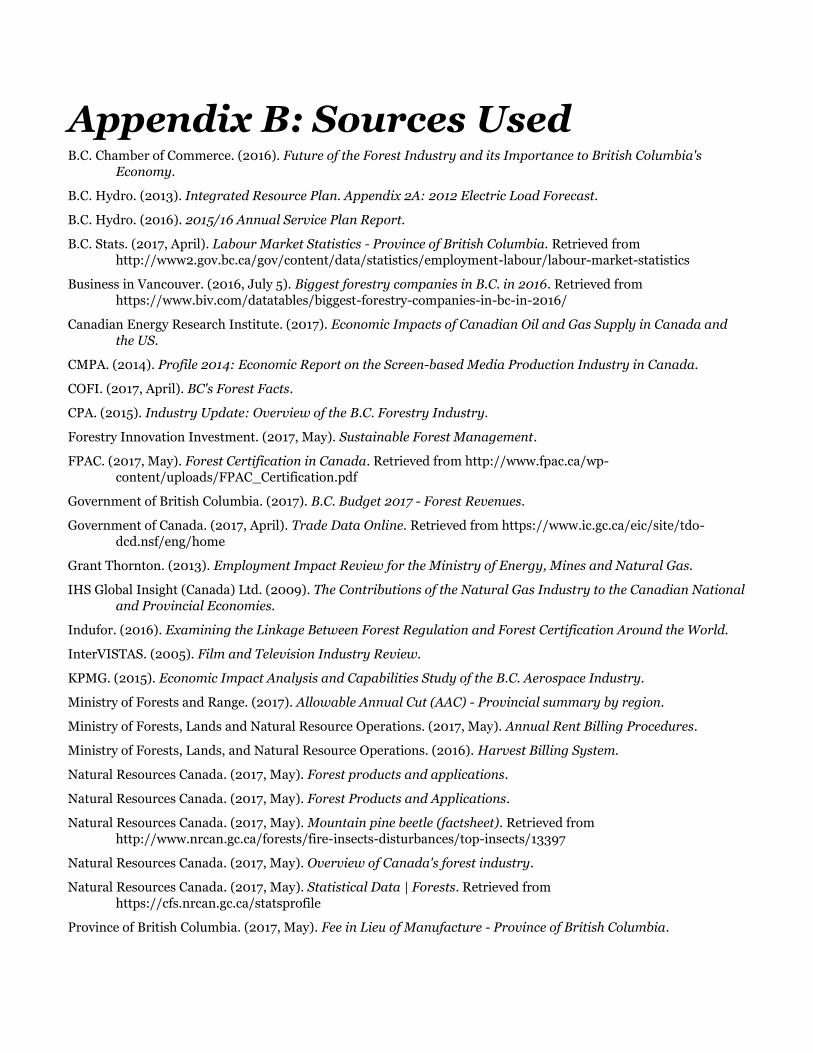
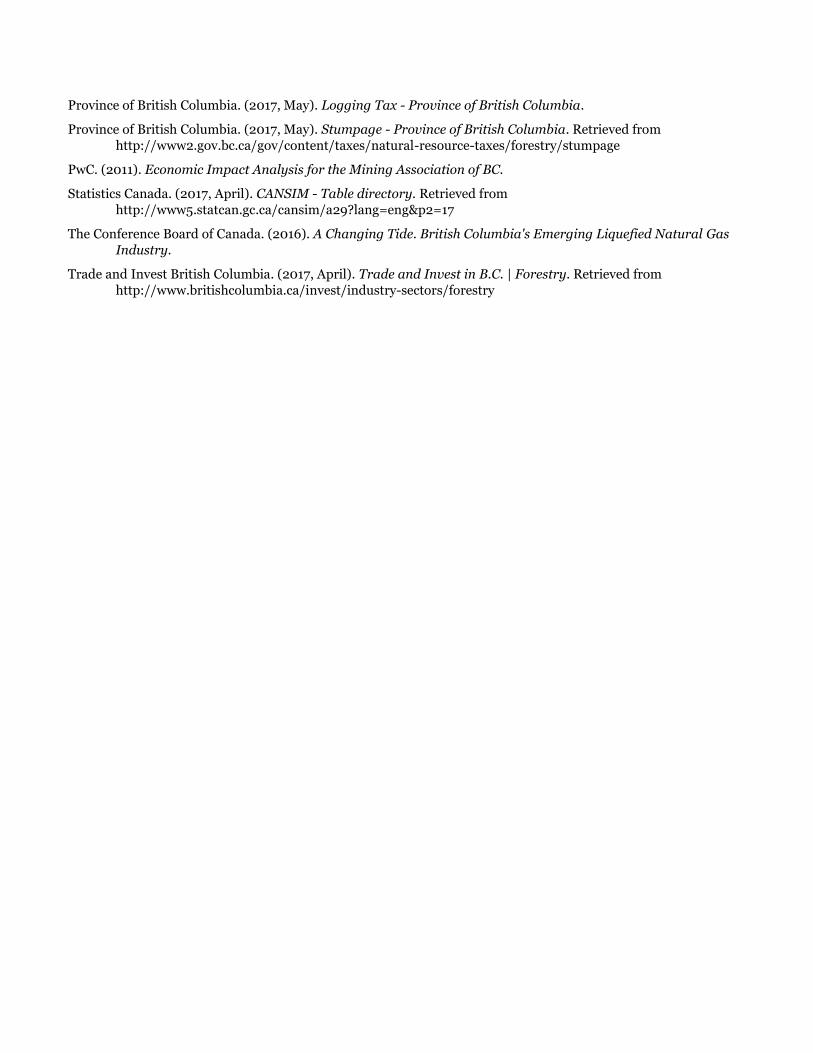
Appendix B: Sources Used B.C. Chamber of Commerce. (2016). Future of the Forest Industry and its Importance to British Columbia's
Economy.
B.C. Hydro. (2013). Integrated Resource Plan. Appendix 2A: 2012 Electric Load Forecast.
B.C. Hydro. (2016). 2015/16 Annual Service Plan Report.
B.C. Stats. (2017, April). Labour Market Statistics - Province of British Columbia. Retrieved from
http://www2.gov.bc.ca/gov/content/data/statistics/employment-labour/labour-market-statistics
Business in Vancouver. (2016, July 5). Biggest forestry companies in B.C. in 2016. Retrieved from
https://www.biv.com/datatables/biggest-forestry-companies-in-bc-in-2016/
Canadian Energy Research Institute. (2017). Economic Impacts of Canadian Oil and Gas Supply in Canada and
the US.
CMPA. (2014). Profile 2014: Economic Report on the Screen-based Media Production Industry in Canada.
COFI. (2017, April). BC's Forest Facts.
CPA. (2015). Industry Update: Overview of the B.C. Forestry Industry.
Forestry Innovation Investment. (2017, May). Sustainable Forest Management.
FPAC. (2017, May). Forest Certification in Canada. Retrieved from http://www.fpac.ca/wp-
content/uploads/FPAC_Certification.pdf
Government of British Columbia. (2017). B.C. Budget 2017 - Forest Revenues.
Government of Canada. (2017, April). Trade Data Online. Retrieved from https://www.ic.gc.ca/eic/site/tdo-
dcd.nsf/eng/home
Grant Thornton. (2013). Employment Impact Review for the Ministry of Energy, Mines and Natural Gas.
IHS Global Insight (Canada) Ltd. (2009). The Contributions of the Natural Gas Industry to the Canadian National
and Provincial Economies.
Indufor. (2016). Examining the Linkage Between Forest Regulation and Forest Certification Around the World.
InterVISTAS. (2005). Film and Television Industry Review.
KPMG. (2015). Economic Impact Analysis and Capabilities Study of the B.C. Aerospace Industry.
Ministry of Forests and Range. (2017). Allowable Annual Cut (AAC) - Provincial summary by region.
Ministry of Forests, Lands and Natural Resource Operations. (2017, May). Annual Rent Billing Procedures.
Ministry of Forests, Lands, and Natural Resource Operations. (2016). Harvest Billing System.
Natural Resources Canada. (2017, May). Forest products and applications.
Natural Resources Canada. (2017, May). Forest Products and Applications.
Natural Resources Canada. (2017, May). Mountain pine beetle (factsheet). Retrieved from
http://www.nrcan.gc.ca/forests/fire-insects-disturbances/top-insects/13397
Natural Resources Canada. (2017, May). Overview of Canada's forest industry.
Natural Resources Canada. (2017, May). Statistical Data | Forests. Retrieved from
https://cfs.nrcan.gc.ca/statsprofile
Province of British Columbia. (2017, May). Fee in Lieu of Manufacture - Province of British Columbia.
Province of British Columbia. (2017, May). Logging Tax - Province of British Columbia.
Province of British Columbia. (2017, May). Stumpage - Province of British Columbia. Retrieved from
http://www2.gov.bc.ca/gov/content/taxes/natural-resource-taxes/forestry/stumpage
PwC. (2011). Economic Impact Analysis for the Mining Association of BC.
Statistics Canada. (2017, April). CANSIM - Table directory. Retrieved from
http://www5.statcan.gc.ca/cansim/a29?lang=eng&p2=17
The Conference Board of Canada. (2016). A Changing Tide. British Columbia's Emerging Liquefied Natural Gas
Industry.
Trade and Invest British Columbia. (2017, April). Trade and Invest in B.C. | Forestry. Retrieved from
http://www.britishcolumbia.ca/invest/industry-sectors/forestry
© 2017 PricewaterhouseCoopers LLP, an Ontario limited liability partnership. All rights reserved.
PwC refers to the Canadian member firm, and may sometimes refer to the PwC network. Each member firm is a separate legal entity. Please see www.pwc.com/structure for further details.
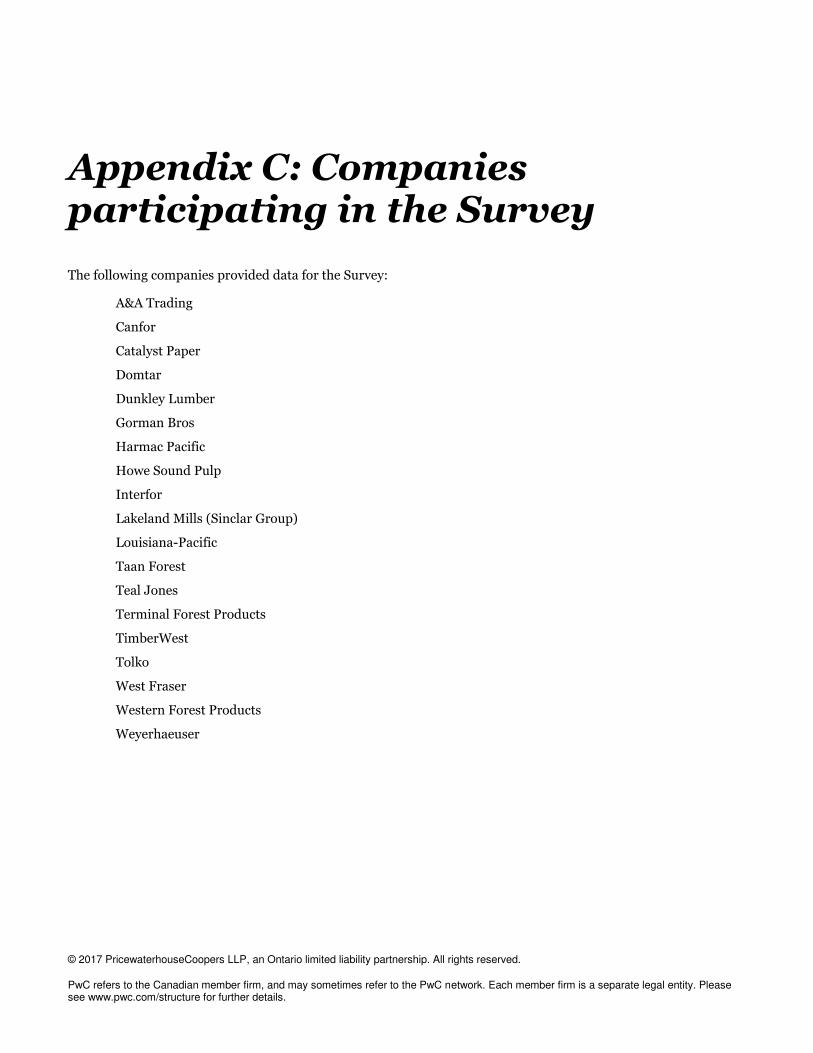
Appendix C: Companies participating in the Survey
The following companies provided data for the Survey:
A&A Trading
Canfor
Catalyst Paper
Domtar
Dunkley Lumber
Gorman Bros
Harmac Pacific
Howe Sound Pulp
Interfor
Lakeland Mills (Sinclar Group)
Louisiana-Pacific
Taan Forest
Teal Jones
Terminal Forest Products
TimberWest
Tolko
West Fraser
Western Forest Products
Weyerhaeuser


