:/ BRITTLE FRACTURE INVESTIGATIONS IN SELECTION OF AN OPTIMUM STEEL FOR HEAVY SHIP PLATE by David Allen Magee A Thesis Presented to the Graduate Faculty of Lehigh University in Candidacy for the Degree of Master of Science Lehigh University 1964 . , INDEXED
Transcript
:/
BRITTLE FRACTURE INVESTIGATIONS IN SELECTION OF
AN OPTIMUM STEEL FOR HEAVY SHIP PLATE
by
David Allen Magee
A Thesis
Presented to the Graduate Faculty
of Lehigh University
in Candidacy for the Degree of
Master of Science
Lehigh University
1964
. ,
INDEXED
iii
ACKNOWLEDGEMENTS
This thesis presents some of the results of an experimental
study investigating testing methods and geometrical factors effecting
brittle fracture. The project is part of a research program designed to
select a suitable steel to be used for heavy section ship plate. The
investigation was conducted at Fritz Engineering Laboratory and Williams
Hall, Lehigh University, Bethlehem, Pennsylvania. Professor William J. Eney
is Head of the Civil Engineering Department and Dr. Lynn S. Beedle is
Director of the Laboratory.
The author would like to express his sincere appreciation to
Dr. Lambert Tall for guiding him thrpughout the course of this project.
Special thanks go to Charles R. Roper, Metallurgical Research Assistant
for advice and help in performing the tests. Dr. R. D. Stout, project
director, has also given valuable advice throughout the testing program.
Thanks are due also to the Bethlehem Steel Company, the United
States Steel Corporation, and the Lukens Steel Company for supplying the
steels used in the investigation.
Last but far from least, thanks must be extended to
Miss Carole Neumeyer and Mrs. Patricia Steitz whose typing and suggestions
were of much help in the preparation of this thesis.
TABLE OF CONTENTS
Page
I INTRODUCTION 2
II BRITTLE FRACTURE THEORY 6
A. FRACTURE TERMINOLOGY 6
B. STRESS SYSTEM 8
C. TRANSITION TEMPERATURE 9
l). MATERIAL EFF~CTS, 10
III TESTING PROGRAM 12
A. TYPES OF STEEL 12
B. FRACTURE TESTS 13
1. Drop Weight Test 13
2. Van der Veen Test 16
3. Bagsar,Te~t 16'I. •. :
4. Charpy Test 16
C. WELDABILITY TESTS 20
1. The Battelle Test 20,';;
2. The Lehigh Restraint Test 21
3. Conc1ussions 22
D. FUTURE TESTING 22
IV GEOMETRIC VARIATIONS ON BRITTLE BEHAVIOR 24
A. EFFECT OF pLATE THICKNESS 24
B. EFFECT OF SPECIMEN HEIGHT 28
C. EFFECT OF SPECIMEN SPAN LENGTH 30
D. INTERRELATIONSHIP OF DIMENSIONS 30i .
iv
v
LIST OF FIGURES
Figure
1. THE DROP WEIGHT TEST 45
2. THE VAN DER VEEN TEST 46
3. THE BAGSAR TEST 47
4. THE V-NOTCH CHARPY TEST 48
5. THE BATTELLE UNDERBEAD CRACKING TEST 49
6. THE LEHIGH RESTRAINT TEST 50
7. EFFECT OF PLATE lRICKNESS ON FRACTURE TRANSITION 51TEMPERATURE OF ABS-CLASS C STEEL
8. EFFECT OJF PLATE THICKNESS ON DUCTILITY 51TRANS ITION TEMPERATURE OF ABS CLASS C STEEL
9. EFFECT OF PLATE THICKNESS ON THE TRANSITION 52TEMPERATURE OF liT-til STEEL IN THE VAN DER VEEN TEST
10. EFFECT OF PLATE THICKNESS ON THE TRANSITION TEMPER- 53ATURES OF LT-75 STEEL IN THE VAN DER VEEN TEST
11. EFFECT OF PLATE THICKNESS ON THE BRITTLE BREAKING 54STRAIN OF ABS CLASS C STEEL IN THE VAN DER VEEN TEST
12. EFFECT OF VAN DER VEEN SPECIMEN HEIGHT ON FRACTURE 55TRANSITION TEMPERATURES OF ABS CLAS·S C AND "T-1"STEELS
13. EFFECT OF VAN DER VEEN SPECIMEN HEIGHT ON DUCTILITY 56TRANSITION TEMPERATURES OF ABS CLASS C & "T-1" STEELS
14. EFFECT OF SPECIMEN HEIGHT ON TRANSITION TEMPERATURES 57OF LT-75 NORMALIZED STEEL
15. EFFECT OF SPEC lMEN SPAN ON TRANS ITION TEMPERATURES 58IN THE VAN DER VEEN AND DROP WEIGHT TESTS
16. TYPICAL TRANSITION CURVES OBTAINED FROM A STANDARD 59HEIGHT VAN DER VEEN TEST
17. THE EFFECT OF INCREASED STRAIN RATE 60
18. PROBABLE STRESS CONCENTRATION PATTERN FOR A 61VAN DER VEEN SPECIMEN
19. TRIAXIAL STRESS SYSTEM DEVELOPED BY A NOTCH 62
vi
vii
LIST OF TABLES
Table
l. PLATE ANALYSES OF ABS-C STEEL
2. HEAT TREATMENT OF ABS-C STEEL
3. MECHANICAL PROPERTIES OF ABS-C STEEL PLATE.
4. PLATE ANALYSIS OF "T~l" STEEL
5. HEAT TREATMENT OF "T-1" STEEL
6. MECHANICAL PROPERTIES OF "T-1" STEEL PLATES
7. PLATE ANALYSIS OF LT-75 STEEL
8. MECHANICAL PROPERTIES OF LT-75 STEEL
9. RESULTS OF DROP-WEIGHT TESTS ON ABS-CLASS C STEEL
10. RESULTS OF DROP-WEIGHT TESTS ON LT-75 STEEL
11. VAN DER VEEN TRANSITION TEMPERATURES OF ABS-C STEELDETERMINED BY VARIOUS CRITERIA
12. VAN DER VEEN TEST TRANSITION TEMPERATURES FOR II T-1"STEEL
64
64
65
65
66
66
67
67
68
68
69
70
13. VAN DER VEEN TEST TRANSITION TEMPERATURES FOR LT-75 STEEL 71
14. BAGSAR TEST RESULTS ON ABS-CLASS C STEEL 72
15. CHARPY V-NOTCH TRANSITION TEMPERATURES FOR ABS-C STEEL 73
16. CHARPY V-NOTCH TRANSITION TEMPERATURES FOR "'1'-1" STEEL 73
17. CHARPY V-NOTCH TRANSITION TEMPERATURES FOR LT-75 STEEL 74
18. CORRECTION FACTORS FOR VAN DER VEEN RESULTS BASED ON 75CHARPY TEST VALUES
19. BATTELLE TEST RESULTS 75
20. LEHIGH RESTRAINT TEST RESULTS 76
21. DEFLECTIONS & CALCULATED STRAINS FOR ABS-CVAN DER VEEN RESULTS
77
22. GENERAL COMPARRISON OF TRANSITION TEMPERATURES AMONG THE 78STEELS FOR STANDARD VAN DER VEENSPECIMEN
ABSTRACT
Investigations have been undertaken to evaluate some of the
geometrical properties influencing brittle behavior. In doing this,
several and various fracture tests have been conducted. In particular,
the van der Veen, Bagsar, and drop weight tests have been run as
fracture tests, using the VoNotch Charpy Impact test to correct for
metallurgical differences. In addition to the fracture tests, two
weldability tests, the Battelle underbead cracking, and the Lehigh
restraint test have been conducted.
Conclussions have been made concerning "infinite" specimen
dimensions necessary to give the same characteristics that would be
found with heavy ship plate sections.
In particular the . variables of the van der Veen test have
been discussed. This test has been recommended as a suitable test to
evaluate an "optimum" steel for heavy ship plate. Such a steel would
have to be suf~iciently strong, easily weldable, and exhibit good notch
toughness properties.
2.
I. INTRODUCTION
Brittle behavior has occurred occasionally in the past century
since the beginning of the use of mild steel in the fabrication of.~ "-~" - ..' .~ ._' .... - ..,
large structures.
Large steel structures such as bridges and ships are designed
under an assumed elastic loading. It is, therefore, quite unexpected
when an elastic material such as steel fails in a brittle manner. Such
failures have been known to occur at stresses well below design levels
and at normal temperatures. These failures occur usually without
appreciable yielding before fracture, giving little or no warning. Such.. .
catastrophic failures have been known to occur at fracture speeds of
several thousand feet per second.
Ships in particular have attracted attention for their history
of brittle failure. Noteworthy examples are the S. S. SCHENECTADY in
January of 1943, and that of the WORLD RECORD, a British tanker in
December 1954. The collapse of the Vierendeel truss bridge over the
Albert Canal at Hasselt, Belgium in 1938 is a good example of a catas-
trophic brittle failure that occurred in an all welded trussed bridge.
The most recent bridge failure was that of the Kings Bridge in Melbourne,
Australia in 1962. References ( 1 ) and ( 2 ) and ( 3 ) give details of·
the failure.
Although brittle failures sometimes occur in structures other
than ships and.bridges, the majority of service failures are those in
ships. The subject of ship failures began to become important in the
period between 1939 and 1945 when welded tankers began to fail in an
alarming number.
3.
This was the period during World War II when welding was first
coming into use in the construction of large ships. This was also a
period where accelerated construction was needed and the quality of weld
desired was hampered by the lack of skill~d welders. The alarming-, .- ~. ... .~.-
number of failures that occurred at the same time welding was first used
on ships cast quite a shadow as to the r~liability of welding in large
structures.
Although many of the failures were caused due to weld defects
and incorrect welding procedures, it was shown that many factors were
involved. For instance, the punching of holes for rivets was shown to·
be a potential crack initiator. Whether welded or riveted, construction
is'involved, the design and workmanship are the most important factors
in the construction of large structures to avoid brittle fracture.
Since brittle failures in mild steels were first recognized,
extensive studies have been undertaken in the United States and through-
out the world. This research into the brittle fracture problem may be
divided into three main chronological phases. The first of these
phases began with the study of defective welds and residual stresses.
Next came the investigations concerning notch effects along with
external variables such as temperature and strain rate effects. Finally,
a third phase in which the actual, properties of the steel, both
geometrical and. metallurgical, were investigated to find the resistance
to brittle fracture initiation and propagation.
To undergo thes~ extensive studies into the brittle fracture
problem, it was necessary to organize several la~ge resea~cl1.~~c:>Jec~~
throughout the country. Much of the work of these large projects has
been assigned to universities with suitable facilities. Other parts of
4.
the projects are being carri~d out in industrial and governmental
·laboratories. These investigations have required cooperation betwen
the government, steel industries, welding industries as well as the in
dividual designer.
One of these projects was started at Lehigh University.
Under the direction of the Ship Steel Committee, Project SR-162 has been
started using both ~he Civil and Metallurgical Engineering Department
facilities available. The title of the project is "Selection of Steels
for Heavy-Section Ship Plates." It is under the sponsorship of the
National Academy of Science, National Research Council with funds from
the Bureau of Ships, Department of the Navy.
Phase I of the project was established to obtain information
concerning the geometric effects of heavy ptate on brittle fracture. To
obtain this information, several types of tests were performed using a
variety of loading conditions, specimen sizes, and specimen shapes. The
purpose was to try to find an adequate testing method that would give re
sults displaying the same characteristics as a heavy-section ship plate.
Along with the testing method, a standardized specimen with dimensions
that would be geometrically sufficient to display the characteristics of
heavy ship plate was seeked.
Such a test and specimen woulci'beused in the selection of an
"optimum steel". An optimum steel would be a steel that would provide a
sufficient strength, be easily weldable, and b~ tough in its resistance
to brittle fracture.
The purpose of this paper is to explain some of the problems
that have been investigated in an experimental study into the brittle
fracture aspects of the selection of steels for heavy section ship plates.
5.
For further reading on the subject of brittle fracture, several excellent
texts have been written, as, for example, references ( 1 ), ( 2 ), and
( 4 ).
6.
II. BRITTLE FRACTURE THEORY
A. FRACTURE TERMINOLOGY
Fracture may be defined as the separation of a continuous body
into two or more parts due to an induced stress. The terminology used
today has led to some confusion and misuse of the words describing
fracture.
Basically there are three main classifications of fracture
description. These describe fracture by its behavior before separation.
by the appearance of the fracture surface. or by the fracture mechanism.
The most familiar yet probably most misused terminology is that
of using the words ductile or brittle in describing a type of fracture.
This is a classification that should be used to describe the behavior of
a material prior to its separation. A "brittle" material should signify
the complete absence of plastic flow. a condition which is rarely met.
Brittle. now in its general sense. signifies a fracture which has very
little or no plastic flow before separation. Ductile refers to consider
able plastic flow. To separate the two is a matter of arbitrarily selec
ting a dividing line. or rather selecting the amount of plastic flow that
is considered insignificant enough to be called brittle.
The fracture appearance method of identifying" fracture is
probably the best method for describing fracture since only two types of
appearance occur. The surface appearance may be denoted as either fibrous
or crystalline. The fibrous (or silky) fracture has a dull grey appearance
on the fracture surface. The crystalline fracture. sometimes denoted as
granular or faceted. has a brighter and smoother type appearance.
Fracture appearance may be distinguished by microscopic examination of
the amount of light reflected from the fracture surface. For most cases
7.
the two may be distinguished by general observation. This method although
easy to distinguish gives no information on the extent of plastic flow or
the fracture mechanism.
The fracture mechanism is probably the most precise method ofI
fracture description. This type is determined by meta110graphic examin-
ation of the planes or set of planes across which the atomic bonding is
broken. The mechanism may be either of a shear or cleavage mode. The
shear mode is that when the fracture occurs on slip planes usually pro-
meted by the action of shearing stresses. (The slip planes associated
with the shear mode are those identified by Miller indices as ~11~ slip
planes for the body centered cubic iron.)
The cleavage mode of fracture is caused by normal stresses.
(This type of fracture occurs on an entirely different crystallographic
plane (100 family).) This classification, however, yields no information
about either the fracture appearance or the prior behavior.
Therefore, if one remembers that "ductile" and "brittle" des-
cribe the ability to plastically flow, "fibrous" and "crystalline" des-
cribe the fracture surface, and "shear" and "cleavage" describe the way
or mechanism of fracture, a clearer understanding of the fracture ter-
mino10gy will be made.
For the tests in the experimental program fibrous, ductile, and
shear are often used synonymously. In otherwords, the ductile specimen
fractured by shear and exhibited a fibrous surface appearance. On the
other hand the brittle specimens fractured by cleavage and exhibited a
crystalline surface appearance. Fracture tests, other than the van der
Veen test would not always give a relationship such as this.
8.
B. STRESS SYSTEM
To understand the stress system involved in fracture, it is
important to know the stress requirements necessary for plastic flow.
Plastic flow is dependent on the action of shearing stresses. A brittle
behavior or cleavage type failure would be caused by high tensile
stresses rather than by shear.
Therefore, by varying the ratio of shearing stress to normal
stress, a material may be made to fracture in either a ductile or
brittle manner. In order to insure safety against brittle fracture, it
is important to obtain a high shear stress to normal stress ratio1.
For the purpose of this investigation, a sharp notch was used
to promote a system of triaxial stresses. In this triaxial system, high
tensile stresses and low shear stresses exist. Thus by promoting a low
shear stress to normal stress ratio a normally ductile material can be
made to fracture in a brittle manner. (Chapter V discusses the notch
effect further.)
To define the state of stress of a material at a certain
time, the true stress-strain curves must be used. These may be cal-
culated under normal uniaxial loading conditions. To define the state
of stress for a stressed material under combined loading or in the pre-
sence of a severe notch is a complex matter and is beyond the scope of this
paper.
It is, however, important to realize that where low ratios....
of shear stress to normal stress exist, there is a tendency for the
material not to flow plastically, as usual. Therefore where extremely
high and localized tensile stresses are prevalent, the possibility of
cleavage or ~rittle failure may exist.
9.
It is important for the designer to watch not only the possi
bility of high localized tensile areas, but also to watch for any con
dition that might restrict plastic flow. Plastic flow is necessary for
ductile behavior and any obstruct~on restricting the amount of flow would
be considered a hindrance to the ductility and a promoter of brittle
fracture.
C. TRANSITION TEMPERATURE
To understand the behavior of steel due to varying tempera
tures, it is important to understand the meaning of the term "transi
tion temperature". This term without a description of the criteria of
evaluation is completely meaningless. ,ITransition temperatures may be that of the ductility criterion,
fracture appearance criterion, or energy criterion.
The fracture appearance criterion, ~s, as the name implies,
that temperature where a visual change in the fracture surface is seen.
This is seen when the rough darker surface of shear failure changes to
the lighter and more c.rystalline'like fracture associated with a cleavage
failure. For the van der Veen and Bagsar tests conducted, it has been
the practice to use a 50% shear depth as the fracture appearance criterion.
The 8 mm shear depth criteria was also used, but was later found to be
non-effective in comparison of specimens of various heights. This
criterion may also be considered the criterion based on the amount of
crack propagation.
The ductility criterion is a criterion used in describing a
material as it loses its property of ductility. In referring to a notched
specimen or structure, it is the criterion based on the amount of plastic
10.
deformation that occurs before crack propagation and extension. This
criteria is concerned with fracture initiation and may be considered the
temperature below which a brittle crack will initiate with very little
plastic deformation. This criterion, which is always lower than the
fracture appearance criteria, may be measured in terms of amount con
tracted (or expanded) or relative percentages of contraction (or
expansion). In the van der Veen and Bagsar tests» lateral contraction
measurements can be made with little trouble. The 2% lateral contract'ion
ductility criterion has been found to be the best ductility criterion
for the van der Veen test. In the Charpy test the ductility. transition
criterion is defined at a certain number of mils of lateral expansion.
The energy absorption criterion is a criterion used on~some
of the,impact type tests. It is used expecially in the Charpy impact
test where a noticable drop in energy occurs at a certain temperature.
Measurements of energy absorption are found in force-length units.
D. MATERIAL EFFECTS
One of the most important factors that influence brittle
behavior is that of material. Chemical composition and grain size are
the two main variables of the material.
Since the purpose of this paper does not cover the scope of
the metallurgical factors, only the above two variables will be
mentioned.
An increase in carbon content and a decrease in manganese will
promote susceptibility to brittle fracture. The ratio of carbon to
manganese is an important consideration and is limited by ship-building
standards.
An increase in grain size promotes brittle fracture. Grain
size changes are brought about chiefly by heat treatment processes.
11.
12.
III. TESTING PROGRAM
In order to find a suitable test in the selection of the
optimum steel it was necessary to try various tests using various loading
conditions. There are many different tests for evaluating brittle
strength, we1dabi1ity and resistance. There is no standard test that
will give results corresponding identically to those conditions found
in actual service. Reference (5) gives a brief summary or information
on some of the most popular brittle fracture tests.
It would not be feasible to run all of these tests on a pro
ject such as the one described here. Therefore as a preliminary, three
different testing methods were selected to provide a variety of loading
conditions. The van der Veen test was studied as a slow bend test using
a single concentrated load. The Bagsar test was introduced as a com
bination tensile and bending test. Finally, the drop-weight test was
used as an impact loading type pf test. In each of these tests, the
geometry of the specimen was varied so that both specimen size and
loading could be compared.
A. TYPES OF STEEL
Three main types of steel have so far been used in the experi
mental program. One steel company supplied plates from two heats of
ABS Class C normalized steel in the 3/4, 1, 1-1/2, 2, and 3 inch plate
thickness. Another supplied a single heat of "T-1" quenched and
tempered steel in the 1/2, 3/4, 1, and 2 inch plate thickness. A third
steel company furnished a single heat of LT-75 steel in the normalized,
quenched, and quenched and tempered conditions. Plates of 1, 2, and 4
inches of each treatment were supplied by the third steel company.
13.
For convenience, the chemical analyses, heat treatments, and
mechanical properties of the steels are given in Tables (1) through (8).
B. FRACTURE TESTS
1. Drop Weight Test
The Naval Research Laboratory drop-weight test is an impact
type test used in investigating the conditions for initiation of brittle
fracture in structural steels. By using this test the nil-ductility
transition (NDT) temperature is found. Reference (6) can be used as a
good guide for drop-weight testing.
The test consists of a small rectangular beam placed over two
supports aligned in such a way that the tup of a certain weight may str~ke
it centrally when dropped through a certain vertical distance. Figure (1)
will show a typical drop weight arrangement and specimen.
E_ach specimen is made to be 3 1/2" in width with the plate
thickness as the height. The longitudinal axis is cut in the direction
of rolling with varying lengths depending on the span being used. The
specimens were cut in the rolling direction for consistency and to
eliminate the possibilities of error.
Along the longitudinal axis in the center of the specimen a
hard weld bead is placed to serve as a source of crack initiation. The
surface of the steel is always cleared of scale in the area where the
weld bead is placed.
The weld bead was made with 3/16" diameter Murex Hardex N
electrodes. The bead was moderately high-crowned and was made approxi
mately 2-1/2" in length and 1/2" in width. The appearance of the bead
was determined by the amperage, arc voltage, and travel speed. In all
cases 22 volts and 180-200 amperes were used. Travel speeds of 5 inches
14.
per minute were used except in the case of the thinnest plate (3/4"). A
travel speed of 8 inches per minute was used on the thin plate to obtain
the desired weld bead hardness. The hardness in all cases was required to
fall between 40-45 Rockwell C.
After the bead had cooled a 45 0 angle cutter with a radius of
0.010" was used to machine a notch perpendicular to the axis of the bead.
This notch was machined to a depth such that the base of the notch was
0.070" above the specimen surface. The notch served to initiate a brittle
fracture in the weld bead so it would propagate into the specimen.
The supporting jig was made in such a way that the span length
could be varied. Stops were not used in the present series of tests.
'~_ This was a modification to the standard NRL test.) The specimens were/
,aligned onc'e they had been cooled to the ~aesire_!i temperature. Baths of
alchol and dry ice were used to cool the specimens in all the fracture
tests. For temperatures below -1000 F, baths of methyl butane with
, liquid nitrogen additions were used. In both the drop weight and van der
Veen tests, the specimens were removed from the bath and placed on the
testing jig in a matter of 10-15 seconds. The specimen is believed to
warm up only a few degrees during this short period of time.
After the specimen was aligned, a predetermined weight was
dropped through a free vertical distance giving the desired impact energy.
To determine the impact energy needed for each series several preliminary
tests were run at room temperature. In these tests the weight and dis-
tance of fall were varied until the desired energy was found that would
produce a minimum crack opening at the base of the notch of at least 0.015"
with a 30 bend angle at the center. The crack opening was measured with a
Brine1l Scope. This energy was therefore considered the energy necessary
to cause a brittle ~rack at room temperature in the hard weld bead. As the
15.
temperature of the specimens were lowered, the crack initiated in the
weld bead was propagated by the test specimen.
With the weld bead on the underside of the specimen one of two
results could be obtained as the weight struck the top of the specimen.
A specimen would either break (a "GO" specimen) or it would not bre,.k
( a "NO GO" specimen). The specimen was considered broken when the
brittle crack had propagated to one or both edges of the tensile
(underside) surface. When the crack did not propagate to at least one
edge, it was considered unbroken. No side cracking was observed without
the crack across the tensile surf~ce.
Specimens were tested in 100 F intervals until both a broken
and unbroken specimen had been found. Duplicate specimens were then
tested in the transition range until the nil-ductility transition
temperature was found.
According to Naval Research Laboratory standards,(Ref. 6) the
nil-ductility transition temperature is defined as the temperature at
which a specimen is considered broken provided duplicate specimens would
. 0not be broken at a temperature 10 F higher.
The tests run at Lehigh for the most part were run on the ABS-C
steel previously described. The NDT was determined for varying thicknesses
of the plate. This was essentially the only criteria that was obtained
and may be considered one of the fracture appearance criteria. The only
geometrical variation that was used other than the varying plate thick-
ness was that of varying span length.
Although .the drop weight test was not considered as the m~st
suitable of the three brittle fracture tests run by the investigators,
its popularity among ship builders is growing. ASTM specifications have
16.
been written and will soon probably be a required test for ship steel.
The most recent trend is to have a standard thickness of one inch being
split from a larger plate. This would give a better means of comparison
among the steels.
At present, drop weight tes~s are also being carried out on the
LT-75 steel in conjunction with the van der Veen test. It is thought
that possibly with sufficient testing the drop weight data may perhaps
give a definite relationship to the Charpy data. Tables (9) and (10)
give the results of the tests run so far.
2. The Van Der Veen Test
This test is essentially a slow bend test in which a concen
trated load is applied directly above the midpoint of a sharply notched
beam. The two main criteria of this test are the 50% fibrous and the 2%
lateral contraction transition temperatures. For a detailed description
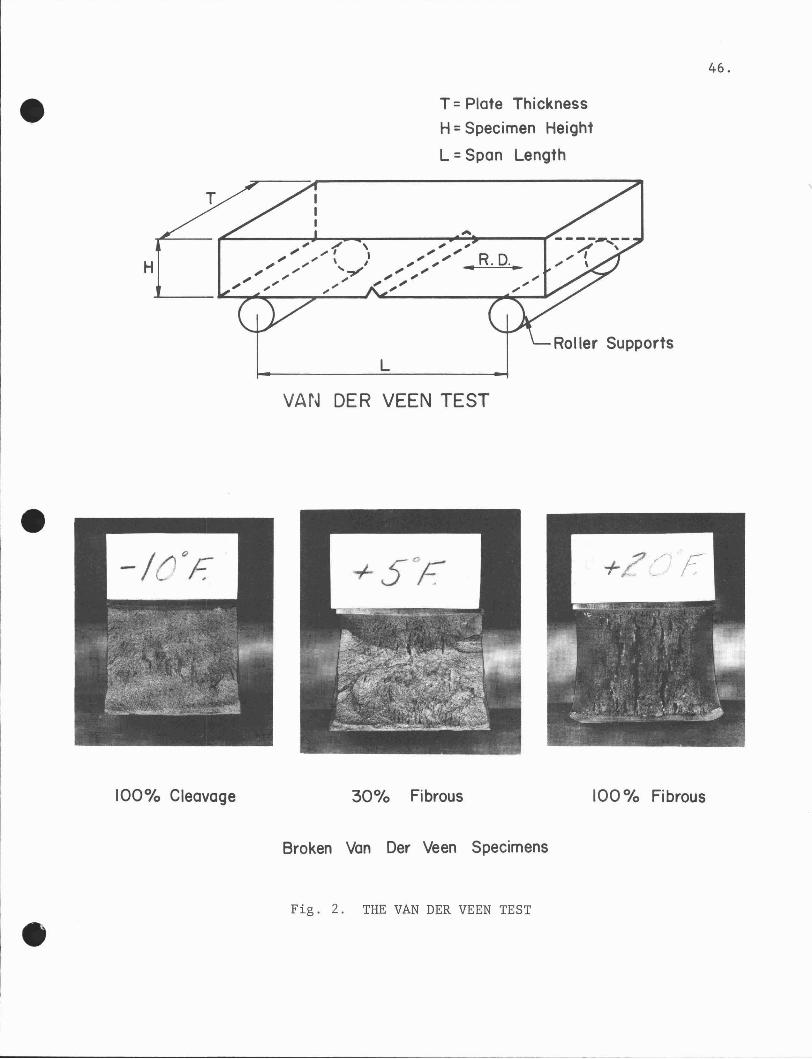
see references (7) and (8). See fig. (2) for a sketch of the equipment
of this test. The van der Veen data is given in tables (11), (12), and
(13) .
3. The Bagsar Test
This test consists of the loading of a U-shaped specimen in
tension using an eccentric loading pattern thus creating bending as well
as tension stresses at the apex of a sharp notch. For a detailed des
cription see references (7) and (8)', See also Fig. (3). All Bagsar
data is given in table (14),
4. Charpy Test
a. ,Jl.rocedure
In conjunction with the three tests mentioned, the Charpy test
was run on all plates to evaluate the effect of varying metallurgy among
17.
the plate thicknesses. These results led to correction factors for the
other three tests in order that the geometrical effect may be evaluated
with the minimum presence of metallurgical variables. Three types of
criteria could be evaluated from this test, that of fracture appearance,
energy absorbed, and ductility. Figure (4) gives a sketch of the
specimen set up and dimensions. For further information see references
(9) and (10).
The Charpy specimen consists of a rectangular bar cut from a
specified depth within a plate thickness. In general with the exception
of a Charpy survey run on the LT-75 steel, the specimens were cut from
the 1/4 height with the length oriented in the rolling direction.
V-notch Charpy specimens were used in all cases. This con
sists of a small bar 55 mn (2.165") in length with a height and width
of 10 tum (0.394") each. The notch was machined to a 2 ~ (0.079")
depth using a 450 angle cutter with a notch radius of 0.25 mn. (0.010").
After a cooling operation using a1cho1 and dry ice or methyl
butane and liquid nitrogen for obtaining very low temper~tures, the spec
imen was removed with a special prong. Using this device the Charpy bar
was placed in the impact machine so that the notch was opposite the side
being hit. A catch released the pendulum and allowed it to swing and
strike the specimen. The machine registered the energy absorbed by the
specimen by measuring the height the pendulum had risen after breaking
the specimen.
Generally, 15 specimens were run per series. This lead to 5
different criteria in each series. These were the 50% fibrous transition
temperature, the 10 and 15 ft. lb. transition temperatures, and the 15 and
20 mil lateral expansion transition temperatures.
18.
Although the main purpose of Charpy testing is to evaluate the
notch toughness of a material, it in itself is not useful for evaluating
the geometry of large plates. Since the standard Charpy specimen is only
.394" thick, it could only be used to evaluate the geometrical effect of
a plate .394" thick. This makes the Charpy test a test that would
determine only the metallurgical effect of thickness. V-notch Charpy
values for the three steels are given in tables (15), (16), and (17).
b. Survey Results
Since the overall aim in the testing program was to
evaluate the characteristics that a large plate would display, it was
necessary to select a location for taking the Charpy specimens that
would give the best overall characteristics of the plate. A special
survey was therefore run to evaluate notch toughness variance for large
plates. The tests were run on two different heat treatments of LT-75
steel. The results are shown in Table (17). In this survey, specimens
were taken from the center and edge sections of the plate. From each
section series were taken from the surface and the 1/4 thickness.
It can ben seen from the results that the one inch plates
showed good uniformity of toughness at all of the positions under examin
ation. The two inch plates also showed the same uniformity with the
exception of lower transition temperatures observed in the edge-quarter
thickness of the normalized plate. The four inch plates gave approx
imately the same results for the 50% fibrous transition temperatures at
all positions. Based on the other criteria, the specimens indicated
better notch ductility when taken from the plate surface than from the
quarter thickness. There was no significant difference found by taking
the Charpy specimens from the center as compared to the edge.
19.
It can be summarized from the results that the LT-75 steel was
very uniform in its heat treatment and notch toughness. The results show
that there is very little variance in Charpy values taken from the dif
ferent P9s~tions. For future tests the quarter depth Charpy specimens
will be used. The position will probably vary depending on the par
ticular use of the test.
c. Correction Factors
The main purpose of using the Charpy test was to check on
metallurgical variations among the plate thicknesses. Therefore from
the Charpy results, a first order correction was found that would
minimize masking effects produced by metallurgical variables.
A correction factor was found by determining a deviation from
the temperature selected as a mean. The deviation from the mean of the
Charpy 50% fibrous transition temperature was used to correct the fracture
appearance criterion. Correspondingly, the Charpy 15 mil lateral expansion
transition temperature deviation was used as a ductility criterion cor
rection. The Charpy 15 mil lateral expansion transition temperature was
the ductility criterion transition temperature. It was determined by
measuring the amount of lateral expansion from the broken specimen com
pression face. Similarly the 10 mil lateral expansion was another cri
teria used in comparison.
The order and magnitude of the corrections applied are shown
in Table (18).
d. Reliability
There have been questions in the past as to the reliability
of the Charpy test. These tests have found wide acceptance and are
suitable for this particular use of valuating the metallurgical variations.
20.
To eliminate scatter it is important to use a well calibrated
machine. For the tests run in this investigation the same machine was
used for every test. Other factors such as machining of specimens,
temperature controlling, and placing of the specimen on the mount can
all cause varying results if done in a careless way.
The use of the results may be questionable. Although these
are only first order approximations, the results of the fracture tests
would not be altered appreciably. Of course, the reliability would de-
crease with extremely large differences, such as in the case of the
LT-75 quenched plates.
In view of the data found thus far it appears that the Charpy
test is suitable for a first order approximation of the masking effects
due to varying metallurgical properties among the plate thickness.
C. WELDABILITY TESTS
As a preliminary step in selecting an "optimum" steel, two
types of we1dabi1ity tests were run to determine the we1dabi1ity
characteristics of the LT-75 and the ABS-C1ass C steels.
1. The Battelle Test - The Battelle Test is a 10ngitudina1-
underbead cracking test. It was used strictly to evaluate underbead
cracking sensitivity. See Fig. (5).
Five specimens were run per series using a 1/8" diameter
E6010 electrode. The welding conditions were 100 amps, 24-26 volts
with a travel speed of lO"/min. Each specimen was welded in a bath of
owater at 70 F. The water was at a depth to 1/4" of the top surface of
the specimen.
The specimen after welding was left in the water for one minute
and then stored at 600 F for 24 hours. After storage, the specimens were
21.
then tempered at 11000 F for 1 hour.
After tempering, specimens were split in half longitudinally.
Underbead cracks were detected by magnetic particle inspection after
grinding through 3/0 paper and etching with 5% nital. The results of the
underbead cracking tests are shown in Table (19).
It can be seen from the results that the LT-75 was extremely
susceptible to underbead cracking when high-hydrogen electrodes were
used. The high cracking level of the LT-75 can be explained by the high
carbon equivalent of the steel. In the case of a special small plate of
normalized LT-75 steel with 0.12% C, a cracking tendency between that of
the ABS Class C and the 0.17% C ~T-75 was found. From previous experience,
a steel with only 21% cracking would not present any cracking problem
in production welding.
The ABS Class C steel shows a high resistance to cracking in
the Battelle test. This conforms to results found in practical experi-
ence.
2. Lehigh Restraint Test - Lehigh Restraint Tests were run
initially to measure susceptibility to cracking in welds deposited with
~
a low hydrogen electrode. See Fig. (6) for specimen dimensions.
The restraint specimens were welded with 3/16" diameter
electrodes. Initially the low hydrogen iron powder electrodes were
obaked at 360 F before use. The conditions of welding were 200 amps,
22 volts, with a travel speed of lO"/minute.
In these specimens the sensitivity to cracking of weld metal
or heat-affected zone can be evaluated. A restraint is placed on the
weld zone and can be varied by cutting slits into the edges of the specimen
thus lowering the restraint. The degree of restraint is expressed as the
width of specimen between slits on opposite sides.
22.
It was found that the LT-75 steel welded with E80l8 electrodes
resisted cracking at the highest restraint available. This was found
for 1" and 2" plates in both the normalized and quenched and tempered
conditions.
After no cracking was found using the low hydrogen electrodes,
an E60l0 electrode was used. The same welding conditions were used as
before.
Results from the tests are shown in table (20). Here it can
be seen that the low carbon LT-75 cracks more readily than the ABS-Class
C, but cracking is found in the weld metal. The higher carbon LT-75 shows
a greater cracking tendency, but the location of cracking shifts to the
heat affected zone rather than in the weld metal.
3. Conclussions of Weldability
From the tests run so far, it appears that the Lt-75 and
ABS-C steels could be welded safely using low hydrogen electrodes.
A comparison was made between the ABS-C and the two LT-75
compositions. It was shown that the ABS-C steel was superior to the
LT-75 steels. (Further conclussions on weldability will be made after
the explosion bulge series are performed.)
Low hydrogen electrodes are more expensive than the higher
hydrogen electrodes. Prebaking electrodes will be another problem that
will be faced by the welders. Shipyard welding tends to favor the use of
non-baked cellulose (higher hydrogen) electrodes. It would therefore be
desirable to find a steel that would easily be welded under present ship
yard practice.
D. FUTURE TESTING
From the experimental evidence found from the three main
fracture tests it appears that any of the methods could be used in the
23.
final phase of the project. A comparison of the tests may be seen in
Fig. (7).
The van der Veen t~st was chosen as the standard test for
selecting an "optimum" steel. The van der Veen test was selected for
its many advantages over the other tests. Its advantages are (1) it can
be applied to plates up to 4" thick without special equipment other than
a jig and a universal testing machine; (2) it can give a variety of
criteria in selecting a transition temperature; (3) it is free of heat
affected regions which may give a scattering of results such as is found
in the drop weight tests; (4) the specimens are easier to cut and pre-
pare than the other two tests.
In conjunction with the van der Veen tests, the usual Charpy
and a one inch split drop weight test will be run to allow a check on/
the metallurgical properties of the plates.
New steels, particularly those with a lower carbon content
may be selected to be tested in the future using the van der Veen test
as a standard. Besides giving good results in the van der Veen test, a
new steel would also have to pass certain weldability tests, among these
would be the explosion bulge test.
By passing these tests, having a tensile strength somewhere in
the range of 58-7~,OOO psi, and having certain chemical and metallurgical
properties, a steel might be found that will, in due time, be used in
large quantities for heavy sections of ship plate.
24.
IV. GEOMETRIC VARIATIONS ON BRITTLE BEHAVIOR
In selecting a suitable test for ship steel it is important
to realize that its resistance to brittle fracture is a function not
only of the metallurgical variables but of the specimen geometry as
well.
The initial phase of project SR-162 was aimed at determining
the geometrical effect of various sections as far as their effect on the
brittle behavior of steel was concerned. In determining the effect of
geometry it was necessary also to try and select a suitable fracture
test that would give results similar to those found on actual l~rge
ship plates.
It would be desirable to find a suitable steel that could be
used in larger thicknesses than the present limit of around 1 to 1-1/2
inches. When sections of larger thicknesses are needed, the present
practice of doubling or quilting by riveting is used.
Plates over 2" thick could be used in places such as the deck
or bottom if it was certain that the effect of thickness was not.
detrimental for a particular steel. Therefore before large scale usage
of thicker plates can take place, an indisputable and dependable
determination of the geometrical effect of thickness would have to be
found.
A. Effect of Plate Thickness - It has been reported by Akita (II)
using large Charpy bar~and by Parker (I) using wide plates that there!:;"
was no effect of plate thickness on transition temperature above one
inch.' However, results by Holiday (12,) using the Tipper Test, and by
Epstein (13) using the Bagsar test tend to show a continuing effect of
plate thickness on transition temperatures up to thicknesses of four inches.
25.
According to the results on the steel tested here at Lehigh
there appears to be a marked increase in. transition temperature from 1/2
up to 1-1/2 and 2 inches. After 2 inches the effect of thickness tends to
level off for the ABS-C steel. See figures (7) and (8). This behavior
can be seen also for van der Veen results in figure (9) for T-l steel.
In the case of T-l steel there seems to be a leveling off transition
temperature around one inch of thickness, not quite as much as for the
ABS-C normalized steel. Similarly, figure, (10) shows the same leveling
off effect for the normalized LT-75 steel. Here tests were run up to 4
inches thick. In the case of the normalized LT-75 it is shown that the
4" and 2" thicknesses varied only a very small amount while there was a
very marked increase from 1 to 2 inch plate thicknesses.
By looking again at Fig. (7) and (8) it can be seen that the
van der Veen test, Bagsar test, and drop weight tests showed general
agreement in their response to changes in plate thickness ranging from
3/4 to 3 inches. Smaller plates (below 3/4") could not be compared/as
tests below this thickness were run only by the van der Veen method.
It was therefore concluded and reported (Ref. 14) that the
dimensional effect of plate thickness, with metallurgical variables held
constant, was to raise the transition temperature markedly as the plate
thickness was increased from 1/2 to 1-1/2 inches. Above 2 inches, thick
ness appeared to have much less effect on the transition temperature ob
served in these sharply notched specimens. ABS-C, liT_I" and LT-75
steels behaved similarly in this respect.
It is important to note that such a statement does require
that metallurgical variables be held constant. Perhaps Epstein and
Holiday found only a metallurgical effect on their plates tested above
26.
2 inches. It would be interesting to learn if they could correct their
variances due to metallurgical properties and to see whether a leveling
off would occur in a manner such as seen in the tests run during this
experimental program.
The correction for metallurgical differences among the plate
thicknesses has been described. This requires accurate Charpy data and
becomes less reliable with large masking effects. The quenched and
tempered steels also may tend to level off when compensated for by appro
priate correction factors to compensate for the differences the metallur
gical properties found, The quenched plates could not be corrected within
reasonable amounts to compensate for the large variation in grain size
found throughout the thickness.
Although it has been suggested that up to 1-1/2" there is a
marked increase in transition temperature due to an increase in thick~
ness, it might be presumed that this would hold true for all steels.
However, it is believed by the author that each different type of steel
would probably have a different leveling off temperature for thicknesses
ranging from one to two inches. The earlier leveling off of the "t-l"
may indicate that certain higher strength steels may level off at a
thinner thickness. Of course this effect would be caused due to the
varying metallurgical properties among the different steels.
Another interesting factor would be to note that, in the case
of the ABS-Class C and "T-l" steels, the ductility transition temperature
tends to level off at a smaller thickness than the fracture appearance
transition temperatures, This cannot be seen from the limited data of
the LT-75 plate. If thicknesses between 1" and 2" of LT-75 had been
tested, probably they too would have shown similar results.
27.
The complexity involved in calculating the brittle character-
istics could not be a function of geometry and a function of the
metallurgical properties alone. There must be a third function, that
being an interrelationship relating the geometrical and metallurgical
properties.
Intergranular strain resistance and grain size differences are
to be found among the steels. This would bring in the reasoning that a
material of different yield strength would fracture differently under a
given system of triaxial stresses.
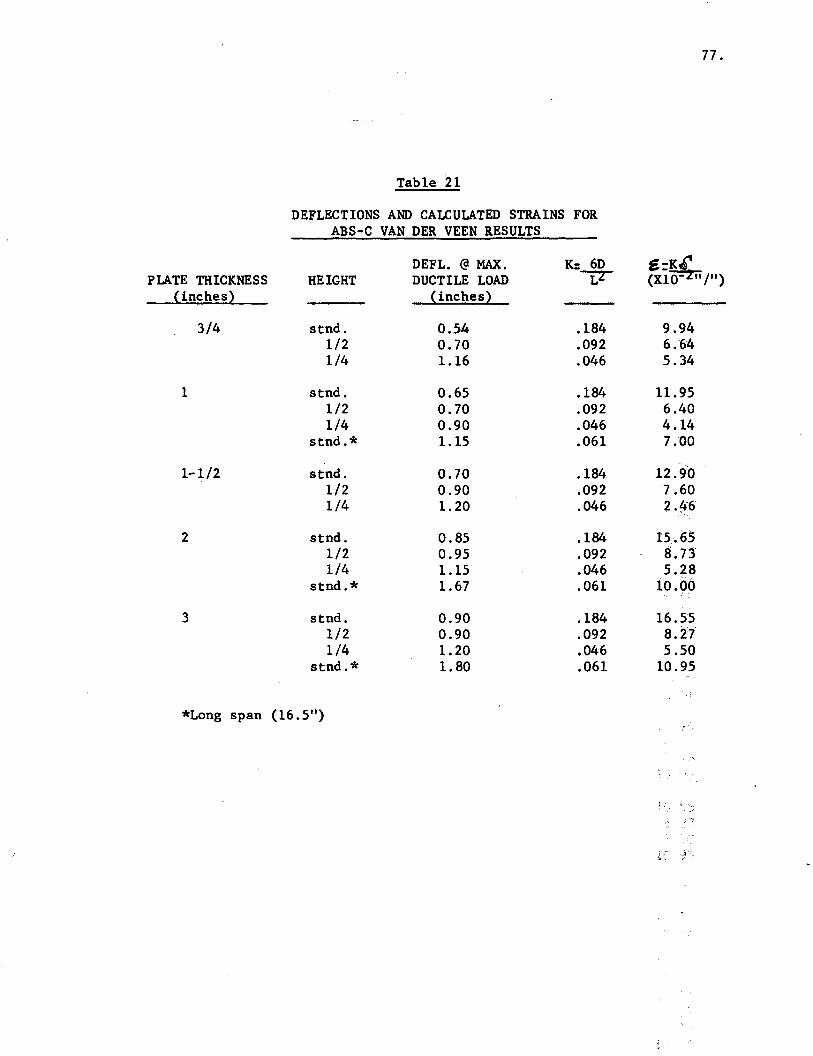
In additional support to indicate that specimen thicknesses
above two inches show little geometrical effect, a plot of elastic
breaking strain to specimen thickness was made. The values were calcu-
lated using an elastic method of analysis on the deflections observed at
maximum load in the van der Veen test. The effect of the notch was
neglected and the specimens were analyzed as simple beams with a single
concentrated load.
For an elastic analysis of a simple beam:
PL3
48EI0" = Mc
IE=
where:
~= vertical deflection at center
P • load applied
L = span length
E = elastic modulus
I = moment of inertia
oJ= bending stress
E = bending strain
H = specimen height
Since C;; - Mc and M =+for simple beam c = H/2- r-.
d = Pl H/24 I
oJ : PLH81
with e = diE
then E = PLH8EI
From ~ : PL3P 48EI
48EI = L3
28 ..
•• • E = --!ili...
8EI =¥LE : K~ where K =
= .184K for standard height and span = 6.276"(9.5")2
K for half height and standard span = 0.092
K for quarter height and standard span: 0.046
K for standard height and 16.5" span: 0.061
Table (21) shows the values used and calculated for Fig. (11).
It is suggested that two inches may be the thickness where a
leveling off of most steels will take place. This can be said for the
steels tested so far on project SR-162 when compensation is made for the
metallurgical differences. Thus by taking two inches as the optimum
thickness above which the plate thickness will have little effect on the
transition temperature, a safe estimate will be obtained.
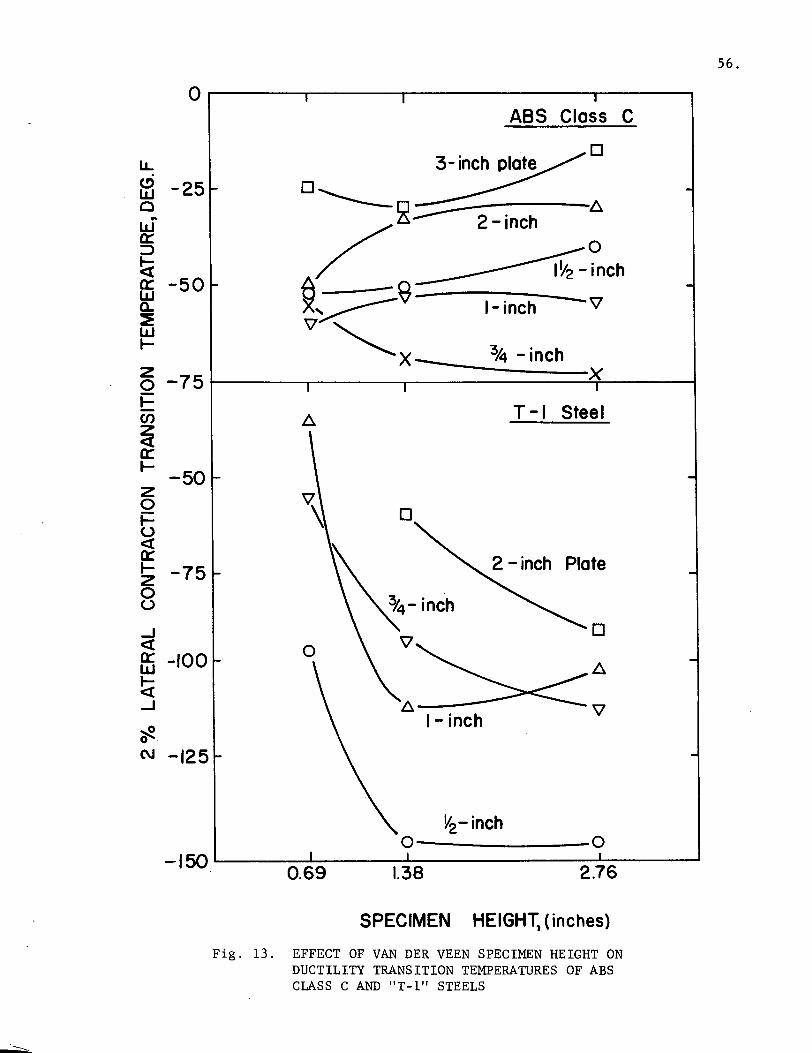
B. Effect of Specimen Height - It can be seen from Fig. (12), (13),
and (14) that the effect of specimen height on the fracture appearance
29.
and ductility transition temperatures in the van der Veen test is re1a-
tive1y small when resorting to heights between the standard and half
height specimens.
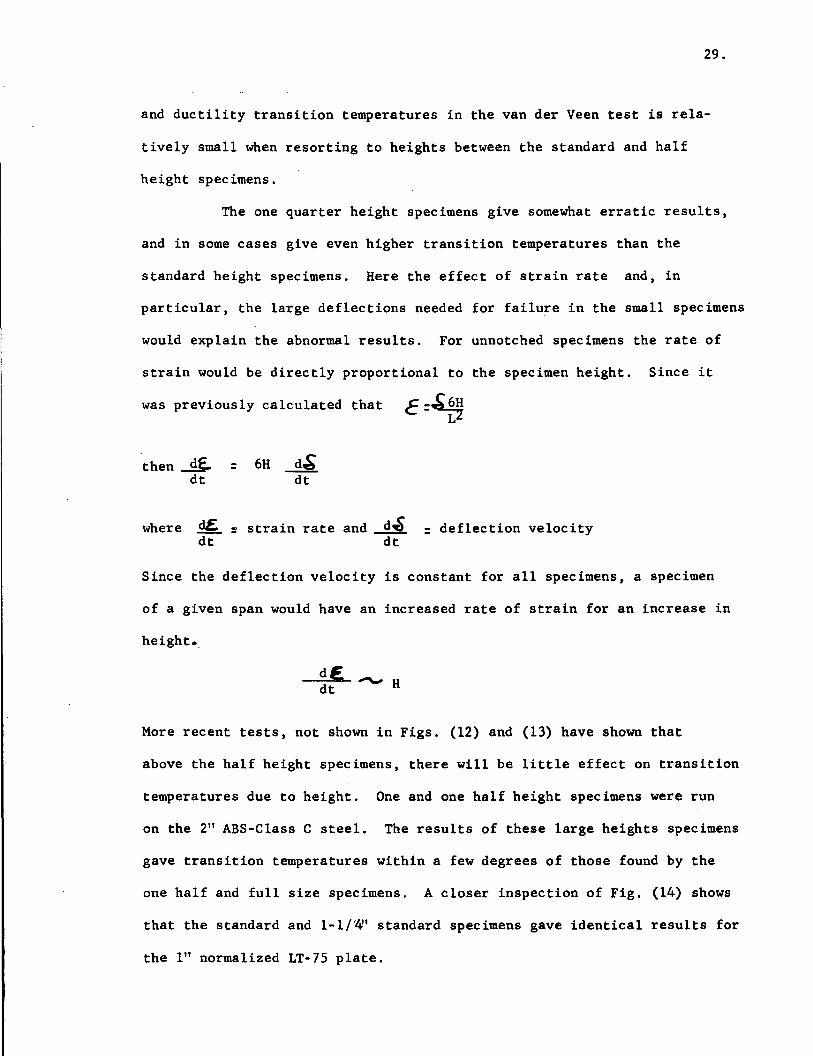
The one quarter height specimens give somewhat erratic results,
and in some cases give even higher transition temperatures than the
standard height specimens. Here the effect of strain rate and, in
particular, the large deflections needed for failure in the small specimens
would explain the abnormal results. For unnotched specimens the rate of
strain would be directly proportional to the specimen height. Since it
was previous 1y calculated that C :.& ~~
then dE.dt
= 6H d.&dt
where d£dt
= strain rate and d~dt
: deflection velocity
Since the deflection velocity is constant for all specimens, a specimen
of a given span would have an increased rate of strain for an increase in
height.
dE:dt
More recent tests, not shown in Figs. (12) and (13) have shown that
above the half height specimens, there will be little effect on transition
temperatures due to height. One and one half height specimens were run
on the 2" ABS-C1ass C steel. The results of these large heights specimens
gave transition temperatures within a few degrees of those found by the
one half and full size specimens. A closer inspection of Fig. (14) shows
that the standard and 1-1/'lf' standard specimens gave identical results for
the 1" normalized LT-75 plate.
30.
Since little geometrical effect is given by specimens over
1.38", it is relatively safe to assume that the standard specimen (2.76")
is of sufficient size to eliminate the possibility of a specimen height
variable in the van der Veen test.
C. Effect of Specimen Span Length - Although the length of specimen
was not varied in the Bagsar test, Fig. (15) shows the relationship between,
fracture transition temperature and the length of span in the other two
tests.
It can be said that an increase of span generally lowered
fracture transition temperatures in the drop weight and van der Veen tests.
The results, however, are not very consistent and a definite relationship
could not be established.
The 9.5" span was the primary span used on most of the tests
and is considered adequate for future van der Veen testing. The 12"
span was selected as a standard span for all future drop weight tests.
D. Interrelationship of Dimensions - None of the geometric
dimensions of a test specimen independently affect specimen behavior.
There is, however, an interrelationship between the height, width, and
length. The stress system at the notch and the strain rate are all
affected by each dimension.
In view of the data found, it can be said that the size effects
of sharply notched specimens become relatively small when both the width
and depth dimensions are increased beyond two inches.
Therefore, from these results found, with the van der Veen
test being selected as the main future test, span lengths will be held
constant at 9.5", specimen heights will be 2.7611, and the width will be
the plate thickness.
31.
These may be considered "infinite" specimen dimensions in view
of the data found. There should be little relative error in making this
a standard.
32.
V. VAN DER VEEN TEST VARIABLES
A. TEMPERATURE EFFECT
Temperature is the most prominent variable in the van der Veen
test. After specimens have been cut and notched, it is a matter of ad
justing the temperature to get data where the various criteria nay be
evaluated. As temperature is lowered, the tendency for brittleness in
creases. Figure (16) has shown that the % fibrous surface decreases
with a lowering of temperature and also that the amount of lateral
contraction decreases with a lowering temperature.
1. Effect of Yield Stress
It can be said that for iron and steel, the yield strength will
be increased with a decrease in temperature. Thus, by lowering the
temperature the yield stress would approach the fracture stress and give
much less room for yielding to occur before failure.
The effect of temperature on the yield stress is brought into
a convenient range for testing by means of the sharp notch. It is
important to realize that temperatures would be only one of the factors
involved in altering the yield stress in the fracture tests.
2. Differences Between the Steels
It can be seen in Tables (9) through (17) that different
transition temperatures are given for the various steels presented.
Table (22) can be used as a good comparison.
In comparing the heat treatments given to steels, it is known
that the most significant effect on the transition temperature would be
the difference in grain size and microstructure. These are brought about
by varying the cooling rates and chemical composition, and all are very
important considerations in comparing the steels.
33.
Although it is not the purpose,of this paper to discuss the
metallurgical aspects, it is important to remember that the grain size
and the microstructure of the steel are the primary considerations.
Much work has been done on project SR-162 in studying the
effect of heat treatment in resisting brittle fracture. It is desirable
to obtain a suitable steel that will display good toughness with the
minimum cost for production in large quantities.
Alloy steels generally are more expensive as the amounts of
alloys are increased. Some of these alloys tend to help resist brittle
fracture where others tend to promote it. Upper and lower limits of these
alloys have already been established to an acceptable degree. For most
parts we may restrict ourselves to limiting the carbon manganese ratio
within certain limits.
At present the use of higher strength steels in large sections
is scarce. More research and studies into the cost problem will have to
take place. It is doubtful that a large use of higher strength steels
will take place in the near future for ships.
Although there are numerous steels that will probably give good
results, it will be some time before even an "optimum steel" will be
accepted and used in large quantities.
3. Transition Temperature Scatter
As previously discussed, the 50% fibrous and 2% lateral contrac
tion criteria seemed to give the most consistent results for the van der Veen
test. Table (11) gives some results found using the initial criteria
investigated.
The fracture appearance criterion seems to be the most reliable
means of evaluating transition temperature. The ductility data is a little
34.
more varied and seems to have more scatter than the fracture appearance
criteria. Since the fracture appearance is always the higher of the two
transition temperatures it will probably be the one most frequently
referred to in the future.
An attempt was made to calculate curves for the various tests
run in the project. The fracture appearance transition curves generally
follow a gompertz, a broad "S" shaped pattern, while the ductility
transition temperatures do not tend to form a generalized form. (See
Fig. 16). In all data reported/curves were not by equations. It would
be reasonable to say that the transition temperatures for the van der Veen
test on project SR-162 so far would not vary more than ~ lSo F for the-fracture appea~ance criteria or more than~ 200 F for the ductility
criterion. It may however be found that for future steels to be tested
that this variation may change a little with the ,type of steel. With
more investigations and tests run evaluating and standardizing a
specimen a ± 100 F accuracy probably will be found.
B. STRAIN RATE
1. Effect on Yield Strength
The yield strength of most ferrous metals, particularly low
carbon steels, are increased by increasing the strain rate. An increase
in strain rate by certain orders of magnitude might even double or triple
the yield stress. Not only does the yield stress increase, but the ultimate
strength as well to a lesser degree. The effect of increasing strain rate
can be seen from figure (17). It is for this reason. that impact loading
would be a method of causing some materials to fail in a brittle
manner.
35.
Thus by increasing strain rate, the s~me effect can be brought
about as the lowering of temperature. In fact over certain ranges, there
seems to be an equivalence between strain rate and temperature. This
equivalence has been proven by Zener and Hollomon and is shown in reference
(1).
2. Effect on Transition Temperature
Strain rate has been known to have little effect on the fracture
appearance transition temperature - reference (1). This is based on the
fact that plastic flow requires time to initiate. The fracture appear-
ance criteria is concerned with the amount of crack propagation or extension.
However, in the case where strain aging ~ight occur there could be a
larger effect on th~ fracture criterion. This may be a cause for thought
in the van der Veen and Bagsar tests where a gradual change in properties
of material would be caused by some cold working such as the notching
procedure.
Thus by an understanding of what the transition temperatures
mean and realizing that plastic flow requires time to initiate, one can
understand why strain rate would have a greater effect on the ductility
transition temperature. The ductility transition temperature is concerned
with the amount of flow developed prior to initiation, and is therefore
dependent on the rate.
It must be remembered that an increase in rate of loading and
the influence of lowering the temperature both promote brittle fracture
only by the fact that these variables effect the yield stress.
3. Variations Due to Specimen Size
Cross head separation or rate of loading are not the only means
of changing the strain rate. Sharp notches also serve to increase the
strain rate.
36.
Without considering the effect of a notch, it was seen that in
the preceeding section strain rate is proportional to the depth and
inversely proportional to the square of the span length. Of course this
is in the elastic region and would be altered by the presence of a notch.
Even in the presence of a notch, strain rate would still be increased
to a certain limit with increasing specimen height. This was shown
in Fig. (12), (13), and (14) where the increase in specimen height
showed little effect when used above 2 inches.
The width of specimen would probably affect the triaxial
stress pattern more than it would the strain rate. Since the width
would also be the crack length it would have little if any effect on the
strain rate. Without a notch it was seen that the strain rate was not
directly dependent on width. Reference (15) will give information on
crack length.
In the case of the van der Veen test, the cross head separ
ation rates were held constant at approximately l"/minute. Even with
this constant corss head separation, strain rates were varied from
specimen to specimen due to the geometry variation. This is another
reason why standardization of specimen size and cross head separation
will have to take place before a more accurate correlation can be made.
C. NOTCH EFFECTS
1. Stress Concentration
The most frequent means of altering a stress configuration is
by introducing a notch. The notch serves as a stress raiser and has the
effect of localizing plastic flow producing triaxial stresses, and high
strain gradients.
37.
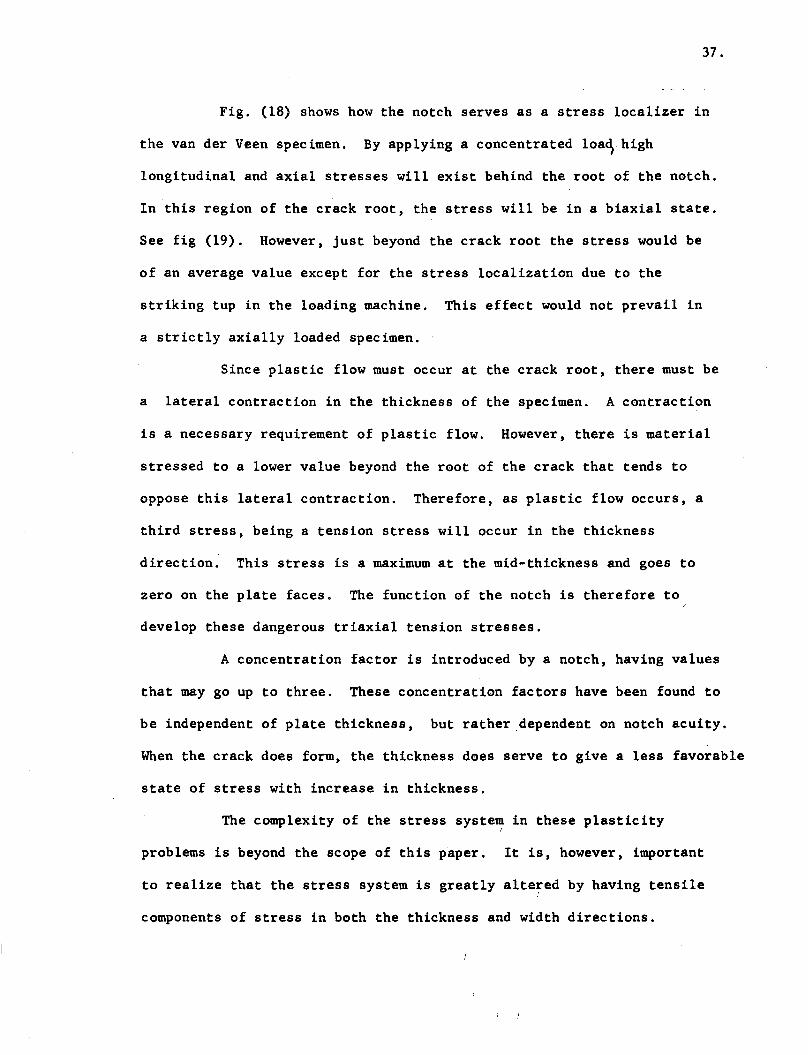
Fig. (18) shows how the notch serves as a stress localizer in
the van der Veen specimen. By applying a concentrated loa~high
longitudinal and axial stresses will exist behind the root of the notch.
In this region of the crack root, the stress will be in a biaxial state.
See fig (19). However, just beyond the crack root the stress would be
of an average value except for the stress localization due to the
striking tup in the loading machine. This effect would not prevail in
a strictly axially loaded specimen.
Since plastic flow must occur at the crack root, there must be
a lateral contraction in the thickness of the specimen. A contraction
is a necessary requirement of plastic flow. However, there is material
stressed to a lower value beyond the root of the crack that tends to
oppose this lateral contraction. Therefore, as plastic flow occurs, a
third stress, being a tension stress will occur in the thickness
direction. This stress is a maximum at the mid-thickness and goes to
zero on the plate faces. The function of the notch is therefore to
develop these dangerous triaxial tension stresses.
A concentration factor is introduced by a notch, having values
that may go up to three. These concentration factors have been found to
be independent of plate thickness, but rather dependent on notch acuity.
When the crack does form, the thickness does serve to give a less favorable
state of stress with increase in thickness.
The complexity of the stress system in these plasticityI
problems is beyond the scope of this paper. It is, however, important
to realize that the stress system is greatly altered by having tensile
components of stress in both the thickness and width directions.
38.
2. Notch Geometry
In the van der Veen test a standard 3 mm notch was pressed using
a hard tool steel dye with a very sharp radius of .0015" and 450 angle.
This was in conjunction with the reports of de Graaf and van der Veen (15).
In their tests, 1, 3, 5, and 8 mm specimens were tested and compared.
The 3 mm notch was chosen as it gave a less severe effect in the tendency
to start a crystalline fracture rather than a fibrous crack that would
propagate into a crystalline fracture.
Initially several series of van der Veen specimens were run
to see if an 8 mm notch could start a crystalline crack and be arrested
in a fibrous fracture mode in the compression zone of the specimen. This
effect was not found except in the case of the 8 mm half height one inch
normalized LT-75 series. In height series no fibrous thumbnail could be
measured from the root of the notch, but rather a cleavage thumbnail was
found instead. In these smaller specimens the energy involved in pro
pagating the crystalline crack was not enough to propagate the crack
through the compression zone.
It is believed that for specimens over two inches in height,
the regular fibrous to crystalline trend will continue except in the
case of an extremely deep notch.
In view of these initial 8 mm notch tests, a 16 mm notch
standard height specimen was studied to see if this effect would con
tinue. With these 16 mm notches, both a crystalline to fibrous trend
as well as the usual fibrous to ductile trend was observed within the
fracture appearance transition range. Further notch investigations
would probably prove valuable in determining the relationship between
notch geometry and specimen size.
39.
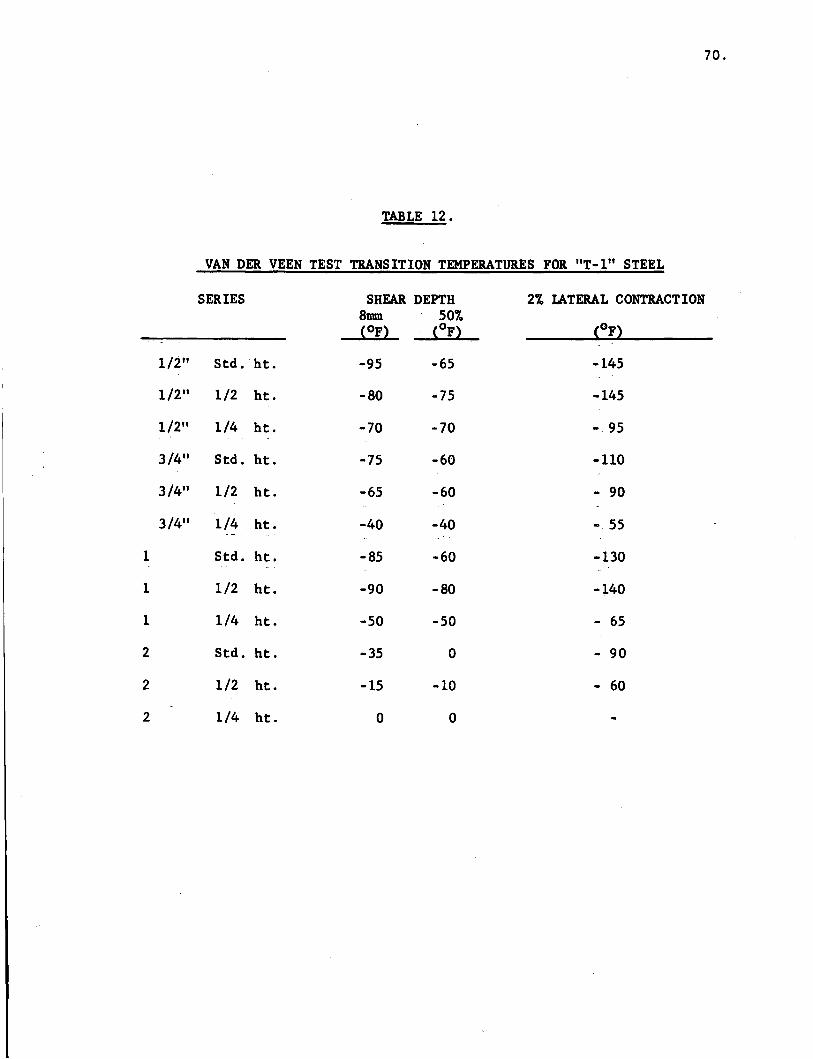
In view of the 3 notches investigated it can be said that as a
notch is made deeper, the tendency for a brittle failure would increase.
Table (13) has shown that the transition temperatures found using the 8 mm
and 16 rom notches did not, however vary a great deal from the transition
temper~tures found using the 3 rom notch. This was found to be the case,
particularly for the fracture appearance transition temperature.
It was interesting to note that in all cases where a deep
notch was used, the ductility transition temperature and fracture
appearance transition temperature were more in the same temperature range
than in series run using a 3 rom notch depth. If this were investigated
further and found to always be the case, a saving of specimens needed per
series could be made.
Also there is a tendency for the deeper notch specimens to
have a narrower transition range for the fracture appearance transition
temperature criterion. A sharp drop from 100% fibrous to 100% crystalline
appearance can be seen from the date found.' From this sharp drop, less
scatter is noticed using the deeper notches. This also would be a con
sideration that would reduce the number of specimens needed per series.
It is well known that the shapes and size of the notch plays
an important part for the Charpy specimens. It is, however, less certain
as to the effect notch geometry will have in the vander Veen test. As
a notch is made sharper or deeper, the strains become more localized, the
specimens develop higher strain rates, and the degree of triaxiality may
increase.
It is important to realize that the notch geometry would have
little effect on the fracture appearance criteria. The fracture appear
ance criterion in most cases is concerned with the propagation of a
40.
fibrous crack once it has already been initiated. The ductility criteria
on the other hand would be concerned with crack initiation and has been
found to vary with notch geometry changes more readily than the fracture
appearance criteria. This can be seen from the notch geometry tests.
Therefore, in the presence of the data found, it appears as
though a 3mm deep notch will be used for future tests. It is hoped, how
ever, that further investigations using notches deeper than the 3mm notch
will be performed. A substantial savings in the number of specimens re
quired, as well as more accurate results might be obtained.
3. Notch Aging
In the present series of tests, all specimens were notched
and tested within 24 hours. This was to eliminate the time factor
involved for the sharp notch to age. Strain aging is due to prior
co1dworking of a material, such as the pressing of notches in the
van der Veen test.
For the most part, all notches were pressed the entire depth.
In the case of the ''1-1'' steel, the notches were machined partially and
then pressed the rest of the way to preserve knife edges. Certain deep
notch specimens were partially drilled and machined, but no noted dif
ference was found to indicate that the method of notching had an effect.
Several series will be run in the near future to try and age
the notches so that a significant effect can be obtained.
41.
VI. SUMMARY
In the study of the brittle fracture problem it has been
necessary to evaluate geometrical characteristics on brittle behavior.
In doing this several testing methods have been used to evaluate this
geometrical effect.
After testing a variety of steels, conc1ussions could be made
on a comparative basis to select a steel that would be the most suitable
for heavy plate ship construction. Such a steel would be sufficiently
strong, be easily weldable, and be tough in its resistance to brittle
fracture. In particular a steel that could be used in thicknesses of
several inches would be desirable.
1. Three main steels have been tested in various thicknesses.
The results can be seen in tables (9)' through (14).
2. A brief description of testing methods has been given to develop
a clearer understanding. In particular, the drop weight, Charpy, Lehigh
restraint, and Battelle underbead cracking tests have been described.
A good description of the Bagsar and van der Veen test may be found in
Ref. (7).
3. The V-Notch Charpy test was used to evaluate metallurgical
differences among the plate thicknesses so that any masking effects could
be compensated for. The test itself cannot be used to evaluate the brittle
fracture characteristics of heavy plate.
4. We1dabi1ity tests have shown that the LT-75 and ABS-C steels
can be safely welded using low hydrogen electrodes. Further testing will
give mpre definite information as to the degree of we1dabi1ity with other
than low hydrogen electrodes.
42.
5. The geometrical effect of plate thickness, with metallurgical
variables held constant, was to raise the transition temperature appre
ciably as plate thickness was increased from 1/2 to 1-1/2 inches. Above 2
inches, thickness appears to have little effect on transition temperatures.
Figures (7), (8), (9), and (10) show this effect. Thickness up to 4" can
be tested with standard van der Veen aparatus.
6. The geometric effect of specimen height in the van der Veen
test is negligible when resorting to heights above 2 inches. Figures
(12), (13), and (14) show this effect found on all three steels. A
specimen of 2.76" will be used as a standard height in future van der Veen
tests.
7. The geometric effect of span length is, generally, to lower the
fracture transition temperature with an increase in span length. A
standard span of 9.5" will be used for the van der Veen test. Future
drop weight spans will be 12'~ Figure (15) shows this effect.
8. An unknown interrelationship of dimensions exists. For the
van der Veen test span lengths of 9.5", heights of 2.76", with full plate
thickness as the width, may be considered "infinite" specimen dimensions.
9. All three fracture tests showed general agreement in their
response to changes in transition temperatures due to varying plate
thickness. The van der Veen test has been selected as the most suitable
test.
10. Brittle fracture is influenced by four main factors. These are
(1) material, (2) temperature, (3) strain rate, (4) state of stress.
Together these factors determine the behavior of steel.
11. Although this report was not written in metallurgical terms,
it was noted that grain size and chemistry are the factors that influence
brittle behavior ..
As strain rate is increased, the yield strength is also
43.
12. Temperature is the most prominent variable in the van der Veen
test. As temperature is lowered the susceptibility to brittleness increases.
The susceptibility that is brought about by lowering temperature is due to
the fact that lowering temperature raises the yield strength.
13. An increase in strain rate increases the susceptibility to
brittle fracture. Strain rate affects chiefly the ductility transition
temperatures.
increased.
14. The tendency for brittle fracture is nearly always associated
with tensile stresses. Highly localized, especially triaxial tensile
stresses promote brittle behavior.
15. The effect of notches has been discussed. Notches serve to
localize stresses and restrict plastic flow. The effect of notch
geometry is also discussed.
16. It appears that the van der Veen test is a suitable test,
having set "infinit.e" dimensions. From this test, along with certain
weldability requirements, it is believed that an optimum steel will be
PLATE Estimated EstimatedTHICK Total TIme Time'at Tota1'Time Time at-NESS Temp. in Furnace 'Temp. Temp. in Furnace Tewe,~, ,
1/2" 1700~ F. 86 min. ' 66 min. 1260~ F~ 47 min. 27 min... . .. "-- . -- -_. - ", _._ .........
3/4" 17000 F. 124 min. 94 min. 12600 F. 80 min. 50 min.
1 " 17000 F. 93 min. 53 min. 12300 F. 93 min. 53 min.
2 " 17000 F. 250 min. 170 min. 12200 F. 185 min. 105 min.
*A11 plates were water-quenched cold after austenitizing
TABLE 6.
MECHANICAL PROPERTIES OF"T-1" STEEL PLATES
PLATE CHARPY V-NOTCHTHICK TEST* YIELDti TENSILE ELONGATIOK REDUCTION ENERGY ABSORBED-NESS LOCATION STRENGTH STRENGTH IN 2" OF AREA AT -500 F.(in.) (psi) <psi) (%) (%) (ft.-lb.)
1/2 LB 111,000 119,000 32.0 58.2 17 - 17 - 19
LT 115,700 123,300 30.0 60.0
3/4 LB 107,800 117,450 36.0 59.2 17 - 17 - 19
LT 111,400 119,650 36.0 59.3
1 LB 108,450 122,900 20.0 64.5 49 - 52 - 58
LT 107,450 122,000 20.0 65.2
2 LB 108,050 117,400 22.0 63.9 26 - 31 - 41
LT 110,500 119,400 19.0 66.3
*LB = Longitudinal specimen from bottom end of plate edgeLT • Longitudinal specimen from top end of plate edge
**0.5 percent Extension Under Load
Table 7.
PLATE ANALYS IS OF LT- 75 STEEL
67.
A5238
C
0.15
Mn
1.20
P
0.013
S
0.025
Cu.
0.18
Si
0.19
Al
0.025
Table 8.
MECHANICAL PROPERTIES OF LT-75 STEEL
PlateThick- Yield Tensile E10ng. Charpy V-Notchness Treatment Strength Strength In 2" at -750 F, Ft-Lb.
GENERAL COMPARISON OF TRANSITION TEMPERATURES AMONGTHE STEELS FOR A STANDARD VAN DER VEEN SPECIMEN
78.
TRANSITION TEMPERATUREPLATE THICKNESS TYPE STEEL '50% FIBROUS 2% LATERAL
CONTRACTION(inches) (oF) (oF)
1 ABS-C (N) -25 -55
1 T-1 (Q&T) -60 -130
1 LT-75 (N) -45 -70
1 LT-75 (Q&T) -70 -130
1 LT-75 (Q) -15 -45
2 ABS-C (N) + 5 -50
2 T-l (Q&T) -35 -90
2 LT-75 (N) +45 -15
·2 LT-75 (Q&T) -55 -110
2 LT-75 (Q) +20 -30
N - Normalized
Q - Quenched
Q & T - Quenched and Tempered
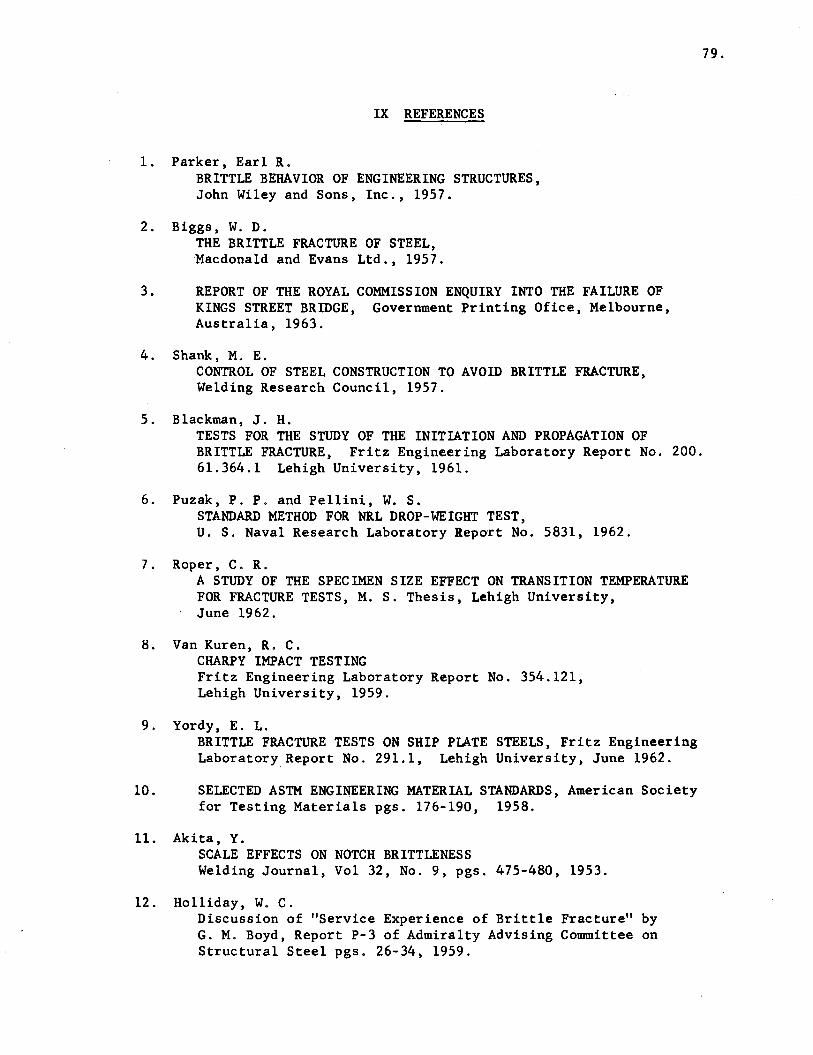
IX REFERENCES
1. Parker, Earl R.BRITTLE BEHAVIOR OF ENGINEERING STRUCTURES,John Wiley and Sons, Inc., 1957.
2. Biggs, W. D.THE BRITTLE FRACTURE OF STEEL,Macdonald and Evans Ltd., 1957.
3. REPORT OF THE ROYAL COMMISSION ENQUIRY INTO THE FAILURE OFKINGS STREET BRIDGE, Government Printing Ofice , Melbourne,Australia, 1963.
4. Shank, M. E.CONTROL OF STEEL CONSTRUCTION TO AVOID BRITTLE FRACTURE,Welding Research Council, 1957.
79.
5. Blackman, J. H.TESTS FOR THE STUDY OF THE INITIATION AND PROPAGATION OFBRITTLE FRACTURE, Fritz Engineering Laboratory Report No. 200.61.364.1 Lehigh University, 1961.
6. Puzak, P. P. and Pe11ini, W. S.STANDARD METHOD FOR NRL DROP-WEIGHT TEST,U. S. Naval Research Laboratory Report No. 5831, 1962.
7. Roper, C. R.A STUDY OF THE SPECIMEN SIZE EFFECT ON TRANSITION TEMPERATUREFOR FRACTURE TESTS, M. S. Thesis, Lehigh University,June 1962.
8. Van Kuren, R. C.CHARPY IMPACT TESTINGFritz Engineering Laboratory Report No. 354.121,Lehigh University, 1959.
9. Yordy, E. L.BRITTLE FRACTURE TESTS ON SHIP PLATE STEELS, Fritz EngineeringLaboratory Report No. 291.1, Lehigh University, June 1962.
10. SELECTED ASTM ENGINEERING MATERIAL STANDARDS, American Societyfor Testing Materials pgs. 176-190, 1958.
II . Ak i ta, Y.SCALE EFFECTS ON NOTCH BRITTLENESSWelding Journal, Vol 32, No.9, pgs. 475-480, 1953.
12. Holliday, W. C.Discussion of "Service Experience of Brittle Fracture" byG. M. Boyd, Report P-3 of Admiralty Advising Committee onStructural Steel pgs. 26-34, 1959.
r
80.
REFERENCES (continued)
13. Epstein, S.OPT]MUM COMPOSITION OF STEEL PLATE OVER 1-1/2 .INCH THICK,Report to Ship Steel Committee, Project SR-162, February 26, 1963.
14. Stout, R. D., Roper, C. R., and Magee, D. A.GEOMETRIC EFFECTS OF PLATE THICKNESS, S. S. C. Report No. 160,February 7, 1964.
15. de Graaf, J. E. and van der Veen, J. H.NOTCHED SLOW BEND TESTS AS A BRITTLE FRACTURE TEST,Iron and Steel Institute Journal, 173 (1) pgs. 19-30, 1953.
•
81.
X VITA
David Allen Magee, the son of Virginia Palmer Magee and
George Allen Magee, was born on August 5, 1940 in Petersburg, Virginia.
He attended Petersburg Public Schools for eleven years, being
graduated in June 1957 from Petersburg High School. His undergraduate
training was taken at the Virginia Military Institute, Lexington,
Virginia, from September 1957 to June 1962. A short six months active
duty tour was spent with the U. S. Army between the second and third
years.
After graduating with a Bachelor of Science degree in Civil
Engineering, he was commissioned as a Second Lieutenant in the U. S. Army
Reserve.
He came to Lehigh University in 1962 as a research assistant