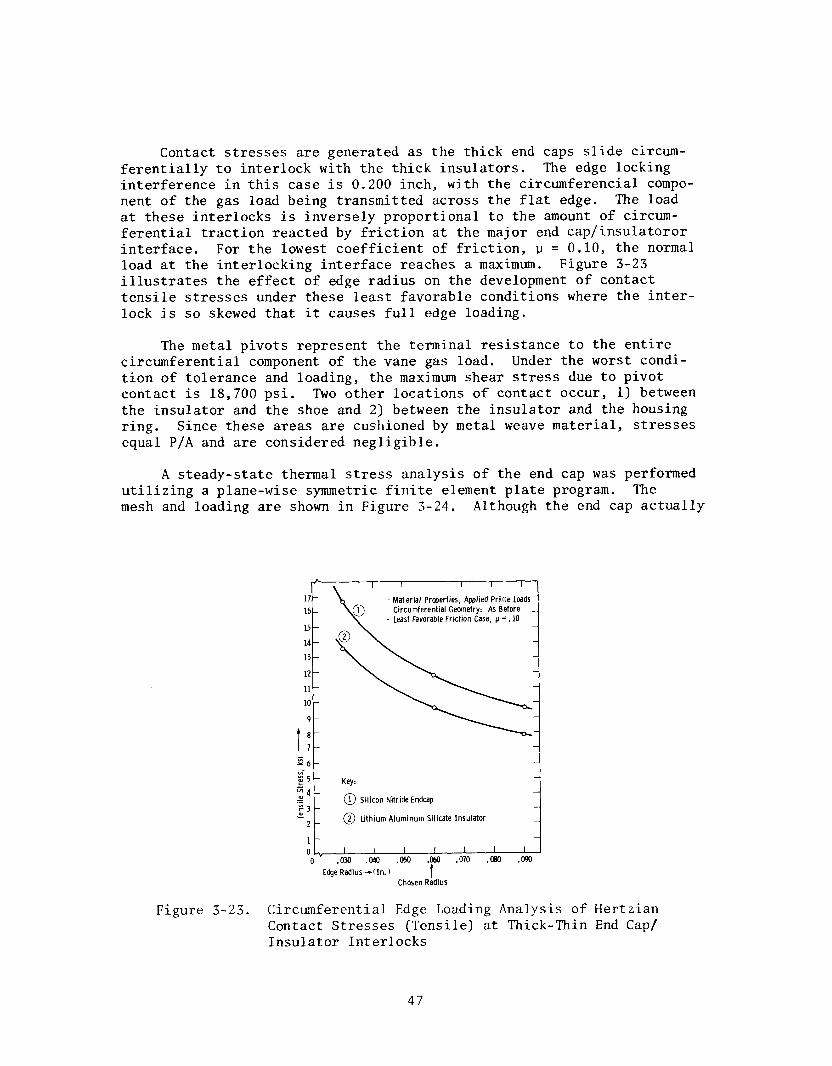
AMMRC CTR76-32 VOLUME II BRITTLEMATERIALS DESIGN,HIGHTEMPERATURE GAS TURBINE STATOR VANE DEVELOPMENT ANDSTATIC RIG TESTS Technical Report By: Donald G. Miller, Westinghouse Electric Corp., Pittsburgh, PA 15235 C. Robert Booher, Jr., Westinghouse Electric Corp., Lester,PA 19113 Program Manager: Raymond J. Bratton, Westinghouse Electric Corp., Pittsburgh, PA 15235 December, 1976 Final Report Contract Number DAAG 46-71-C-0162 Sponsored by the Advanced Research Projects Agency ARPA Order Number 1849 Project Code Number lDl0 Agency Accession Number DA OD 4733 Approved for public release; distribution unlimited. Prepared for ARMY MATERIALS AND MECHANICSRESEARCH CENTER Watertown, Massachusetts 02172
Transcript
AMMRC CTR 76-32 VOLUME II
BRITTLE MATERIALS DESIGN, HIGH TEMPERATURE GAS TURBINE STATOR VANE DEVELOPMENT AND STATIC RIG TESTS
Technical Report By:
Donald G. Miller, Westinghouse Electric Corp., Pittsburgh, PA 15235 C. Robert Booher, Jr., Westinghouse Electric Corp., Lester,PA 19113
Program Manager:
Raymond J. Bratton, Westinghouse Electric Corp., Pittsburgh, PA 15235
December, 1976
Final Report
Contract Number DAAG 46-71-C-0162
Sponsored by the Advanced Research Projects Agency
ARPA Order Number 1849
Project Code Number lDl0
Agency Accession Number DA OD 4733 Approved for public release; distribution unlimited.
Prepared for
ARMY MATERIALS AND MECHANICS RESEARCH CENTER Watertown, Massachusetts 02172
The findings in this report are not to be construed as an official Advanced Research Projects Agency, Department of the Army, or U.S. Government position, either expressed or implied, unless so designated by other authorized documents.
Mention of any trade names or manufacturers in this report shall not be construed as advertising nor as an official indorsement or approval of such products or companies by the United States Government.
DISPOSITION INSTRUCTIONS
Destroy this report when it is no longer needed. Do not return it to the originator.
AMMRC CTR 76-32 Volume II
BRITTLE MATERIALS DESIGN HIGH TEMPERATURE GAS TURBINE STATOR VANE DEVELOPMENT AND STATIC RIG TESTS
Technical Report By:
Donald G. Miller, Westinghouse Electric Corp., Pittsburgh, PA.15235 C. Robert Booher,Jr., Westinghouse Electric Corp., Lester, PA. 19113
Program Manager:
Raymond J. Bratton, Westinghouse Electric Corp., Pittsburgh, PA 15235
December, 1976
Final Report
Contract Number DAAG 46-71-C-0162
Sponsored by the Advanced Research Projects Agency
ARPA Order Number 1849
Project Code Number lDl0
Agency Accession Number DA OD 4733
Approved for public release; distribution unlimited.
Prepared for:
ARMY MATERIALS AND MECHANICS RESEARCH CENTER Watertown, Massachusetts 02172
ABSTRACT
The three-piece design concept of a separate airfoil section confined within an inner and outer end cap to produce first stage stator vane assemblies for large industrial gas turbines from brittle ceramic materials was reduced to practice in three design iterations. All of the spring-loaded support structures (the insulator blocks, cushions, metal shoes, seals, pivots and plungers) required to adapt the ceramic vanes to the turbine configuration were developed, manufactured and tested. The Norton Company manufactured all stator vane assembly component parts from hot pressed silicon nitride (HS130/NC132) or hot pressed silicon carbide (NC203).
Static rig tests were conducted under cyclic conditions, controlled to simulate a turbine environment in peaking power to service at 2200 and 2500'F peak inlet temperature at 0.8 turbine simulation. First generation HS130 silicon nitride vanes remained fully functional after 106 cycles of testing from 2200 to 1200°F with the shutdown transient at 2S°F/sec. Contact stress superimposed upon transient thermal stress produced extensive cracks in four of eight airfoils and two of sixteen end caps. The initial attempt to test at 2500'F was terminated prematurely on the fifth cycle when
a combustor implosion and apparent ceramic exhaust duct damage precipitated a temperature excursion to 3000°F under conditions of choked flow leading to catastrophic rig failure and subsequent rapid quench to the compressor discharge temperature (600'F). foils and two of eight end caps.
Cracks developed in one of four Si3N4 air- All elements of four Sic stator vane
assemblies (end caps and airfoils) were virtually destroyed.
The static rig was rebuilt with a cooled combustor, water-cooled metal exhaust duct and water-spray cooled mixer. Final design configuration NC132 silicon nitride vane assemblies were installed with boron nitride insulators. Testing resumed at 2500'F. After 25 cycles, contact stresses resulting from gross misalignment of the test rig produced failure indica- tions in four of eight airfoils and one end cap. Two incidents of transient thermal-stress-induced failure were identified during the next thirty-five cycles. A single trailing edge crack was observed at the conclusion of 2500°F testing after the last forty-three cycles had been run. The airfoil in cascade position 4, which experienced the most severe conditions in a highly temperature-profiled gas stream survived all 103 cycles. The rig functioned perfectly in its modified form. Subsequent failure analysis and supportive stress analysis indicated failures to be of a statistical nature controlled by the scatter of critical mechanical properties within the vane material. The design was considered viable.
SUMMARY
The three-piece design concept of a separate airfoil section confined within an inner and outer end cap to produce first stage stator vane assemblies for large industrial gas turbines from brittle ceramic materials was reduced to practice in three design iterations. All of the spring-loaded support structure components (the insulator blocks, cushions, metal shoes, seals, pivots and plungers) required to adapt the ceramic vane components to the turbine configuration were developed, manufactured and tested.
The Norton Company produced twenty vane sets to meet the first generation design specification (inner and outer end cap with nontapered nontwisted airfoil) from HS130 hot pressed silicon nitride. Eight similar assemblies were later made from Noralide NC203 silicon carbide. Both hot pressed silicon nitride (HS130) and silicon carbide (Noralide NC203) were used in the manufacture of sixteen vane assemblies of second generation design (inner and outer end cap with tapered-twisted airfoils which had tenon geometry developed fully to conform in total volume to the end cap cavities at either end, the so-called dog-bone design). Noralide NC132 silicon nitride was used exclusively in the fabrication of twenty, three-piece stator vane assemblies of the third generation or final design (inner and outer end cap with tapered-twisted airfoil).
Static rig tests were conducted under cyclic conditions, controlled to simulate a turbine environment in peaking power service at 2200 and 2500°F peak inlet temperature with 0.8 actual turbine pressure ratio achieved (8 atmospheres rather than 10.5). First generation HS130 silicon nitride vanes remained fully functional after 106 cycles of testing from 2200 to 1200°F with the shutdown transient at 2S°F/sec. Contact stress superimposed upon transient thermal stress produced extensive cracks in four of eight airfoils and two of sixteen end caps, however. The initial attempt to test at 2500°F was terminated prematurely on the fifth cycle when a combustor implosion and apparent ceramic exhaust duct damage precipitated a temperature excursion to 3000°F under conditions of choked flow leading to catastrophic rig failure and subse- quent rapid quench to the compressor discharge temperature (60O'F). Cracks were formed in one of four Si3N4 airfoils and two of eight end caps, while all elements of four Sic stator vane assemblies, end caps and airfoils alike, were virtually destroyed.
i
The static rig was rebuilt with an extensively cooled combustor, water-cooled metal exhaust duct and water-spray cooled mixer. Final design configuration NC132 silicon nitride vane assemblies were installed with boron nitride insulators. Testing resumed at 2500OF. After 25 cycles, contact stresses resulting from gross misalignment of the test rig produced failure indications in four of eight airfoils and one end cap. Two incidents of transient thermal-stress-induced failure were identified during the next thirty-five cycles. A single trailing edge crack was observed at the conclusion of 2500°F testing after the last forty-three cycles had been run. The airfoil in cascade position 4, which experienced the most severe conditions in a highly temperature-profiled gas stream survived all 103 cycles. The rig functioned perfectly in its modified form.
Subsequent failure analysis and supportive stress analysis indicated failures to be of a statistical nature controlled by the scatter of critical mechanical properties within the vane material. The design was considered viable.
3 STATOR VANE SYSTEM DESIGN CONCEPTS .......... 25
INTRODUCTION ....................... 25 FIRST GENERATION STATOR VANE ASSEMBLY DESIGN ....... 33 FIRST GENERATION STATOR VANE ANALYSIS .....
PRELIMINARY DESIGN'REOUIREMENTS 37
INSULATOR ANALYSIS - ... 57 THE KINEMATIC MODEL ............... SECOND GENERATION VANE ASSEMBLY DESIGN
61 .......... 63
THIRD GENERATION VANE ASSEMBLY DESIGN .......... 79
4 STATIC RIG TESTING. .................. 81
STATIC RIG PREPARATION .................. 81 DEFINITION OF THE STATIC RIG TEST CYCLE 2200'F STATIC RIG TESTS OF SILICON NITRIDE VANES :
.... 87
.... 95 4.3.1 THE TEST ASSEMBLY ................. 95 4.3.2 THE 2200'F TEST CYCLE ............... 95 4.3.3 TEST RESULTS STATIC RIG MODIFICATION'FOR'2;0~"~ TESTS : ..............
. 102
. 113 STATIC RIG TESTS OF Si N AND Sic VANES 4.5.1 STATIC RIG PREPARATION
5.2.1 PRELIMINARY BILLET MATERIAL ............ 208 5.2.2 HS130 Si3N4 MATERIAL AND COMPONENTS ........ 208 5.2.3 SECOND GENERATION DESIGN COMPONENTS ........ 215 5.2.4 THIRD GENERATION STATOR VANE ASSEMBLIES ...... 216
5.3 NORTON SILICON CARBIDE .................. 228 5.4 ENERGY RESEARCH CVD SILICON CARBIDE ........... 229
SECTION 6 CONCLUSIONS AND RECOMMENDATIONS ........... 231 6.1 CONCLUSIONS
RECOMMENDATIONS ..................... 231
6.2 ..................... 232
iv
LIST OF FIGURES
Figure
l-l l-2
l-3 l-4
1-5
2-l 2-2 2-3
2-4
2-5
2-6 2-7
2-8
2-9 2-10 2-11
2-12 2-13
2-14
2-15
2-16 2-17
2-18
3-l 3-2 3-3 3-4 3-5
3-6
Westinghouse W251 Gas Turbine Iterative Development Procedure for Industrial
Gas Turbine Components Conceptual Ceramic Turbine for Power Generation DARPA Stationary Turbine Project - Iterative
Development Plan Stator Vane Development on Stationary Turbine Project
Three-Piece Stator Vane Schematic First Row Stator Vane - Integral Version Heat Transfer Coefficient Ratios as a Function of
Time for a Row 1 Vane Emergency Shutdown Condition Distribution of Maximum Heat Transfer Coefficients
around Row 1 Vane for an Emergency Startup and Shutdown Condition
Two-Dimensional Finite Element Mesh for Solid Airfoil Section
Thermal Stress in a Vane Stress History for Si3N4 Airfoils from 1950'F
and 2500'F Maximum Stresses in Solid Airfoil as a Function
of Size
Page
2
3
4
5
6
10 10
11
12
13
14
15
15
Temperature Contours in Solid Half-Size Si3N4 Airfoils 17 Stress Contours in Solid Half-Size Si3N4 Airfoils 17 Dimensions of Blunted Leading and Trailing Edges
of Ceramic Airfoils 18 Thermal Quench Cylinder Coordinate System 19 Boundary Conditions - Gas Temperature and Film
Coefficient 20
Temperature Decay and Maximum Transient Tensile Stress in the Axial Direction for Silicon Carbide Cylinders Cooled in Test Passage 21
Temperature Decay for a Thermocouple at Position No. 3 in Thermally Quenched Cylinders of Sic 21
Cylinder Models 23 Effect of Time on Temperature for Cylinder Thermal
Quench Test 24 Development of Stress in Cylinder Thermal Quench Test 24
30 Mw Test Turbine Flow Path 25 Design Concept I 26 Design Concept II 28 Design Concept III 29 First Row Ceramic Stator Vane Assembly - Longitudinal
View (First Generation Static Rig Test Configuration) 30 First Row Ceramic Stator Vane Assembly - Radial and
Circumferential Views (First Generation Static Rig Test Configuration)
3.
V
Figure
3-7 3-8
3-9
3-10 3-11
3-12 3-13 3-14
3-15
3-16
3-17 3-18
3-19
3-20
3-21
3-22
3-23
3-24 3-25
3-26
3-27
3-28
3-29
3-30
Ceramic Vane and Support Hardware Assembly First Generation, First Row Ceramic Vane Assemblies
with Airfoil, End Caps and Insulators - Systems 1 and 2 Provide Circumferential Locking
First Generation Ceramic Vane End Cap to Insulator Circumferential Locking Arrangement
First Generation Ceramic End Cap Configuration First Generation Airfoil-to-End Cap Juncture -
Compound Curvature Locking Concept First Generation Ceramic Airfoil End Configuration Loads and Interfaces Cylindrical Contact Analogy for the Determination of
Stresses Due to Tangentially Applied Tractive Loads on a Body with Compound Curvature
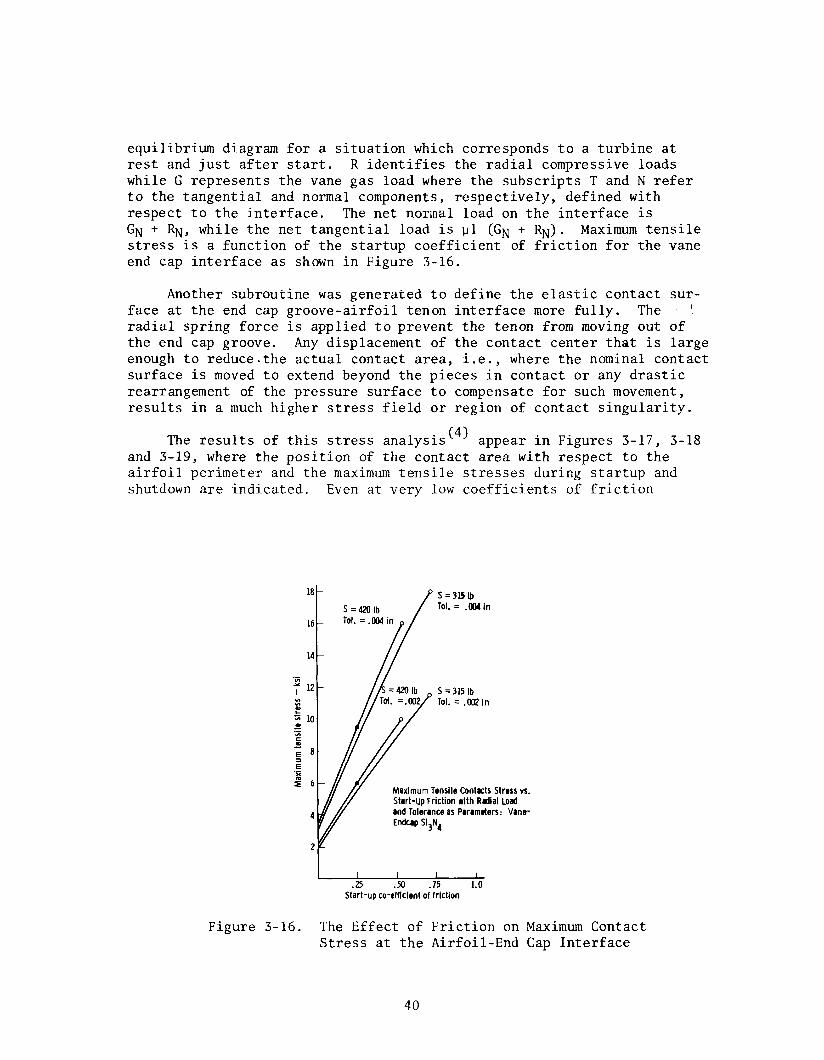
One-Dimensional Force Equilibrium Diagram for the Airfoil-End Cap Interface
The Effect of Friction on Maximum Contact Stress at the Airfoil-End Cap Interface
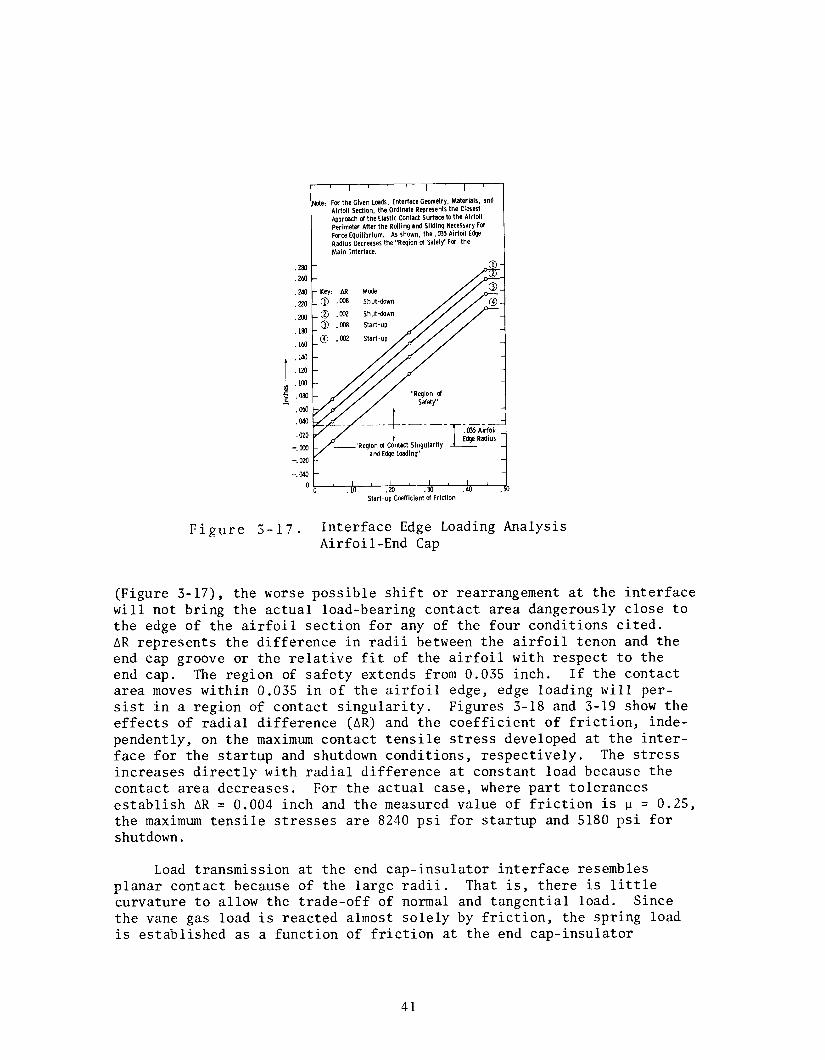
Interface Edge Loading Analysis Airfoil-End Cap Startup Tensile Contact Stress at the Airfoil-End
Cap Interface Showing the Effects of Parameter Variation
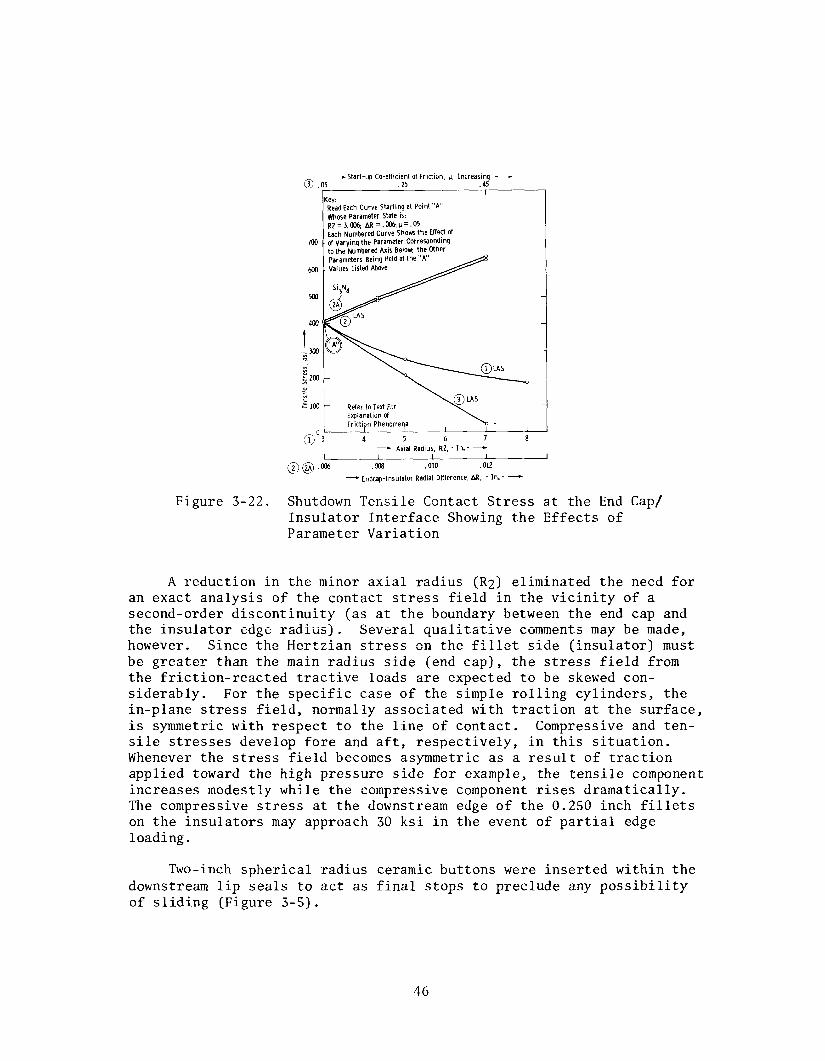
Shutdown Tensile Contact Stress at Vane/End Cap Interface Showing Effects of Parameter Variation
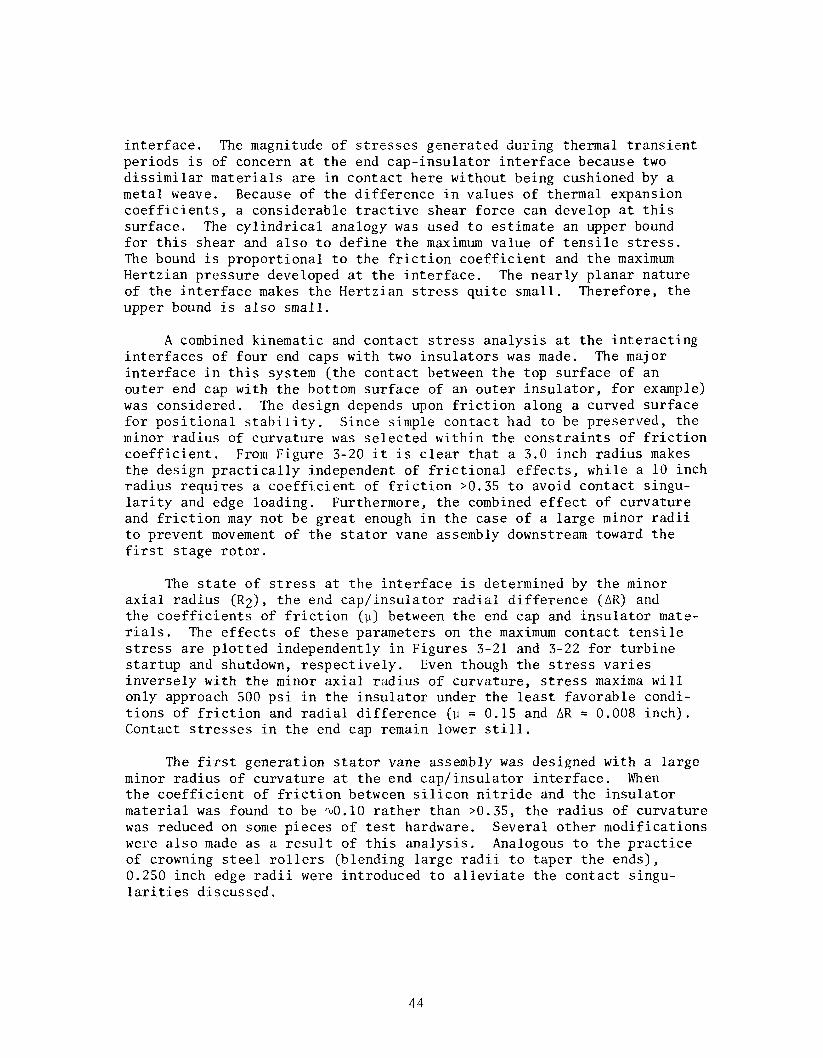
Critical Axial Radius vs Startup Coefficient of Friction at End Cap/Insulator Interface
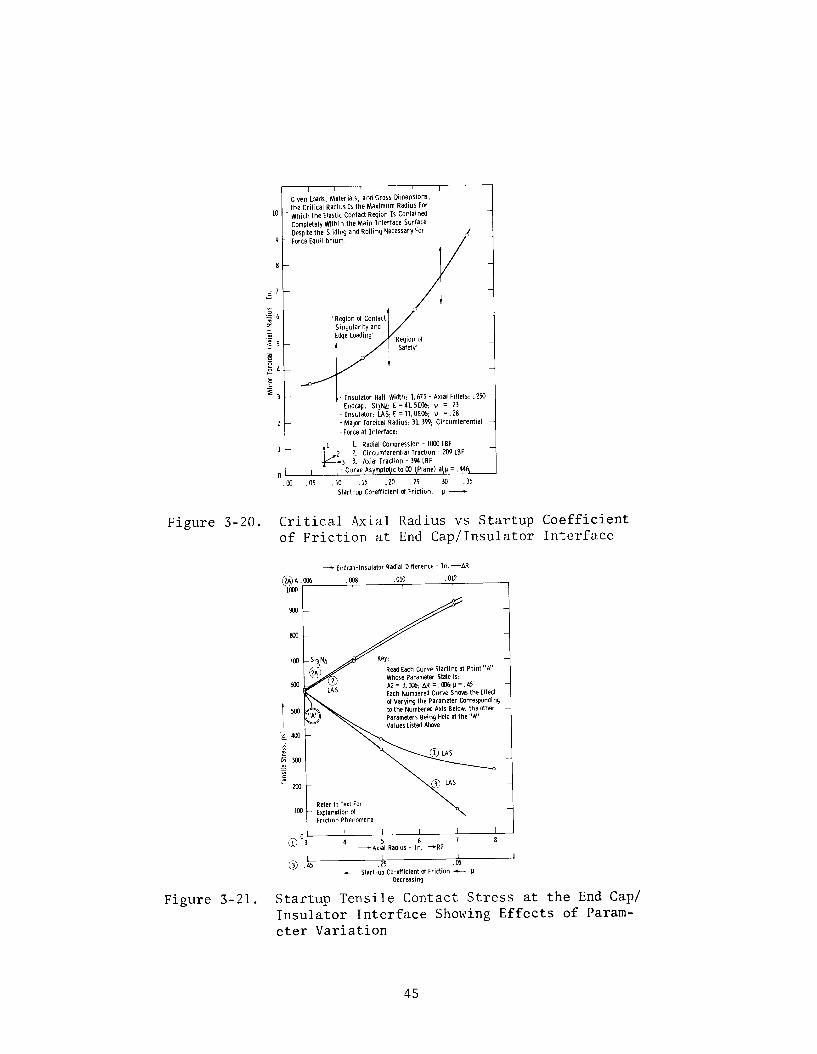
Startup Tensile Contact Stress at the End Cap/ Insulator Interface Showing Effects of Parameter Variation
Shutdown Tensile Contact Stress at the End Cap/ Insulator Interface Showing the Effects of Parameter Variation
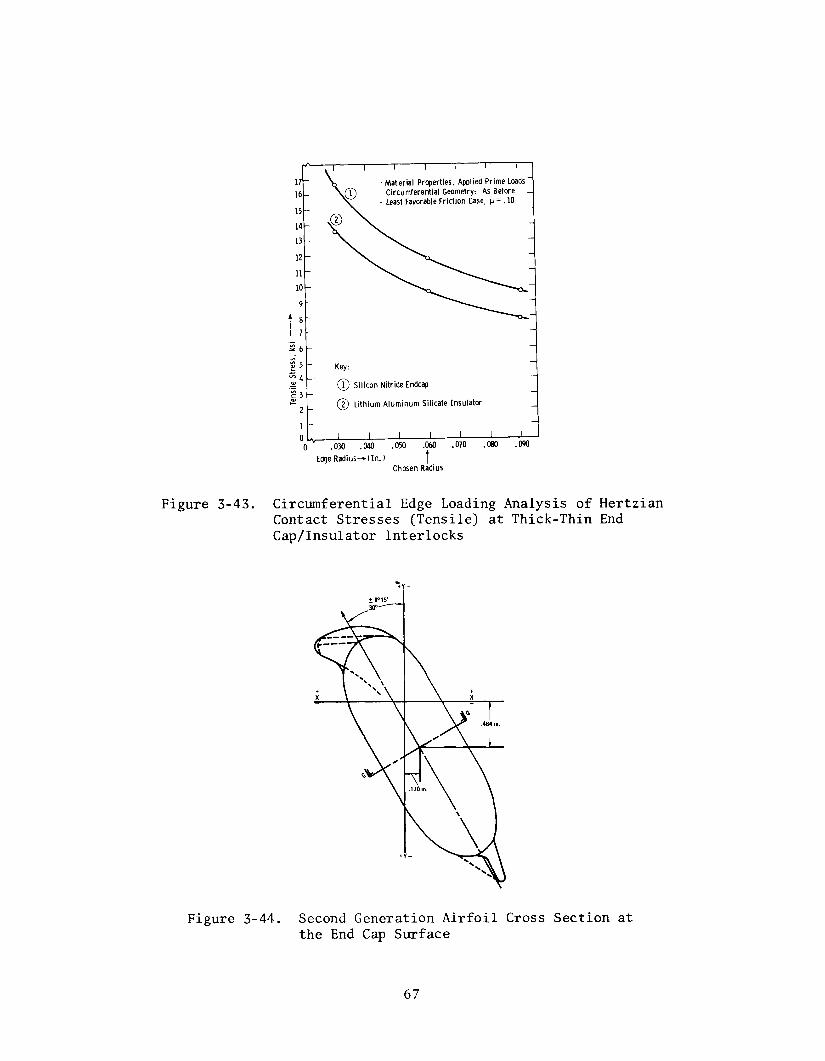
Circumferential Edge Loading Analysis of Hertzian Contact Stresses (Tensile) at Thick-Thin End Cap/ Insulator Interlocks
Page
31
34
34 35
35 36 38
39
39
40 41
42
43
45
45
46
47 Finite Element Geometry - End Cap With Torroidal Groove 48 Maximum Plate Stress in Outer End Cap Under Thermal
Steady State Showing Groove Depth Effect and Adjustment for Asymmetry 49
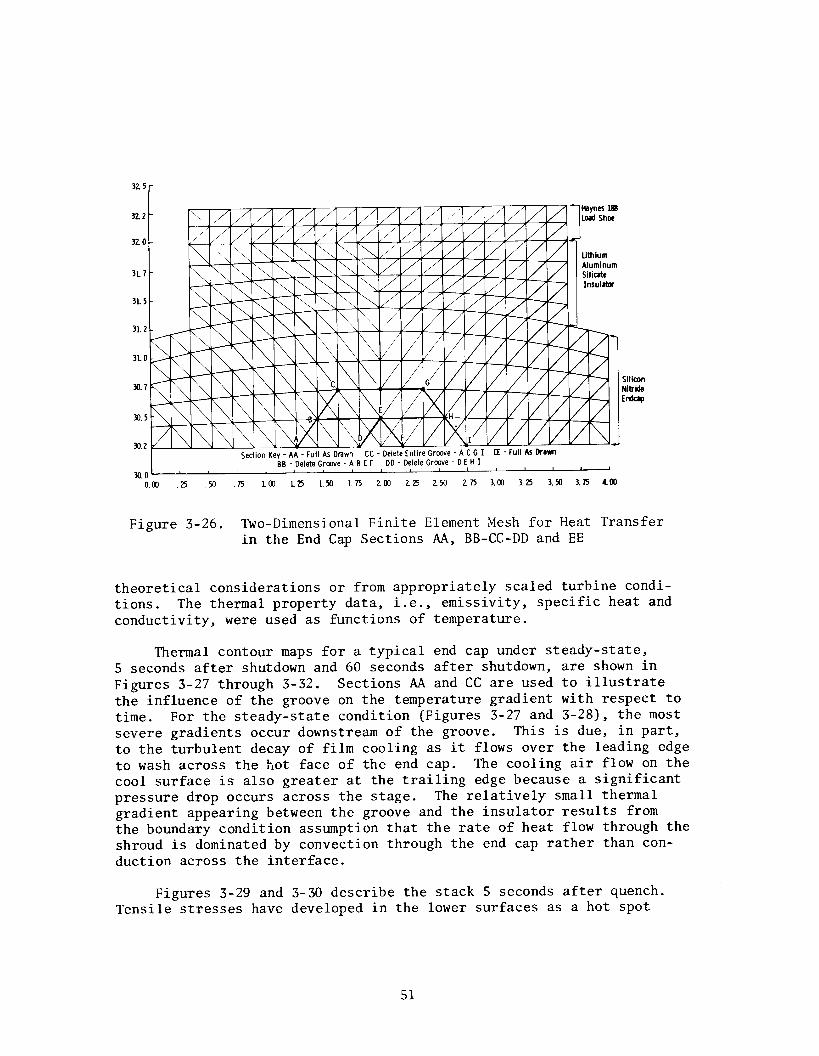
Two-Dimensional Finite Element Mesh for Heat Transfer in the End Cap Sections AA, BB-CC-DD and EE 51
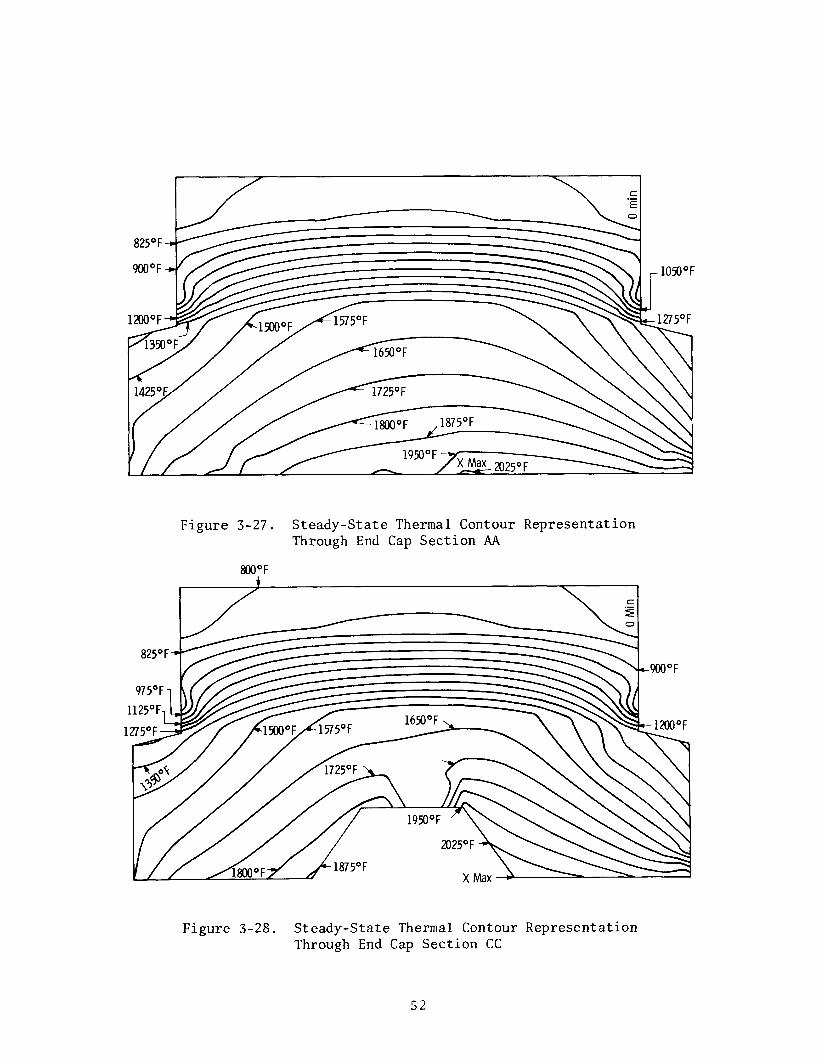
Steady-State Thermal Contour Representation Through End Cap Section AA 52
Steady-State Thermal Contour Representation Through End Cap Section CC 52
Thermal Contour Representation Through End Cap Section AA 5 Seconds After Shutdown 53
Thermal Contour Representation Through End Cap Section CC 5 Seconds After Shutdown 53
vi
Figure Page
3-31
3-32
3-33
3-34
3-35
3-36
3-37
3-38
3-39
3-40
3-41
3-42
3-43
3-44
3-45
3-46
3-47
3-48
3-49
3-50
Thermal Contour Representation Through End Cap Section AA 60 Seconds After Shutdown
Thermal Contour Representation Through End Cap Section CC 60 Seconds After Shutdown
Thermal Stress Distribution in Ceramic End Caps Under Steady-State Conditions
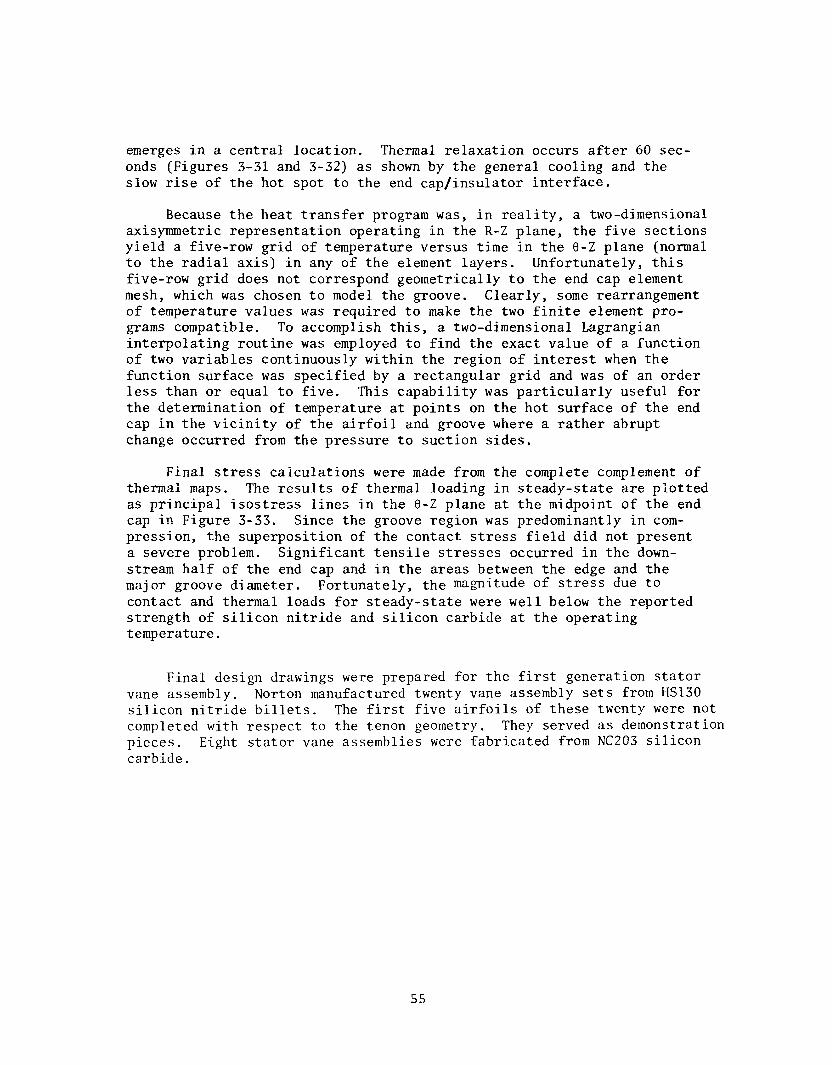
Preliminary 1-D Radial Steady-State Conduction/ Convection Heat Transfer Analysis - Simplified Ceramic Vane Assembly Model and Temperature Profile
Preliminary 1-D Radial Steady-State Conduction/ Convection Heat Transfer Analysis - Effect of Insulator Thickness on Surface Temperature
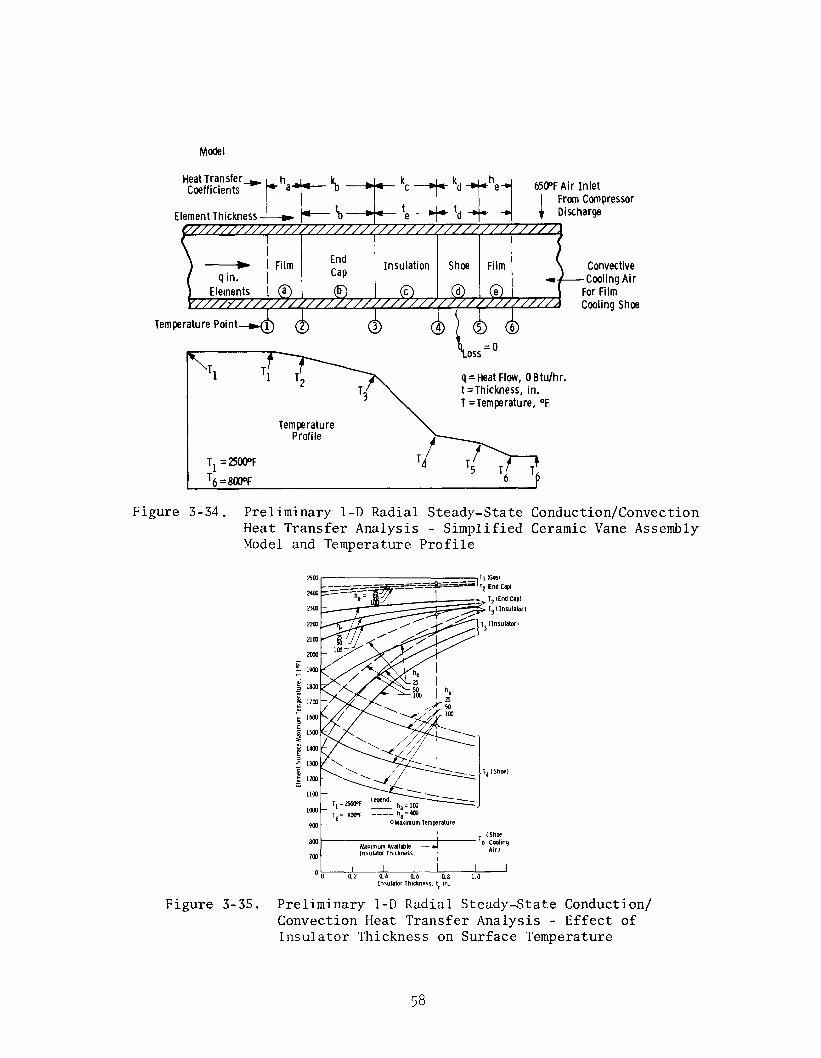
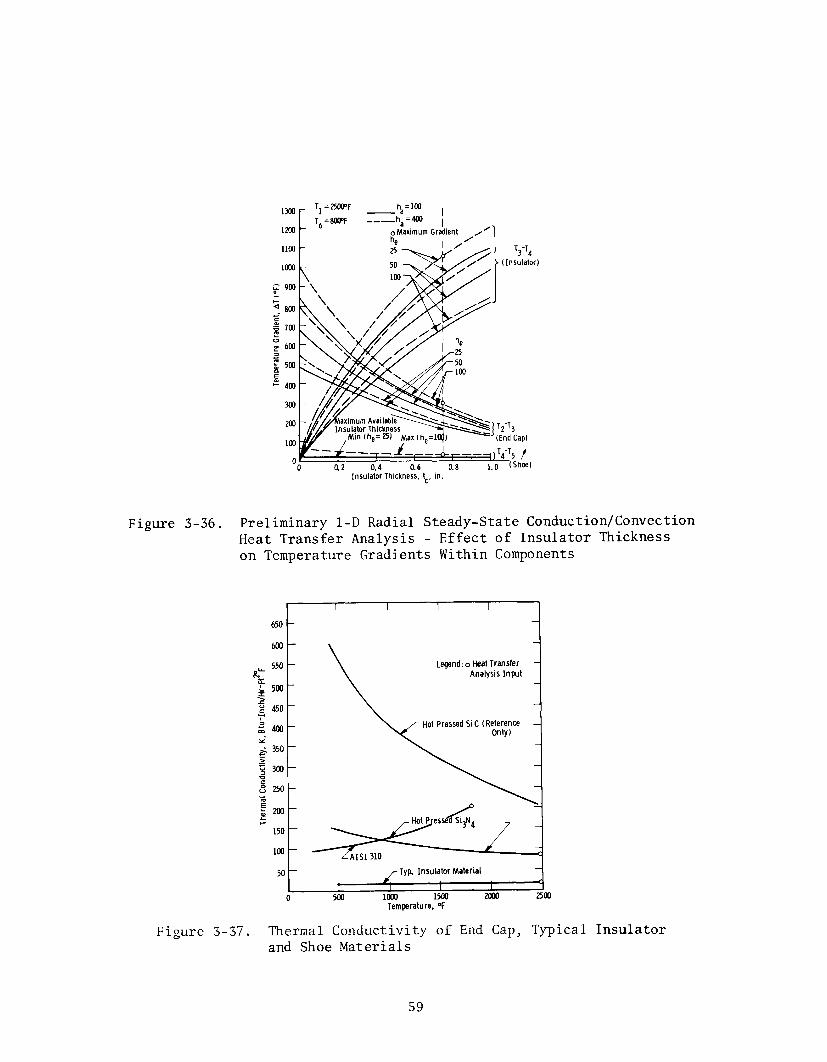
Preliminary 1-D Radial Steady-State Conduction/ Convection Heat Transfer Analysis - Effect of Insulator Thickness on Temperature Gradients Within Components
Thermal Conductivity of End Cap, Typical Insulator and Shoe Materials
Kinematic Model of the Three-Piece Ceramic Vane Design with Support Structure
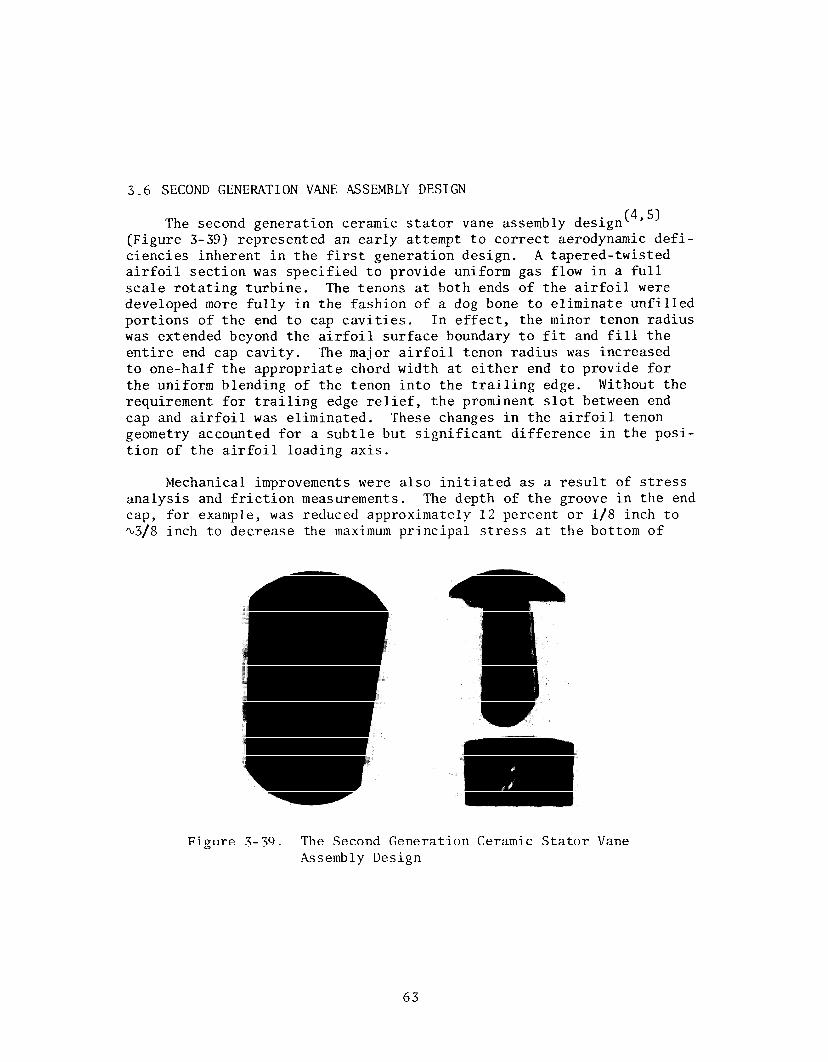
The Second Generation Ceramic Stator Vane Assembly Design
Vane Cross Section Showing Elliptical Contact Surface Projections for the Worst Contact Conditions at the Inner Airfoil/End Cap Interface
Startup Tensile Contact Stress at Airfoil/End Cap Interface Showing Effects of Parameter Variation
Shutdown Tensile Contact Stress at Airfoil/End Cap Interface Showing Effects of Parameter Variation
Circumferential Edge Loading Analysis of Hertzian Contact Stresses (Tensile) at Thick-Thin End Cap/ Insulator Interlocks
Second Generation Airfoil Cross Section at the End Cap Surface
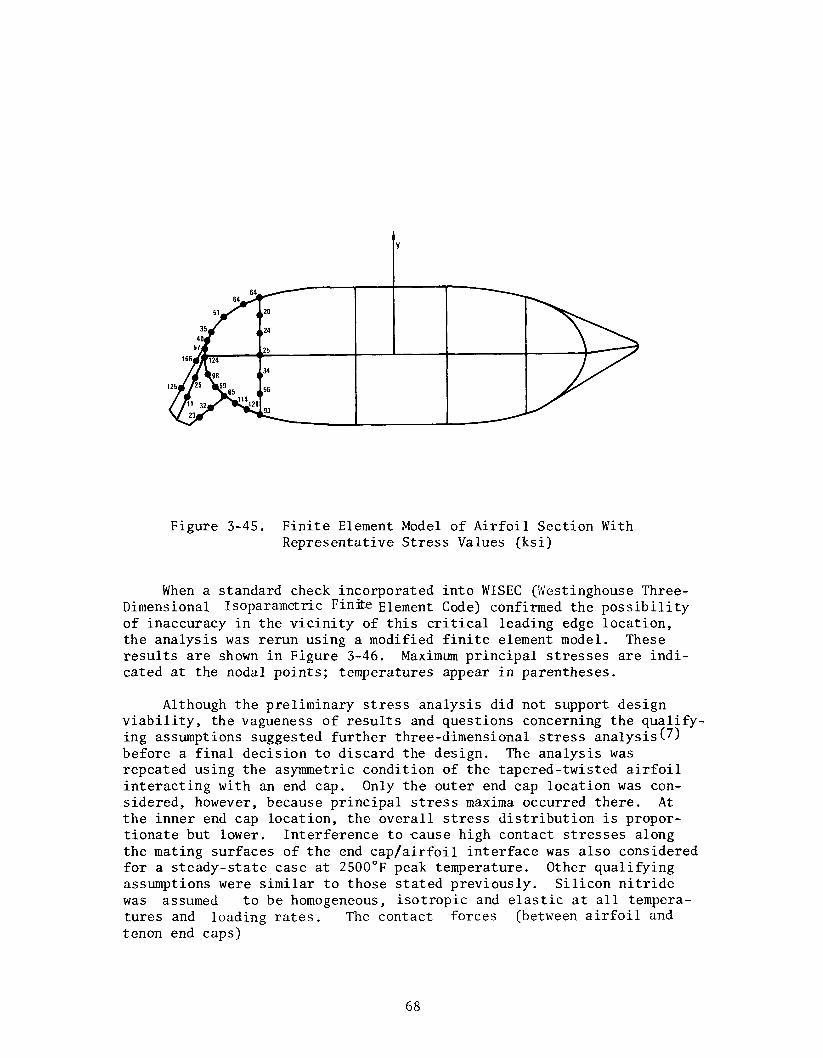
Finite Element Model of Airfoil Section with Representative Stress Values (ksi)
Modified Finite Element Model Showing Principal Stresses (in ksi) and Selected Temperatures (in OF)
Initial and Boundary Conditions for End Cap Thermal Analysis (h = Btu hr-1 ft-2 OF, T = OF)
Calculated Variations in Heat Transfer Coefficients as a Function of Distance from the Leading Edge for the Airfoil Section at Mid-Height and the End Cap Surface
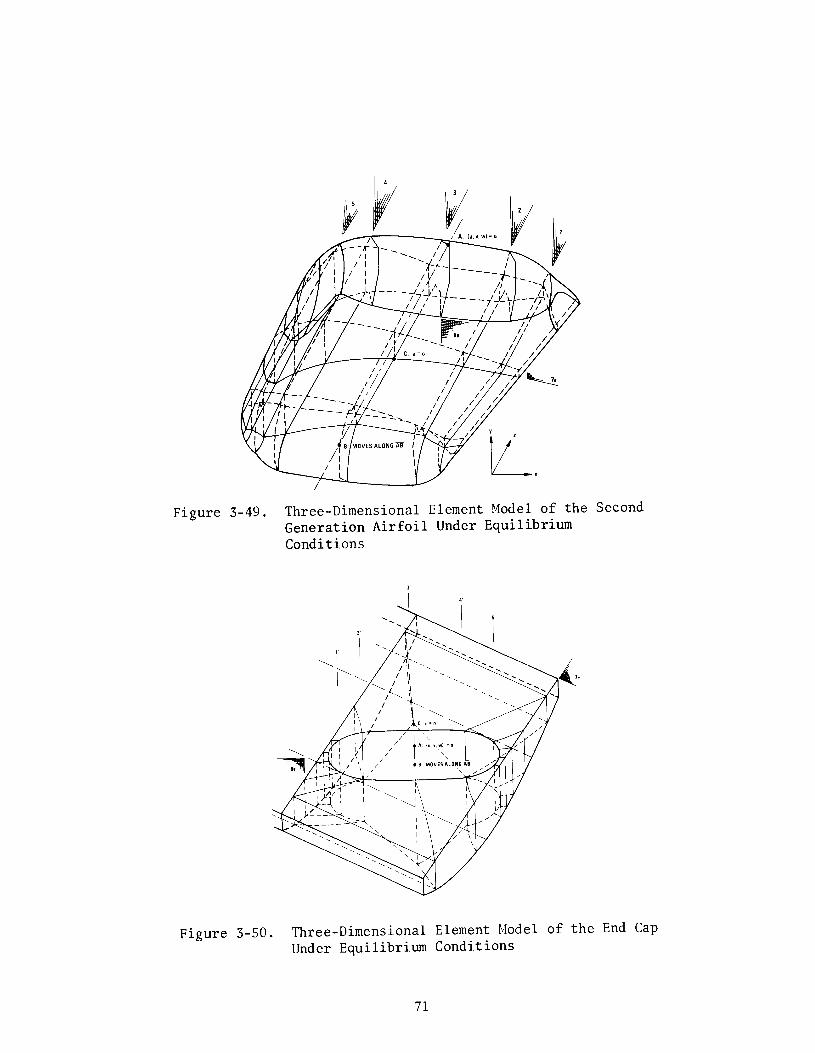
Three-Dimensional Element Model of the Second Genera- tion Airfoil Under Equilibrium Conditions
Three-Dimensional Element Model of the End Cap Under Equlibirium Conditions
54
54
56
58
58
59
59
61
63
65
65
66
67
67
68
69
70
70
71
71
vii
Figure
3-51
3-52
3-53
3-54
3-55
3-56
3-57
3-58
3-59
4-l
4-2
4-3
4-4
4-5 4-6
4-7
4-8
4-9
4-10
Page
Temperature and Stress Distribution for Second 72 Generation Design Airfoil 10 Seconds After Flame- out from 2500°F Steady-State Gas Temperature (Section 7a) (h: High-Low)
Temperature and Stress Distributions for Airfoil 72 Section 3 Ten Seconds After Flameout from 2500°F Steady-State Gas Temperature (h: High-Low)
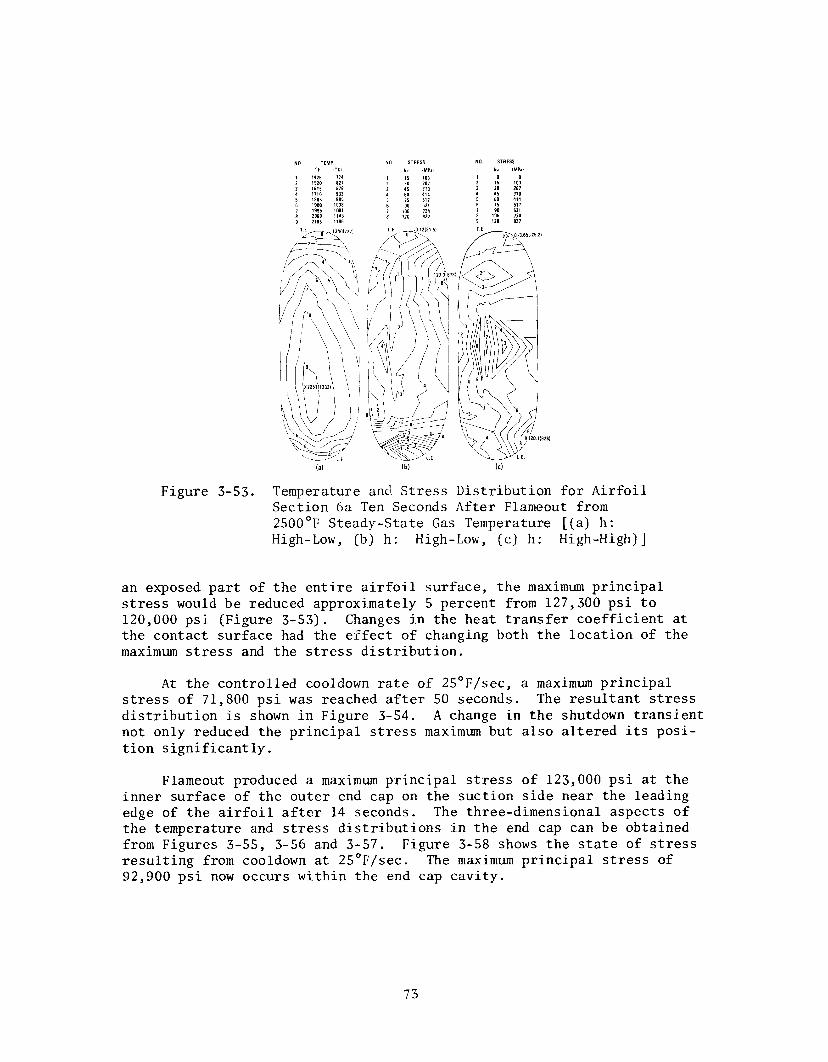
Temperature and Stress Distribution for Airfoil 73 Section 6A Ten Seconds After Flameout from 2500'F Steady-State Gas Temperature [ (a) h: High- Low, (b) h: High-Low, (c) h: High-High) ]
Stress Distribution in Airfoil Section 6a at 50 Seconds 74 After Shutdown from 2500'F Steady-State Gas Temperature at 25'F/Sec
Temperature and Stress Distributions for End Cap 74 Section 7e at 14 Seconds After Flameout from 2500'F Steady-State Gas Temperature (h: High-Low)
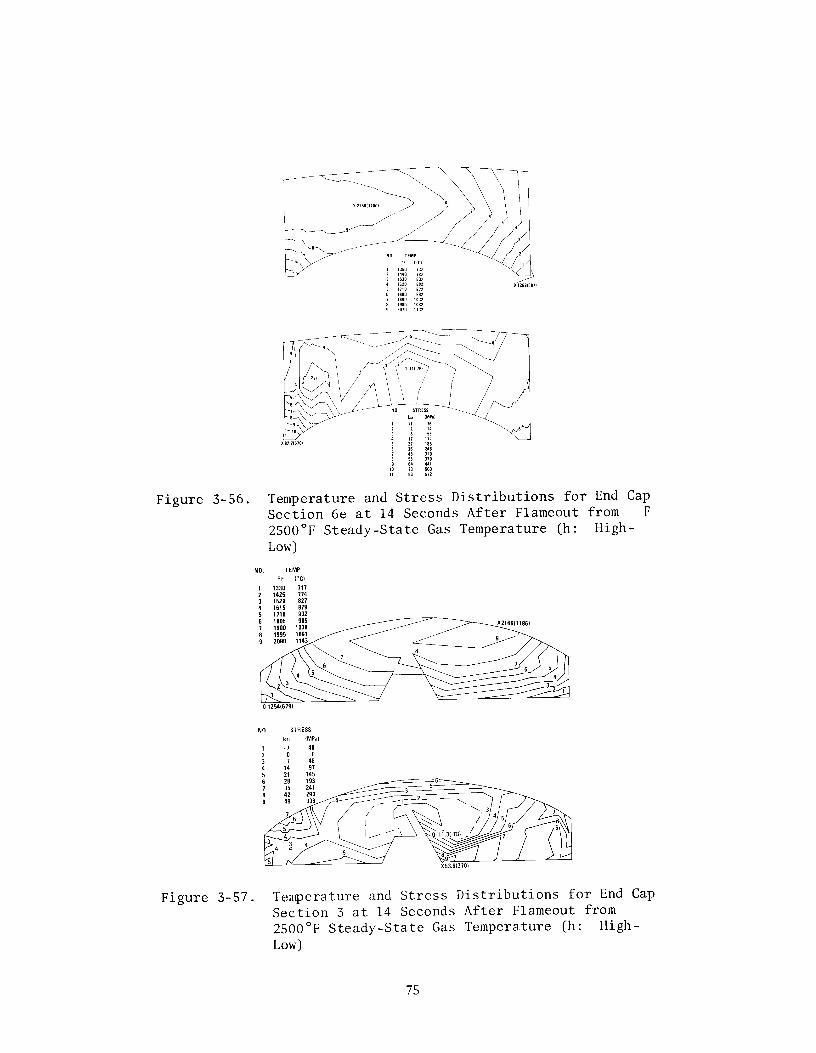
Temperature and Stress Distributions for End Cap Section 75 6e at 14 Seconds After Flameout from 2500°F Steady- State Gas Temperature (h: High-Low)
Temperature and Stress Distributions for End Cap Section3 at 14 Seconds After Flameout from 2500'F Steady-State Gas Temperature (h: High-Low)
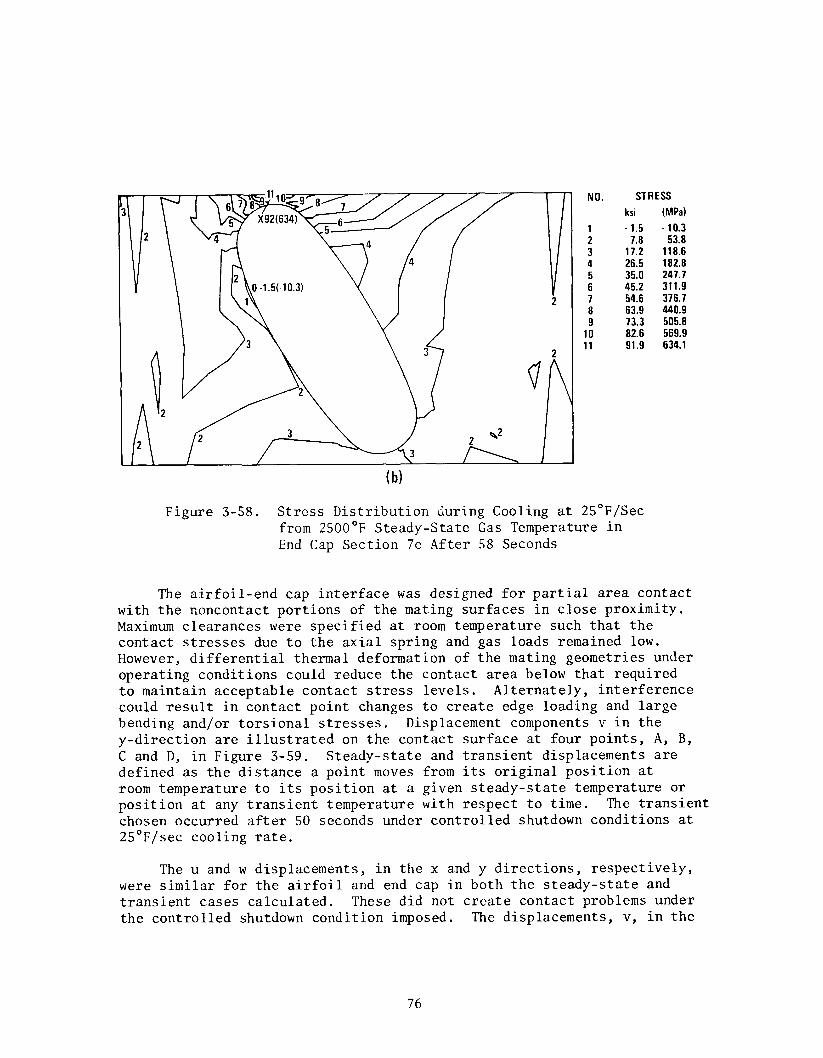
Stress Distribution during Cooling at 25'F/Sec from 2500°F Steady-State Gas Temperature in End Cap Section 7e After 58 Seconds
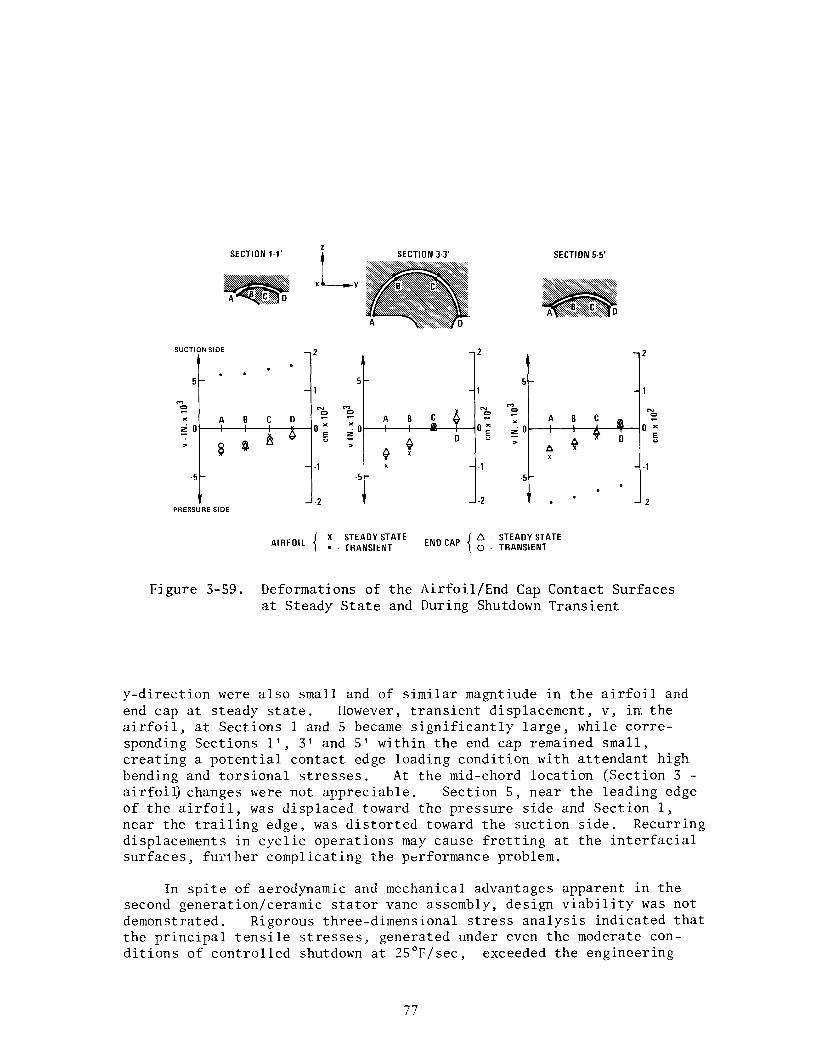
Deformations of the Airfoil/End Cap Contact Surfaces at Steady State and During Shutdown Transient
Modified Static Test Rig for 2200'F Test of Ceramic Vanes
The Static Rig for Testing Ceramic Stator Vanes at 2200 and 2500'F (Mitered Section is 42 inches in Diameter)
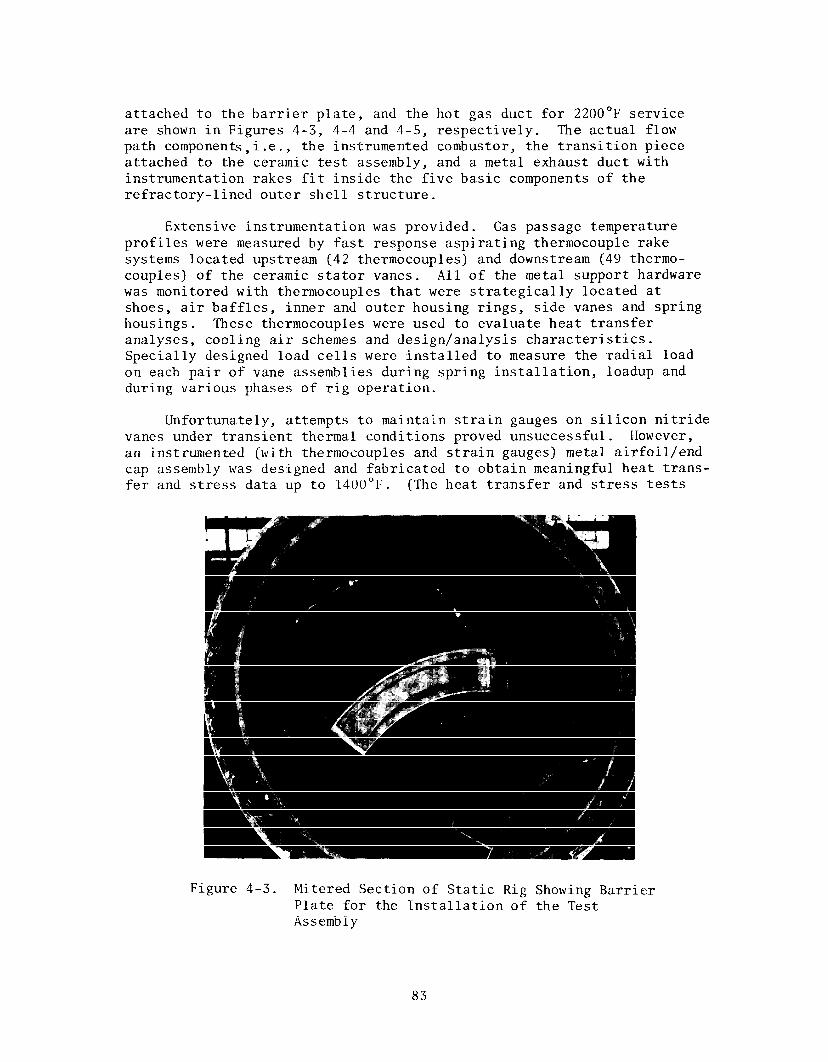
Mitered Section of Static Rig Showing Barrier Plate for the Installation of the Test Assembly
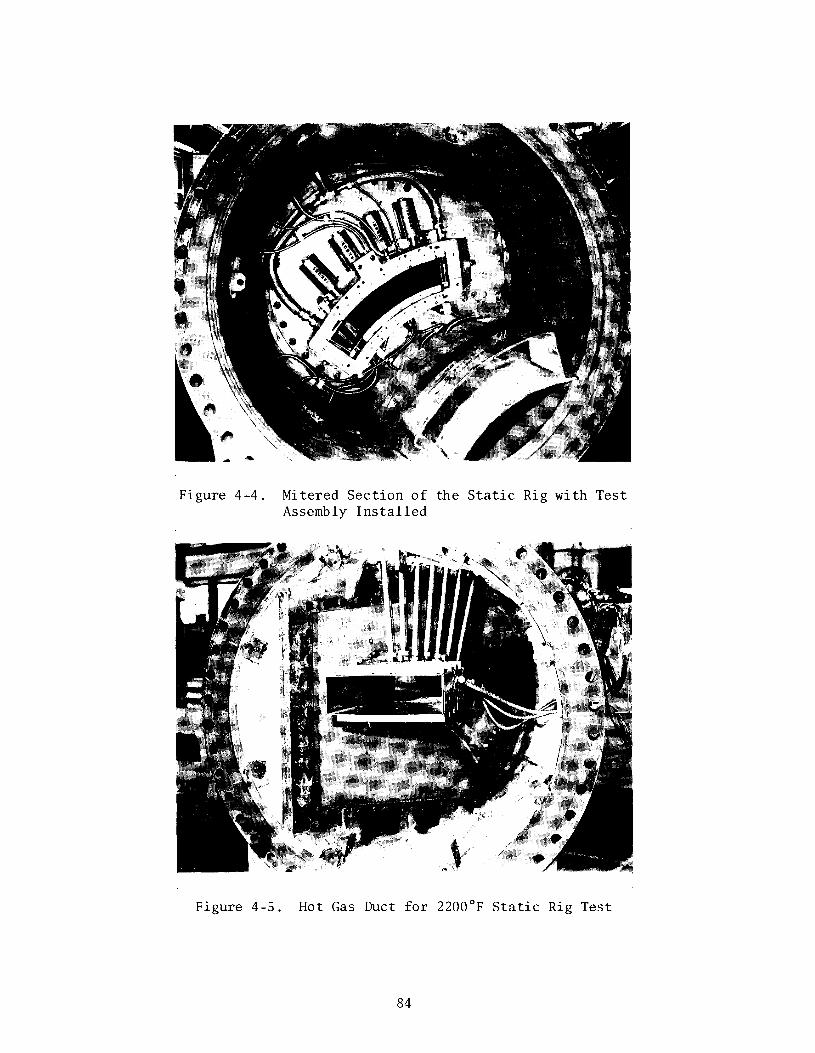
Mitered Section of the Static Rig with Test Assembly Installed
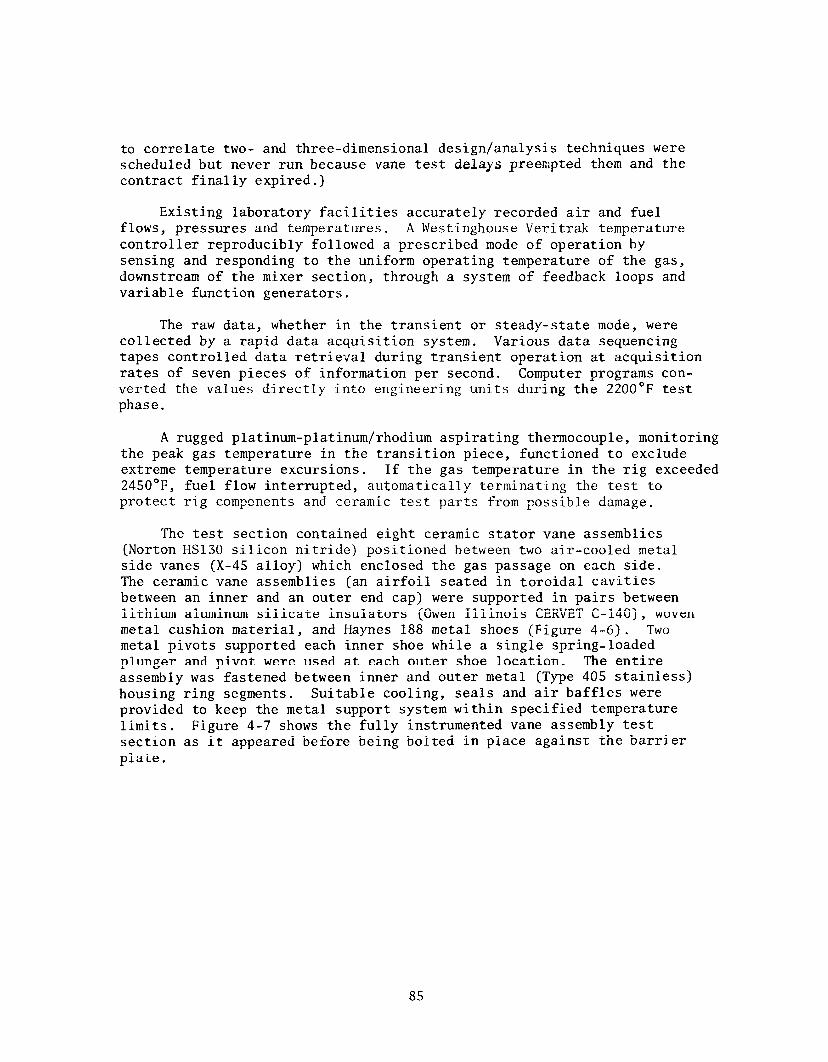
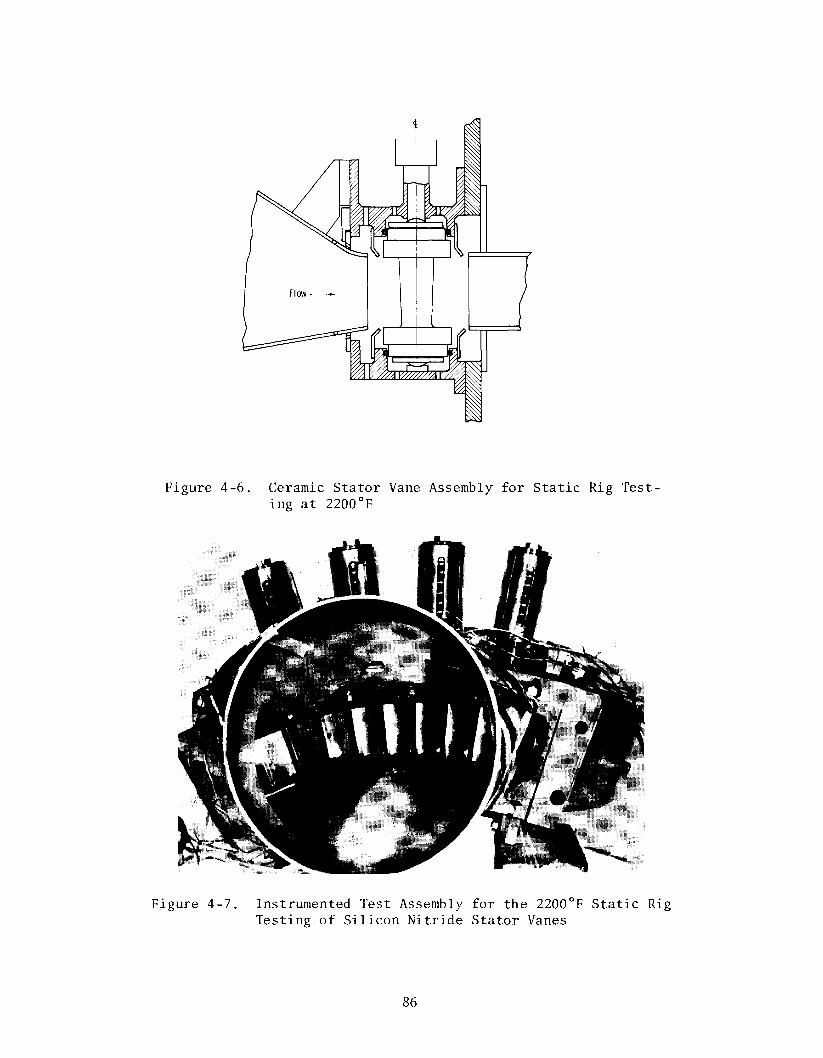
Hot Gas Duct for 2200'F Static Rig Test Ceramic Stator Vane Assembly for Static Rig Testing
at 2200°F Instrumented Test Assembly for the 2200'F Static Rig
Testing of Silicon Nitride Stator Vanes Relation of Peak Ceramic Vane Temperature to Temperature
Profile and Average Turbine Inlet Temperature Shutdown from 2500°F to 950'F (Gas Temperature) in
2.0 Seconds Shutdown from 2200°F to 950'F (Gas Temperature) in
2.0 Seconds
75
76
77
82
82
83
84
84
86
86
87
88
89
Vlll
Figure
4-11 4-12
4-13
4-14
4-15
4-16
4-17
4-18
4-19
4-20
4-21
4-22 4-23
4-24
4-25
4-26
4-27
4-28 4-29
4-30
4-31
4-32
4-33
Effects of lOO'F/Sec and 315'F/Sec Shutdown from 2500°F Effect of 25'F/Sec Shutdown from 2500'F on Stresses
Developed in Ceramic Vanes Effect of Controlled Temperature Decay from 2500°F on
Maximum Stress in Ceramic Airfoils Effect of Step Function Temperature Decay from 2500'F
on Maximum Stress Development in Ceramic Airfoils Maximum Stress History with Respect to Time for
Controlled Shutdown from 2500'F Normal and Emergency Shutdown from Base-Load to No-Load
Idle Conditions Shutdown from Base-Load to No-Load Idle Condtiions
(WSOlD) Final Shutdown from Idle Temperature for Normal,
Emergency and Full-Load Dump (WSOlD) Silicon Nitride Stator Vanes Assembled with Support
Structure for Test at 2200'F Test Cycle for 2200'F Static Rig Testing of First
Generation Silicon Nitride Vane Assemblies Typical Cycles and Cyclic History of 2200'F Silicon
Nitride Vane Tests The Two-Dimensional Analytical Model A Three-Dimensional Finite Element Plot for Heat Transfer
and Stress Calculations for Silicon Nitride Vanes Calculated Variations in Heat Transfer Coefficients at
Mid-Height Surface Locations Around a Silicon Nitride Airfoil
Transient Stress Distribution on the Suction Side of Silicon Nitride Airfoils as a Result of Emergency Shutdown from 2225°F Peak Temperature
Transient Stress Distribution on the Pressure Side of Silicon Nitride Airfoils as a Result of Emergency Shutdown from 2225OF Peak Temperature
Temperature Profile for 2200°F Static Rig Tests - OF Comparison of Temperature Transients as Measured by
Downstream Control Thermocouples, Upstream Gas Thermocouple Rakes and the Radiation Pyrometer
Silicon Nitride Stator Vanes as Seen from View Port During 2200'F Tests in the Static Rig
Silicon Nitride Vanes in Static Rig Test Assembly at the Completion of 2200'F Tests
Ultraviolet Xyglo Photograph of Si3N4 Airfoil Showing Typical Crack Patterns after 2200'F Static Rig Tests (Suction Side of Airfoil)
Ultraviolet Xyglo Photograph of Typical Crack Pattern Development on the Pressure Side of Si3N4 Airfoil after 2200'F Static Rig Tests
ix
Page
89
90
91
91
92
93
93
94
96
97
98 99
99
100
101
101
102 103
103
104
105
106
Figure
4-34
4-35
4-36
4-37
4-38
4-39
4-40
4-41
4-42
4-43
4-44
4-45 4-46
4-47
4-48
4-49
4-50 4-51
4-52
4-53 4-54 4-55 4-56 4-57
4-58
Page
Ultraviolet Xyglo Photograph of Failure Indications in 107 Outer End Cap 6 After 2200'F Static Rig Tests
Ultraviolet Xyglo Photograph of Crack Pattern Develop- 108 ment in Outer End Cap 1 after 2200'F Static Rig Tests
The Concave Surface View (Pressure Side) of a Typical 109 Airfoil Section after Explosure to Hot Combustion Gases in the Static Test Rig at 2200'F Peak Test Temperature
The Convex Surface View (Suction Side) of a Typical Air- 110 foil Section after Exposure to Hot Combustion Gases in the Static Rig at 2200'F Peak Test Temperature
Inside Surface of an Outer End Cap after Exposure to Hot 110 Combustion Gases - Static Rig Test at 22bO'F Peak Temperature
Typical Failure Indications in LAS Insulators as Seen from the End Cap/Insulator Interface
Plan View of the Static Rig for the 2500'F (137O'C) Test of Ceramic Vanes
Installation of Ceramic Duct in the Static Rig for Tests at 2500°F Peak Temperature
Location of Ceramic Components in 2500'F (137O'C) Test Assembly
Typical Insulator Failures in Cervit C-140 LAS Material (2200OF Test)
One-Dimensional Radial Conduction/Convection/Radiation Heat Transfer Model, Steady-State Condition
Two-Dimensional Finite Element Heat Transfer Model Gas/Air Temperature versus Time Response for End Cap/
Insulator Combination
112
113
114
116
116
117
120
120
Convection Coefficient versus Time Response for End Cap/ 121 Insulator Combination
Insulator Hot Gas Transient Temperature Response for LAS Material 122
Insulator Hot Gas Transient Temperature Response for Hot Pressed Si3N4 Material 122
Insulator Two-Dimensional Stress Model 124 Insulator Hot Gas Two-Dimensional In-Plane Maximum
Stress Response of Hot Pressed Si3N4 Material 124
Insulator Hot Gas Two-Dimensional In-Plane Maximum Stress Response of LAS Material 125
Gas Temperature Profile at 1200'F (Idle) 127 Gas Temperature Profile at 1800°F 127 Gas Temperature Profiel at 2300'F 128 Extrapolated Gas Temperature Profile at 2500'F 128 Typical Cycle for 2500°F (137OOC) Testing Based on
Pryometer Response 129
Combustor Failure from 2500'F Static Rig Tests of Sic and Si3N4 Vanes 131
X
Figure
4-59
4-60 4-61 4-62
4-63
4-64 4-65
4-66
4-67
4-68 4-69
4-70 4-71 4-72 4-73
4-74 4-75
4-76
4-77
4-78
4-79
4-80
4-81
4-82
4-83
4-84
4-85
Silicon Nitride (Left) and Silicon Carbide (Right) Stator Vane Assemblies After 2500'F Static Rig Test (Five Cycles)
Ceramic Mixer-Inlet Side, 2500'F Static Rig Test Ceramic Mixer-Outlet Side, 2500°F Static Rig Test Typical Si3N4 Stator Vane Assembly After 2500°F
Test (Cleaned) Silicon Nitride Airfoil with Thermal Cracks After
2500'F Test Silicon Nitride Inner End Cap 2 After 2500'F Test Silicon Nitride Inner End Cap 4 After Static Rig Test
at 2500'F Silicon Carbide Outer End Cap 5 After Static Rig Test
at 2500'F Silicon Carbide Inner End Cap 6 After Static Rig Test
at 2500'F Insulators from 2500'F Static Rig Test (Five Cycles) Water Cooled Static Rig for 2500'F Testing of
Ceramic Vanes New Combustor with Additional Secondary Wall Cooling Water-Cooled Exhaust Duct Water Spray-Cooled Mixer Section Longitudinal View of the Ceramic Vane - 2500'F Static
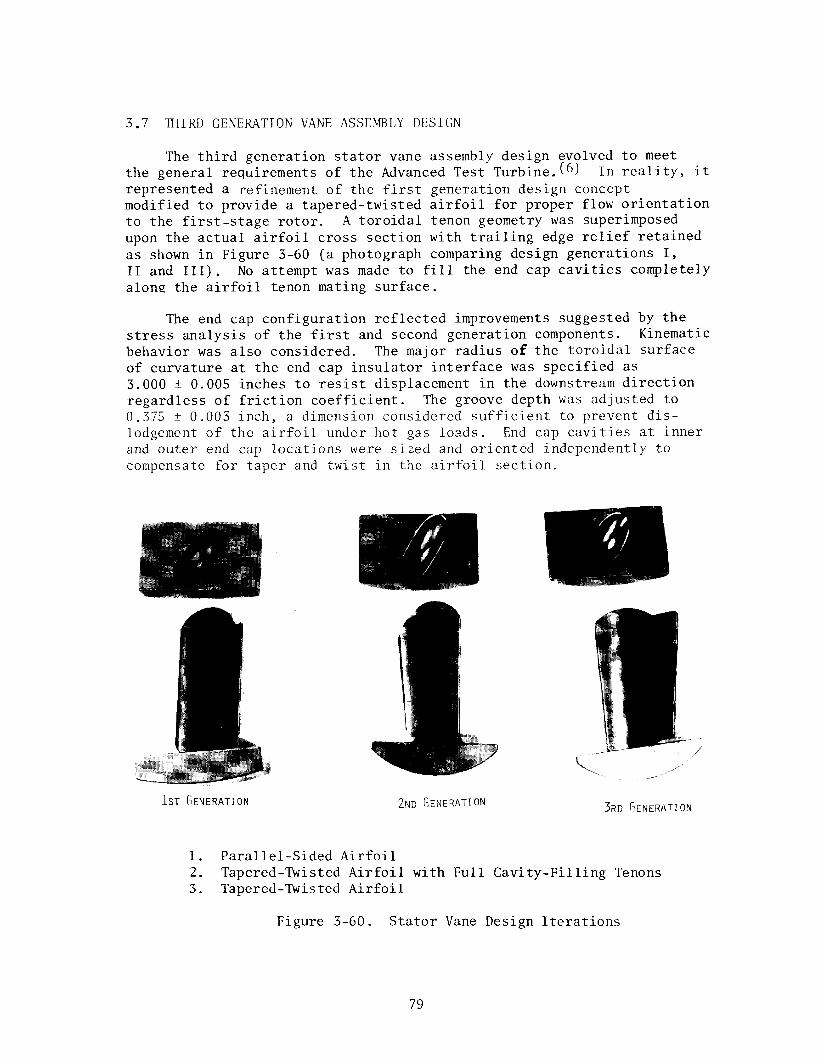
Rig Test Fixture Third Generation Stator Vane Assembly Components Hot Pressed Silicon Nitride Stator Vanes (Norton NC132)
for 2500'F Static Rig Testing - Airfoils 3 and 6 (from left) Were Preoxided 103 Hours in Alumina Lined Muffle Furnace at 2SOO'F (Static Air)
2500'F Static Rig Test Assembly in Place Showing Aspirating Thermocouple Rakes
Inner and Outer Boron Nitride Insulators for 2500°F Static Rig
Gas Temperature Profile Under Steady-State Conditions at 1400'F
Gas Temperature Profile Under Steady-State Conditions at 2000'F (Mid-Load Temperature)
Gas Temperature Profile Under Steady-State Conditions at 2300°F (Thermocouple Rake Temperature Limit)
Extrapolated Gas Temperature Profile Under Steady-State Conditions at 2500°F (Peak Load Temperature)
Page
131
133 133
134
134
135
136
136
137 138
140
140 141 141
143
143
144
144
146
146
147
147
148
Gas Temperature vs Percent Airfoil Height (Leading Edge) for Extrapolation of Peak Load Gas Temperature Profile
148
Combustor Wall Temperature Under Peak Load Conditions at 2500'F
150
Planned Stator Vane Transient Thermal Cycle for 2500'F 150 Tests
Typical Transient Thermal Cycles as Recorded from Static Rig Testing at 2500'F (Cycles l-25 and 26-60, 151 Respectively)
xi
Figure
4-86
4-87
4-88
4-89
4-90
4-91
4-92
4-93
4-94
4-95
4-96
4-97
4-98
4-99
4-100
4-101 4-102 4-103 4-104
4-105
4-106
Page
Stator Vane Test Assembly as It Appeared in the Static Rig After 25 Cycles of Testing to 2500'F 151
(View from Downstream Location) Typical Example of Airfoil/End Cap Edge Loading
Resulting from the Shift in Outer End Cap Position 152
(Cycles l-25, 2500°F Static Rig Test) Illustration of Outer End Cap Position Shift During
Static Rig Tests at 2500'F (Cycles l-25) 152
Silicon Nitride Stator Vane Components as They Appeared After 25 Cycles of Testing in the Static Rig at 2500'F 153
Failure Indications in Silicon Nitride Stator Vane Components After 25 Cycles of Transient Testing in the Static Rig at 2500'F 154
Typical Example of Chipping at the Inner End Cap/Airftiil Tenon Interface (Cycles l-25, Static Rig Test at 2500')
Failure in Outer End Cap 1 from 2500'F Static Rig Test (Cycles l-25)
Silicon Nitride Stator Vanes Installed in Static Rig for Continuation of 2500'F Tests (Airfoils 3 and 6 Were Preoxidized for 100 hours in an Alumina-Lined Muffle Furnace at 2500'F).
Failure Indications in Silicon Nitride Stator Vane Airfoils (Cycles 26-60, Static Rig Testing at 2500OF)
Trailing Edge View of Si3N4 Components after 2500°F Static Rig Test (Cycles 26-60)
Stator Vane Components and Insulators from Static Rig Testing at 2500'F (Cycles 26-60)
Contact Areas on Outer Airfoil Tenons Defined Along Machine Chatter Marks
Ultraviolet Macrographs of Airfoil 5 Showing Cracks as Revealed by Dye Penetrant
Ultraviolet Macrographs of Vane 6 (preoxidized) Showing Cracks as Revealed by Dye Penetrant
Silicon Nitride Stator Vanes Assembled for Test at
Gas Temperature Profile at 1400°F Peak (Cycles 61-103) 161 Gas Temperature Profile at 2000°F Peak (Cycles 61-103) 162 Gas Temperature Profile at 2300'F Peak (Cycles 61-103) 162 Extrapolated Gas Temperature Profile for 2500°F Peak
(Cycles 61-103) 163 Gas Temperature Distribution Along Airfoil Leading
Edge with Respect to Time of Shutdown 164 Peak Gas Temperature During Controlled Shutdown
Transient as Measured by the Supervisory Thermo- 164 couple (Cycles 61-103
xii
Figure
4-107
Page
Ceramic Vane Temperature Record (Pyrometer Measurement) for Final 43 Cycles of Static Rig Testing at 2500'F
165
(Cycles 61-103) 4-108 Static Rig Test Fixture with Ceramic Vanes in Place at
the Conclusion of 2500'F Testing - Pressure Side View 166
(Cycles 61-103) 4-109 Static Rig Test Fixture with Ceramic Vane Assemblies in
Place at the Conclusion of 2500'F Testing - Suction Side View (Cycles 61-103)
4-110 Failure Indications in Airfoil 8 as Seen from Pressure and Suction Sides (Cycles 61-103, 2500'F Static Rig 167
Test) 4-111 4-112
Fracture Origin in Fillet Radius of Airfoil 8 168 The Three-Dimensional Finite Element Model of the
Parallel-Sided, Nontwisted Airfoil Section (Generation 172 I) Used for the Final Heat Transfer - Stress Analysis of Ceramic Vanes
4-113 A Comparison of Airfoil Section Geometries, the Parallel-
4-114
4-115 4-116 4-117
4-118
4-119
4-120
4-121
4-122
4-123
4-124
Sided, Nontwisted Section (Generation I) Analyzed and the Tapered-Twisted Section (Generation III)
Thermoelastic Properties of Hot Pressed Si3N4 (Norton NC132)
Heat Transfer Coefficients at the Airfoil Surface Three Conditions of Transient Thermal Shutdown Radial Gas Temperature Profiles for the Cooled-
Wall Combustor Radial Gas Temperature Profiles for the W251 Production
Turbine Combustor Extrapolated Gas Temperature Profiles for Three
Combustor Types at 2500'F Peak Gas Temperature Profile Model for Production-Type
Combustor at 2500°F Peak Gas Temperature Outer Profile Model for Cooled-Wall
Combustor at 2500°F Peak Gas Temperature Inner Profile Model for Cooled-Wall
Combustor at 2500'F Peak Comparison of Inner and Outer Gas Temperature Profile
Models for the Cooled-Wall Combustor Comparison of Inner-Half Cooled-Wall Combustor Profile
with Pyrometer Temperature Measurement from 2500'F Test
4-125 Comparison of Outer-Half Cooled-Wall Combustor Profile with Pyrometer Temperature Measurement from 2500°F Test
4-126 Airfoil Temperature Response for a Linear Shutdown Transient at 25"F/sec Using the Uniform Gas Temperature Profile
4-127 The Effect of the Production Combustor Gas Temperature Profile on Airfoil Temperature Response for a Linear Shutdown Transient at 2S°F/sec
xiii
172
173
173 174
174
175
175
176
176
177
177
178
179
179
180
Figure
4-128
4-129
4-130
4-131
4-132
4-133
4-134
4-135
4-136
4-137
4-138
4-139
4-140
4-141
4-142
The Effect of the Cooled-Wall Inner-Half Gas Tempera- ture Profile on Airfoil Temperature Response for a Linear Shutdown Transient at 25'F/sec
The Effect of the Cooled-Wall Outer-Half Combustor Profile on Airfoil Temperature Response for a Linear Shutdown Transient at 25"F/sec
The Effect of a Uniform Combustor Profile on Airfoil Temperature Response for the Controlled, Nonlinear, Shutdown Transient of the 2500°F Static Rig Test
The Effect of the Production Combustor Gas Temperature Profile on Airfoil Temperature Response for the Controlled, Nonlinear Shutdown Transient of the 2500'F Static Rig Test
The Effect of the Cooled-Wall Inner-Half Gas Temperature Profile on Airfoil Temperature Response for the Controlled, Nonlinear Shutdown Transient of the 2500'F Static Rig Test
The Effect of the Cooled-Wall Inner-Half Gas Tempera- ture Profile on Airfoil Temperature Response for an Emergency Shutdown (Fuel Trip) Transient
A Comparison of the Analytical and 2500°F Static Rig Test Results for the Cooled-Wall Inner-Half Gas Temperature Profile and the Controlled Nonlinear Shutdown Transient of the 2500°F Static Rig Test
Page
180
181
182
182
183
183
184
Stress and Temperature Distributions in a Ceramic Airfoil Resulting from Steady-State Condition at 2500'F and the First Ramp of the Controlled, Nonlinear Shutdown 186
Transient and the Cooled-Wall Inner-Half Gas Tempera- ture Profile
The State of Stress in a Plate Analogy for the Produc- tion Combustor Gas Temperature Profile Under Steady- 187
State Conditions Airfoil Section Steady-State Stress and Temperature
Distributions Resulting from the Production Combustor 188
Gas Temperature Profile Airfoil Section Steady-State Stress and Temperature
Distribtuions Resulting from the Cooled-Wall Inner- Half Combustor Gas Temperature Profile
The State of Stress in a Heated Strip Analogy for the Cooled-Wall Outer-Half Gas Temperature Profile
Airfoil Section Steady-State Stress and Temperature Distributions Resulting from the Cooled-Wall Outer- Half Gas Temperature Profile
The Effect of a Linear Shutdown Transient on the State of Stress and Temperature in an Airfoil Section Resulting from a Uniform Gas Temperature Profile
The Effect of a Linear Shutdown Transient on the State of Stress and Temperature in an Airfoil Section Resulting from the Cooled-Wall Inner-Half Gas Temperature Profile
xiv
189
189
191
193
194
Figure Page
4-143
4-144
4-145
4-146
4-147
4-148
4-149
4-150
4-151
4-152
4-153
The Effect of a Linear Shutdown Transient on the Development of Maximum Principal Stress in an Air-
196
foil Section Resulting from a Uniform Gas Temperature Profile
The Effect of a Linear Shutdown Transient on the 196 Development of Maximum Principal Stress in an Airfoil Section Resulting from the Production Combustor Gas Temperature Profile
The Effect of a Linear Shutdown Transient on the Development of Maximum Principal Stress in an
197
Airfoil Section Resulting from the Cooled-Wall/ Inner-Half Combustor Gas Temperature Profile
The Effect of the Nonlinear, Controlled Shutdown Transient on the Development of Maximum Principal
198
Stress in an Airfoil Section from Cases Bl - the Uniform, B2 - The Production Combustor, and B3 - The Cooled-Wall Inner-Half Combustor Gas Temperature Profile
The Effect of an Emergency Shutdown Transient on the Development of Maximum Principal Stress in an Air-
199
foil Section Resulting from the Cooled-Wall/Inner- Half Combustor Gas Temperature Profile
The Effect of a Linear Shutdown Transient on Stress and lg9 Temperature Gradients in an Airfoil Section at Mid- Chord (50% Vane Height) Resulting from a Uniform Gas Temperature
The Effect of a Uniform Shutdown Transient on Stress and Temperature Gradients in an Airfoil Section at
200
41% Vane Height Resulting from the Cooled-Wall/ Inner-Half Combustor Gas Temperature Profile
The Maximum Principal Stress and Temperature Gradients 2oo Developed on the Pressure Side of a Ceramic Airfoil as a Result of a Linear Shutdown Transient in a Cooled-Wall/Inner-Half Combustor Gas Temperature Profile
The Maximum Principal Stress and Temperature Gradients in an Airfoil Section Developed as a Result of a 201 Linear Shutdown Transient with the Production (Hot Wall) Combustor Gas Temperature Profile
The Maximum Principal Stress and Temperature Gradients 2ol in an Airfoil Section Developed as a Result of a Linear Shutdown Transient with the Cooled-Wall/Inner- Half Combustor Gas Temperature Profile
Maximum Principal Stress and Temperature Gradients in an Airfoil Section Developed as a Result of the Nonlinear, Controlled Shutdown with the Cooled-Wall/ Inner-Half Combustor Gas Temperature Profile
Figure
4-154
4-155
4-156
4-157
Maximum Principal Stress and Temperature Gradients in an Airfoil Section Developed as a Result of an
203
Emergency Shutdown Transient with the Cooled-Wall/ Inner-Half Combustor Gas Temperature Profile
Stress-Strain Data for Norton Silicon Nitride (NC132) Compared with Calculated Pseudo-Elastic Properties
203
Airfoil Tensile Strength Comparison with Billet Tensile Property Data
204
Tensile Strength of Airfoils 4 and 5 as a Function 204 of Temperature
4-158
5-l
Airfoil Tensile Strength and Performance Summary
Airfoil Blanks Machined from HS130 Si3N4 by Norton Company
5-2 5-3 5-4
5-5
5-6
Major Steps in the Machining of the Airfoil 210 Steps in the Grinding of an End Cap 210 First-Generation Stator Vane Assemblies as Supplied
by Norton from HS130 Silicon Nitride 211
"Xyglo 'I Photograph of Two Machined Airfoils Showing Surface Scratches and a Crack on the Trailing Edge
212
of Airfoil 19 "Xyglo I' Photograph of End Cap 27 Irregularities Showing 213
5-7 Scratches Inside the Cavity and Surface
Ultrasonic Scan of an End Cap Indicating Low Density Inclusion (Large Peaks Are Reflections from Top and Bottom Surfaces)
5-8
5-9
S-10 5-11
Second Generation Silicon Carbide (Left) and Silicon Nitride (Right) Stator Vane Assemblies
Tapered-Twised Airfoil Drawing Identifying the Blend Radius and Trailing Edge Deviation
Third Generation Stator Vane Assembly Components Sectioned Plastic Cast of Tapered-Twisted Airfoil
Blank 5-12 Section by Section Airfoil Inspection Record 5-13 Airfoil Section Comparison Showing Typical Twist 5-14 Effect of Airfoil Angularity Machining Error 5-15 Correct End Cap to End Cap Orientation Resulting
5-16
S-17 5-18 5-19
from Proper Airfoil Tenon Angularity Blueing-Powder Display of Machine Chatter on Airfoil
Tenon Surface Airfoil Processing End Cap Processing Energy Research CVD Silicon Carbide Hollow Vane
Page
206
209
214
216
218
218
220
221 222 223
223
224
225 227 230
xvi
LIST OF TABLES
Table
2-l
4-l 4-2 4-3
4-4 4-5 4-6
COMPARISON OF Si3N4 PROPERTY DATA
INSULATOR MATERIAL STRESS COMPARISON END CAP STRESSES FOR VARIOUS INSULATOR MATERIALS A COMPARISON OF STATIC RIG AND ANALYTICAL HEAT
TRANSFER RESULTS STEADY-STATE STRESSES IN AIRFOIL SECTIONS (psi) TRANSIENT THERMAL STRESS IN AIRFOIL SECTIONS STATIC RIG TEST AIRFOIL BILLET UNOXIDIZED FLEXURAL
The Stationary Gas Turbine Project represents the Westinghouse con- tribution to the Defense Advanced Research Project Agency (DARPA) spon- sored "Brittle Material Design, High Temperature Turbine" program, Order Number 1849, Contract Number DAAG-46-71-C-0162,
The final report is presented in four volumes as follows:
Volume I - Program Summary
Volume II - Ceramic Stator Vane Development
Volume III - Rotor Blade Development and Turbine Modification
Volume IV - Materials Technology
Final results of static rig testing and analysis for the tenth semi- annual report period are included as part of this final report which represents a comprehensive project review summarizing the activities from July 1, 1971 to June 30, 1976.
Westinghouse performed this work under subcontract to the Ford Motor Company, prime contractor for the Defense Advanced Research Project Agency. The Army Material and Mechanics Research Center (AMMRC) at Watertown Arsenal, Watertown, Massachusetts, served as Program Monitor for DARPA.
The program's overall Principal Investigator was Mr. A. F. McLean, who also served as Program Manager for the Ford Vehicular Turbine Project.
Dr. R. J. Bratton was Principal Investigator and Program Manager for Westinghouse. Mr. D. G. Miller served as Project Engineer. Mr. A. N. Holden, now deceased, functioned as Project Manager at Westinghouse Generation Systems Division from July 1, 1971 to May 1, 1975. Mr. G. Levari succeeded Mr. Holden with Mr. C. R. Booher, Jr, accepting respon- sibility for design, analysis and rig testing for the Division at that time.
Westinghouse wishes to acknowledge the efforts of the following personnel who contributed to the program:
1. Dr. Maurice J. Sinnott who conceived and started the program when he was at DARPA in 1971.
xviii
2. DARPA - for support of the program. Dr. E. Van Reuth and Dr. M. Stickley for their interest and support.
3. AMMRC - for monitoring the program. Dr. E, S. Wright, who replaced Dr. A. E. Gorum (presently retired) as Technical Monitor, and Drs. R. N. Katz, E.N. Lenoe and H. Priest.
4. Ford Motor Co. - A. F, McLean, T. W, McLaughlin, E. A. Fisher, P. Berry, R. R. Baker and A. Paluszny.
The final report was prepared and edited by D. G. Miller and R, J. Bratton with editing assistance from E. J. Phillips. Contributions to the final report were made by C. R.Booher, Jr., S. C. Singhal, F. F. Lange, W. Van Buren and E. S. Diaz.
Other Westinghouse and former Westinghouse employees who contributed to the technical program include:
Westinghouse Generation Systems Division
J. Allen, G. W. Bauserman, D. D. Lawthers, L. Kish, F. Laus, S. D. Leshnoff, S. Mumford, T. J. Rahaim, J, D. Roughgarden, S. C. Sanday, R. J. Schaller, C. E. Seglem, E. J. Stenowoj, J. P. Smed, L. C. Szema, S. Twiss, E. H. Wiler, D. D. Wood
Westinghouse R&D Center
D. Boes, W. C. Frazier, R, Kossowsky, S, Y. Lee, C, Visser, J. H. White, W. E. Young, S. Gabrielse, D. E. Harrison
This final report is dedicated to A. N. Holden,
xix
SECTION 1
INTRODUCTION
The "Brittle Materials Design - High.Temperature Gas Turbine" program was formulated under the auspices of the Defense Advanced Research Projects Agency (DARPA) of the Department of Defense (DOD) to demonstrate the use of brittle material design concepts in the successful application of ceramics as structural components in high temperature gas turbines. The talents of the Ford Motor Company and Westinghouse, as prime and subcontractor, respectively, were directed toward the development of a vehicular ceramic turbine (Ford) and a ceramic stator vane for a large stationary gas turbine (Westinghouse). The Army Materials and Mechanics Research Center (AMMRC) served as technical monitor for DARPA.
The five-year performance period of the Westinghouse Stationary Gas Turbine Project, July 1, 1971 through June 30, 1976, is summarized in Volume I, "The Program Summary" of this report. Here in Volume II, "High Temperature Stationary Gas Turbine - Ceramic Stator Vane Develop- ment," the engineering aspects of ceramic stator vane design, analysis, fabrication, testing, and verification are described in a comprehensive manner. A three-piece stator vane with all supporting structure for the inlet, first stage of a Westinghouse W251 stationary gas turbine (Figure l-l) eventually evolved. After the development of a fully functional test facility, performance was evaluated under cyclic, controlled conditions at 0.8 turbine simulation (8 atmospheres pressure rather than 10.5 atmospheres as experienced in a turbine operating in the peaking power mode) in an instrumented static rig. The results of static rig testing at 2200 and 2500' were assessed in terms of failure analysis, relying heavily upon three-dimensional stress analyses.
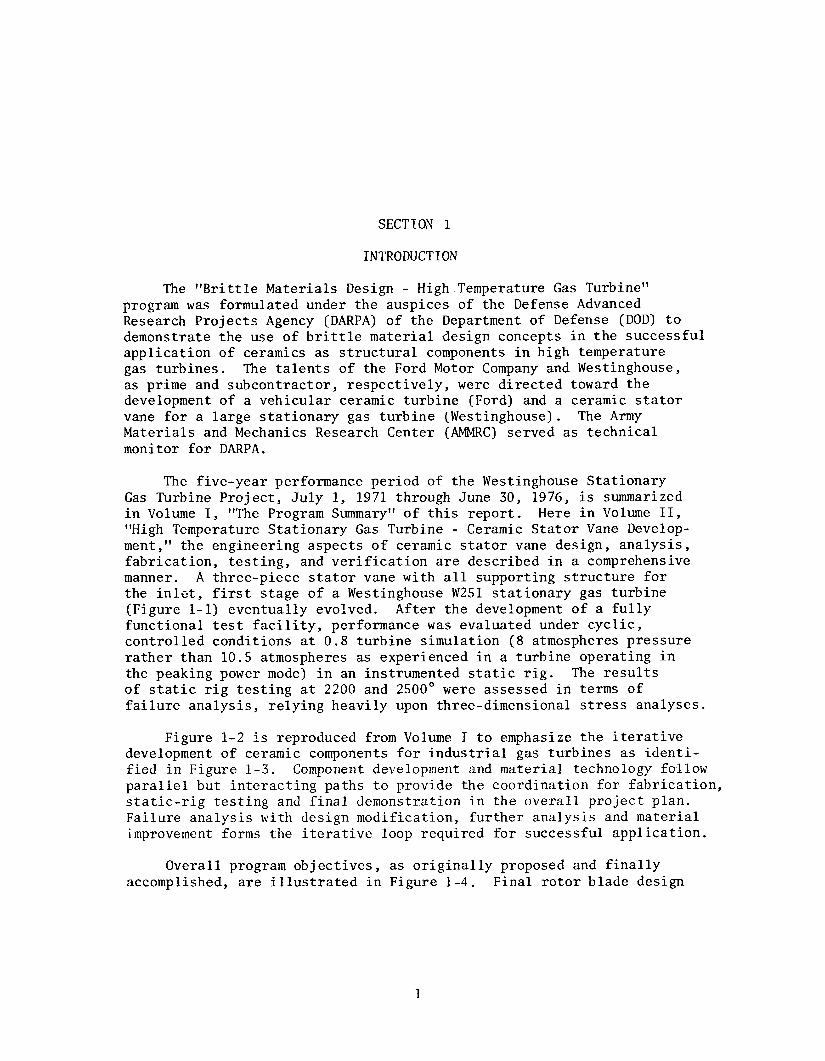
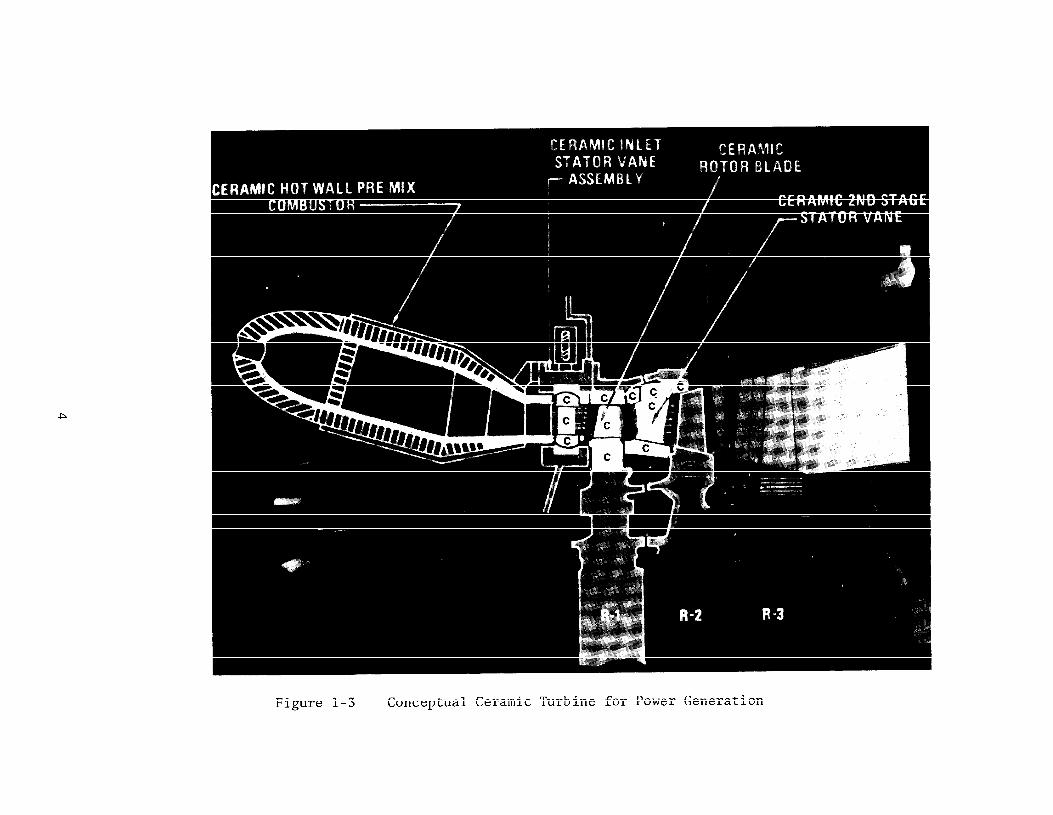
Figure 1-2 is reproduced from Volume I to emphasize the iterative development of ceramic components for industrial gas turbines as identi- fied in Figure l-3. Component development and material technology follow parallel but interacting paths to provide the coordination for fabrication, static-rig testing and final demonstration in the overall project plan. Failure analysis with design modification, further analysis and material improvement forms the iterative loop required for successful application.
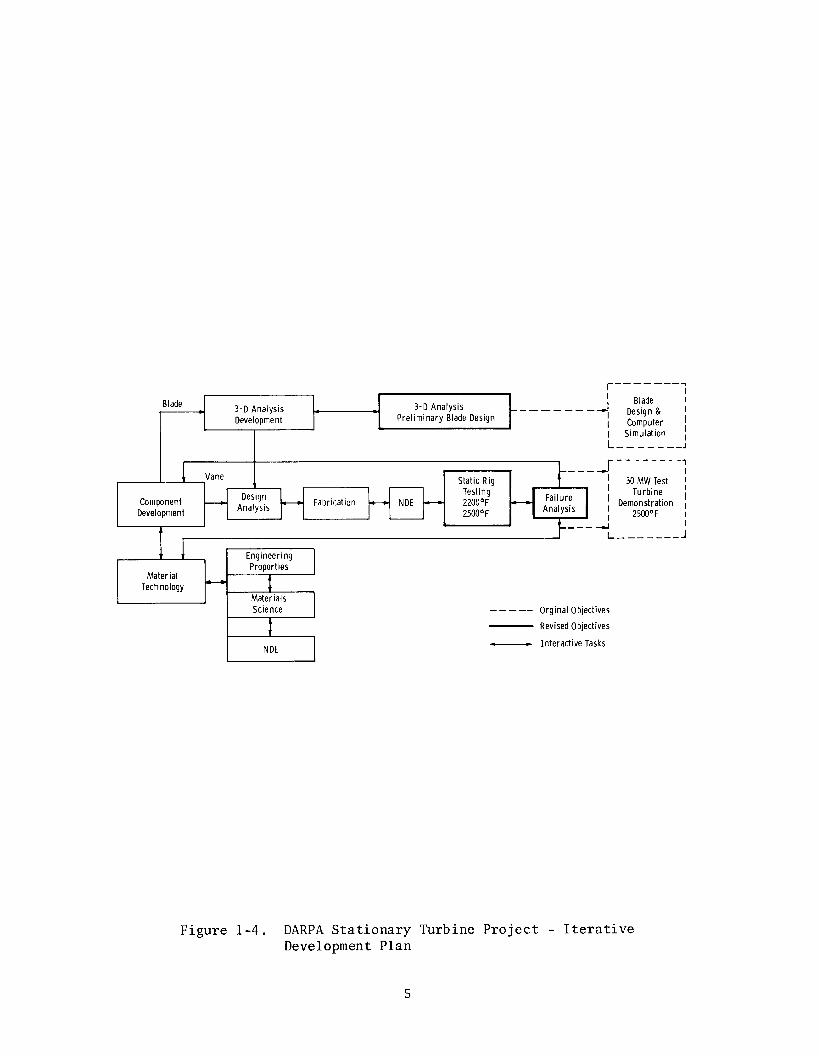
Overall program objectives, as originally proposed and finally accomplished, are illustrated in Figure l-4. Final rotor blade design
r---- ____________ -___- ______ ---_-- -___ y
I I
T
t ------ 1
Component - Design & I
Development Analysis 1
I I
Component Fabrication -
Rig - Failure Turbine
& N,DE Tests Anal. - Test
Material _ Properties of I Technology Fabrication +
A cc--- ----
I I L _____________________ -------------------3
1 Turbine
Field Test
- Interactive
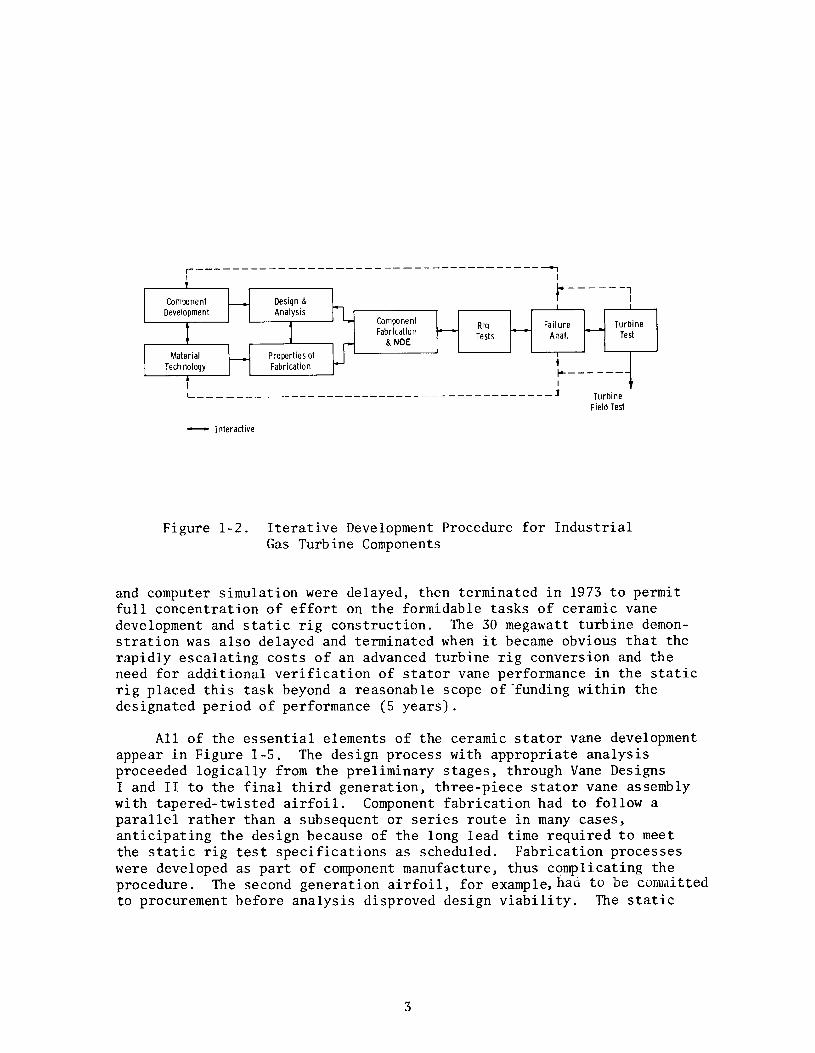
Figure l-2. Iterative Development Procedure for Industrial Gas Turbine Components
and computer simulation were delayed, then terminated in 1973 to permit full concentration of effort on the formidable tasks of ceramic vane development and static rig construction. The 30 megawatt turbine demon- stration was also delayed and terminated when it became obvious that the rapidly escalating costs of an advanced turbine rig conversion and the need for additional verification of stator vane performance in the static rig placed this task beyond a reasonable scope of -funding within the designated period of performance (5 years).
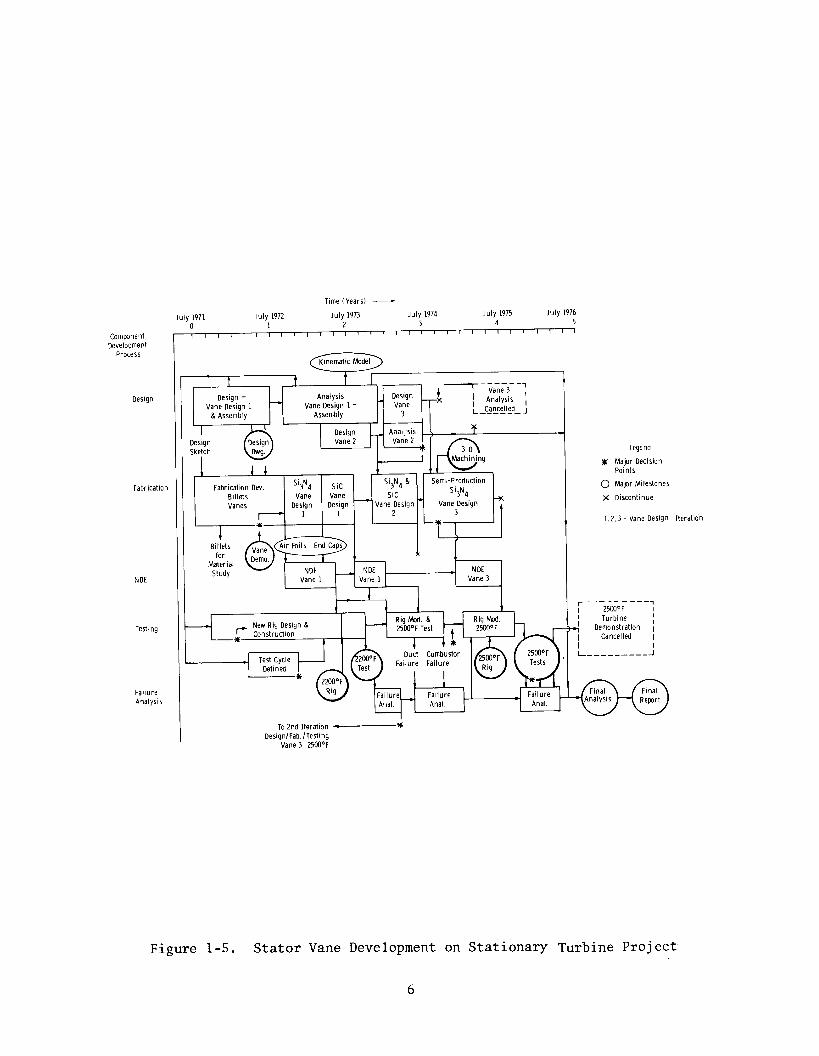
All of the essential elements of the ceramic stator vane development appear in Figure 1-5. The design process with appropriate analysis proceeded logically from the preliminary stages, through Vane Designs I and II to the final third generation, three-piece stator vane assembly with tapered-twisted airfoil. Component fabrication had to follow a parallel rather than a subsequent or series route in many cases, anticipating the design because of the long lead time required to meet the static rig test specifications as scheduled. Fabrication processes were developed as part of component manufacture, thus complicating the procedure. The second generation airfoil, for example, had to be committed to procurement before analysis disproved design viability. The static
Figure l-3 Conceptual Ceramic Turbine for Power Generation
r --------I . I I
Blade I Blade I
c 3-D Analysis . m 3-D Analysis _ ------ -- Development Preliminary Blade Design
Figure l-4. DARPA Stationary Turbine Project - Iterative Development Plan
5
Component Development
Process
Design
Fabrication
NDE
Testing
Farlure Analysts
July 1971 n
Time (Years) - July 1972 July 1973 July 1974 July 1975 July 1976
1 2 3 4 5
r 4 I
Design - Vane Design 1
& Assembly - Vane Design 1 -
Design Vane 2
Anal, sis Vane 2
Fabrication Dev. Billets Vanes
I I
1 Semi-Production Si3N4
Sic Si3N4 &
Vane Vane Sic Si3N4
- Vane Design * dc
Design Design Vane Design ,
- r
New Rig Design &
x Construction
Test Cycle Defined
r---2yy---; I t Turbine I
I ’ Demonstration t 1 t Cancelled t I I
To 2nd Iteration * Design/Fab. /Testing
Vane 3, 2500°F
Legend
m Major Decision Points
0 Major Milestones
X Discontinue
1.2. 3 - Vane Design Iteration
Figure 1-5. Stator Vane Development on Stationary Turbine Project
6
rig test facility planned as a simple modification of an existing rig became a dynamic development activity coincident with the design and fabrication tasks. Indeed, the static rig requirement to test at 2500’F became the critical element in the project plan. Only once, in the final phases of the program when the vendor failed to deliver acceptable third generation hardware on time, was a critical delay experienced for a reason other than static rig availability.
Although the total effort was directed toward high service temper- atures to increase power and efficiency,plans did not attempt to achieve specific levels of improved performance in either the static rig tests or an actual test turbine. The test cycle sequence, i.e., 100 cycles of peak load service at a maximum inlet temperature of 2500’F in a controlled shutdown mode, was selected to establish realistic boundary conditions for the demonstration of first stage stator vanes using the best commercial materials available. The boundary conditions thus established also served as a design constraint in the development of rotor blades as well as the stator vane components.
SECTION 2
PRELIMINARY DESIGN AND ANALYSIS
2.1 DESIGN
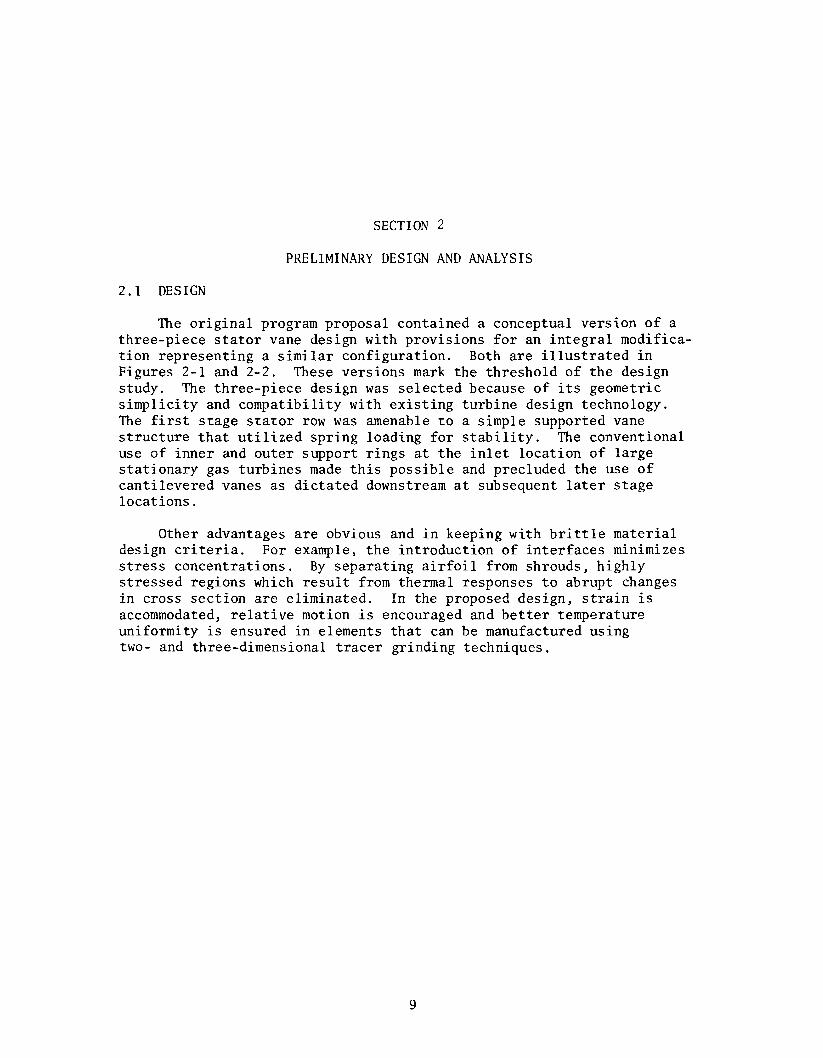
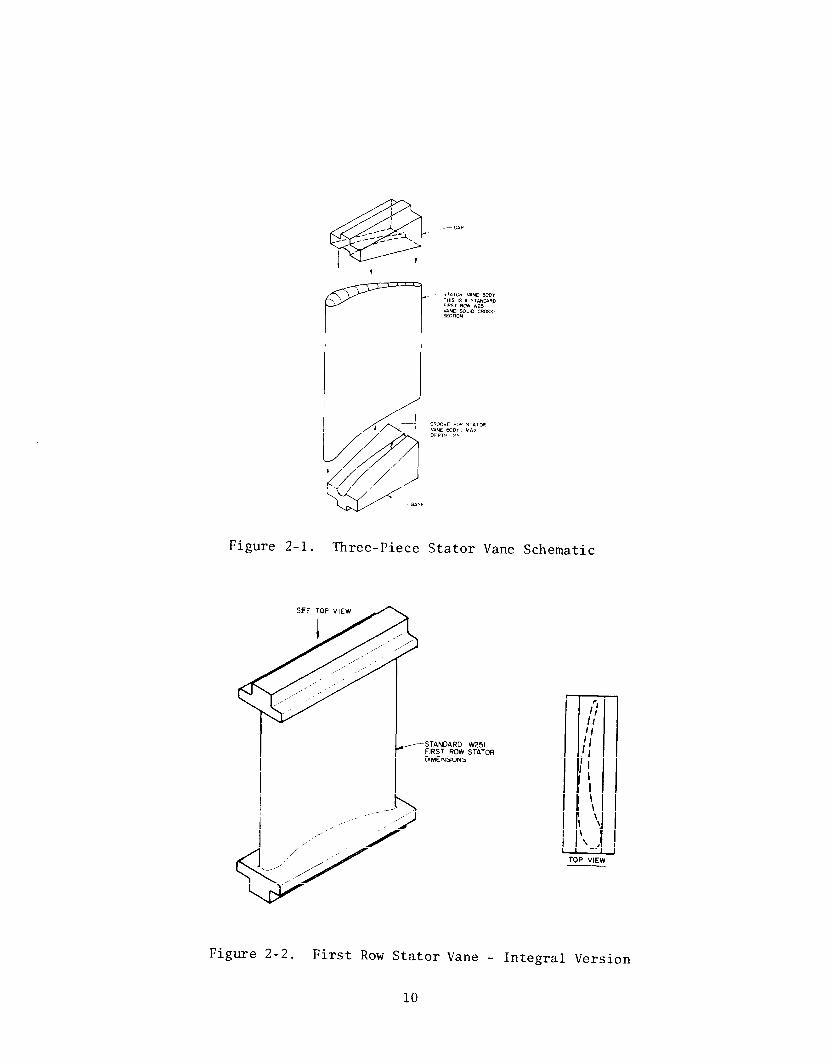
The original program proposal contained a conceptual version of a three-piece stator vane design with provisions for an integral modifica- tion representing a similar configuration. Both are illustrated in Figures 2-l and 2-2. These versions mark the threshold of the design study. The three-piece design was selected because of its geometric simplicity and compatibility with existing turbine design technology. The first stage stator row was amenable to a simple supported vane structure that utilized spring loading for stability. The conventional use of inner and outer support rings at the inlet location of large stationary gas turbines made this possible and precluded the use of cantilevered vanes as dictated downstream at subsequent later stage locations.
Other advantages are obvious and in keeping with brittle material design criteria. For example, the introduction of interfaces minimizes stress concentrations. By separating airfoil from shrouds, highly stressed regions which result from thermal responses to abrupt changes in cross section are eliminated. In the proposed design, strain is accommodated, relative motion is encouraged and better temperature uniformity is ensured in elements that can be manufactured using two- and three-dimensional tracer grinding techniques.
Figure 2-l. Three-Piece Stator Vane Schematic
STANDARD W251 FIRST ROW STATOR ‘XAENSIONS
Figure 2-2. First Row Stator Vane - Integral Version
10
2.2 ANALYSIS
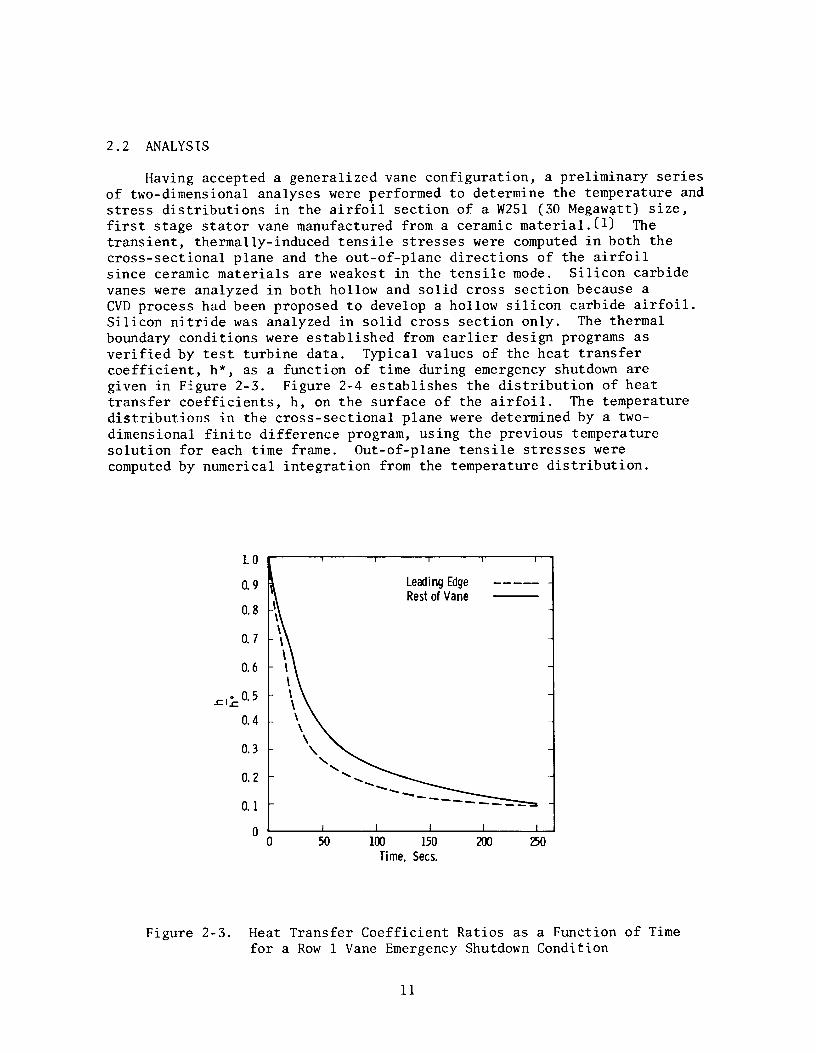
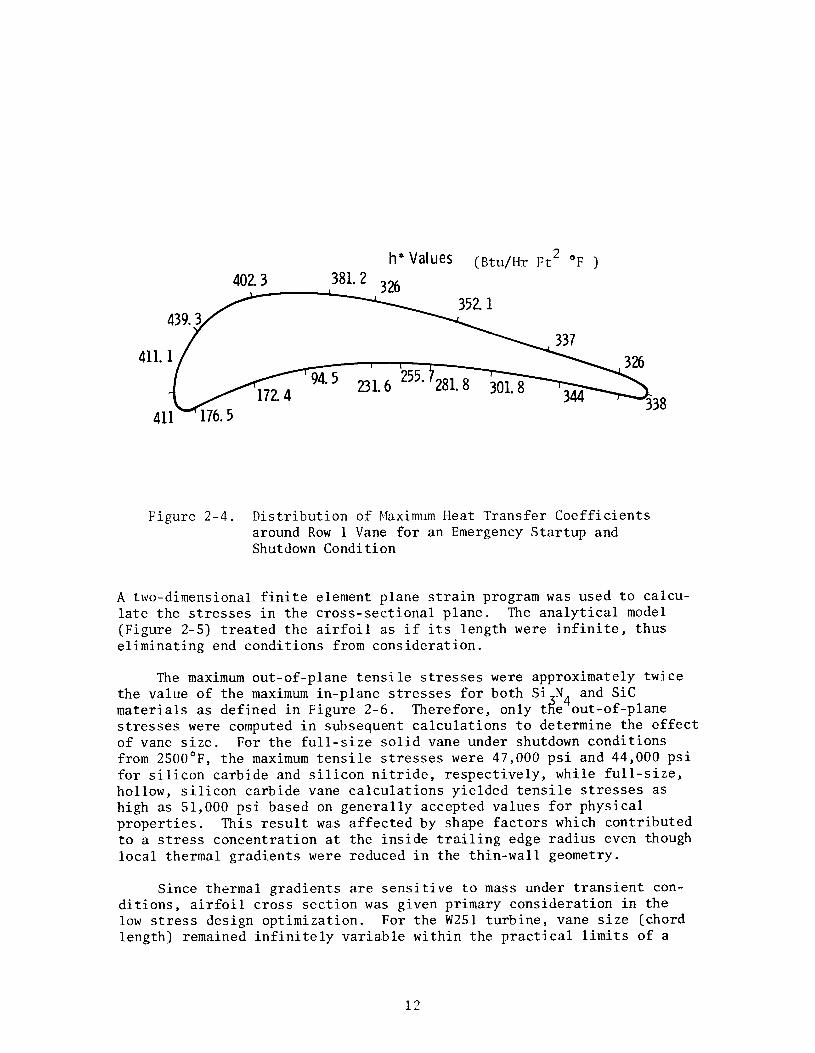
Having accepted a generalized vane configuration, a preliminary series of two-dimensional analyses were performed to determine the temperature and stress distributions in the airfoil section of a W251 (30 Megawatt) size, first stage stator vane manufactured from a ceramic material.(l) The transient, thermally-induced tensile stresses were computed in both the cross-sectional plane and the out-of-plane directions of the airfoil since ceramic materials are weakest in the tensile mode. Silicon carbide vanes were analyzed in both hollow and solid cross section because a CVD process had been proposed to develop a hollow silicon carbide airfoil. Silicon nitride was analyzed in solid cross section only. The thermal boundary conditions were established from earlier design programs as verified by test turbine data. Typical values of the heat transfer coefficient, h*, as a function of time during emergency shutdown are given in Figure 2-3. Figure 2-4 establishes the distribution of heat transfer coefficients, h, on the surface of the airfoil. The temperature distributions in the cross-sectional plane were determined by a two- dimensional finite difference program, using the previous temperature solution for each time frame. Out-of-plane tensile stresses were computed by numerical integration from the temperature distribution.
1.0
0. 9
0.8
0. 7
0.6
0.2
100 150 Time, Sea.
Figure 2-3. Heat Transfer Coefficient Ratios as a Function of Time for a Row 1 Vane Emergency Shutdown Condition
11
h*Values (Btu/Hr Ft2 "F ) 402.3
I 381.2 326
Figure 2-4. Distribution of Maximum Heat Transfer Coefficients around Row 1 Vane for an Emergency Startup and Shutdown Condition
A two-dimensional finite element plane strain program was used to calcu- late the stresses in the cross-sectional plane. The analytical model (Figure 2-5) treated the airfoil as if its length were infinite, thus eliminating end conditions from consideration.
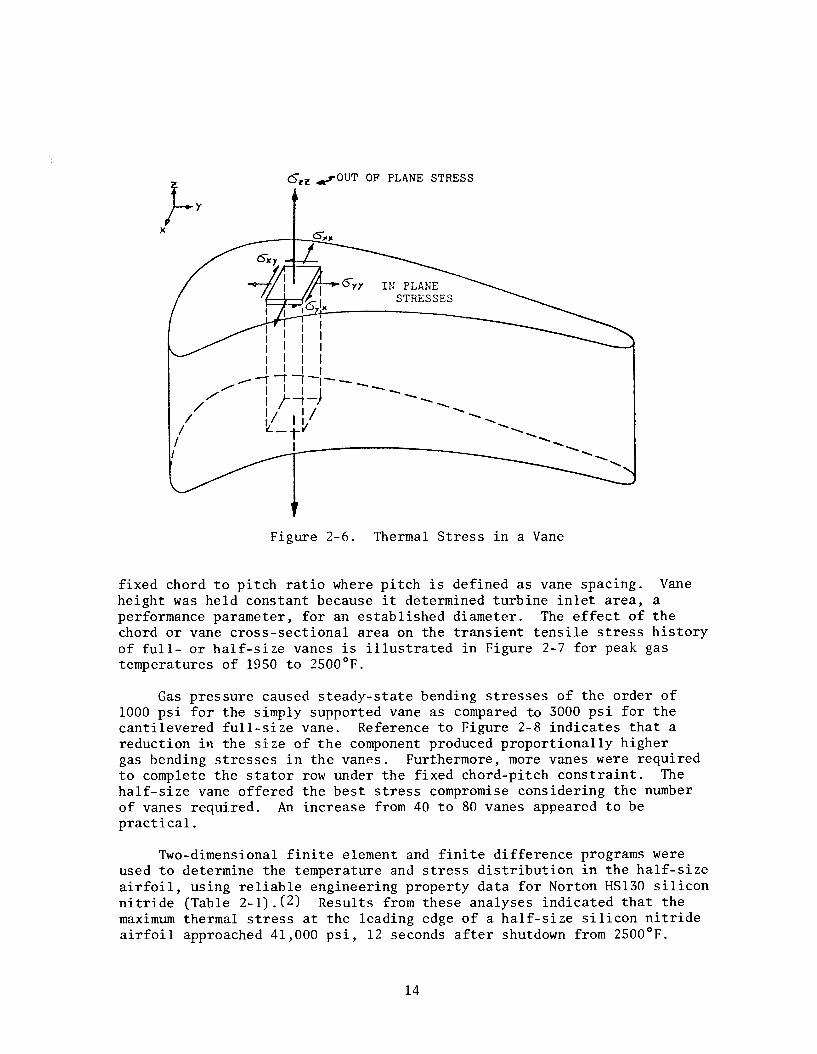
The maximum out-of-plane tensile stresses were approximately twice the value of the maximum in-plane stresses for both materials as defined in Figure 2-6.
Si N4 and Sic Therefore, only t e out-of-plane 2
stresses were computed in subsequent calculations to determine the effect of vane size. For the full-size solid vane under shutdown conditions from 2500°F, the maximum tensile stresses were 47,000 psi and 44,000 psi for silicon carbide and silicon nitride, respectively, while full-size, hollow, silicon carbide vane calculations yielded tensile stresses as high as 51,000 psi based on generally accepted values for physical properties. This result was affected by shape factors which contributed to a stress concentration at the inside trailing edge radius even though local thermal gradients were reduced in the thin-wall geometry.
Since thermal gradients are sensitive to mass under transient con- ditions, airfoil cross section was given primary consideration in the low stress design optimization. For the W251 turbine, vane size (chord length) remained infinitely variable within the practical limits of a
12
Figure 2-5. Two-Dimensional Finite Element Mesh for Solid Airfoil Section
Figure 2-6. Thermal Stress in a Vane
fixed chord to pitch ratio where pitch is defined as vane spacing. Vane height was held constant because it determined turbine inlet area, a performance parameter, for an established diameter. The effect of the chord or vane cross-sectional area on the transient tensile stress history of full- or half-size vanes is illustrated in Figure 2-7 for peak gas temperatures of 1950 to 2500°F.
Gas pressure caused steady-state bending stresses of the order of 1000 psi for the simply supported vane as compared to 3000 psi for the cantilevered full-size vane. Reference to Figure 2-8 indicates that a reduction in the size of the component produced proportionally higher gas bending stresses in the vanes. Furthermore, more vanes were required to complete the stator row under the fixed chord-pitch constraint. The half-size vane offered the best stress compromise considering the number of vanes required. An increase from 40 to 80 vanes appeared to be practical.
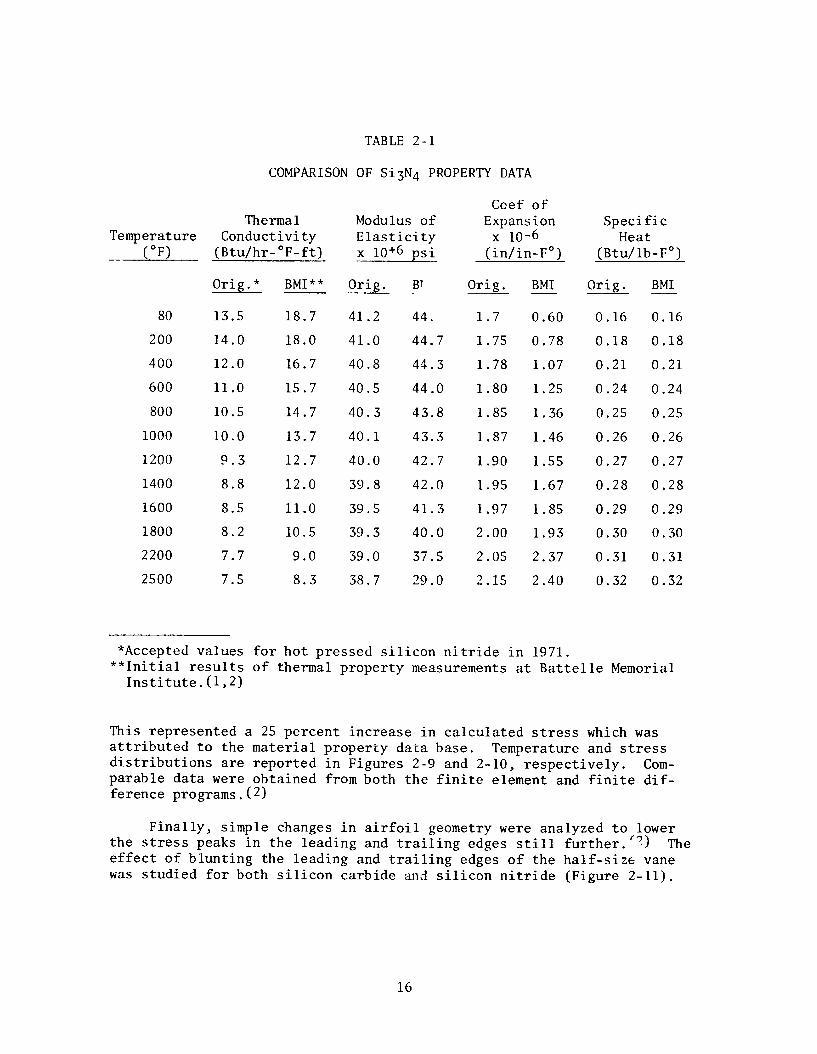
Two-dimensional finite element and finite difference programs were used to determine the temperature and stress distribution in the half-size airfoil, using reliable engineering property data for Norton HS130 silicon nitride (Table 2-l).(2) Results from these analyses indicated that the maximum thermal stress at the leading edge of a half-size silicon nitride airfoil approached 41,000 psi, 12 seconds after shutdown from 2500'F.
14
-1 Half \
b-‘- \
- - - - - 25OOO - 25OOO F F Gas Gas Temperature Temperature 1950°F Gas Temperature 1950°F Gas Temperature
I 10 10 20 20 30 30 40 50 40 50
Time, SeCS.
Figure 2-7. Stress History for Si3N4 Airfoils from 1950°F and 2500°F
I 45 ~-
\ 40 -1
\ 35 - \
w 3O - u” ’ 25- : 9,
I \ \ ’
\I I’
I I I I
- - I- - - - Th rmal e Gas,Bending
“0 20 40 60 80 100 120 140 160 180 Vanes/ Row
Figure 2-8. Maximum Stresses in Solid Airfoil tis a Function of Size
15
Temperature IOF)
80 13.5 18.7 41.2 44. 1.7 0.60
200 14.0 18.0 41.0 44.7 1.75 0.78
400 12.0 16.7 40.8 44.3 1.78 1.07
600 11.0 15.7 40.5 44.0 1.80 1.25
800 10.5 14.7 40.3 43.8 1.85 1.36
1000 10.0 13.7 40.1 43.3 1.87 1.46
1200 9.3 12.7 40.0 42.7 1.90 1.55
1400 8.8 12.0 39.8 42.0 1.95 1.67
1600 8.5 11.0 39.5 41.3 1.97 1.85
1800 8.2 10.5 39.3 40.0 2.00 1.93
2200 7.7 9.0 39.0 37.5 2.05 2.37
2500 7.5 8.3 38.7 29.0 2.15 2.40
TABLE 2-l
COMPARISON OF Si3N4 PROPERTY DATA
Thermal Modulus of Conductivity Elasticity
(Btu/hr-OF-ft) x 10+6 psi
Orig.* BMI"" Orig. B? Orig. BMI
Coef of Expansion
x 10-6 (in/in-F')
Specific Heat
(Btu/lb-F")
Orig.
0.16
0.18
0.21
0.24
0.25
0.26
0.27
0.28
0.29
0.30
0.31
0.32
BMI
0.16
0.18
0.21
0.24
0.25
0.26
0.27
0.28
0.29
0.30
0.31
0.32
*Accepted values for hot pressed silicon nitride in 1971. **Initial results of thermal property measurements at Battelle Memorial
Institute.(l,2)
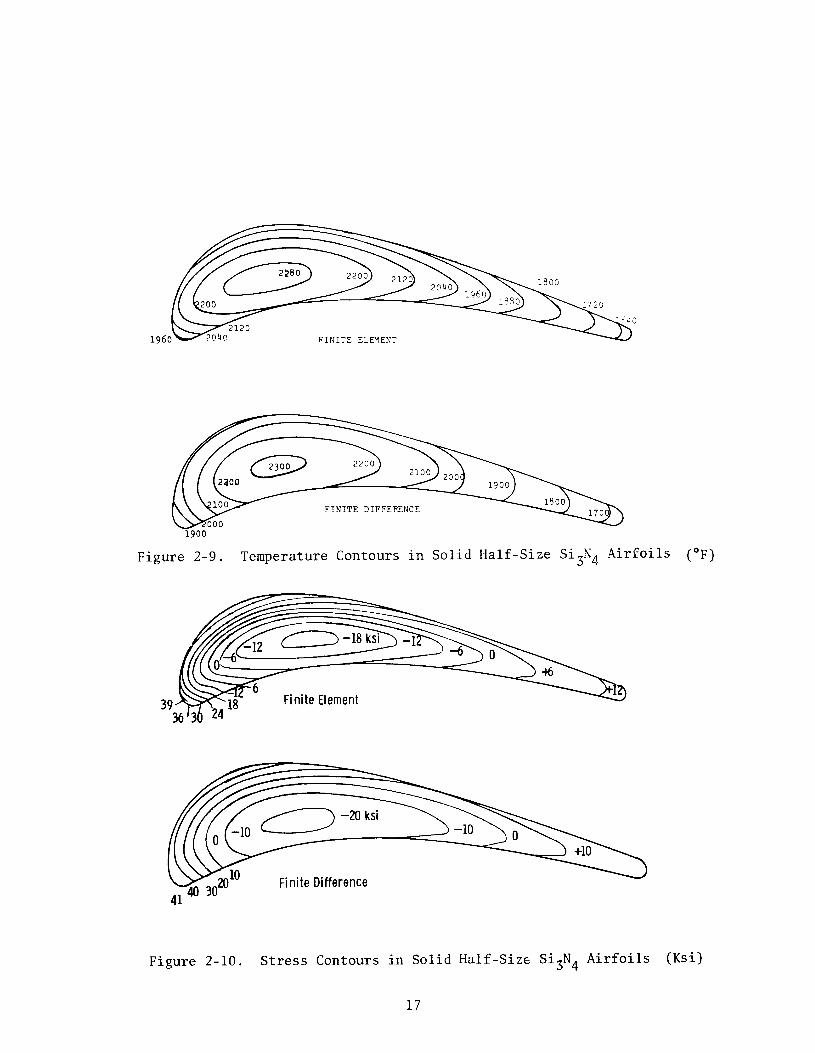
This represented a 25 percent increase in calculated stress which was attributed to the material property data base. Temperature and stress distributions are reported in Figures 2-9 and 2-10, respectively. Com- parable data were obtained from both the finite element and finite dif- ference programs.(2)
Finally, simple changes in airfoil geometry were analyzed to lower the stress peaks in the leading and trailing edges still further.'?) The effect of blunting the leading and trailing edges of the half-size vane was studied for both silicon carbide and silicon nitride (Figure 2-11).
16
1960 FINITE ELEMENT
FINITE DIFFERENCE
Figure 2-9. Temperature Contours in Solid Half-Size Si3N4 Airfoils
Fi ni te Difference
(OFI
Figure 2-10. Stress Contours in Solid Half-Size Si3N4 Airfoils (Ksi)
17
.095 - Radius
I unted)
(Blunted) Radius
Figure 2- 11. Dimensions of Blunted Leading and Trailing Edges of Ceramic Airfoils
An increase of 47 percent in leading edge radius produced negligible results. If the trailing edge radius and thickness were increased by 56 percent, the transient thermal stress would decrease 12 and 21 percent in Sic and Si N vanes, respectively. .qas made, 3 4
No change in the airfoil profile however, because the maximum stress occurred in the leading
edge where the effect of blunting was negligible. Furthermore, any increase in the trailing edge thickness beyond that employed would affect gas flow adversely because of increased turbulence. Since the maximum out-of-plane principal tensile stress in the trailing edge almost equaled that expected to develop in the leading edge, critical stress rather than maximum stress would determine the location of failure initiation if it did occur. Failures, possibly of this type, were observed only on three occasions. The first occured in the trailing edge of preoxidized airioil 3 during the initial 25 cycles of static rig testing at 2500°F.( ) Trailing edge failure ori ins were also identified in preoxidized airfoil 6 (cycles 26 - 60) 7 8) and airfoil 8 at the conclusion of the 2500’F static rig demonstration. No corrective action was taken and none appeared to be warranted.
18
2.3 CORRELATION OF DESIGN ANALYSIS CODES
The programs used to analyze stress development in vanes were corre- lated and corn ared with turbine passage experiments to establish their validity.( 2,313 A transient axisymmetric finite element computer program was developed and used to calculate stresses in cylinders subjected to uniform gas cooling from above 1600°F down to 600°F. This axisymmetric program developed the complete state of stress, both in plane 1 and plane 2, as defined in Figure 2-12. The results, from this axisymmetric program correlated well with the computational method, which used a finite differ- ence heat transfer program and numerical integration of stresses, when applied to a uniformly quenched cyclinder. The correlation increased the confidence of applying the existing programs to thermal shock tests in the turbine gas passage and to vane analyses.
Tests on silicon carbide were performed in the turbine passage. When the fuel was shut off, the gas temperature dropped from 2000°F (for example) to 600'F in a few seconds. Large thermal gradients were measured by thermocouples in a second Sic cylinder located beside the test cylinder. The stresses induced by differential thermal expansion caused cracking in the axial direction. Both computer methods predicted that axial stresses should be larger than circumferential stresses, and that circumferential cracks should appear.
Figure 2-12. Thermal Quench Cylinder Coordinate System
19
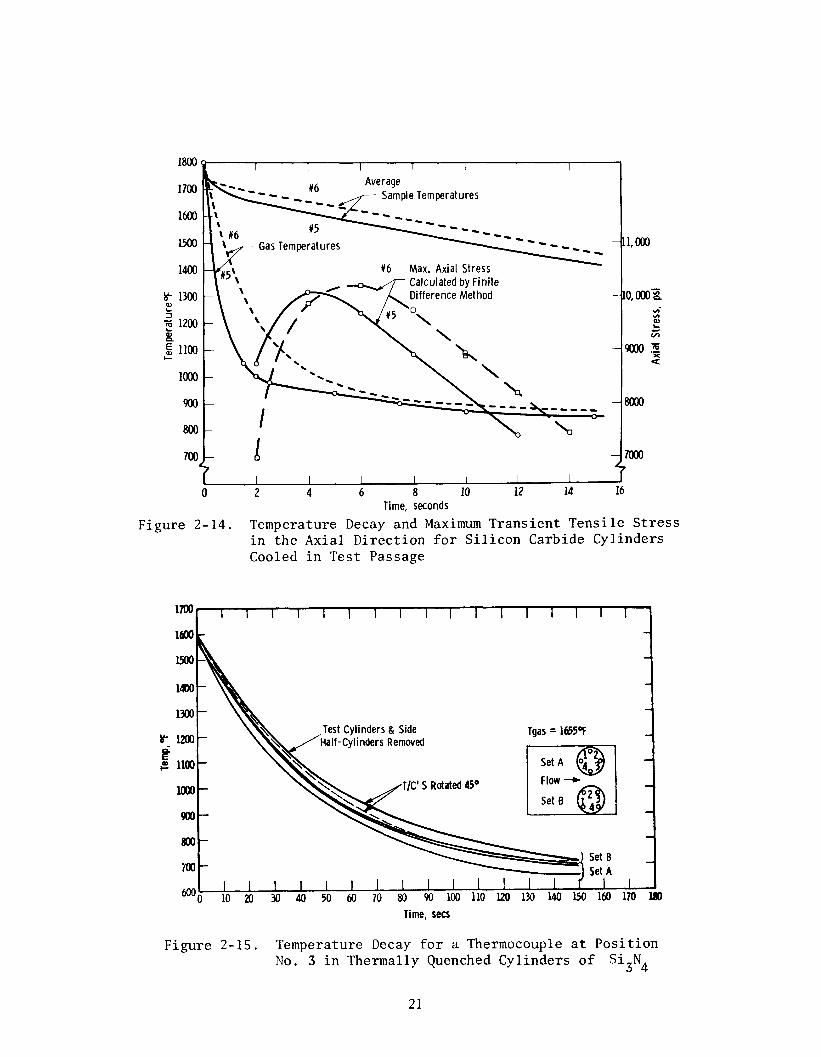
Experiments indicated that quenching was uniform around the cylinder to within 10 to lS°F (Figure 2-13) and that the axisymmetric finite element program was applicable in plane 1 (Figure 2-12). Since the pertinent physical properties (coefficient of thermal expansion, thermal conductivity, elastic modulus and Poisson's ratio) of the Sic were not precisely known, and since the heat flux and loads imposed by the fixture at the ends were not controlled well, the discrepancy between analysis and experiment was anticipated. Figure 2-14 shows some typical results for the thermal quench of medium-strength hot pressed Sic.
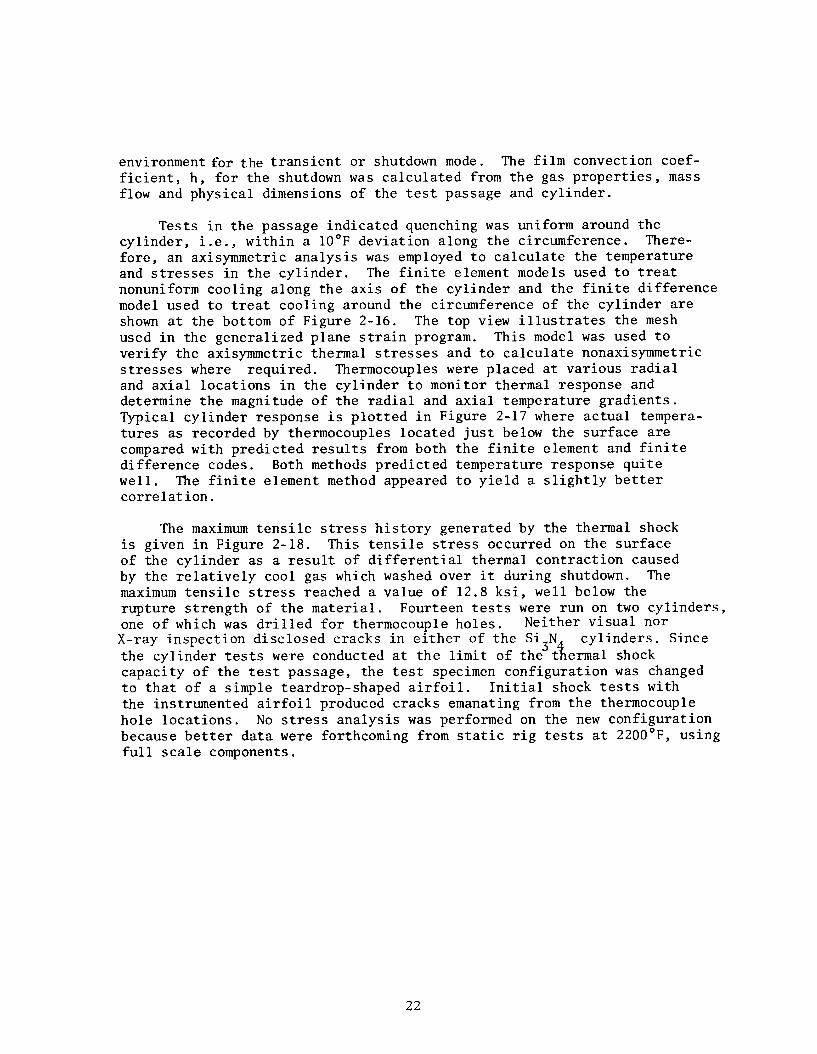
Silicon nitride cylinders with accurately measured thermal diffusivity and coefficient of expansion were introduced into the passage to improve the experiment. Thermocouples were placed in wells such that both axial and radial temperature gradients could be measured. By rotating the cylinder, the variation in temperature around the circumference could also be monitored. These improvements provided a better check of computer results, and additional experience on the fixturing and instrumentation for ceramics in a turbine environment.
Gne-inch diameter by 2-inch high cylinders were heated to a steady- state temperature of 2000'F in a 500 ft/sec combusion gas stream at 3 atmospheres pressure. The fuel supply to the gas passage was interrupted causing the impingement of relatively cool compressor discharge air directly on the cylinder. Figure 2-15 is typical of Si3N4 in the test passage thx-mal
1800
1600 LL 0
e 1400 2
800
I I I I I I
4 6 8 Time, sets
Figure 2-13. Boundary Conditions - Gas Temperature and Film Coefficient
20
1800 p I I I I I I I
800
Calculated by Finite Difference Method
I I I I I I I I 0 2 4 6 8 10 12 14 16
Time, seconds
Figure 2-14. Temperature Decay and Maximum Transient Tensile Stress in the Axial Direction for Silicon Carbide Cylinders Cooled in Test Passage
,ylinders & Side . . Removed
E 1100
loa)
ml
800
-700
600 lime, sets
Figure 2-15. Temperature Decay for a Thermocouple at Position No. 3 in Thermally Quenched Cylinders of Si3N4
21
environment for the transient or shutdown mode. The film convection coef- ficient, h, for the shutdown was calculated from the gas properties, mass flow and physical dimensions of the test passage and cylinder.
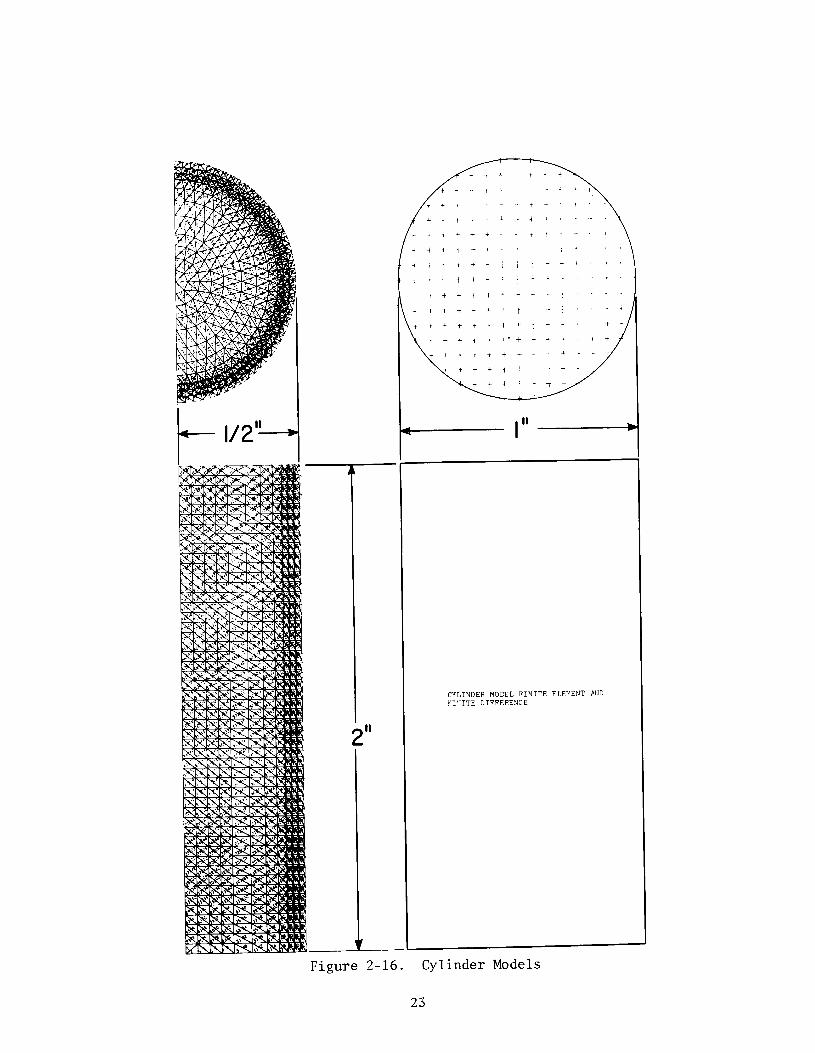
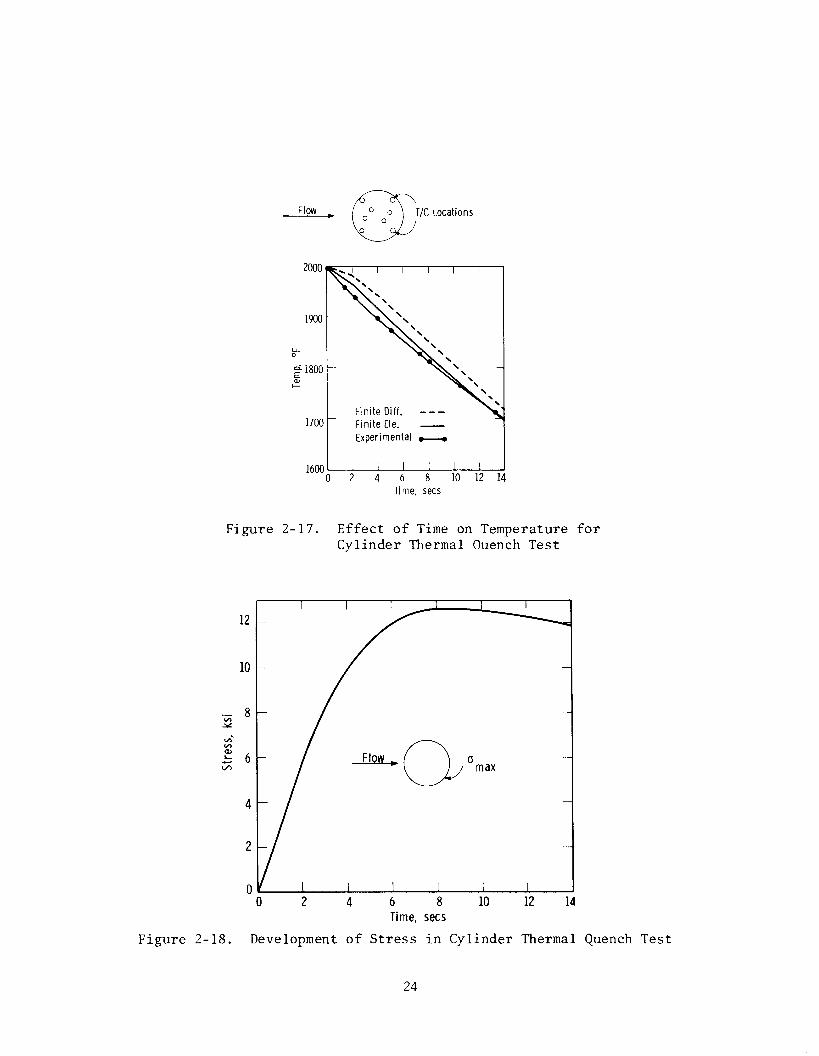
Tests in the passage indicated quenching was uniform around the cylinder, i.e., within a 10°F deviation along the circumference. There- fore, an axisymmetric analysis was employed to calculate the temperature and stresses in the cylinder. The finite element models used to treat nonuniform cooling along the axis of the cylinder and the finite difference model used to treat cooling around the circumference of the cylinder are shown at the bottom of Figure 2-16. The top view illustrates the mesh used in the generalized plane strain program. This model was used to verify the axisymmetric thermal stresses and to calculate nonaxisymmetric stresses where required. Thermocouples were placed at various radial and axial locations in the cylinder to monitor thermal response and determine the magnitude of the radial and axial temperature gradients. Typical cylinder response is plotted in Figure 2-17 where actual tempera- tures as recorded by thermocouples located just below the surface are compared with predicted results from both the finite element and finite difference codes. Both methods predicted temperature response quite well. The finite element method appeared to yield a slightly better correlation.
The maximum tensile stress history generated by the thermal shock is given in Figure 2-18. This tensile stress occurred on the surface of the cylinder as a result of differential thermal contraction caused by the relatively cool gas which washed over it during shutdown. The maximum tensile stress reached a value of 12.8 ksi, well below the rupture strength of the material. Fourteen tests were run on two cylinders, one of which was drilled for thermocouple holes. Neither visual nor X-ray inspection disclosed cracks in either of the SiSN
fl cylinders. Since
the cylinder tests were conducted at the limit of the t ermal shock capacity of the test passage, the test specimen configuration was changed to that of a simple teardrop-shaped airfoil. Initial shock tests with the instrumented airfoil produced cracks emanating from the thermocouple hole locations. No stress analysis was performed on the new configuration because better data were forthcoming from static rig tests at 2200°F, using full scale components.
22
2 II
v
t
i
I II
CYLINDER MODEL FINITE ELEMENT PllD FI"TTE DIFFERENCE
--
Figure 2-16. Cylinder Models
23
T/C Locations
1900
1700
1600 - 0
Finite Diff. --- Finite Ele. -- Experimental M
I I I I I 2 4 6 8 10 12 14
Time, sets
Figure 2-17. Effect of Time on Temperature for Cylinder Thermal Ouench Test
12
10
.- 8 J2
. 2 ," 5; 6 0 max
4
2
0 0 2 4 6 8 10 12 14
Time, sets
Figure 2-18. Development of Stress in Cylinder Thermal Quench Test
1
24
SECTION 3
STATOR VANE SYSTEM DESIGN CONCEPTS
3.1 INTRODUCTION
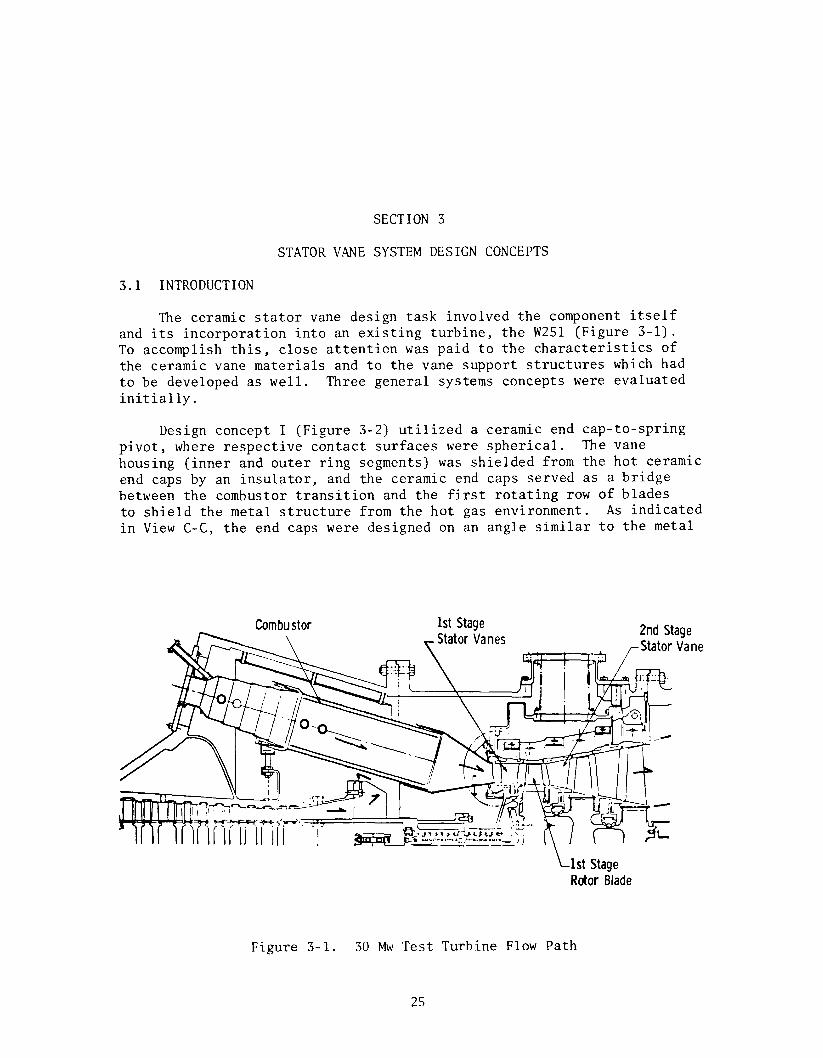
The ceramic stator vane design task involved the component itself and its incorporation into an existing turbine, the W251 (Figure 3-l). To accomplish this, close attention was paid to the characteristics of the ceramic vane materials and to the vane support structures which had to be developed as well. Three general systems concepts were evaluated initially.
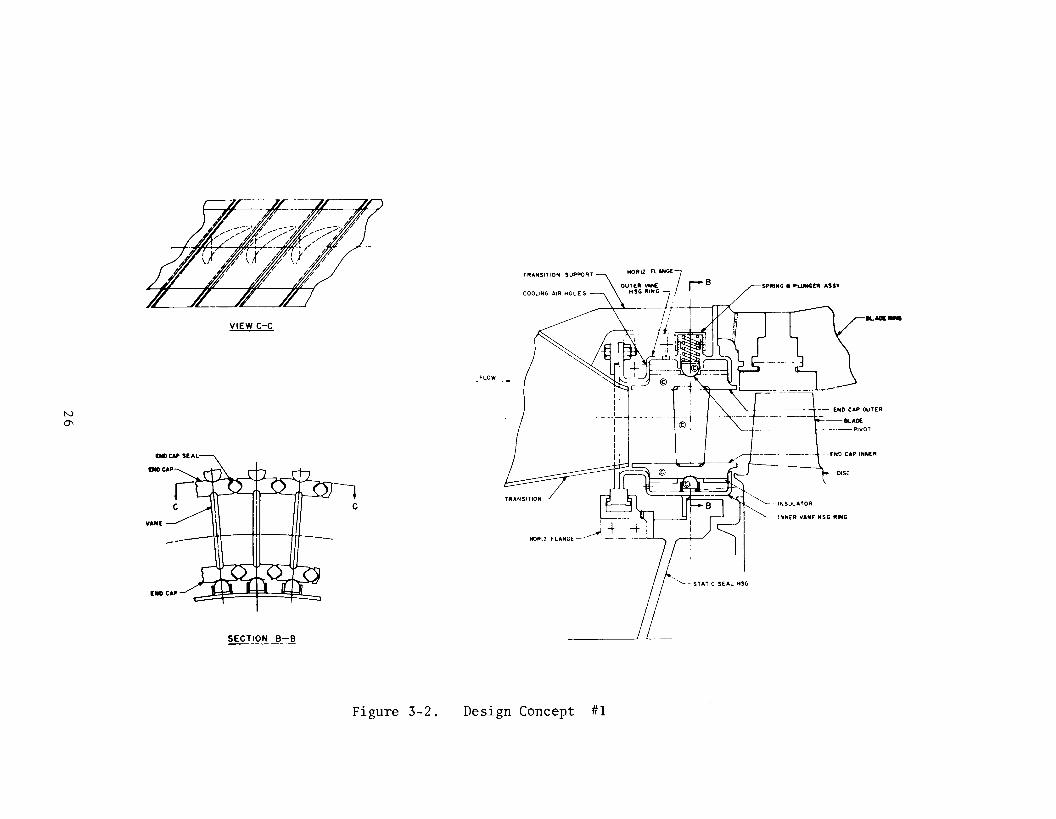
Design concept I (Figure 3-2) utilized a ceramic end cap-to-spring pivot, where respective contact surfaces were spherical. The vane housing (inner and outer ring segments) was shielded from the hot ceramic end caps by an insulator, and the ceramic end caps served as a bridge between the combustor transition and the first rotating row of blades to shield the metal structure from the hot gas environment. As indicated in View C-C, the end caps were designed on an angle similar to the metal
bt Stage Rotor Blade
Figure 3- 1. 30 Mw Test Turbine Flow Path
25
VIEW C-C
FLOW
cm CAP SEAL-
7 C
- STATIC SEAL WSG
SECTION B-B
Figure 3-2. Design Concept #l
vane design currently employed. The end cap to end cap radi‘ai sealing arrangement is illustrated in Section B-B. The end cap seals were free- floating diamond-shaped ceramic pins which depend on positive pressure differential directed radially inward to force the seals against the end caps.
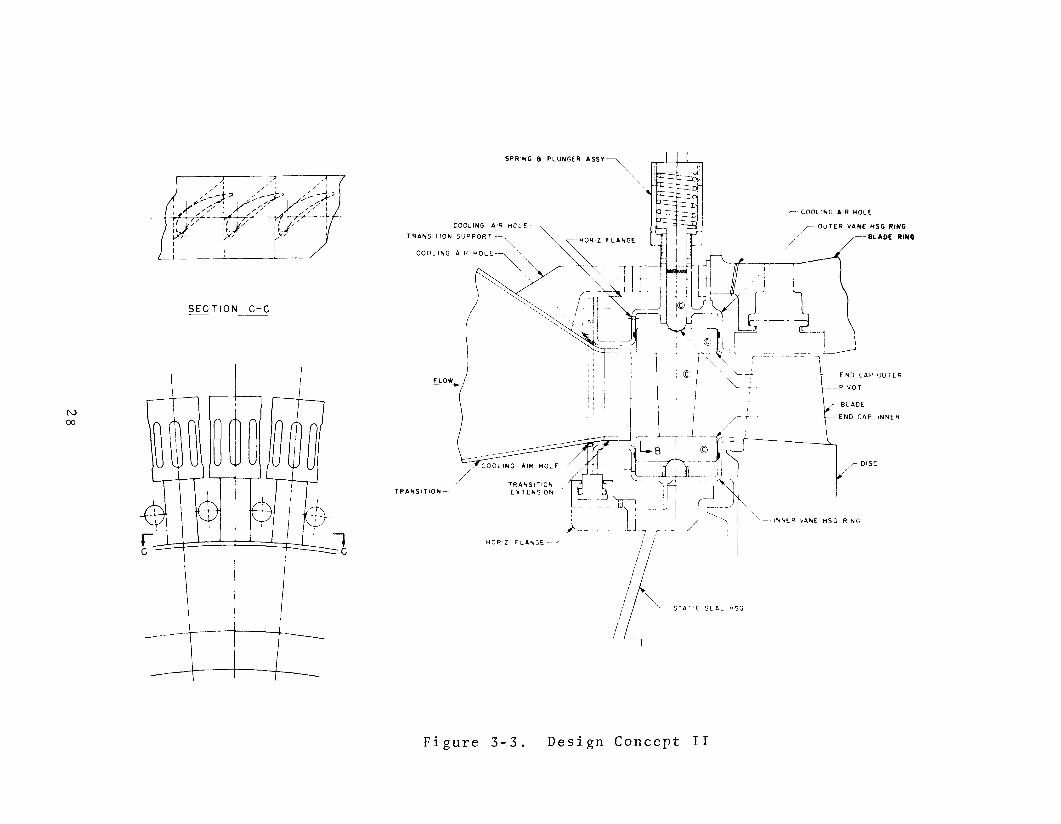
Design concept II (Figure 3-3) employed a ceramic end cap-to-spring pivot whose respective contact surfaces were also spherical. A metal extension piece was welded to the mouth of the combustor transition. This extension permitted the end cap section to be symmetrical, smaller and more compatible with the half-size vane. The sealing arrangement at the transition mouth was similar to that used in W251Bl. Here, the end caps were rectangular (Section C-C) to allow the cylindrical slot to serve as a positive stop for the airfoil tenon (partial airfoil section shaped) . The cross-hatched material indicated between the ceramic end caps and metal vane housing rings, and between the ceramic end caps and plungers was a porous weave metallic material used for uniform load distribution and cooling air access between the metal and ceramic.
Design concept III (Figure 3-4) combined a metal shoe pivoting arrangement with a spherical plunger-to-shoe pivot surface. The metal shoe transmitted the compressive spring load to an insulator and ceramic end cap, which in turn transmitted the force to the airfoil. The concept utilized two end-cap/airfoil segments per insulator/shoe, and thus each spring served to load two vane segments. Stability of the system was provided by two spherical pivots mounted in the inner ring housing as shown in Section B-B. Radial sealing between each segment was pro- vided at the shoe location (Section B-B). Depending on established clearances, each end cap was free to slide circumferentially in its respective insulator track. Positive locking was provided at the shoe/insulator surface by a lip on the shoe (Section B-B) and at the insulator end cap surface by a slot that was alternately contained in the insulator and end cap of the adjacent shoe/insulator/end-cap combination.
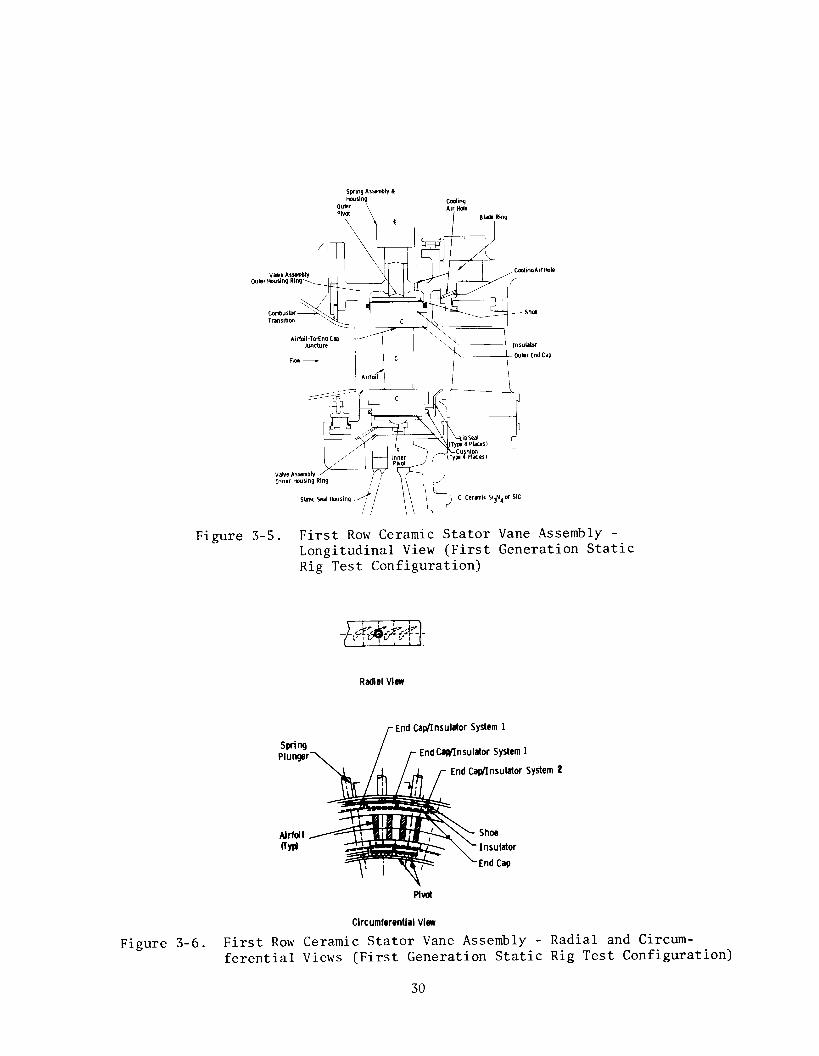
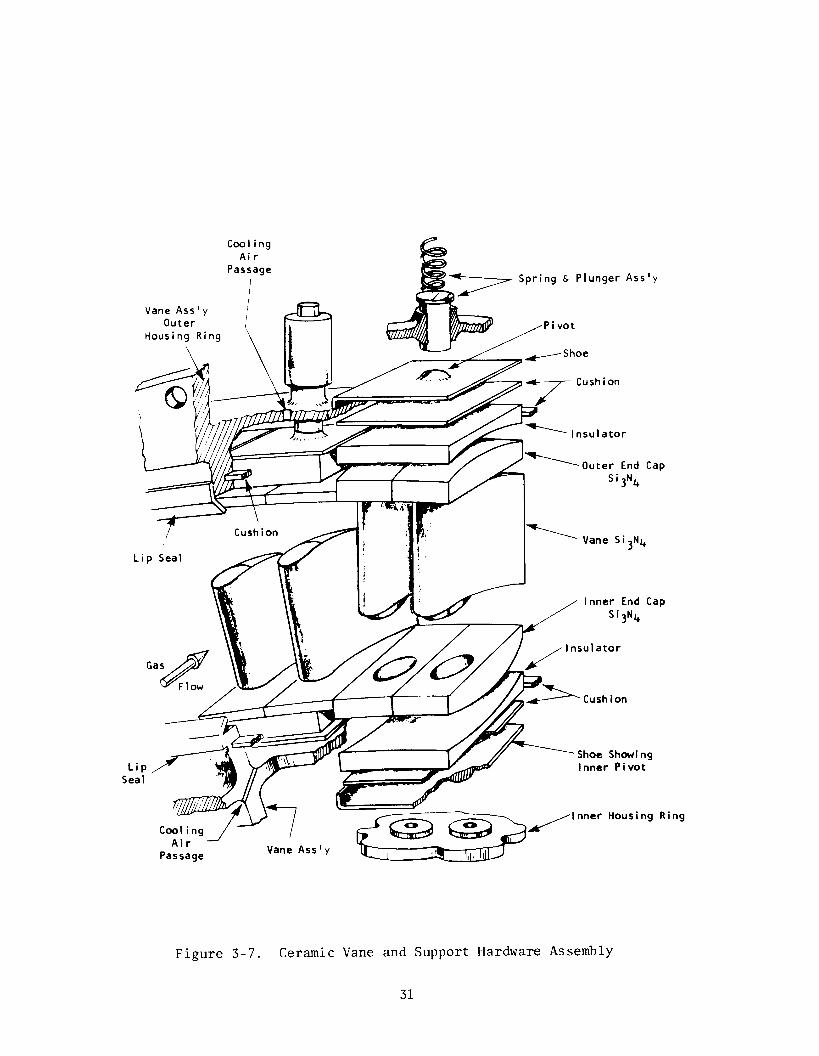
A fourth and final design iteration (Figure 3-5, Longitudinal View, and Figure 3-6, Radial and Circumferential Views) evolved from careful analysis of the original three.(2,3) The basic element of the design was the three-piece ceramic stator vane assembly represented in Figure 3-7. A concave seat in the end cap was used with a convex vane tenon of compound curvature to provide contact surfaces that were ellipsoidal. The vane assemblies were paired for use with associated support hardware. Two vanes and two end caps were supported at either end by a single insulator and a single metal shoe. The outer metal shoe had a single pivot, plunger and spring, while the inner mechanism was made up of the metal shoe with two pivots and plunger. This arrangement gave three- point circumferential stability to the entire structure. The spring assembly, contained by the outer support ring, maintained the position of the vane assembly with the clamping force provided by the spring. A metal fiber mesh material cushioned and distributed the load between the insulator and the metal shoe. This material was also used as a seal between the insulator and ring housing.
27
SECTION C-C
HOR Z FLA~;E d
STATIC SEAL HSG
Figure 3-3. Design Concept II
I
SECTION C - C
i 7----“““”
coamC AIR HOLE --
ON B-B
Figure 3-4. Design Concept 111
static seal tburing
Figure 3-5. First Row Ceramic Stator Vane Assembly - Longitudinal View (First Generation Static Rig Test Configuration)
Ww Plunger\
Radial View
End Caflnsulator System 1
End Cl(yrInsulator System 1
End Caflnsulator System 2
Shoe
Insulator
End Cap
Circumferential View
Figure 3-6. First Row Ceramic Stator Vane Assembly - Radial and Circum- ferential Views (First Generation Static Rig Test Configuration)
30
Cool i ng Air
Passage
! er Ass’y
r//Y Insulator
7T ion i
liter Fnd Can ..-SW. -..- v-r
SijN,+
Vane Si3N4
Inner End Cap SijN4
Showing
ing
Figure 3-7. Ceramic Vane and Support Hardware Assembly
31
Special attention was given to the fine details in the design. For instance , a lip on the metal shoe was provided to prevent insulator segments from slipping in the circumferential direction. Positive locking of the end cap pairs was accomplished by an end cap thickness change. End cap pairs were matched with insulator segments of appropriate dimension to keep the combined end cap insulator thickness constant.
Airfoil alignment and locking were controlled by airfoil and tenons which fitted into close tolerance cavities in the end caps. Within the limits of established clearance, each end cap was free to move circum- ferentially in its respective insulator tract. Therefore, both adjustment of the airfoils with respect to the end caps and vane assembly motion relative to the support structure were possible.
Axial gas loads were transmitted from the airfoil to the end caps and insulator and finally across the cushion material at the downstream end face of the insulator. Tangential gas loads were transferred from the pressure surface of the airfoil, through the end cap and insulator, to a lip on the inner and outer shoes and finally at the shoe pivots.
Small, rectangular-shaped end caps were used to minimize thermal stress generally. The use of sheet metal ring lip seals made this end cap size reduction possible. Contoured contact surfaces were specified to minimize contact stresses. Radial sealing was accomplished by the free floating strip seals which separated the metal shoes.
Compressor discharge air at 650’F was used to cool the combustor transition, static seal housing, combustor transition support, turbine cylinder, blade ring, and vane housing ring segments.
32
3.2 FIRST GENERATION STATOR VANE ASSEMBLY DESIGN
The foregoing discussion pertains to the first stage stator vane system designed for static rig and turbine testing. The actual ceramic vane structure is described in general terms only. Emphasis was placed on the mechanical design iteration(
as ects of a ceramic component in the first generation 2p3p illustrated in Figure 3-8. A nontwisted parallel-
sided airfoil was specified to simplify manufacture since the parts were designated for static rig testing only. The intent was to establish a brittle material's ability to survive in a high temperature gas turbine environment and to demonstrate design viability. Neither required a tapered-twisted airfoil.
The airfoil-to-end cap juncture is critical in this three-piece ceramic stator vane design. Steady-state contact stresses develop at the interface as a result of:
1. A 400 lb compressive spring load, directed radially with respect to the turbine axis
2. A 200 lb axial gas pressure load
3. A 100 lb tangential gas pressure load
4. A 60 in-lb gas pressure twisting moment
A simply supported design criterion was established to provide airfoil- to-end cap adjustment to gas loads (bending and twist). Care was taken to minimize stress concentration as well as steady-state and transient thermal stresses. The circumferential interlocking feature of the end cap pairs with alternating insulators of different thickness is shown in Figure 3-9.
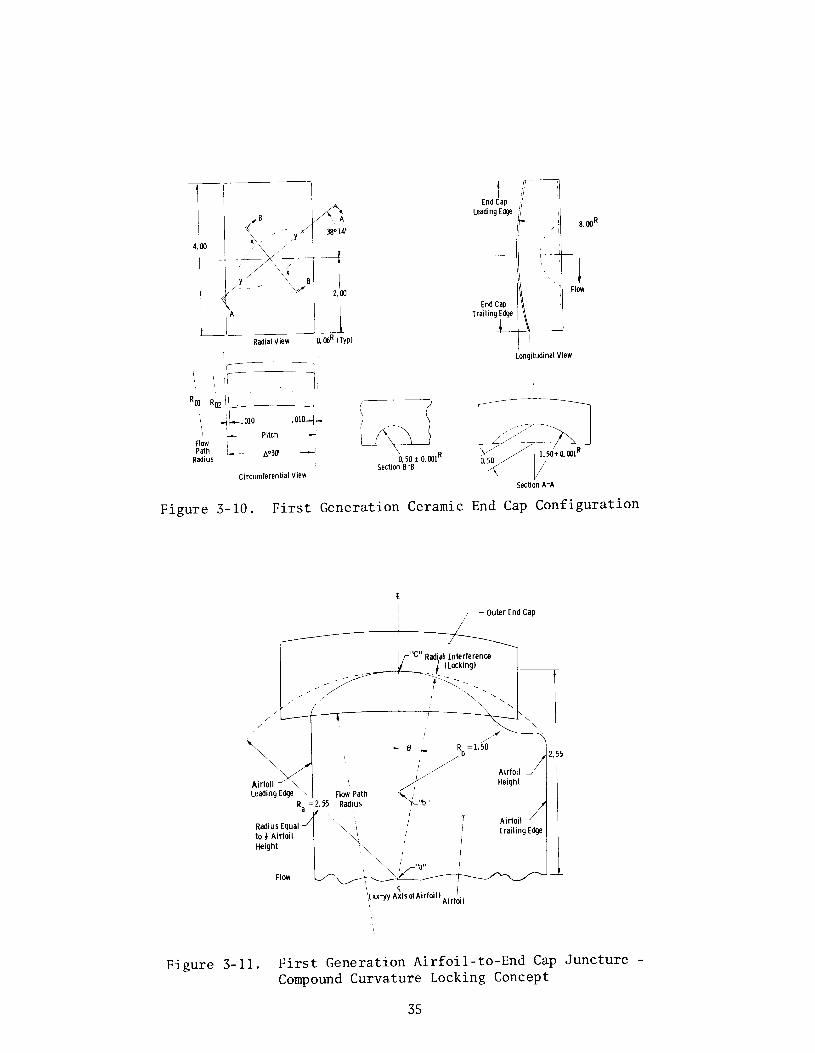
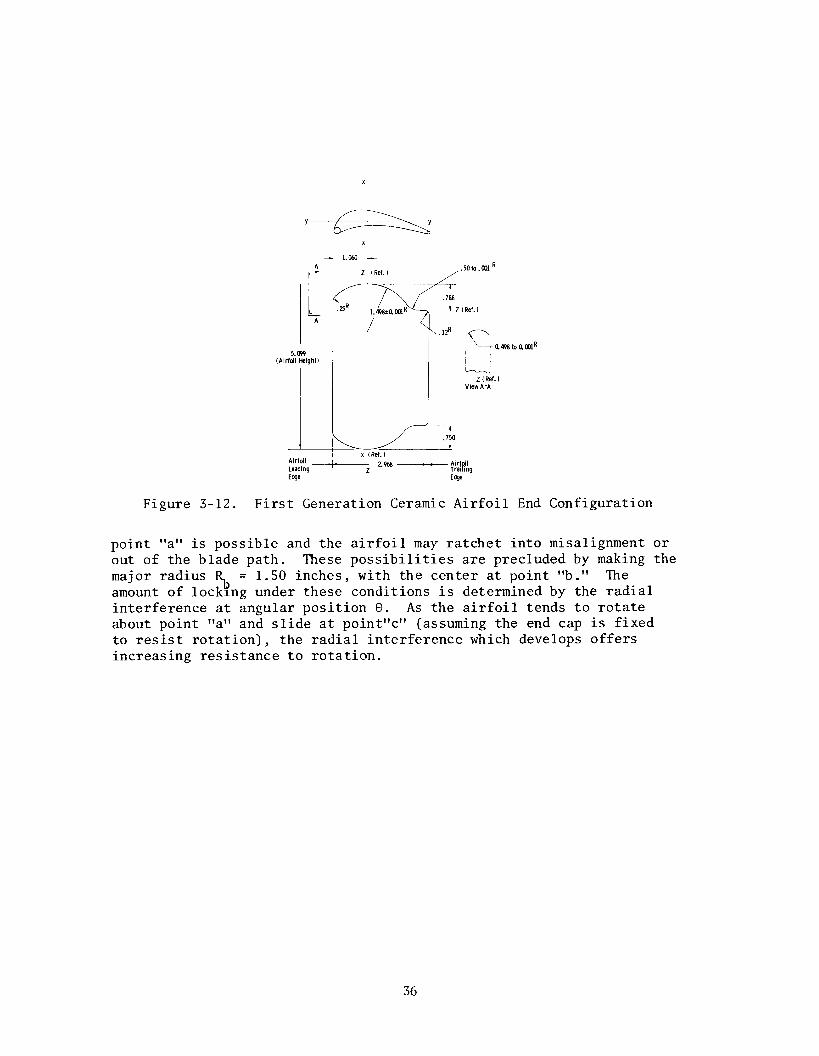
The end cap design is defined precisely in Figure 3-10. A compound curvature locking concept (Figure 3-11) is used to prevent the airfoil end support from ratcheting out of the end cap groove. Contact stresses are minimized by a torroidal shaped pivot-to-seat configuration. The pivot portions of the airfoil are described in terms of major and minor radii in Figure 3-12. The torroidal groove, ground to conform to the airfoil tenon geometry, is presented as an ellipse at the surface of the end cap (Figure 3-10, radial view). Therefore, the contact stresses resulting from the normal and tractive loads on the airfoil and end cap develop along an ellipsoidal surface.
Component dimensions and tolerances are critical. For example, if the major radius of the pivot were made equal to one-half the total airfoil height (i.e., Ra = 2.55 inches, Figure 3-ll), rotation about
33
F,F-----------YSystem21nsulator
i.00 //qT System 1 End Cap
0.200
1
Airfoil y 8.00 R Interference
Figure 3-8. First Generation, First Row Ceramic Vane Assemblies with Airfoil, End Caps and Insulators - Systems 1 and 2 Provide Circumferential Locking
e
End
e e Airfoil/hd CaplInsulator Airfoil/End CadInsulator
System 1 System 2
Insulator \ e
Figure 3-9. First Generation Ceramic Vane End Cap to Insulator Circumferential Locking Arrangement
34
iLo.iJ& Radial View
Longitudinal View
Circumferential View Section A-A
Figure 3-10. First Generation Ceramic End Cap Configuration
I-- outer End Cap
Figure 3-11. First Generation Airfoil-to-End Cap Juncture - Compound Curvature Locking Concept
35
Z (Ref. 1 View A-A
Figure 3-12. First Generation Ceramic Airfoil End Configuration
point "art is possible and the airfoil may ratchet into misalignment or out of the blade path. These possibilities are precluded by making the major radius % = 1.50 inches, with the center at point "b." The amount of locking under these conditions is determined by the radial interference at angular position 0. As the airfoil tends to rotate about point "a" and slide at point"c" (assuming the end cap is fixed to resist rotation), the radial interference which develops offers increasing resistance to rotation.
36
3.3 FIRST GENERATION STATOR VANE ANALYSIS
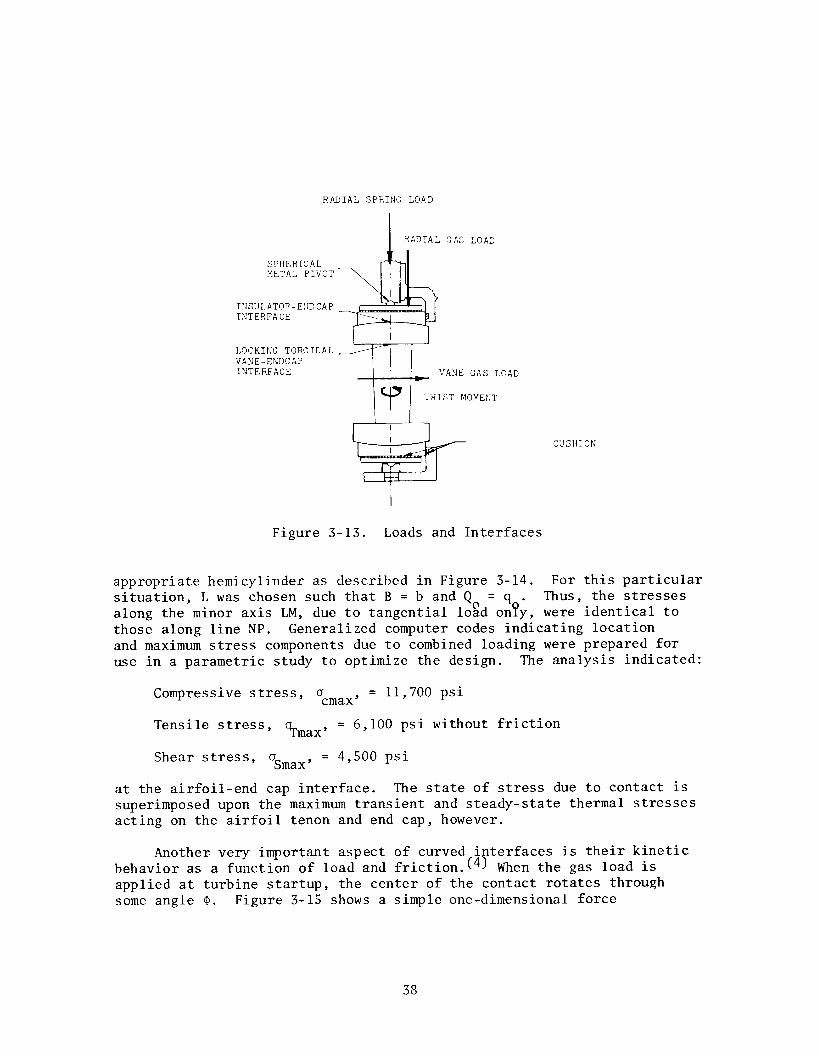
Considerable effort was expended in the analysis of stresses at the critical interfaces which are inherent in the first generation stator vane assembly design. ( 3,4) The vane assembly and support structure are subjected to two principal loads acting against each other. The compres- sive spring load must be great enough to neutralize the three components of the gas load if the airfoils are to remain stable in a high velocity gas stream. Since the stator vane function is to turn the gas stream and since the individual elements of the vane assembly are joined at curved interfaces, the three components of the gas load are defined as:
1. The pressure force against the vane action 28’ from the axial direction
2. The radial compressive force directed ultimately against the spring- loaded shoe
3. The twisting moment about the radial axis of the vane
The stress calculations were performed using conventional two- dimensional finite element and finite difference computer codes which were expanded to handle specific geometries and conditions.
Si3N4 and Sic exhibit very little or no plastic response prior to fracture at temperatures below 2300’F. Therefore, the maximum tensile stress at all points of contact must be defined explicitly so that a reasonable safety factor can be applied to avoid the generation and catastrophic propagation of localized cracks.
The four load types are defined with respect to the sandwiched vane in Figure 3- 13. The radially compressive spring load is a design para- meter that remains essentially constant over the cycle of operation. The components of the gas load rise to peak values during operation after short transients. Each of the interfaces associated with the design represents an interdependent system with respect to both radial and friction-reacted tangential loads. This condition complicated the optimum choice of geometry, surface finish and applied spring load.
Curved surfaces are in area contact at the airfoil-end cap interface. The contact stress field was analyzed by superimposing the two stress fields derived from normal and tangential loads. Standard elasticity theory was used to calculate normal loads. Stresses due to tangential loads were determined by the extension of a cylindrical analogy method for simple cylindrical contacts to the actual situation. The normal load pressure surface was sectioned in the plane of the tangential load so that incremental parts of the semiellipse could be modeled by an
37
RADIAL SPRItJG LOAD
I RADIAL GAS LOAD
SPHERICAL METAL PIVOT
IrJSULATOR-EIIDCAP INTERFACE
LOCKIIJG TOROICAL VANE-ENDCAP INTERFACE VANE GAS LOAD
CUSHION
Figure 3-13. Loads and Interfaces
appropriate hemicylinder as described in Figure 3-14. For this particular situation, L was chosen such that B = b and Q = q . Thus, the stresses along the minor axis LM, due to tangential logd on!?y, were identical to those along line NP. Generalized computer codes indicating location and maximum stress components due to combined loading were prepared for use in a parametric study to optimize the design. The analysis indicated:
Compressive stress, ocmax, = 11,700 psi
Tensile stress, 7max9 = 6,100 psi without friction
Shear stress, csmax, = 4,500 psi
at the airfoil-end cap interface. The state of stress due to contact is superimposed upon the maximum transient and steady-state thermal stresses acting on the airfoil tenon and end cap, however.
Another very important aspect of curved interfaces is their kinetic behavior as a function of load and friction.(4) When the gas load is applied at turbine startup, the center of the contact rotates through some angle a. Figure 3-15 shows a simple one-dimensional force
38
e distribution over rectangular bearing surface for circular cylinder contact
t\ Tangenhal Force
Semi-ellipsoidal pressure distribution over bearing surface for compound curvature contact
Figure 3-14. Cylindrical Contact Analogy for the Determination of Stresses Due to Tangentially Applied Tractive Loads on a Body with Compound Curvature
Radius
Figure 3-15. One-Dimensional Force Equilibrium Diagram for the Airfoil-End Cap Interface
39
equilibrium diagram for a situation which corresponds to a turbine at rest and just after start. R identifies the radial compressive loads while G represents the vane gas load where the subscripts T and N refer to the tangential and normal components, respectively, defined with respect to the interface. The net normal load on the interface is GN + RN, while the net tangential load is ~1 (GN + RN). Maximum tensile stress is a function of the startup coefficient of friction for the vane end cap interface as shown in Figure 3-16.
Another subroutine was generated to define the elastic contact sur- face at the end cap groove-airfoil tenon interface more fully. The ' radial spring force is applied to prevent the tenon from moving out of the end cap groove. Any displacement of the contact center that is large enough to reduce.the actual contact area, i.e., where the nominal contact surface is moved to extend beyond the pieces in contact or any drastic rearrangement of the pressure surface to compensate for such movement, results in a much higher stress field or region of contact singularity.
The results of this stress analysis (4) appear in Figures 3-17, 3-18 and 3-19, where the position of the contact area with respect to the airfoil perimeter and the maximum tensile stresses during startup and shutdown are indicated. Even at very low coefficients of friction
18 -
16 -
Figure 3-16.
S=Wlb TOI. = .OObin
Maximum Tensile Contacts Stress vs. Start-Up Friction with Radial Load
I I I I .25 .!a .75 1.0
Start-up co-efficient of friction
The Effect of Friction on Maximum Contact Stress at the Airfoil-End Cap Interface
40
Note: For the Given Loads, Interface Geometry, Materials, and Airfoil Section, the Ordinate Represents the Closest Approach d the Elastic Contact Surface to the Airfoil Perimeter After the Rolling and Sliding Necessary For Force Equilibrium. As shown, the .D35 Airfoil Edge Radius Decreases the “Region d Safet)“For the Main Interface.
“Region al
-.MD - 0 0 ’ ’ ’ ’ ’ a ’ ’
D . 10 .2D Start-up Coeff iclent’of Frldlon
.4D .M
Figure 3-17. Interface Edge Loading Analysis Airfoil-End Cap
(Figure 3- 17), the worse possible shift or rearrangement at the interface will not bring the actual load-bearing contact area dangerously close to the edge of the airfoil section for any of the four conditions cited. AR represents the difference in radii between the airfoil tenon and the end cap groove or the relative fit of the airfoil with respect to the end cap. The region of safety extends from 0.035 inch. If the contact area moves within 0.035 in of the airfoil edge, edge loading will per- sist in a region of contact singularity. Figures 3-18 and 3-19 show the effects of radial difference (AR) and the coefficient of friction, inde- pendently, on the maximum contact tensile stress developed at the inter- face for the startup and shutdown conditions, respectively. The stress increases directly with radial difference at constant load because the contact area decreases. For the actual case, where part tolerances establish AR = 0.004 inch and the measured value of friction is p = 0.25, the maximum tensile stresses are 8240 psi for startup and 5180 psi for shutdown.
Load transmission at the end cap-insulator interface resembles planar contact because of the large radii. That is, there is little curvature to allow the trade-off of normal and tangential load. Since the vane gas load is reacted almost solely by friction, the spring load is established as a function of friction at the end cap-insulator
- es Starting From Their Respective Base Points "A" and II ,I B e Points "A" and "B" Have Parameter States:
AR I IAll .008 .4”5 IlBll .002 005
Each Numbered Curve Shows the Effect of Varying the Parameter Corresponding to the Numbered Axis Below; the Other Parameter Being
l’ / / 1 w-
1
I
- - -
0 B - See Report For Discussion of Friction Phenomena
I I I I I I I i
.002 404 JO6 .008 Radial Difference, AR, -In. -
Figure 3-18. Startup Tensile Contact Stress at the Airfoil-End Cap Interface Showing the Effects of Parameter Variation
42
* * Start-up Co-efficient of Friction
O4 2 .45 .25 .05 I I I I I 1
Geometry, Material, and Loads as Described on Preceding Graph
17 Key :
16 Read Curves Startinq From Their Respective Base Points “A” and-“B”. Points “A” and “B” Have Parameter States: 15 ’
14 ,I II A II II B .002 l 45
Each Numbered Curve Shows the Effect of
13
12
,
I f Friction Phenomena
I I 1 1
.004 .006 A08 Radial Difference, AR, -In.-
Figure 3-19. Shutdown Tensile Contact Stress at Vane/End Cap Interface Showing Effects of Parameter Variation
43
interface. The magnitude of stresses generated during thermal transient periods is of concern at the end cap-insulator interface because two dissimilar materials are in contact here without being cushioned by a metal weave. Because of the difference in values of thermal expansion coefficients, a considerable tractive shear force can develop at this surface. The cylindrical analogy was used to estimate an upper bound for this shear and also to define the maximum value of tensile stress. The bound is proportional to the friction coefficient and the maximum Hertzian pressure developed at the interface. The nearly planar nature of the interface makes the Hertzian stress quite small. Therefore, the upper bound is also small.
A combined kinematic and contact stress analysis at the interacting interfaces of four end caps with two insulators was made. The major interface in this system (the contact between the top surface of an outer end cap with the bottom surface of an outer insulator, for example) was considered. The design depends upon friction along a curved surface for positional stability. Since simple contact had to be preserved, the minor radius of curvature was selected within the constraints of friction coefficient. From Figure 3-20 it is clear that a 3.0 inch radius makes the design practically independent of frictional effects, while a 10 inch radius requires a coefficient of friction >O.35 to avoid contact singu- larity and edge loading. Furthermore, the combined effect of curvature and friction may not be great enough in the case of a large minor radii to prevent movement of the stator vane assembly downstream toward the first stage rotor.
The state of stress at the interface is determined by the minor axial radius (R2), the end cap/insulator radial difference (AR) and the coefficients of friction (p) between the end cap and insulator mate- rials. The effects of these parameters on the maximum contact tensile stress are plotted independently in Figures 3-21 and 3-22 for turbine startup and shutdown, respectively. Even though the stress varies inversely with the minor axial radius of curvature, stress maxima will only approach 500 psi in the insulator under the least favorable condi- tions of friction and radial difference (11 = 0.15 and AR = 0.008 inch). Contact stresses in the end cap remain lower still.
The first generation stator vane assembly was designed with a large minor radius of curvature at the end cap/insulator interface. When the coefficient of friction between silicon nitride and the insulator material was found to be ~0.10 rather than >0.35, the radius of curvature was reduced on some pieces of test hardware. Several other modifications were also made as a result of this analysis. Analogous to the practice of crowning steel rollers (blending large radii to taper the ends), 0.250 inch edge radii were introduced to alleviate the contact singu- larities discussed.
44
I I I I I I I I
Figure 3-20.
Figure 3-21.
Given Loads, Materials, and Gross Dimensions, the Critical Radius Is the Maximum Radius For Which the Elastic Contact Region IS Contained Completely Within the Main Interface Surface Despite the Sliding and Rolling Necessary For Force Equilibrium P !
-
c- Insulator Half-Width: 1.675 - Axial Fillets: .25G - Endcap: Si3Nq; E =41.5E06, v =.23 - Insulator: LAS; E = ll.OE06; v = .28 - Major Toroidal Radius: 3L39p, Circumferential -Force at Interface:
0 .05 -Start-up Co-efficient of Friction, p, Increasing -
.25 .45 1 I I
700
Key: Read Each Curve Starting at Point “A” Whose Parameter State is: R2=3.006, AR =.006,~=.05 Each Numbered Curve Shows the Effect of
- of Varying the Parameter Corresponding to the Numbered Axis Below. the Other Parameters Being Held at the “A”
- Values Listed Above
- Refer to Texi For
4 5 6 7 8 - Axial Radius, R2, - In.- --)
I I I I I m .006 .ooB . 010 .012
-) Endcap-insulator Radial Difference, AR, - In. -+
Figure 3-22. Shutdown Tensile Contact Stress at the End Cap/ Insulator Interface Showing the Effects of Parameter Variation
A reduction in the minor axial radius (R2) eliminated the need for an exact analysis of the contact stress field in the vicinity of a second-order discontinuity (as at the boundary between the end cap and the insulator edge radius). Several qualitative comments may be made, however. Since the Hertzian stress on the fillet side (insulator) must be greater than the main radius side (end cap), the stress field from the friction-reacted tractive loads are expected to be skewed con- siderably. For the specific case of the simple rolling cylinders, the in-plane stress field, normally associated with traction at the surface, is symmetric with respect to the line of contact. Compressive and ten- sile stresses develop fore and aft, respectively, in this situation. Whenever the stress field becomes asymmetric as a result of traction applied toward the high pressure side for example, the tensile component increases modestly while the compressive component rises dramatically. The compressive stress at the downstream edge of the 0.250 inch fillets on the insulators may approach 30 ksi in the event of partial edge loading.
Two-inch spherical radius ceramic buttons were inserted within the downstream lip seals to act as final stops to preclude any possibility of sliding (Figure 3-5).
46
Contact stresses are generated as the thick end caps slide circum- ferentially to interlock with the thick insulators. The edge locking interference in this case is 0.200 inch, with the circumferential compo- nent of the gas load being transmitted across the flat edge. The load at these interlocks is inversely proportional to the amount of circum- ferential traction reacted by friction at the major end cap/insulatoror interface. For the lowest coefficient of friction, 1-1 = 0.10, the normal load at the interlocking interface reaches a maximum. Figure 3-23 illustrates the effect of edge radius on the development of contact tensile stresses under these least favorable conditions where the inter- lock is so skewed that it causes full edge loading.
The metal pivots represent the terminal resistance to the entire circumferential component of the vane gas load. Under the worst condi- tion of tolerance and loading, the maximum shear stress due to pivot contact is 18,700 psi. Two other locations of contact occur, 1) between the insulator and the shoe and 2) between the insulator and the housing ring. Since these areas are cushioned by metal weave material, stresses equal P/A and are considered negligible.
A steady-state thermal stress analysis of the end cap was performed utilizing a plane-wise symmetric finite element plate program. The mesh and loading are shown in Figure 3-24. Although the end cap actually
17
16
15 14 13
12 11 10
9
t a 7
.- p6
- Material Properties, Applied Prime Loads- Circumferential Geometry: As Before -
- Least Favorable Friction Case, Jo = . 10
v; f5 Key:
54 .z “r3
@ Silicon Nitride Endcap
2 2 @ Lithium Aluminum Silicate Insulator
Edge Radius-f In. ) 1 Chosen Radius
Figure 3-23. Circumferential Edge Loading Analysis of Hertzian Contact Stresses (Tensile) at Thick-Thin End Cap/ Insulator Interlocks
47
L50 -
lm -
so-
-.m -
-SO-
-Lm
-LyI-
-2m -
-253 I I I I ,
-2 50 -200 -Lm -em -50 om m LW Lm zm zm
Figure 3-24. Finite Element Geometry - End Cap With Torroidal Groove
had radial sides and a groove with a fourth-order surface perimeter, it was modeled as a rectangular block with an ellipsoidal groove. This model was chosen to approximate both the inner and outer end caps with cavity geometry variable as a function of groove depth. Thermal loading was programmed to reflect temperature drops ranging from 200 to 300°F across the end cap radially. Temperature distribution reflected end cap geometry and was skewed with respect to the sides to present the worst case. The end cap was simply supported at three corners and free at the fourth. It was restrained from thermal bending by a uniform pressure of 8000 psi, the compressive spring load distributed evenly over the contact area.
Six cases were analyzed. The first three were run to determine the effect of end cap groove depth. The maximum principal stress dropped significantly as the limit of the simple rectangular block was approached, as shown in Figure 3-25, where the maximum tensile stress at the center of the groove is plotted versus the thickness of the end cap at that point. Since a symmetric model was used, the finite element results were corrected to account for asymmetry as it actually existed. The correction factor was simply the ratio of stress concentration factors in bending for flat plates which were grooved. The effect is actually
48
‘Z Y
’ P 12- 0
2 F IO- E - =: z 8- u-4 2 5 6- 76 .- - v t .- h 4- 5 - E .- x iii! 2-
I I I 0.450 0.825 1.200
Minimum thickness of endcap, 6, in
Figure 3-25. Maximum Plate Stress in Outer End Cap Under Thermal Steady State Showing Groove Depth Effect and Adjustment for Asymmetry
more pronounced since the analysis used the same temperature gradient regardless of thickness. From the standpoint of steady-state thermally derived plate stress, a reduction of groove depth from l/2 to 3/8 inch is desirable. Although an increase in spring load with a corresponding increase in contact stress would be required, the net effect seems beneficial.
The fourth case modeled the stress state in adjacent end caps under a single insulator with temperature loading which represented the mirror image of that previously shown. In case five, the effect of reducing the spring load as a constraint to thermal loading was studied. The results of these runs showed end cap position and spring load to be insignificant as design parameters. Stress reductions of only several hundred psi were realized.
The sixth case compared the stress at the groove bottom to the stress at the thin portion of the end caps defined by the groove perim- eter and the end cap edge. Without the groove the maximum tensile stress occurred at the outer periphery of the end cap. The addition of a groove decreased this stress as a function of groove depth, but the maximum stress now occurred at the groove bottom. Since the tensile
49
stress maximum was four times the peripheral stress for useful groove depths, peripheral stresses did not influence the choice of groove depth greatly.
In the area of transient thermal stress analysis, the required cool- ing flows, inherent leakages, and their effect on the convection coeffi- cients were determined. The design process was iterative because a set of plausible inputs was formulated to produce a temperature-time profile. Where the cooling flow inputs were adjusted to produce a new temperature field which was less severe, the flow adjustments were considered bene- ficial. The temperature fields of interest were substituted into the finite element plate program to evaluate transient, thermal in-plane stresses. Appropriate superposition of contact and steady-state thermal stresses indicated values of 21,200 psi for the 1.0 inch thick end cap and 16,700 psi for the 1.2 inch thick end cap. Maximum tensile stress occurred near the bottom center of the groove. Stress levels of this magnitude are acceptable for silicon nitride or silicon carbide.
An accurate analysis of heat transfer and the associated stress field within the layered ceramic shroud (end cap, insulator, metal shoe) for both the steady-state and shutdown transient modes was completed for a turbine operating at a gas temperature of 2500°F(4). Gas tempera- tures were programmed to drop to compressor discharge levels (650°F) in 2.5 seconds followed by an exponential decay to ambient temperature. The heat transfer coefficients were ramped and decayed similarly. Exter- nal body temperatures were adjusted for heat capacity and also allowed to equilibrate to the surroundings, normally.
For the purposes of the two-dimensional finite element technique employed, temperature gradients across the interfaces were not considered. This approach was taken to present a conservative (high stress bias) view. The interfacial gradients, radially, are high and there are methods of calculating them for use with 2-D steady-state heat transfer analysis. To employ them would serve only to lower the radial tempera- ture gradients in the various component members of the system, thereby reducing the resultant stress levels without affecting the stress dis- tributions appreciably. Convection, conduction and radiation boundary conditions were applied as required, however.
Thermal loading for the calculation of steady-state and transient thermal stress was obtained from a three-dimensional map of temperature versus time. The map itself was constructed from two-dimensional thermal contour sections, representing five radial slices through the shroud stack from leading to trailing edge. The R-Z plane sections: AA, BB, CC, DD, and EE, shown in Figure 3-26, model the end cap with a represen- tative groove, the insulator and the metal shoe. Seventeen heat t?ansfer coefficients, seven gas temperatures and six external body temperatures versus time functions were specified. These functions were derived from
50
32 5 r
32 2
i
tbyna 188 Load Shoe
320
Lithium
0.00 .25 .50 .75 LOO L25 1.50 1.75 200 225 250 2 75 3. al 3. 25 3.w) 3.75 4.00
Silicon Nitride Endap
Figure 3-26. Two-Dimensional Finite Element Mesh for Heat Transfer in the End Cap Sections AA, BB-CC-DD and EE
theoretical considerations or from appropriately scaled turbine condi- tions. The thermal property data, i.e., emissivity, specific heat and conductivity, were used as functions of temperature.
Thermal contour maps for a typical end cap under steady-state, 5 seconds after shutdown and 60 seconds after shutdown, are shown in Figures 3-27 through 3-32. Sections AA and CC are used to illustrate the influence of the groove on the temperature gradient with respect to time. For the steady-state condition (Figures 3-27 and 3-28), the most severe gradients occur downstream of the groove. This is due, in part, to the turbulent decay of film cooling as it flows over the leading edge to wash across the hot face of the end cap. The cooling air flow on the cool surface is also greater at the trailing edge because a significant pressure drop occurs across the stage. The relatively small thermal gradient appearing between the groove and the insulator results from the boundary condition assumption that the rate of heat flow through the shroud is dominated by convection through the end cap rather than con- duction across the interface.
Figures 3-29 and 3-30 describe the stack 5 seconds after quench. Tensile stresses have developed in the lower surfaces as a hot spot
51
Figure 3-27. Steady-State Thermal Contour Representation Through End Cap Section AA
800°F
I
Figure 3-28. Steady-State Thermal Contour Representation Through End Cap Section CC
52
Figure 3-29. Thermal Contour Representation Through End Cap Section AA 5 Seconds After Shutdown
750°F-,
Figure 3-30. Thermal Contour Representation Through End Cap Section CC 5 Seconds After Shutdown
53
700°F, 600°F 6!io°F
k 115OOF
Figure 3-31. Thermal Contour Representation Through End Cap Section AA 60 Seconds After Shutdown
6o0°F
720°F-
&80°F 960°F
104OOF
108OOF
F
/-1280°F X Max
Figure 3-32. Thermal Contour Representation Through End Cap Section CC 60 Seconds After Shutdown
54
emerges in a central location. Thermal relaxation occurs after 60 sec- onds (Figures 3-31 and 3-32) as shown by the general cooling and the slow rise of the hot spot to the end cap/insulator interface.
Because the heat transfer program was, in reality, a two-dimensional axisymmetric representation operating in the R-Z plane, the five sections yield a five-row grid of temperature versus time in the 8-Z plane (normal to the radial axis) in any of the element layers. Unfortunately, this five-row grid does not correspond geometrically to the end cap element mesh, which was chosen to model the groove. Clearly, some rearrangement of temperature values was required to make the two finite element pro- grams compatible. To accomplish this, a two-dimensional Lagrangian interpolating routine was employed to find the exact value of a function of two variables continuously within the region of interest when the function surface was specified by a rectangular grid and was of an order less than or equal to five. This capability was particularly useful for the determination of temperature at points on the hot surface of the end cap in the vicinity of the airfoil and groove where a rather abrupt change occurred from the pressure to suction sides.
Final stress calculations were made from the complete complement of thermal maps. The results of thermal loading in steady-state are plotted as principal isostress lines in the B-Z plane at the midpoint of the end cap in Figure 3-33. Since the groove region was predominantly in com- pression, the superposition of the contact stress field did not present a severe problem. Significant tensile stresses occurred in the down- stream half of the end cap and in the areas between the edge and the major groove diameter. Fortunately, the magnitude of stress due to contact and thermal loads for steady-state were well below the reported strength of silicon nitride and silicon carbide at the operating temperature.
Final design drawings were prepared for the first generation stator vane assembly. Norton manufactured twenty vane assembly sets from HS130 silicon nitride billets. The first five airfoils of these twenty were not completed with respect to the tenon geometry. They served as demonstration pieces. Eight stator vane assemblies were fabricated from NC203 silicon carbide.
55
ISOSTRESS LINES
U_ Stress, psi
6 0 10 4880
Figure 3-33. Thermal Stress Distribution in Ceramic End Caps Under Steady-State Conditions
A series heat transfer analysis using a one-dimensional model (Fig- ure 3-34) was performed to define the insulator requirements for the vane assembly system. An insulator was necessary to reduce heat trans- fer by conduction radially outward from the gas stream through the end cap to the metal support and loading structure. The thermal conductivity of either silicon nitride or silicon carbide end caps was too high to prevent excessive heating of the metal substructure indirectly by the gas stream. Permitting air-cooled metal components to be in direct con- tact with the end caps would impose severe gradients, resulting in steady- state and transient thermal stresses beyond the allowable strength of the end cap materials.
The results of the insulator analysis are presented in parametric form as a function of insulator thickness, t,, in Figures 3-35 and 3-36. A gas inlet temperature (Tl) of 2500'F was selected. The cooling air temperature (T6) in the region of the shoe was 800°F. These established an overall gradient (Tl - T6) of 1700'F through the system. Since the convective heat transfer coefficient (ha) at the gas end cap surface varied from 100 Btu/ft2-hrl"F at the leading edge of the airfoil to 400 Btu/ft2-hr-"F at the trailing edge and the convective heat transfer coef- ficient (he) at the shoe location can be controlled by special nozzling to yield values from 25 to >lOO Btu/ft 2-hr-"F, a conservative approach was taken by selecting ha = 400 Btu/ft2-hr-"F and he = 100 Btu/ft2-hr-OF, with values for thermal conductivity from Figure 3-37 as follows:
End Cap (Si3N4), Kb(min) = 85 Btu inch/hr-ft2-OF
Insulator, K,(max) = 18 Btu inch/hr-ft2-"F
Shoe, Kd(max) = 200 Btu inch/hr-ft2-"F
The heat flux, Q = 25,500 Btu/ftLhr, remained constant through all components.
Under steady-state conditions, the hot face of the end cap reached 2435°F in a 2500°F gas stream. A 300°F thermal gradient was sustained across the l-inch thick silicon nitride end cap to produce a temperature of 2135°F at the end cap/insulator interface. The temperature at the surface of the shoe in contact with 800°F cooling air was lOSS'F,'but a small gradient across the shoe (3S°F for 0.25 inch thickness) raised the temperature at the shoe-insulator interface to 1090°F. Therefore, a maximum thermal gradient of 1045°F was established across the insulator.
57
q = Heat Flow, 0 Btu/hr. t =Thickness, in. T =Temperature, OF
Temperature Profile
T1 = 25W’F
T6 = 8WF
Figure 3-34. Preliminary 1-D Radial Steady-State Conduction/Convection Heat Transfer Analysis - Simplified Ceramic Vane Assembly Model and Temperature Profile
2sal
2400
ma
2200
2100
2mo 2 0 1900 b-
$I 1803 3 5 1700
t E 16ol E' s 1SM 5
a 1400 2
1300 ;:
; 12ol
1100
MLm
9m I-”
oM&mum Temperature
800 -
700 -
I I
Maxlmum Availtile __)I Insulatorlh~ckness
I
T (Shoe 6 Cooling
AirI
00 ' Insulator Thickness, tcin.
Figure 3-35. Preliminary 1-D Radial Steady-State Conduction/ Convection Heat Transfer Analysis - Effect of Insulatbr Thickness on Surface Temperature
58
1000
Insulator Thickness, tc, in.
Figure 3-36. Preliminary 1-D Radial Steady-State Conduction/Convection Heat Transfer Analysis - Effect of Insulator Thickness on Temperature Gradients Within Components
650 t
600
550
: \
Legend: o Heat Transfer Analysis Input
h 500 > i
t Hot Pressed Si C ( Reference
u‘ Only)
1
50 - Typ. Insulator Material 1 C I I I
0 500 mm 1500 2mo 2500 Temperature, OF
Figure 3-37. Thermal Conductivity of End Cap, Typical Insulator and Shoe Materials
59
A cursory review of low conductivity materials indicated that reaction sintered silicon nitride or high density stabilized zirconia would meet the insulator requirements. Other porous refractories were considered too friable for gas turbine applications. LAS (lithium aluminum silicate) did not appear to be a viable candidate, considering temperatures at the end cap/insulator interface, even though its low coefficient of thermal expansion would ensure a state of low thermal stress in the insulator under steady-state and transient conditions.
60
3.5 THE KINEMATIC MODEL
With the system design established and the first generation stator vane design finalized, Westinghouse decided to build a full-scale kine- matic model(3) to demonstrate design viability before proceeding to the preliminary design of hardware for the 2200°F static rig tests. The model is shown in Figure 3-38. All components are represented including 1/8th segments of the inner and outer support rings which complete the
Figure 3-38. Kinematic Model of the Three-Piece Ceramic Vane Design with Support Structure
61
ten-vane sector configuration of a gas turbine supplied with hot gas from one of eight combustors normally located in a circumferential array. The stator vane airfoil elements were molded from plastic. End caps and insulator components were machined from aluminum and anodized to simu- late appropriate color. Shoes, pivots, springs and ring segments were made from mild steel. Specifications and established tolerances were maintained throughout all aspects of fabrication and assembly. Lighter springs were employed to reduce spring loading greatly from the speci- fied 600 lb bundling force. This was done to avoid deformation and damage to the plastic airfoils. Function remained unaffected by the change, however.
The model demonstrates the unique feature of the three-piece design, a freedom of motion at the critical transition location (end cap/airfoil interface) to compensate for differential thermal expansion of the inner and outer support rings without imposing residual stresses on the air- foils. An adjustment screw and scale were provided to permit controlled axial movement of the inner support. The assembly can be moved 0.50 inch or five times the maximum displacement expected in turbine operation without disturbing the integrity of the design. By eliminating the transition from airfoil to shroud, thermal stresses were reduced signi- ficantly because temperatures and thermal gradients in both the end caps and airfoils were separated within individual elements of simple, rela- tively uniform cross section. End caps and airfoils were made, essen- tially, mutually exclusive with respect to thermal stress and thermal strain by virtue of the interface except for the effect of conductive heat transfer across the interface. Thermal strain was accommodated within the individual element with little or no residual effect on the element adjacent to it radially or circumferentially.
The ten-vane segment configuration used in the kinematic model represented the first generation Si3N4 airfoil and end cap assembly scheduled for initial static rig testing. It is obvious from the large gaps which appear at the trailing edges of the nontapered, nontwisted airfoil sections that aerodynamic performance was not of primary con- cern in this first generation design. Emphasis was placed exclusively on the mechanical aspects of the stator vane design concept in an effort to establish a brittle material’s capacity for survival in a high tem- perature gas turbine environment. Tolerances were carefully selected to avoid making contact between the airfoil tenon area and the edge of the end cap groove. Generous radii were provided throughout to elimi- nate possible areas of stress concentration.
The model subsequently served as a convenient assembly checkout device for actual static rig test component hardware.(T) It was assem- bled using end caps and insulators with major radii of 3 inches rather than 8 inches, for example. Airfoils and end caps of second and third generation design were inserted to assess the effect of end cap groove depth and airfoil tenon geometry changes on the freedom of relative motion and accommodation at the interface.
62
3.6 SECOND GENERATION VANE ASSEMBLY DESIGN
The second generation ceramic stator vane assembly design (495)
(Figure 3-39) represented an early attempt to correct aerodynamic defi- ciencies inherent in the first generation design. A tapered-twisted airfoil section was specified to provide uniform gas flow in a full scale rotating turbine. The tenons at both ends of the airfoil were developed more fully in the fashion of a dog bone to eliminate unfilled portions of the end to cap cavities. In effect, the minor tenon radius was extended beyond the airfoil surface boundary to fit and fill the entire end cap cavity. The major airfoil tenon radius was increased to one-half the appropriate chord width at either end to provide for the uniform blending of the tenon into the trailing edge. Without the requirement for trailing edge relief, the prominent slot between end cap and airfoil was eliminated. These changes in the airfoil tenon geometry accounted for a subtle but significant difference in the posi- tion of the airfoil loading axis.
Mechanical improvements were also initiated as a result of stress analysis and friction measurements. The depth of the groove in the end cap, for example, was reduced approximately 12 percent or l/8 inch to ~318 inch to decrease the maximum principal stress at the bottom of
Figure 3-39. The Second Generation Ceramic Stator Vane Assembly Design
63
the groove from 11,700 to 8700 psi. The major radius of curvature at the end cap/insulator interface was reduced from 8 inches to 3 inches to ensure stability irrespective of the friction coefficient of silicon nitride or silicon carbide with the insulator material. Since both axial and torsional components of the gas load act upon this interface, positive location must be maintained for proper stator vane alignment.
The airfoil/end cap interface was designed to prevent edge loading, a probable cause of catastrophic failure in either an airfoil or end cap c6) Edge loading can occur whenever displacements of contact center . are large enough to reduce the actual contact area. For example, if the nominal contact surface moves beyond the extent of pieces in contact in an effort to achieve kinematic equilibrium under load, a much higher stress field or region of contact singularity will be created. To preclude any such singularity, the center of contact under conditions of zero load must be located within the airfoil cross section to provide adequate vane area for full area contact after displacement. The con- tact conditions most likely to cause the edge loading effect for any interface geometry are the two extremes in the coefficient of sliding friction, i.e., vsu = 0.45 and psu = 0.05. If the friction coefficient is high, the condition which occurs when the interface is hot, the cen- ter of contact tends to remain at the zero load position with the con- tact area on the concave side of the airfoil. When the friction coefficient is low, a larger increment of the gas load is reacted by normal forces across the interface and large shifts in the center of contact occur. In this case, the contact area moves toward the convex side of the airfoil.
Elliptical contact areas are projected against the vane cross sec- tion of an inner interface position in tiigure 3-40 where AR = 0.002 inch, the minimum design difference in the vane and end cap torroidal radii is represented. Here, the center of contact at zero load is located in the wider section of the airfoil near the leading edge where there is enough vane area to prevent edge loading of the vane on either the concave or convex side. At higher values of AR, the contact area becomes smaller. This establishes greater distance between the contact area and the airfoil perimeter. The hot contact tensile stresses increase directly as a function of the radial difference of contact area. The effect of sliding friction coefficient and radial difference of contact area on the maximum tensile stress due to contact is shown in Fig- ures 3-41 and 3-42, where maximum and minimum stress for the conditions specified appear at points A and B, respectively. The maximum value of contact tensile stress under startup conditions is 16,500 psi for ku = 0.25 and AR = 0.008. At shutdown, the maximum anticipated value of contact tensile stress is 17,000 psi where AR = 0.008 and psu = 0.05. The design was predicated on the highest allowable contact stress to preclude any possibility of edge loading in the vane assembly. Because of manufacturing considerations and a request from the vendor, the
64
Figure 3-40. Vane Cross Section Showing Elliptical Contact Surface Projections for the Worst Contact Conditions at the Inner Airfoil/End Cap Interface
I O c ,002
I 1 I I I I ,004 ,006 .008
RADIAL DIFFERENCE, AR - I”.- I I I I I 1 1 1 1
.05 .15 .25 .35 .45
START UP COEFFICIENT OF FRICTION, filJ-
Figure 3-41. Startup Tensile Contact Stress at Airfoil/End Cap Interface Showing Effects of Parameter Variation
65
I
o i ,002 I I I
,004 ,006 .008 RADIAL DIFFERENCE, AR-in.-
I I I I I I I I I
.4!i .40 .35 .30 .25 .20 .15 .lO .05
-START IJPCDEFFICIENTDF FRICTION,/JSO
Figure 3-42. Shutdown Tensile Contact Stress at Airfoil/End Cap Interface Showing Effects of Parameter Variation
resulting radial difference between the mating surfaces at the airfoil tenon/end cap cavity interface was specified finally as 0.002 inch, minimum, and 0.012 inch, maximum. Edge radii of 0.060 inch were pro- vided overall to reflect the results of the radii effects study appearing in Figure 3-43.
The second generation airfoil design was subjected to a preliminary transient thermal analysis(6) to test whether acceptable stress levels had been achieved by the mechanical-aerodynamic optimization design process. Boundary conditions for parabolic surface temperature decay from a constant 2500'F to 350°F in 80 seconds were established using a half-airfoil model in which symmetry about any line perpendicular to the radial direction was assumed. The airfoil cross section. at its end cap cavity entrance location is illustrated in Figure 3-44. The finite element model with typical values of maximum principal stress resulting from thermal deformations at the nodal points appears in Figure 3-45. The greatest maximum principal stress (166,000 psi) occurred 8 seconds after shutdown in the region where the geometric approximation of the finite element model was the poorest, i.e., the transition region between the airfoil and tenon at the leading edge.
66
- Material Properties, Applied Prime Loads- Circumferential Geometry: As Before -
- Least Favorable Friction Case, b = .lO
Edge Radius--f In. l Chosen Radius
Figure 3-43. Circumferential Edge Loading Analysis of Hertzian Contact Stresses (Tensile) at Thick-Thin End Cap/Insulator Interlocks
Figure 3-44. Second Generation Airfoil Cross Section at the End Cap Surface
67
Figure 3-45. Finite Element Model of Airfoil Section With Representative Stress Values (ksi)
When a standard check incorporated into WISEC (Westinghouse Three- Dimensional Isoparametric Finite Element Code) confirmed the possibility of inaccuracy in the vicinity of this critical leading edge location, the analysis was rerun using a modified finite element model. These results are shown in Figure 3-46. Maximum principal stresses are indi- cated at the nodal points; temperatures appear in parentheses.
Although the preliminary stress analysis did not support design viability, the vagueness of results and questions concerning the qualify- ing assumptions suggested further three-dimensional stress analysis(T) before a final decision to discard the design. The analysis was repeated using the asymmetric condition of the tapered-twisted airfoil interacting with an end cap. Only the outer end cap location was con- sidered, however, because principal stress maxima occurred there. At the inner end cap location, the overall stress distribution is propor- tionate but lower. Interference to cause high contact stresses along the mating surfaces of the end cap/airfoil interface was also considered for a steady-state case at 2500°F peak temperature. Other qualifying assumptions were similar to those stated previously. Silicon nitride was assumed to be homogeneous, isotropic and elastic at all tempera- tures and loading rates. The contact forces (between airfoil and tenon end caps)
68
32
Figure 3-46. Modified Finite Element Model Showing Principal Stresses (in ksi) and Selected Temperatures (in OF)
and the gas load were considered to be negligible. Transient thermal analyses were performed for two conditions of shutdown, i.e., flameout ($350'F/sec) and controlled at 25OF/sec.
The initial and boundary conditions for the end cap thermal analysis are shown superimposed upon the actual end cap geometry in Figure 3-47. Heat transfer data for the airfoil and outer end cap are presented in Figure 3-48. The three-dimensional element models for the second gener- ation airfoil and an end cap appear in Figures 3-49 and 3-50, respectively.
Temperature and stress contours for the airfoil at Sections 7a (midplane), 3, and 6a (Figure 3-50) are illustrated in Figures 3-51, 3-52 and 3-53, respectively. Under flameout conditions from 2500°F, the maximum principal stress at midplane reached 72,300 psi after 10 sec- onds. A stress concentration and high stress gradient occurred in the vicinity of the upper and lower tenons. This result was attributed to the arbitraty use of a lower heat transfer coefficient at the airfoil tenon contact surface. The maximum principal stress in the airfoil occurred on the pressure side near the trailing edge. If the value of h was not reduced at the contact surface, but rather considered to be
69
Figure 3-47. Initial and Boundary Conditions for End Cap Thermal Analysis (h = Btu hr-1 ft-2 OF, T = OF)
600
500
k 400
CIJ Jz
y- 300
t m e
z 200
1om
E
s in em
5 6 9 10
r1.E.
I
s .E C
400
200
I I I I I I I ’ 0 0.5 1.0 1.5 2.0 2.5 3.0 3.5 4.0
s m Inches
Figure 3-48. Calculated Variations in Heat Transfer Coefficients as a Function of Distance from the Leading Edge for the Airfoil Section at Mid-Height and the End Cap Surface
70
Figure 3-49. Three-Dimensional Element Model of the Second Generation Airfoil Under Equilibrium Conditions
Figure 3-50. Three-Dimensional Element Model of the End Cap Under Equilibrium Conditions
Figure 3-51. Temperature and Stress Distributions for Second Generation Design Airfoil 10 Seconds After Flameout from 2500°F Steady-State Gas Tempera- ture (Section 7a) (h: High-Low)
Fi gure 3-52. Temperature and Stress Distributions for Airfoil Section 3 Ten Seconds After Flameout from 2500°F Steady-State Gas Temperature (h: High-Low)
Figure 3-53. Temperature and Stress Distribution for Airfoil Section 6a Ten Seconds After Flameout from 2500'F Steady-State Gas Temperature [(a) h: High-Low, (b) h: High-Low, (c) h: High-High)]
an exposed part of the entire airfoil surface, the maximum principal stress would be reduced approximately 5 percent from 127,300 psi to 120,000 psi (Figure 3-53). Changes in the heat transfer coefficient at the contact surface had the effect of changing both the location of the maximum stress and the stress distribution.
At the controlled cooldown rate of 25OF/sec, a maximum principal stress of 71,800 psi was reached after 50 seconds. The resultant stress distribution is shown in Figure 3-54. A change in the shutdown transient not only reduced the principal stress maximum but also altered its posi- tion significantly.
Flameout produced a maximum principal stress of 123,000 psi at the inner surface of the outer end cap on the suction side near the leading edge of the airfoil after 14 seconds. The three-dimensional aspects of the temperature and stress distributions in the end cap can be obtained from Figures 3-55, 3-56 and 3-57. Figure 3-58 shows the state of stress resulting from cooldown at 2S°F/sec. The maximum principal stress of 92,900 psi now occurs within the end cap cavity.
73
NO STRESS h Wd
: 9 62 0 : 18 : 124 62
: 21
:i 54
166 240
: 310 312 9 63 434
Figure 3-54. Stress Distribution in Airfoil Sectio:l 62 at 50 Seconds After Shutdown from 2500°F Steady-State Gas Temperature at 25"F/Sec
Figure 3-55. Temperature and Stress Distributions for End Cap Section 7e at 14 Seconds After Flameout from 2500°F Steady-State Gas Temperature (h: Iiigh- Low)
74
Figure 3-56. Temperature and Stress Distributions for End Cap Section 6e at 14 Seconds After Flameout from F 2500°F Steady-State Gas Temperature (h: High- Low)
Figure 3-57. Temperature and Stress Distributions for End Cap Section 3 at 14 Seconds After Flameout from 2500°F Steady-State Gas Temperature (h: High- Low)
Figure 3-58. Stress Distribution during Cooling at 25"F/Sec from 2500°F Steady-State Gas Temperature in End Cap Section 7e After 58 Seconds
The airfoil-end cap interface was designed for partial area contact with the noncontact portions of the mating surfaces in close proximity. Maximum clearances were specified at room temperature such that the contact stresses due to the axial spring and gas loads remained low. However, differential thermal deformation of the mating geometries under operating conditions could reduce the contact area below that required to maintain acceptable contact stress levels. Alternately, interference could result in contact point changes to create edge loading and large bending and/or torsional stresses. Displacement components v in the y-direction are illustrated on the contact surface at four points, A, B, C and D, in Figure 3-59. Steady-state and transient displacements are defined as the distance a point moves from its original position at room temperature to its position at a given steady-state temperature or position at any transient temperature with respect to time. The transient chosen occurred after 50 seconds under controlled shutdown conditions at 25OF/sec cooling rate.
The u and w displacements, in the x and y directions, respectively, were similar for the airfoil and end cap in both the steady-state and transient cases calculated. These did not create contact problems under the controlled shutdown condition imposed. The displacements, v, in the
76
SECTION 1-1’
SUCTION SIDE
A . .
l ’ 5-
c-2 0
x A 6 C D 20 I 1 1 I 1 I Y
> 8 @ ii
-5 -
v PRESSURE SIDE
2
t
SECTION 3-3’
X Y
--2
SECTJDN 5-5’
-2
-1
cu A B C 0
L I I 1 I
A 5t X
- -1 . . . . J -2
AIRFOIL X STEADY STATE
END CAP D - STEADY STATE
l - TRANSIENT 0 - TRANSIENT
Figure 3-59. Deformations of the Airfoil/End Cap Contact Surfaces at Steady State and During Shutdown Transient
y-direction were also small and of similar magntiude in the airfoil and end cap at steady state. However, transient displacement, v, in the airfoil, at Sections 1 and 5 became significantly large, while corre- sponding Sections l', 3' and 5' within the end cap remained small, creating a potential contact edge loading condition with attendant high bending and torsional stresses. At the mid-chord location (Section 3 - airfoil) changes were not appreciable. Section 5, near the leading edge of the airfoil, was displaced toward the pressure side and Section 1, near the trailing edge, was distorted toward the suction side. Recurring displacements in cyclic operations may cause fretting at the interfacial surfaces, further complicating the performance problem.
In spite of aerodynamic and mechanical advantages apparent in the second generation/ceramic stator vane assembly, design viability was not demonstrated. Rigorous three-dimensional stress analysis indicated that the principal tensile stresses, generated under even the moderate con- ditions of controlled shutdown at 25OF/sec, exceeded the engineering
77
strength of hot pressed silicon nitride and hot pressed silicon carbide. Unfortunately, this analysis lagged the lead time required for vane assembly procurement. Design drawings were prepared previously to insure the availability of hardware for test. Norton manufactured eight first- stage stator vane assemblies (inner and outer end cap plus airfoil Per assembly) from HS130 silicon nitride and eight assemblies from ~~132 silicon carbide. However, while this design was dropped eventually, the manufacture of parts did provide an additional opportunity for fabrication development.
78
3.7 THIRD GENERATION VANE ASSEMBLY DESIGN
The third generation stator vane assembly design evolved to meet the general requirements of the Advanced Test Turbine-C61 In reality, it represented a refinement of the first generation design concept modified to provide a tapered-twisted airfoil for proper flow orientation to the first-stage rotor. A toroidal tenon geometry was superimposed upon the actual airfoil cross section with trailing edge relief retained as shown in Figure 3-60 (a photograph comparing design generations I, II and III>. No attempt was made to fill the end cap cavities completely along the airfoil tenon mating surface.
The end cap configuration reflected improvements suggested by the stress analysis of the first and second generation components. Kinematic behavior was also considered. The major radius of the toroidal surface of curvature at the end cap insulator interface was specified as 3.000 I!I 0.005 inches to resist displacement in the downstream direction regardless of friction coefficient. The groove depth was adjusted to 0.375 -t 0.003 inch, a dimension considered sufficient to prevent dis- lodgement of the airfoil under hot gas loads. End cap cavities at inner and outer end cap locations were sized and oriented independently to compensate for taper and twist in the airfoil section.
1s~ GENERATION 2~13 GENERATION JRD I;ENERATION
1. Parallel-Sided Airfoil 2. Tapered-Twisted Airfoil with Full Cavity-Filling Tenons 3. Tapered-Twisted Airfoil
Figure 3-60. Stator Vane Design Iterations
79
Particular care was taken in the selection of tolerances at the airfoil/end cap interfaces to insure adequate area contact confinement at the bottom of the end cap cavity without restriction of kinematic motion there beyond desired limites. Radius dimensions, R - 0.000 + 0.003 inches and R + 0.000 - 0.002 inches, were established for major and minor radii of end cap cavity and airfoil tenon, respectively.
The finalized design was not subjected to stress analysis, per se, as a final test of design viability. Time and funding limitations made this impossible considering the decision to eliminate the advanced turbine demonstration and return to the original contract expiration date, June 30, 1976. Certain aspects of previous analyses appear pertinent however. Contact stress calculations at the airfoil tenon/end cap cavity interfaces of the first generation design and the transient thermal stress distributions at airfoil mid-chord for the first generation design apply sufficiently well. The contact displacement analysis for the second generation design was considered valid for first and third generation hardware with provision that differential effects be less pronounced because mating surfaces reduce in direct proportion to the amount of end cap cavity filled by tenon volume. Thermal stresses in the airfoil at the inner and outer tenon locations are proportionally smaller and larger, respectively, in a tapered airfoil section, than for the parallel-sided case cited previously. Contact stresses at the end cap interfaces at these same inner and outer locations are proportionately larger and smaller, respectively, because the major radii decrease (or increase) to establish a smaller (or larger) contact area.
When the advanced turbine test was cancelled, an order to Norton for 100 silicon nitride (NC132) stator vane assemblies of third generation design was ammended and terminated prior to completion to conserve contract funds. Twenty-eight airfoil sections and 44 end caps were actually manufactured. These were used in the static rig test demonstration.
80
SECTION 4
STATIC RIG TESTING
4.1 STATIC RIG PREPARATION
Modification of an existing facility was initially proposed to meet the contract requirements for the static testing of ceramic stator vane assemblies at peak temperatures of 2200'F and 25OO'F in a high velocity gas stream. A new cascade-type rig was eventually designed and built ar: part of the Stationary Turbine Project at Westinghouse Power Generation Systems Division (formally Gas Turbine Systems Division) in an attempt to test and evaluate full-size ceramic parts in a realistic turbine configuration using a commercial stationary gas turbine fuel nozzle and combustor basket.(3-7) Every effort was made to duplicate actual turbine conditions. Precise control and highly instrumented computerized data acquisition were provided. A 0.8 or 80 percent pressure simulation was the best obtainable because compressors available in the laboratory were capable of delivering air at pressures of 3 to 8 atmospheres only.
The initial version of the static rig, as constructed for 2200°F testing, is presented in schematic plan view in Figure 4-l.(4) Ceramic vane assemblies were tested in their true radial configuration and actually performed a gas turning function. Scale-up problems were eliminated by employing W251 combustor hardware and fuel nozzle assemblies. Internal flow baffles were used to direct inlet air flow and simulate the shell geometry that surrounds the combustion system in a gas turbine. A sight port was provided for the observation of hardware under test.
The cooled-wall combustor produced a temperature-profiled gas stream which passed from the transition piece, through the vane segments in the mitered section, into a complex exhaust duct which channeled the gas to the mixer. The mixer section served to smooth the temperature profile of the gas stream by turbulence so that hot gas of a more uniform temperature was monitored by control instrumentation. A high temperature composite refractory material was employed to insulate the mixer for applications up to 3000°F. The operating pressure level of the rig was controlled by the back pressure valve located downstream of the measurement section.
Key elements of the static rig are illustrated for ready reference. The rig itself is shown in Figure 4-2 as it appeared in the Combustion Laboratory ready for use. The mitered section with barrier plate and internal baffles, the mitered section internal with test fixture
81
J Barrier Plate
-Combustor Baskets
Plan View __-
Figure 4-l. Modified Static Test Rig for 2200°F Test of Ceramic Vanes
Figure 4-2. The Static Rig for Testing Ceramic Stator Vanes at 2200 and 2500°F (Mitered Section is 42 Inches in Diameter)
82
attached to the barrier plate, and the hot gas duct for 2200°F service are shown in Figures 4-3, 4-4 and 4-5, respectively. The actual flow path components,i.e., the instrumented combustor, the transition piece attached to the ceramic test assembly, and a metal exhaust duct with instrumentation rakes fit inside the five basic components of the refractory-lined outer shell structure.
Extensive instrumentation was provided. Gas passage temperature profiles were measured by fast response aspirating thermocouple rake systems located upstream (42 thermocouples) and downstream (49 thermo- couples) of the ceramic stator vanes. All of the metal support hardware was monitored with thermocouples that were strategically located at shoes, air baffles, inner and outer housing rings, side vanes and spring housings. These thermocouples were used to evaluate heat transfer analyses, cooling air schemes and design/analysis characteristics. Specially designed load cells were installed to measure the radial load on each pair of vane assemblies during spring installation, loadup and during various phases of rig operation.
Unfortunately, attempts to maintain strain gauges on silicon nitride vanes under transient thermal conditions proved unsuccessful. However, an instrumented (with thermocouples and strain gauges) metal airfoil/end cap assembly was designed and fabricated to obtain meaningful heat trans- fer and stress data up to 1400°F. (The heat transfer and stress tests
Figure 4-3. Mitered Section of Static Rig Showing Barrier Plate for the Installation of the Test Assembly
83
Figure 4-4. Mitered Section of the Static Rig with Test Assembly Installed
Figure 4-5. Hot Gas Duct for 2200°F Static Rig Test
84
to correlate two- and three-dimensional design/analysis techniques were scheduled but never run because vane test delays preempted them and the contract finally expired.)
Existing laboratory facilities accurately recorded air and fuel flows, pressures and temperatures. A Westinghouse Veritrak temperature controller reproducibly followed a prescribed mode of operation by sensing and responding to the uniform operating temperature of the gas, downstream of the mixer section, through a system of feedback loops and variable function generators.
The raw data, whether in the transient or steady-state mode, were collected by a rapid data acquisition system. Various data sequencing tapes controlled data retrieval during transient operation at acquisition rates of seven pieces of information per second. Computer programs con- verted the values directly into engineering units during the 2200°F test phase.
A rugged platinum-platinum/rhodium aspirating thermocouple, monitoring the peak gas temperature in the transition piece, functioned to exclude extreme temperature excursions. If the gas temperature in the rig exceeded 2450°F, fuel flow interrupted, automatically terminating the test to protect rig components and ceramic test parts from possible damage.
The test section contained eight ceramic stator vane assemblies (Norton HS130 silicon nitride) positioned between two air-cooled metal side vanes (X-45 alloy) which enclosed the gas passage on each side. The ceramic vane assemblies (an airfoil seated in toroidal cavities between an inner and an outer end cap) were supported in pairs between lithium aluminum silicate insulators (Owen Illinois CERVET C-140), woven metal cushion material, and Haynes 188 metal shoes (Figure 4-6). Two metal pivots supported each inner shoe while a single spring-loaded plunger and pivot were used at each outer shoe location. The entire assembly was fastened between inner and outer metal (Type 405 stainless) housing ring segments. Suitable cooling, seals and air baffles were provided to keep the metal support system within specified temperature limits. Figure 4-7 shows the fully instrumented vane assembly test section as it appeared before being bolted in place against the barrier plate.
85
F igure 4-6. Ceramic Stator Vane Assembly for Static Rig Tes ing at 2200°F
t-
Fig ure 4-7. Instrumented Test Assembly for the 2200°F Static Testing of Silicon Nitride Stator Vanes
Rig
86
4.2 DEFINITION OF THE STATIC RIG TEST CYCLE
Since stationary gas turbine generators are traditionally used to meet peak power requirements, the static rig environment for the test and evaluation of ceramic stator vanes was selected to represent a cyclic mode of operation where transient thermal conditions are considered most critical to component life and reliability. Much thought was given initially to the use of emergency shutdown or flameout as the determinant factor in the test because it occurs relatively often in commercial ser- vice whenever fuel is interrupted for any reason such as insufficient supply or abnormal operating condition, as the result of, for example, over-speed or over-temperature. Approximately 100 cycles were accepted arbitrarily as representative of start-stop sequences in actual use at normal overhaul or servicing intervals.
Under emergency shutdown or flameout conditions, however, the turbine inlet temperature was expected to drop from 2500°F peak to 1lOO'F within 2 seconds for the gas temperature profile shown in Figure 4-8. The 2500'F curve was extrapolated from actual data collected from a Westinghouse W251, 30 megawatt stationary gas turbine, operating at 1990°F average turbine inlet temperature (the system reserve condition), using a W251 AA combustor identical to the one specified for static rig tests at 2200OF. An analysis of the 2500°F peak temperature revealed principal stress levels in Si3N4 vanes reaching 70,000 psi and 58,000 psi at 1675°F and 1750°F for a turbine and the static rig, respectively
Upper End Cap
Inner End Cap
*
Figure 4-8. Relation of Peak Ceramic Vane Temperature to Temperature Profile and Average Turbine Inlet Temperature
87
(Figure 4-9). Results for the 2200°F peak condition appear in Figure 4-10 where the difference between the turbine and rig is attributed to pressure ratio (10.5:1 for the turbine vs 8.0 max.: 1 for the rig) and the resultant heat transfer coefficients developed, respectively.
The calculated stress values were considered too high for acceptable cycle life based upon preliminary tensile test data for silicon nitride. At 1900°F, 20,000 psi stress appeared to be a reasonable limit based upon cursory low cycle fatigue results at 20,000 psi stress level, with increases to 30,000 and 50,000 psi permissible at 1500°F and 900°F, respectively.
Alternate shutdown ramps were investigated to find a cycle descrip- tion which would meet the proposed conditions for a controlled emergency shutdown without subjecting ceramic components to an unfavorable stress history. Reductions in linearly programmed quenching rate from 770"F/sec to 315'F/sec, 100°F/sec, or 25"F/sec had an advantageous effect on maxi- mum principal stress in the ceramic airfoil. At 315"F/sec the tensile stress maximum reached 68,000 psi at a calculated airfoil temperature of 1480°F, 8 seconds after shutdown, whereas at lOO'F/sec, the maximum stress ascended to 40,000 psi at 1850'F after 12 seconds (Figure 4-11).
Figure 4-12 illustrates the extreme effect for 25"F/sec. Here, the maximum stress (17,000 psi) is developed at 2000'F after 25 seconds.
Static -
Time, set
Figure 4-9. Shutdown from 2500°F to 950°F (Gas Temperature) in 2.0 Seconds