133
Broad- basing Deepening our de-risking. Widening the moat Annual Report 2020-21 Greenpanel Industries Limited

Broad- basing
Deepening our de-risking. Widening the moat
Annual Report 2020-21
Gre
enpa
nel I
ndus
trie
s L
imite
d

Contents
06Corporate snapshot
16Chairman’s overview
22Managing director’s perspective
26Our principal de-risking
30Strategic depth
42Value creation
46Broad basing through a robust product mix
62Greenpanel. Broad-basing through stronger people practices
68Greenpanel. Broad-basing through manufacturing excellence
Forward-looking statement
This report and other statements – written and oral - that we periodically make contain forward-looking statements that set out anticipated results based on the management’s plans and assumptions. We have tried wherever possible to identify such statements by using words such as ‘anticipates’, ‘estimates’, ‘expects’, ‘projects’, ‘intends’, ‘plans’, ‘believes’, and words of similar substance in connection with any discussion of future performance. We cannot guarantee that these forward-looking statements will be realised, although we believe we have been prudent in our assumptions. The achievement of results is subject to risks, uncertainties and even inaccurate assumptions. Should known or unknown risks or uncertainties materialise, or should underlying assumptions prove inaccurate, actual results could vary materially from those anticipated, estimated or projected. Readers should bear this in mind. We undertake no obligation to publicly update any forward-looking statements, whether as a result of new information, future events or otherwise.
70Greenpanel. Broad-basing through stronger financials
72Greenpanel. Broad-basing through a stronger brand
76Greenpanel. Broad-basing through a responsible Environment, Health and Safety commitment
80Greenpanel. Broad-basing through growing resource security
82Greenpanel. Responsible corporate citizen
83Management discussion and analysis
93Profile of the Board of Directors
95Statutory section
142Financial statements
Pride > ProfitWhen Greenpanel was demerged from Greenply and spun off into a separate company listed independently on the stock exchanges a few years ago, the one overarching thing that the promoters resolved was that the company would not play the game for profit.
It would play the game for pride instead. And that has made all the difference.
02 | Greenpanel Industries Limited Annual Report 2020-21 | 03
CORPORATE OVERVIEW STATUTORY STATEMENTS FINANCIAL STATEMENTS

Greenpanel encountered its most challenging market condition in 2020-21
1Dangers to
physical safety
4Strengthening rupee after the
first quarter that affected exports
2Demand
destruction
5Low trade
network morale
3Inability of
consumers to physically sample
our products
6Preference for
commodity products
Greenpanel responded with speed and sensitivity in 2020-21
1 2 3 4Enhanced
hygiene and safety
Remained optimistic in the
gloom
Focussed on quality revenues (low receivables)
5 6 7Built institutional
customer relationships
Enhanced dealer network
productivity
Focused on marketing value-
added products
Created an e-catalogue
04 | Greenpanel Industries Limited Annual Report 2020-21 | 05
CORPORATE OVERVIEW STATUTORY STATEMENTS FINANCIAL STATEMENTS
Corporate snapshot
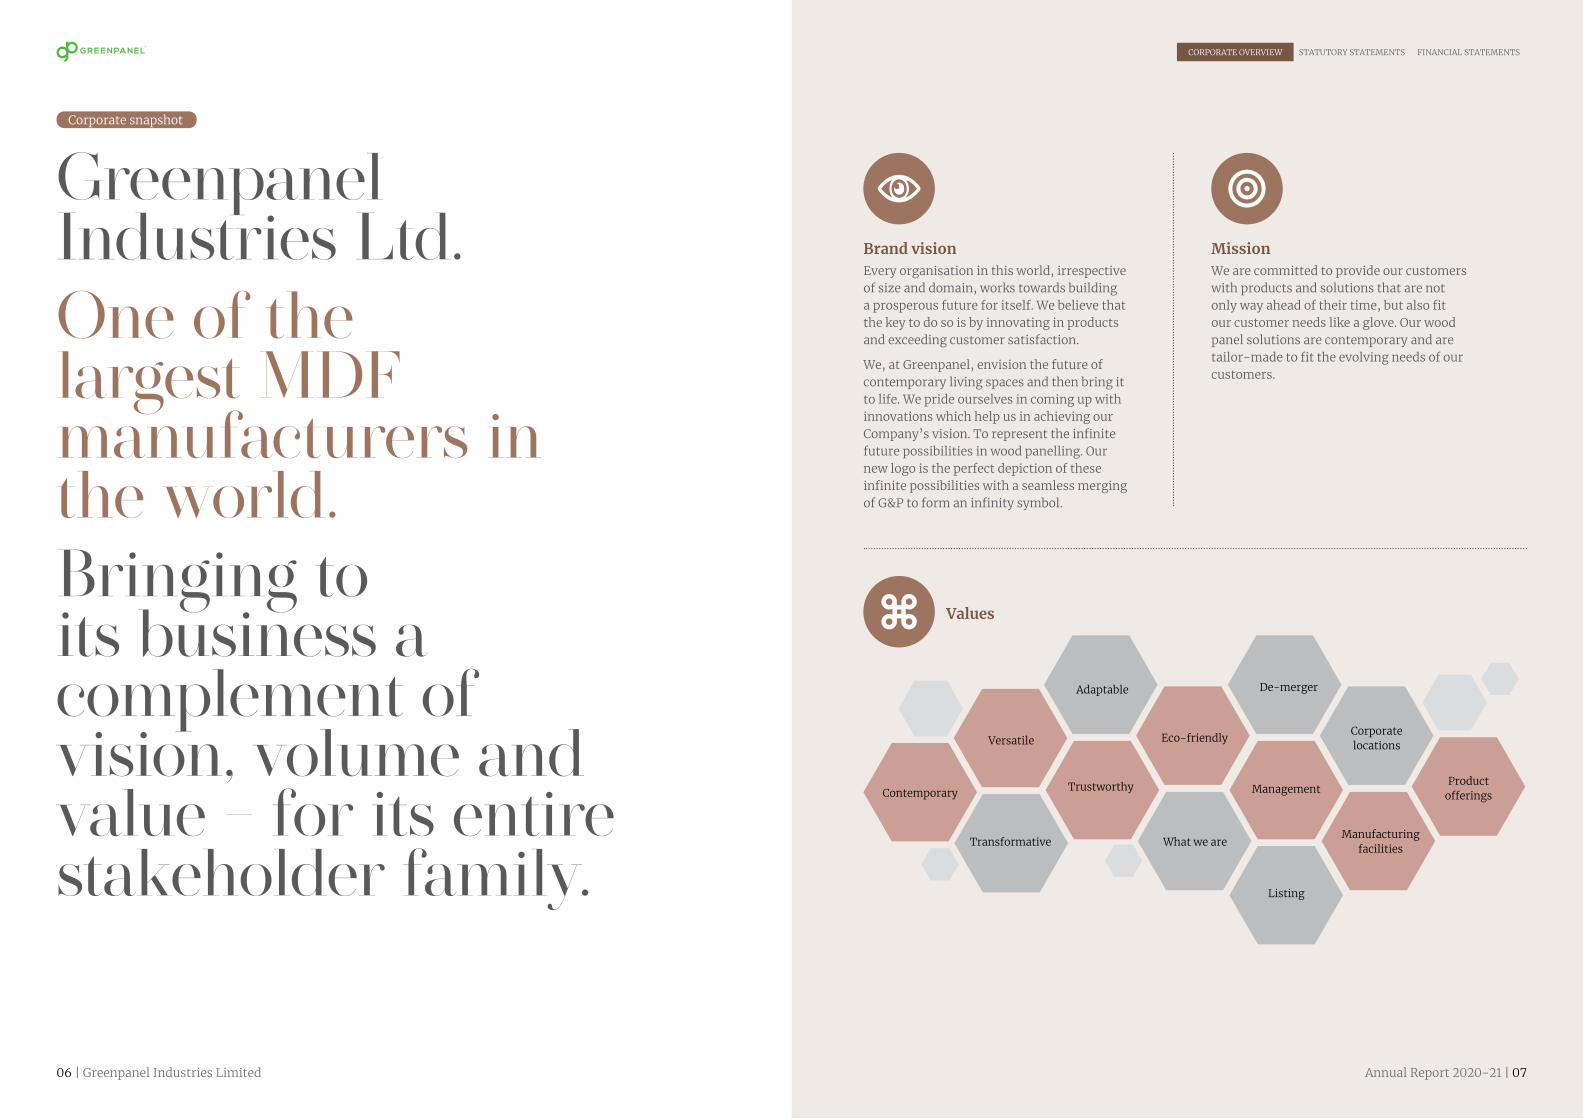
Greenpanel Industries Ltd. One of the largest MDF manufacturers in the world. Bringing to its business a complement of vision, volume and value – for its entire stakeholder family.
Brand visionEvery organisation in this world, irrespective of size and domain, works towards building a prosperous future for itself. We believe that the key to do so is by innovating in products and exceeding customer satisfaction.
We, at Greenpanel, envision the future of contemporary living spaces and then bring it to life. We pride ourselves in coming up with innovations which help us in achieving our Company’s vision. To represent the infinite future possibilities in wood panelling. Our new logo is the perfect depiction of these infinite possibilities with a seamless merging of G&P to form an infinity symbol.
Values
MissionWe are committed to provide our customers with products and solutions that are not only way ahead of their time, but also fit our customer needs like a glove. Our wood panel solutions are contemporary and are tailor-made to fit the evolving needs of our customers.
Contemporary
De-merger
Versatile
Management
Transformative
Listing
Adaptable
Corporate locations
Trustworthy
Manufacturing facilities
Eco-friendly
Product offerings
What we are
06 | Greenpanel Industries Limited Annual Report 2020-21 | 07
CORPORATE OVERVIEW STATUTORY STATEMENTS FINANCIAL STATEMENTS

Contemporary
We constantly strive to come up with innovative designs that fit modern spaces and add sheen of elegance to home or office space.
Versatile
We embrace change and do not fear it. This helps us stay ahead of the curve and please our customers.
Transformative
With avant-garde offerings, we constantly try to raise the bar of the industry in general.
Adaptable
We are nimble and are quick to adapt as and when required.
Trustworthy
Be it our customers, shareholders, employees or the public in general, we make sure we live up to the trust they have placed in us.
Eco-friendly
We make the best use of the scarce resources available to us to minimise wastage and only use efficient production practices.
What we are
Greenpanel is a leader within the vast market of India in the manufacture of wood panels. The Company’s principal product is Medium Density Fibreboard (MDF). The Company is a market leader in this segment.
De-merger
The Company was the erstwhile MDF division of Greenply Industries. The business was de-merged on April 1, 2018 into an independent company that now focuses on the manufacture, distribution and marketing of MDF and related interior infrastructure products.
Management
Greenpanel is headed by respected leaders from India’s wood panel industry. The Company is led by Mr. Shiv Prakash Mittal (Executive Chairman) and Mr. Shobhan Mittal (Managing Director and CEO), supported by a team of experienced industry professionals. The strength of the Greenpanel team as on March 31, 2021 was 1816.
Product offerings Medium Density Fibreboard: Engineered wood manufactured with hardwood fibres, bonded together under high pressure and temperature (up to 240 degrees Celsius) with synthetic resin and wax. Greenpanel’s MDF is respected for a high uniform density, making it strong, durable and eco-friendly.
Greenpanel wood floors: Customised around Indian conditions. Protects against dust, scratches and extreme climatic changes.
Greenpanel plywood: Customised around a range of applications. Manufactured on new-age equipment. Strict adherence to quality control. Helped create new benchmarks in India’s organised plywood segment.
Greenpanel veneers: Offer an exclusive range of unique and exotic designs. Suitable for use in interiors (including high humidity applications).
Greenpanel doors: Possess high dimensional accuracy and stability (ideal for conditions of varying humidity). Customised and available with a decorative veneered surface in horizontal or vertical grains.
Listing
The Company was listed (following a demerger) on the NSE and BSE on October 23, 2019. The Company enjoyed a market capitalisation of H1964 crores as on March 31, 2021, based on the closing price on NSE of H160.15
Corporate locations
The Company is headquartered in Kolkata (West Bengal) with supporting offices in Gurgaon (Haryana) and Singapore.
Manufacturing facilities
The Company invested in two state-of-the-art manufacturing facilities comprising European technology. The Company’s plants are located in Rudrapur (Uttarakhand) and Srikalahasti (Andhra Pradesh), the latter being arguably the largest MDF plant in the world.
Greenpanel is a leader within the vast market of India in the manufacture of wood panels. The Company’s principal product is Medium Density Fibreboard (MDF) and is a market leader in this segment.
08 | Greenpanel Industries Limited Annual Report 2020-21 | 09
CORPORATE OVERVIEW STATUTORY STATEMENTS FINANCIAL STATEMENTS
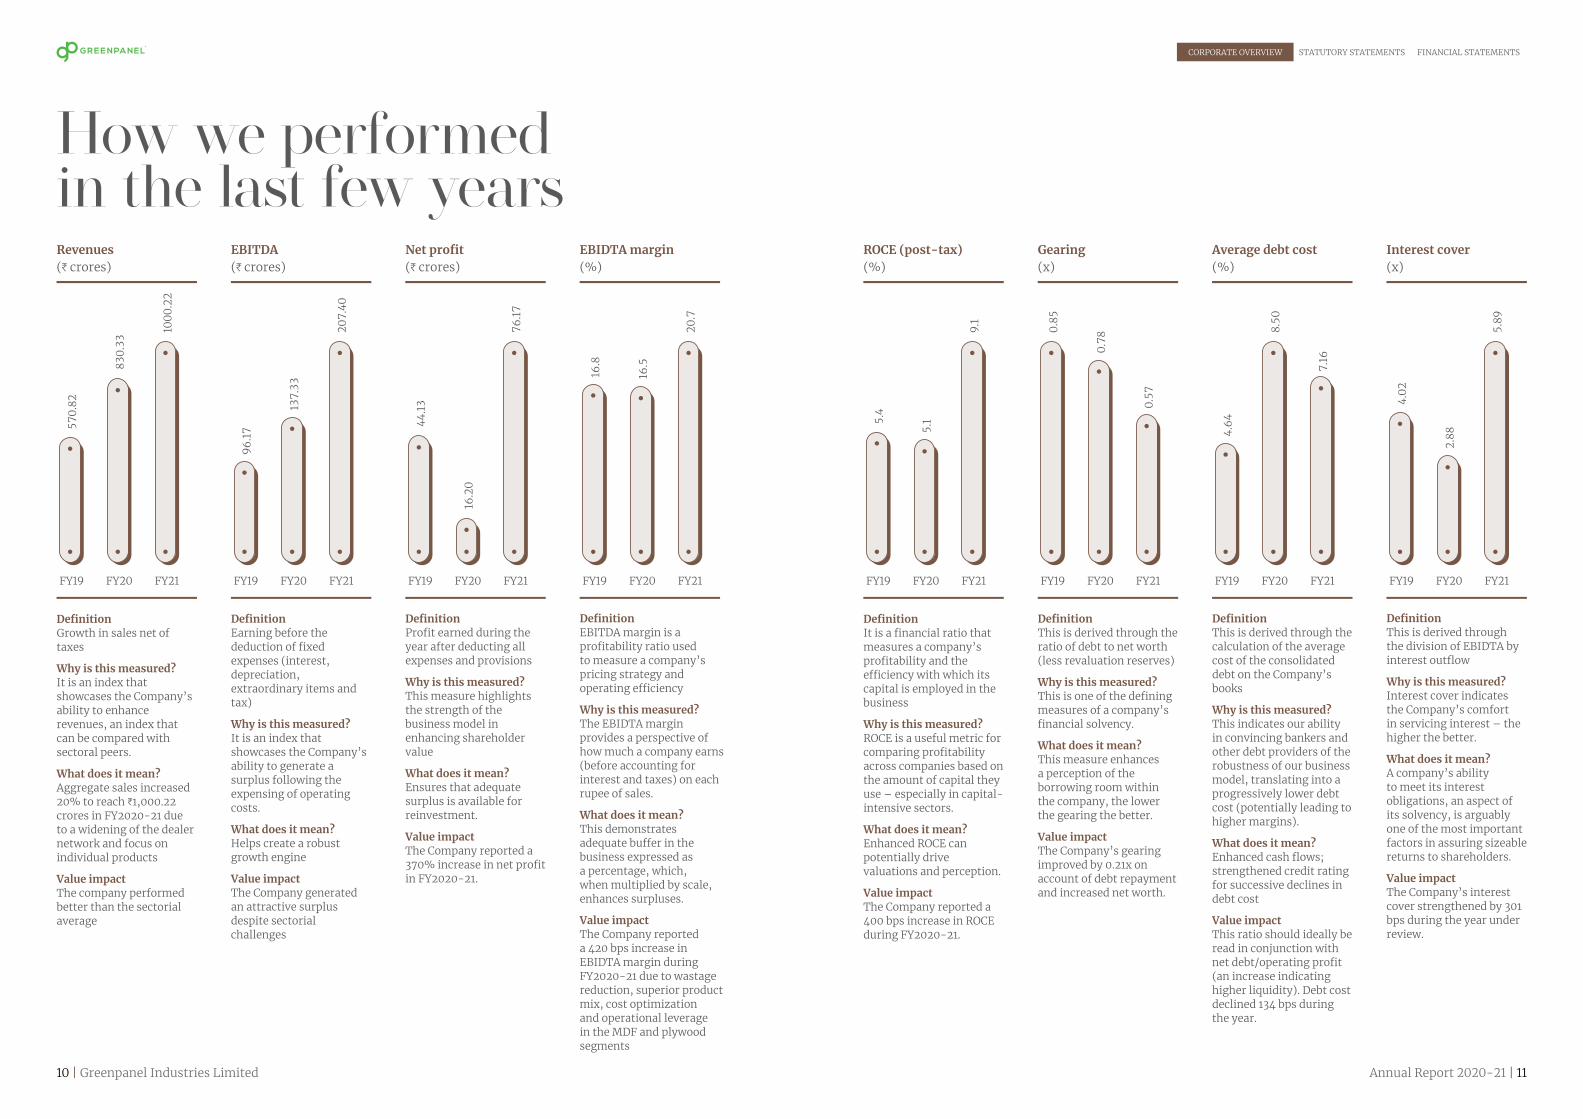
How we performed in the last few years
DefinitionGrowth in sales net of taxes
Why is this measured?It is an index that showcases the Company’s ability to enhance revenues, an index that can be compared with sectoral peers.
What does it mean?Aggregate sales increased 20% to reach H1,000.22 crores in FY2020-21 due to a widening of the dealer network and focus on individual products
Value impactThe company performed better than the sectorial average
DefinitionIt is a financial ratio that measures a company’s profitability and the efficiency with which its capital is employed in the business
Why is this measured?ROCE is a useful metric for comparing profitability across companies based on the amount of capital they use – especially in capital-intensive sectors.
What does it mean?Enhanced ROCE can potentially drive valuations and perception.
Value impactThe Company reported a 400 bps increase in ROCE during FY2020-21.
DefinitionEarning before the deduction of fixed expenses (interest, depreciation, extraordinary items and tax)
Why is this measured?It is an index that showcases the Company’s ability to generate a surplus following the expensing of operating costs.
What does it mean?Helps create a robust growth engine
Value impactThe Company generated an attractive surplus despite sectorial challenges
DefinitionThis is derived through the ratio of debt to net worth (less revaluation reserves)
Why is this measured?This is one of the defining measures of a company’s financial solvency.
What does it mean?This measure enhances a perception of the borrowing room within the company, the lower the gearing the better.
Value impactThe Company’s gearing improved by 0.21x on account of debt repayment and increased net worth.
DefinitionProfit earned during the year after deducting all expenses and provisions
Why is this measured?This measure highlights the strength of the business model in enhancing shareholder value
What does it mean?Ensures that adequate surplus is available for reinvestment.
Value impactThe Company reported a 370% increase in net profit in FY2020-21.
DefinitionThis is derived through the calculation of the average cost of the consolidated debt on the Company’s books
Why is this measured?This indicates our ability in convincing bankers and other debt providers of the robustness of our business model, translating into a progressively lower debt cost (potentially leading to higher margins).
What does it mean?Enhanced cash flows; strengthened credit rating for successive declines in debt cost
Value impactThis ratio should ideally be read in conjunction with net debt/operating profit (an increase indicating higher liquidity). Debt cost declined 134 bps during the year.
DefinitionEBITDA margin is a profitability ratio used to measure a company’s pricing strategy and operating efficiency
Why is this measured?The EBIDTA margin provides a perspective of how much a company earns (before accounting for interest and taxes) on each rupee of sales.
What does it mean?This demonstrates adequate buffer in the business expressed as a percentage, which, when multiplied by scale, enhances surpluses.
Value impactThe Company reported a 420 bps increase in EBIDTA margin during FY2020-21 due to wastage reduction, superior product mix, cost optimization and operational leverage in the MDF and plywood segments
DefinitionThis is derived through the division of EBIDTA by interest outflow
Why is this measured?Interest cover indicates the Company’s comfort in servicing interest – the higher the better.
What does it mean?A company’s ability to meet its interest obligations, an aspect of its solvency, is arguably one of the most important factors in assuring sizeable returns to shareholders.
Value impactThe Company’s interest cover strengthened by 301 bps during the year under review.
Revenues (H crores)
ROCE (post-tax) (%)
EBITDA(H crores)
Gearing(x)
Net profit (H crores)
Average debt cost (%)
EBIDTA margin (%)
Interest cover (x)
570.
82
5.4
96.1
7
0.85
44.1
3
4.64
16.8
4.02
FY19 FY19FY19 FY19FY19 FY19FY19 FY19
830.
33
5.1
137.
33
0.78
16.2
0
8.50
16.5
2.88
FY20 FY20FY20 FY20FY20 FY20FY20 FY20
1000
.22
9.1
207.
40
0.57
76.1
7
7.16
20.7
5.89
FY21 FY21FY21 FY21FY21 FY21FY21 FY21
10 | Greenpanel Industries Limited Annual Report 2020-21 | 11
CORPORATE OVERVIEW STATUTORY STATEMENTS FINANCIAL STATEMENTS

How Greenpanel has evolved across the decade
2010Launched Green Panelmax.
Commenced production at the most modern MDF plant in
India at Pantnagar, Uttarakhand 2014Launched Green Floormax Wood Floors
2016
2019
2020
Commissioned a second MDF plant at Srikalahasti, Andhra Pradesh
De-merged from Greenply to become Greenpanel Industries Limited
Grew the business attractively despite the pandemic impact
2015
2018
2019
Commissioned an export office in Singapore
Commenced production at Asia’s largest MDF plant
in Andhra Pradesh
Listed on NSE and BSE as a separate company
12 | Greenpanel Industries Limited Annual Report 2020-21 | 13
CORPORATE OVERVIEW STATUTORY STATEMENTS FINANCIAL STATEMENTS

At Greenpanel, we believe in a distinctive R>R understanding
Responsiveness Risk >
Most people asked, ‘Aren’t you seeking to maximise sales at any cost?’We said we would rather focus on sustainable growth instead.
A number of people asked, ‘What are you doing to grow your topline?’We said we would rather build our cash flows instead.
A number of people asked, ‘Why don’t you wait for the crisis to blow over?’We said we would prefer to row harder against the current instead.
A number of people suggested, ‘When will you extend longer credit to your trade partners?’We said that we would be more inclined to ask for advances instead.
A number of well-wishers hinted, ‘If you borrow more debt you would be able to enhance earnings per share and shareholder value.’We said we would rather grow shareholder value through net worth and repaying debt instead.
14 | Greenpanel Industries Limited Annual Report 2020-21 | 15
CORPORATE OVERVIEW STATUTORY STATEMENTS FINANCIAL STATEMENTS

Chairman’s overview
At Greenpanel, we believe that sustainable growth represents the de-risking element of all that we stand for
he year 2020-21 represented a watershed in the modern existence of humankind.
An infection emerged in one city in a pocket of the world that transformed into a global pandemic in the space of a single quarter, possibly the fastest
infection dispersal in recorded history.
The result is that cross-border travel came to a virtual standstill, countries imposed lockdowns and commercial cum consumer sentiment disappeared.
The global GDP declined from 2.9% in 2019-20 to
minus 3.5% in 2020-21, the first instance of a global economic de-growth in years.
RethinkThe pandemic has shaken the world’s faith in the predictability of everyday reality.
There is now a larger premium on stability, security and sustainability. As an extension of this reality, there is a larger premium on strategic and tactical de-risking. A number of our stakeholders are no longer asking ‘How fast can we grow from here?’ as much as they are asking ‘How much can we protect our competitiveness during any slowdown?’
This reinforces the classic stock market theory that the simplest way to make money on the exchanges is to never lose money. The result is a greater time, bandwidth and focus on de-risking as the fundamental platform for prospective growth. As an extension, the priority has shifted the organisational needle towards a term that is being referred to with a greater frequency – ‘Quality of business’.
This priority was evident from the time Greenpanel was spun into a different company a few years ago. In the recent past, we reconciled conservatism with aggression, seeking growth while protecting the company’s competitiveness. The result is that our business has consistently weighed risks and prepared
TA number of our stakeholders are no longer asking ‘How fast can we grow from here?’ as much as they are asking ‘How much can we protect our competitiveness during any slowdown?
16 | Greenpanel Industries Limited Annual Report 2020-21 | 17
CORPORATE OVERVIEW STATUTORY STATEMENTS FINANCIAL STATEMENTS

for them with the objective to generate stable and sustainable growth.
At Greenpanel, we believe that sustainable growth represents the bottomline of all that we stand for, whereby we reconcile the need to service a growing market appetite for our products with our capacity to manufacture or protect the environment without stretching the Balance Sheet. This strategic balance represents the most effective lever by which we endured a challenging FY21 and expect to outperform going ahead.
Setting out prioritiesAt the heart of our company’s culture lies the word ‘balance’ which has been secured through various imperatives.
One, there is a commitment to balance the various arms of the organisation to eliminate skews. This has translated into a commitment to produce only as much
– and validated – during the last financial tear. At a time when sales were low, the one temptation that we resisted was under-price and push sales. On the contrary, the company not only protected its realisations but also its terms of trade. The message that Greenpanel sent out was that even in challenging times, we would continue to focus on good business, recognising fully well that the mistakes made in one stressed quarter could take a number of quarters to correct.
Our building blocksAt Greenpanel, our de-risking framework has been marked by strategic clarity.
We will continue to invest in our brand, the principal engine of our revenue growth and business sustainability.
We expect to retain our position among the two largest MDF players in the country, a position that generates economies of scale, brand and position.
We will continue to leverage a substantial cost leadership (manufacturing, logistical and financial) in the markets of our presence that makes us viable across market cycles.
We will continue to repay debt and moderate the size of our Balance Sheet; this could empower us to absorb the impact of a sales slowdown better than competition and mobilise additional debt at lower costs.
We will select to grow out of our existing infrastructure, making it possible to commission successive rounds of capacity growth at outlays considerably lower than the prevailing greenfield cost average.
We will continue to run an organization marked by low overheads, reflected in increased per person productivity.
Desired outcomesWe expect to enhance our revenues and move towards profitable growth. In doing so, we expect to consistently outperform the broad sectorial average.
We believe this will enhance our liquidity, profitability and sustainability through the pandemic phase and emerge stronger.
Shiv Prakash Mittal, Chairman
as the market can absorb; market products without discounting; grow our market share in the short-term without compromising our brand across the long-term. The result is a clear segregation of initiatives that could possibly only address a fleeting short-term arbitrage and those that can take our long-term sustainability ahead.
Two, we believe that companies that endure do so on account of their robust processes and systems as opposed to an ad hoc response to realities. At the heart of our process capital is a robust governance framework, which is an overarching commitment to doing the right things and doing things the right way.
Three, there is a focus in graduating to a higher credit rating, which does not just represent an external validation but serves as a credible basis to negotiate a lower debt cost leading to long-term financial sustainability.
I am happy to state that this commitment was tested
At Greenpanel, we believe that sustainable growth represents the bottomline of all that we stand for, whereby we reconcile the need to service a growing market appetite for our products with our capacity to manufacture or protect the environment without stretching the Balance Sheet.
18 | Greenpanel Industries Limited Annual Report 2020-21 | 19
CORPORATE OVERVIEW STATUTORY STATEMENTS FINANCIAL STATEMENTS

Greenpanel: Delight-enhancing brand
20 | Greenpanel Industries Limited Annual Report 2020-21 | 21
CORPORATE OVERVIEW STATUTORY STATEMENTS FINANCIAL STATEMENTS

Managing Director’s perspective
At Greenpanel, we selected to walk the road less travelled. We explored different ways of growing the market.
Overview The year 2020-21 was the most challenging that Greenpanel has encountered in its short existence.
And yet, I am pleased to report that the company reported a 20% growth in revenues and a 370% increase in profit after tax during the year under review. The revenues and profits reported by the company were the highest in the company’s existence.
There are three creditable features of the company’s profitable growth performance that one would like to point out.
One, the company reported revenue and profit growth at a time the country’s economy de-grew. The outperformance was evident quarter on quarter through the course of the financial year, indicating that the outperformance was more than fleeting.
Two, the growth was not derived from dumping the company’s products onto a hesitant market. The growth was profitable; profit
after tax growth of 370% was more than the 20% growth in revenues during the year under review. As an extension of this reality, the company’s financial hygiene was showcased in a 420 bps increase in EBIDTA margin and 51% increase in EBIDTA during the year under review.
Three, the company outperformed its MDF sector. Even as the broad MDF market de-grew 37% during the year under review, the company reported a 20% increase in MDF volumes and 27% increase in MDF revenues. The result is that the company strengthened its market share. The company finished the year under review as the leader of the MDF segment of India’s interior infrastructure sector.
SpiritThe highlight of the company’s performance during the year under review is probably not going to be visible on the company’s Profit & Loss Account during the year under review.
The highlight was a validation of the company’s spirit and passion. At a time when there was extensive demand destruction and confidence erosion, it would have been easy for the company to be reconciled to waiting for demand revival.
At Greenpanel, we selected to walk the road less travelled. We explored different ways of growing the market. We reached out to our primary customers (trade
partners). We changed the way we would engage with our consumers (virtual over physical). We focused on enhancing team morale in anticipation of a time when market sentiment would turn and we would be among the first off the blocks. And above all, we focused on enhancing team safety.
The result is that the organisational needle shifted to ‘How do we beat the lockdown?’ The company reported H86 crores of revenue in the first quarter of the year under review which was the most challenging in view of the prevailing lockdown; revenues were 57% lower than the corresponding period of the previous financial year.
From the second quarter onwards, the company began to report better numbers in select months. For instance, the company’s second quarter revenues were 22% higher than the corresponding period in the previous financial year; the company touched peak pre-Covid monthly revenues in November 2020; the company reported its highest monthly revenue in March 2021. Besides, the company reported peak quarter revenues and profits from the third quarter onwards.
We believe that the ability to rebound with speed from a trough represents validation of the spirit of a young company, which will enrich our DNA, translating into a culture of outperformance.
Blessing
At Greenpanel, we believe that the pandemic was a blessing in disguise for our company.
As long as the consumer sentiment was relatively normal – as it was in the last couple of years – there was a focus on maximising revenues.
However, as consumer sentiment weakened during the lockdown and the company’s operations were virtually brought to a standstill, the management selected this opportunity to engage in an extensive business review. This review was undertaken across the entire operations with the objective to strengthen shock absorbers, deepen the culture of de-risking, selectively restructure operations and enhance opportunity preparedness.
I am pleased to communicate that this extensive review translated into a number of initiatives and priorities that enhanced the competitiveness of our business.
The result is that as the influence of the lockdown began to decline, the company was better prepared than ever to capitalise - not just on the business realities of the day but across the foreseeable future.
InitiativesTeam Greenpanel embarked on a number of business-strengthening initiatives during the last financial year.
Cost management: The biggest priority was the need to moderate costs, reduce our breakeven point and enhance our viability
22 | Greenpanel Industries Limited Annual Report 2020-21 | 23
CORPORATE OVERVIEW STATUTORY STATEMENTS FINANCIAL STATEMENTS

across market cycles. The company moderated people costs, renegotiated raw material prices and focused on enhancing asset utilisation that, in turn, helped the company amortise costs more effectively.
Sales review: The company reviewed the sizing and effectiveness of its sales team. The company focused on retaining outperformers with bunched responsibilities. The overhaul of the sales function resulted in enhanced sales throughput with a lower number of sales professionals. The company also recruited more sales professionals to cover a greater area effectively.
Efficiency management: The company focused on getting more out of less. This translated into stronger processes that maximised raw material utilisation on the one hand and moderated waste on the other.
Footprint: The company extended its footprint from an erstwhile focus on large cities towards smaller population clusters, supported by an increase in the number of dealers (MDF and plywood) on the one hand and the appointment of a larger number of small dealers.
OEM focus: The company deepened its focus on OEM customers, which enhanced revenue per customer,
Reasons why the Indian economy reboundedstrengthened our institutional accounts, generated follow-on revenues and made Greenpanel integral to their business. This approach had an immediate impact on increased capacity utilisation; the MDF capacity utilisation strengthened from 60% in Q2 to 93% in Q3 and 102% in Q4, strengthening overall profitability.
OutcomesI am pleased to report that Greenpanel’s responsiveness translated into improved outcomes during the year under review.
Three positive outcomes comprised an improvement in revenue efficiency, liquidity and indebtedness.
The challenges of the first quarter notwithstanding, the company reported a 420 bps increase in EBIDTA margin during the year under review.
The company strengthened its receivables cycle from 31 days of turnover equivalent in 2019-20 to 28 days in 2020-21.
The company repaid H49 crores of debt during the year under review, moderating its gross debt-equity ratio from 0.78 to 0.57 in 2020-21. The company reduced net debt by H157 crores during the year with a growing focus on enhancing cash flows.
The result is that the health of
the company’s business was considerably improved at the close of the year than when at the year-start despite the virtual loss of one quarter of operations. This indicates that the underlying trend of the company’s momentum is positive and profitable.
OutlookThe company expects to report peak revenues of H1600 crores in the next couple of years assuming complete capacity utilisation.
We believe that increased capacity utilisation will enhance capital efficiency. The company does not intend to engage in substantial capex for three years (a modest investment in capacity debottlenecking cannot be ruled out), preferring to allocate cash flows towards debt repayment.
We believe that larger revenues, lower debt and enhanced profitability will initiate the start of multi-year business sustainability that enhances value in the hands of our stakeholders.
Shobhan Mittal, Managing Director and CEO
The company focused on getting more out of less. YOLO attitude
(You only live once)
Delivery of credit to
consumers
Strong export volumes
Increased access to online
platforms
Record low interest rates
Enhanced product
availability
Fiscal incentives by various states
Enhanced systemic liquidity
Buoyant monsoons
High reservoir levels
Desire to live in better homes
(WFH)
Cost-effective product
financing
24 | Greenpanel Industries Limited Annual Report 2020-21 | 25
CORPORATE OVERVIEW STATUTORY STATEMENTS FINANCIAL STATEMENTS

Our principal de-risking
Governance: The bedrock of our de-risking platform
OverviewIn a VUCA world, the protection comes from governance.
At Greenpanel, governance is doing the right things more than doing things right because we are convinced that organizations consistently high on their ethical commitment can also be hugely successful.
This is the vision with which we were demerged into a new identity: not necessarily to be the largest in our space at any cost as much to be counted as one of the best; not as much to be a company driven by the quantity of our revenues as much a company driven by the quality of respect.
The following principles of our governance commitment enhance an understanding of our pedigree - what we are, where we come from and what we hold dear – and in doing so serve as our most effective de-risking strategy.
InstitutionAt Greenpanel, we intend to build our Company into an institution. We seek to bring to this objective a balance of strategic clarity, operational transparency, conservatism cum aggression, periodic investments, cutting-edge technologies, holistic stakeholder value-creation and a respect for health, safety and environment. We believe that the aggregate of these priorities is encapsulated in superior governance.
IntegrityAt Greenpanel, the one word that we placed at the centre of our business model is ‘credibilty’. We resolved that when our business
associates referred to us, they would with a sense of respect. We believe that if we consistently lived this ethic, it would be the glue that attracted a like-minded eco-system: longstanding customers, enduring employees and stable investors.
DisciplineAt Greenpanel, at one level we desired to be a company that stakeholders could take for granted on issues of ethics and uprightness. In this predictability would lie their own conduct: they would know how they would need to conduct themselves if they were to stay engaged with us. We are pleased that when we are discussed in public domain, one of
the first reactions we evoke is one associated with the highest ethical standard.
Doing things the right wayAt Greenpanel, this ethical respect is the result of life clarity: that we will continue to do the right things in the right way. Over the years, this commitment has manifested in various ways within; our gender respect, zero tolerance for sexual harassment, payment of statutory liabilities, commitment to recruit solely on the basis of merit, respect for the dignity of people and the integrity of the environment.
Long-termAt Greenpanel, we have invested in our business with the conviction
that the company will exist perpetually. This means that we plan for the long-term; we believe that whatever we do today will generate a multi-year influence. As an extension, our initiatives are not inspired by the prospect of fleeting arbitrage but by the long-term value we can generate in a sustainable way.
Singular focusAt Greenpanel, we believe that a narrow field of competence is possibly the biggest protection against industry shakeout. In view of this, we have consciously selected to focus on interior infrastructure; within this space we have selected to work on the element of owner’s pride (through durable and aesthetic products). The result is that within our peer group, our brand is that of a company that graduates customers from one level to another.
ScaleAt Greenpanel, we address a market with a large potential – partly because a large part of the market is yet to move towards pucca homes and organised furniture use while another part of the market will keep generating replacement demand. In view of this large potential we established scale – the third largest MDF manufacturing capacity in Asia - to capitalise on economies of raw material procurement, manufacturing, distribution and branding.
Health, safety and environmentAt Greenpanel, we invested in the highest standards of health, safety and environment integrity. This ensures that the Company’s operations are safe for employees, community and society.
Sustainability growthAt Greenpanel, we believe that business continuity is best derived from sustainable growth.
The company has consciously allocated accruals into business growth without stretching the Balance Sheet. We have remained a liquid and profitable company through various market cycles. The result is that we have charted out a schedule of phased net debt decline and improved efficiency of capital employed.
Board of DirectorsAt Greenpanel, we believe that the success of our strategic direction is largely influenced by our Board of Directors. We have placed a premium on our Board composition, comprising achievers of standing. These individuals have enriched our values, bandwidth, business understanding and strategic direction. The Board comprises a balanced proportion of Independent Directors, who can speak their mind and influence the Board.
Process-drivenAt Greenpanel, we believe that growth can be best derived when the promoter charts out a strategic direction, remains engaged in the business and delegates day-to-day management to professionals. The company deepened its investment in processes and systems. This framework – processes as well as IT foundation - represents a scalable foundation that will enable the company to grow profitably and without a significant increase in employees required to manage operations. As an extension, a framework of checks and balances provide effective de-risking to our growth appetite.
Audit and compliance-drivenAt Greenpanel, we believe that business predictability is derived from a strong review system. We strengthened an audit-driven and compliance-driven approach, enhancing the credibility of our reported numbers. When faced
with an accounting treatment that requires interpretation, we would rather take a conservative view. The result is that whatever we report in our books is a faithful indication of what actually exists.
TransparencyAt Greenpanel, we do not just think and do; we communicate faithfully as well. We hold our transparency commitment dear – whether it is in the form of honest appraisals with our people or how we communicate our financial performance with financial stakeholders every quarter or how we regularly engage with our stakeholders and customers regularly.
Fiscal comfortIn a business with growing potential, the temptation is to mobilise large debt, grow the business aggressively and engage in under-pricing with the objective to carve out a disproportionately large market share. However, we believe that large debt can distract us from the destination of sustainability that we aspire and extended receivables cycle can lead us into a debt trap, both realities we wish to avoid.
Stakeholder valueAnd lastly, we exist for the benefit of all stakeholders: the customer must experience enhanced competitiveness arising out of our business solution; the employee must derive pride, remuneration, career advancement and engagement stability; the investor must generate a superior return on employed capital over competing investment opportunities; the community must benefit from our presence; the government must benefit through taxes and livelihood creation; our vendors must benefit through the outsourcing of products and services.
26 | Greenpanel Industries Limited Annual Report 2020-21 | 27
CORPORATE OVERVIEW STATUTORY STATEMENTS FINANCIAL STATEMENTS

Our principal de-risking
Greenpanel: De-risking through a focus on the India growth story At Greenpanel, we believe the biggest de-risking of our business model is the robust India consumption story
By the virtue of a number of robust engines, India is likely to sustain its momentum as one of the fastest growing major economies driven by a growing consumption engine.
Economic growthIndia is positioned to emerge as a $5 trn economy in the Twenties adding nearly 70% to its GDP size across the foreseeable future. The sharp rebound in economic growth from the second quarter of the last financial year indicates that the Indian consumption engine is alive and well and likely to become even more pronounced over the years. The speed of economic accretion is likely to be progressively compressed into shorter time-frames, an unprecedented opportunity to scale our business.
Attractive social fundamentalsIndia’s average age of 29 makes it one of the youngest countries (lower than China, USA and the global average). More than two-thirds of India has been born after 1980. The younger a country the more active the spenders and the longer they are more economically active, a robust national growth engine for decades. India’s consumer story is likely to be shaped by its population of 426 million Gen Y born between 1981 and 1996 (34% of the total population) and 375 million GenZ born after 2000 (27% of the total population), larger than China’s population of the corresponding categories (Source: Business Insider and Outlook).
Vast under-consumptionIndia is a vastly under-consumed across a range of products when compared with the global average. When this under-consumption is corrected across the second largest global population (and possibly the largest global population of the under-consumed) it could translate into an unprecedented consumption platform.
Increase in incomes and aspirationsIn India we see a prudent balance of incomes and aspirations likely to sustain consumer spending into the long-term independent of global engagement, insulating Indian economic prospects. As a result, we see most of the new generation of India’s youth fall into the Urban Mass, driving the India consumption story. The ‘Urban Middle’ workforce portion of India’s total population at 2% represents a large head room. The country’s IT sector contributes around 15% of India’s private sector Urban Middle.
Lifestyle prioritiesIndia is likely to be driven by a complement of seven priorities – eating better, looking better, better home, mobility and connectivity, having more fun and luxury – according to Goldman Sachs. The ‘better home’ theme is likely to translate into increased offtake of home building products. There is a
possibility that India’s urban mass will graduate towards increased brand consumption in exchange for quality and value.
Atmanirbhar BharatThe Indian government’s commitment to encourage self-reliance is intended to develop Indian industry and reduce imports. In turn, we believe that this platform could deepen India’s industrialisation, strengthen incomes and widen the consumption play.
Urban real estate growthThe Indian real estate growth has underperformed its retrospective average in recent years. However, the Work From Home phenomenon has increased the priority of buying into bigger and better homes, kick-starting sectorial growth from the second quarter of the last financial year, which is expected to increase the offtake of interior infrastructure products.
Rural emergenceSustained growth of the agricultural sector and the universal reach of e-commerce has kickstarted a rural India consumption engine catalysed by growing aspirations for a better lifestyle standard. The result is that one of the largest global population clusters of the under-consumed is now becoming a more active economic entity across a range of products and services
Economic growth
Attractive social fundamentals
Vast under-consumption
Increase in incomes and aspirations
Lifestyle priorities
Atmanirbhar Bharat
Urban real estate growth
Rural emergence
28 | Greenpanel Industries Limited Annual Report 2020-21 | 29
CORPORATE OVERVIEW STATUTORY STATEMENTS FINANCIAL STATEMENTS

Strategic depth
Managing our eco-system of risks in a measured way
Overview
At Greenpanel, we believe that the key to sustainability lies in a comprehensive de-risking framework.Even as some risks cannot be predicted – the pandemic for instance – a robust risk management blueprint makes it possible to absorb such unforeseens with the lowest downside impact on the one hand and provide the quickest rebound when the scenario improves on the other.
This is what transpired during the year under review: even as the company reported a 57% decline in revenues during the first locked-down quarter, revenues revived 22%, 38% and 69% in the second, third and fourth quarters over the corresponding quarters of the previous year. The result is that the company reported a 20% growth in revenues during the financial year, derived from effectively a
little more than three quarters compared to the full four quarters of the previous financial year.
These numbers indicate a growing outperformance derived from a relative maturing of the company’s risk management framework. We believe that as the company scales its business, the risk management framework will become more effective, enhancing value in the hands of our stakeholders.
FrameworkOver the years, Greenpanel instituted a systematic risk management approach. This comprised the creation of a corporate direction by the promoters and the Board of Directors on the essentials of the business – the sectors of presence, the nature of products, the desired value-addition and investment in the brand.
At the next level, the company comprises a Risk Management Team that appraises ongoing sectorial and corporate shifts in
to suggest counter-initiatives. To keep the company’s decision making relevant to these changes, the company’s Risk Management Framework is periodically appraised and selectively modified.
Thereafter, risks are managed at the transaction level, extending the framework from the promoters to the Board to the senior management to individual employees. The result is that the responsibility of highlighting risks has been extended to every employee based on their capability while the responsibility to initiate counter-risk initiatives rests with the senior management and a focused Board committee.
At Greenpanel, this responsive and delegated framework makes it possible for the market-facing executive to escalate ground-level perspectives to the organisational apex with speed, resulting in responsive and sensitive decision-making.
Over the years, Greenpanel instituted a systematic risk management approach.
30 | Greenpanel Industries Limited Annual Report 2020-21 | 31
CORPORATE OVERVIEW STATUTORY STATEMENTS FINANCIAL STATEMENTS

The risks affecting our business and our counter-initiatives
Country risk A presence in the wrong country (India in this case)
Status quo risk There could be no change in people’s consumption pattern
Sector risk Presence in a sluggish segment of the country’s economy (interior infrastructure products in this case)
Impact This could make Greenpanel depend on other countries, increasing logistic and market development costs.
Counter-initiativeGreenpanel is largely present in India accounted for 88% of the company’s revenues in FY21). India is one of the most exciting countries for the products that we manufacture for the following reasons: projected economic growth, increased incomes cum aspirations, shift in lifestyles towards readymade furniture and extensive product under-consumption appearing to correct itself.
Impact Conventional materials could continue to be preferred, creating no opportunity for new concepts and products
Counter-initiative Greenpanel has selected to manufacture medium density fibre (MDF) and complementary products. MDF accounted for 78% of the company’s revenues FY21. We believe that MDF represents the new face of the sector on account of its environment-friendliness, convenience of fabrication and a growing OEM preference for us in furniture fabrication (circumventing fabrication inside one’s premises or the building’s landing)
Impact A mistiming or mis-presence could generate sub-optimal returns
Counter-initiativeGreenpanel has selected to be present in the interior infrastructure segment. The Company expects to ride two sweeping curves – one, the increased construction of real estate (commercial and residential) in the country and two, a growing sense of interiors pride that encourages individuals to spend more.
Portfolio risk The company’s products portfolio may be mismatched and mis-aggregated
Impact A sub-optimal portfolio could stunt cross-sale opportunity, moderate revenue accretion opportunity and affect the company’s brand
Counter-initiative The company created a portfolio comprising MDF, plywood, decorative veneers, flooring and doors. We believe that even as MDF represents the principal product, there is a considerable scope to grow the proportion of revenues from non-MDF products. The proportion of revenues from MDF are quite constant over the years with higher turnover, a trend that is likely to sustain moving ahead.
Location risk The company’s locations may prove to be a disadvantage
ImpactThe downstream consumers (institutional, unorganised and individual) are dispersed, putting a premium on the company to reach products to consumers pan-India.
Counter-initiativeThe company works out of two manufacturing locations – one in North India and the other in South India. These locations were selected on the basis of raw material access, demand potential, tax incentives, and logistical (road, rail and ports) proximity. In addition to servicing their respective zones, the factories address emerging demand from East, West and Central India. We believe that these plants will continue to be relevant, strengthening our access to markets on the one hand and enabling us to moderate costs on the other. A major portion of the Company’s revenues were from the Northern and Southern geographies where the Company’s manufacturing units are located.
Commoditisation risk The company’s products may be commoditised
ImpactThe commoditisation could affect revenue per unit of product sold, affecting margins
Counter-initiativeThe company intends to market a larger proportion of value-added products from within its portfolio mix. For instance, the proportion of revenues from Hi-Density Fibre boards, Club MDF, Exterior Grade MDF and Pre-Laminated MDF increased considerably over the years; the proportion of revenues from value-added veneers also increased from significantly over earlier periods.
32 | Greenpanel Industries Limited Annual Report 2020-21 | 33
CORPORATE OVERVIEW STATUTORY STATEMENTS FINANCIAL STATEMENTS
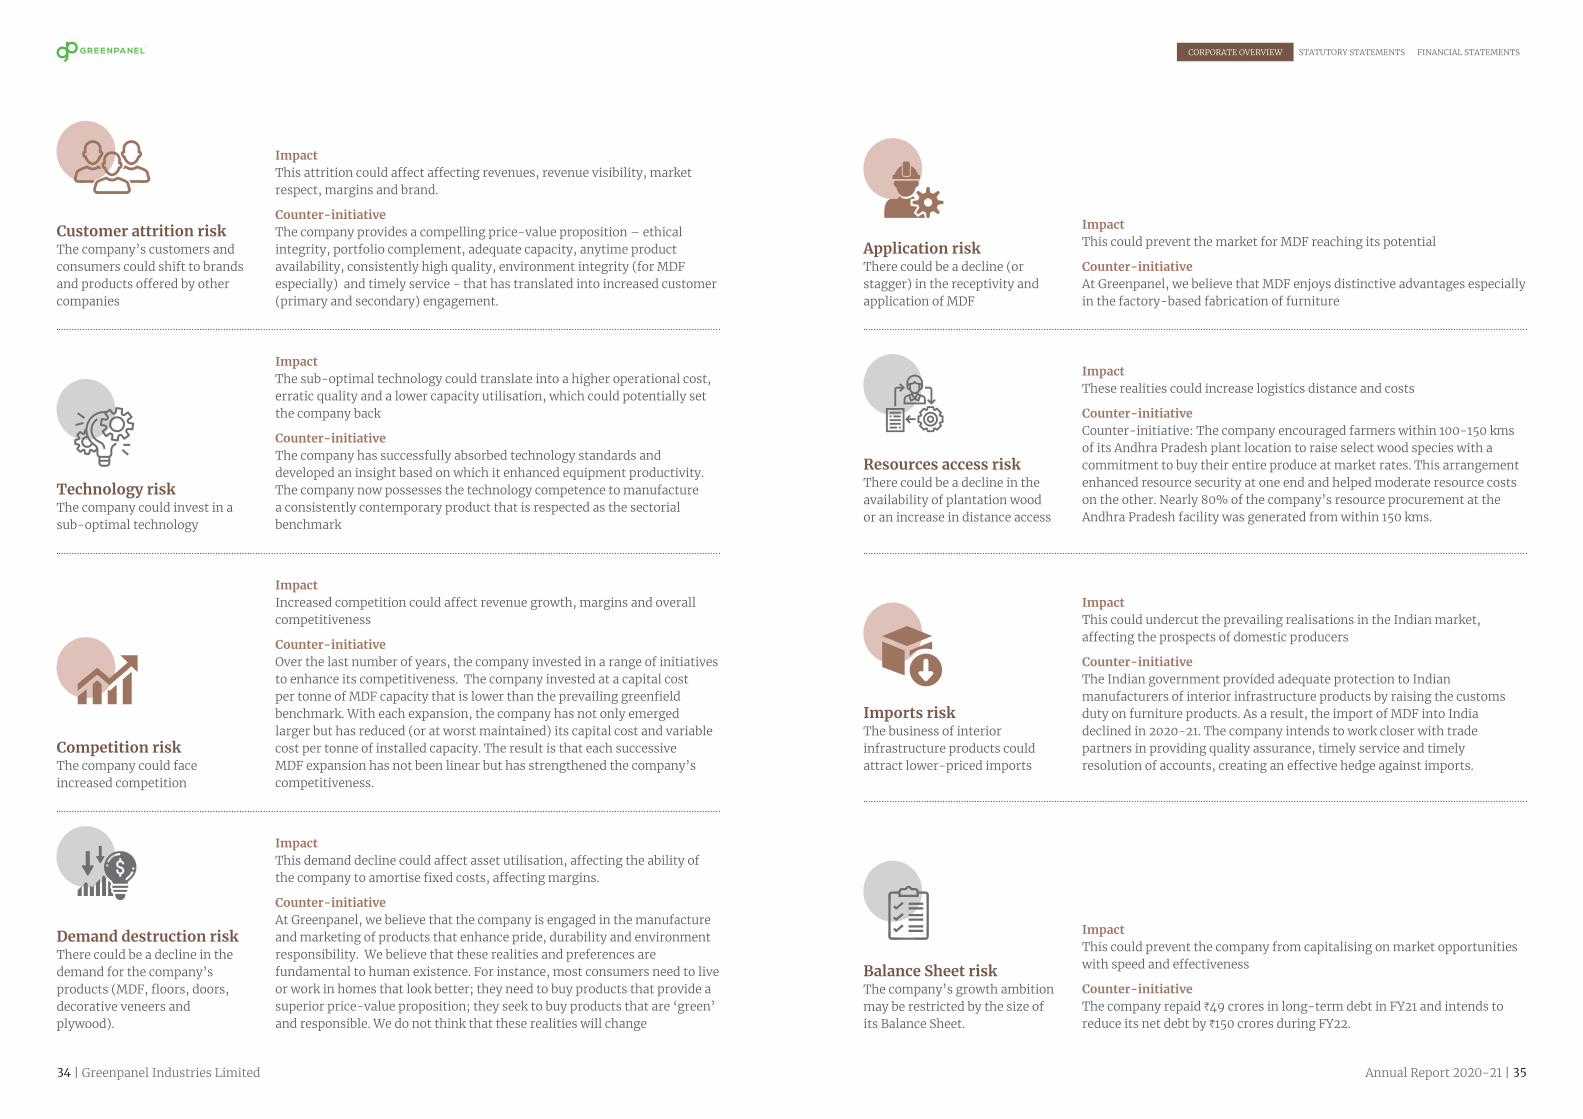
Customer attrition risk The company’s customers and consumers could shift to brands and products offered by other companies
Competition risk The company could face increased competition
ImpactThis attrition could affect affecting revenues, revenue visibility, market respect, margins and brand.
Counter-initiativeThe company provides a compelling price-value proposition – ethical integrity, portfolio complement, adequate capacity, anytime product availability, consistently high quality, environment integrity (for MDF especially) and timely service - that has translated into increased customer (primary and secondary) engagement.
ImpactIncreased competition could affect revenue growth, margins and overall competitiveness
Counter-initiativeOver the last number of years, the company invested in a range of initiatives to enhance its competitiveness. The company invested at a capital cost per tonne of MDF capacity that is lower than the prevailing greenfield benchmark. With each expansion, the company has not only emerged larger but has reduced (or at worst maintained) its capital cost and variable cost per tonne of installed capacity. The result is that each successive MDF expansion has not been linear but has strengthened the company’s competitiveness.
ImpactThe sub-optimal technology could translate into a higher operational cost, erratic quality and a lower capacity utilisation, which could potentially set the company back
Counter-initiativeThe company has successfully absorbed technology standards and developed an insight based on which it enhanced equipment productivity. The company now possesses the technology competence to manufacture a consistently contemporary product that is respected as the sectorial benchmark
ImpactThese realities could increase logistics distance and costs
Counter-initiativeCounter-initiative: The company encouraged farmers within 100-150 kms of its Andhra Pradesh plant location to raise select wood species with a commitment to buy their entire produce at market rates. This arrangement enhanced resource security at one end and helped moderate resource costs on the other. Nearly 80% of the company’s resource procurement at the Andhra Pradesh facility was generated from within 150 kms.
ImpactThis could prevent the company from capitalising on market opportunities with speed and effectiveness
Counter-initiativeThe company repaid H49 crores in long-term debt in FY21 and intends to reduce its net debt by H150 crores during FY22.
ImpactThis demand decline could affect asset utilisation, affecting the ability of the company to amortise fixed costs, affecting margins.
Counter-initiativeAt Greenpanel, we believe that the company is engaged in the manufacture and marketing of products that enhance pride, durability and environment responsibility. We believe that these realities and preferences are fundamental to human existence. For instance, most consumers need to live or work in homes that look better; they need to buy products that provide a superior price-value proposition; they seek to buy products that are ‘green’ and responsible. We do not think that these realities will change
Application riskThere could be a decline (or stagger) in the receptivity and application of MDF
ImpactThis could prevent the market for MDF reaching its potential
Counter-initiativeAt Greenpanel, we believe that MDF enjoys distinctive advantages especially in the factory-based fabrication of furniture
Imports risk The business of interior infrastructure products could attract lower-priced imports
ImpactThis could undercut the prevailing realisations in the Indian market, affecting the prospects of domestic producers
Counter-initiativeThe Indian government provided adequate protection to Indian manufacturers of interior infrastructure products by raising the customs duty on furniture products. As a result, the import of MDF into India declined in 2020-21. The company intends to work closer with trade partners in providing quality assurance, timely service and timely resolution of accounts, creating an effective hedge against imports.
Technology risk The company could invest in a sub-optimal technology
Resources access riskThere could be a decline in the availability of plantation wood or an increase in distance access
Balance Sheet riskThe company’s growth ambition may be restricted by the size of its Balance Sheet.
Demand destruction risk There could be a decline in the demand for the company’s products (MDF, floors, doors, decorative veneers and plywood).
34 | Greenpanel Industries Limited Annual Report 2020-21 | 35
CORPORATE OVERVIEW STATUTORY STATEMENTS FINANCIAL STATEMENTS

Operating leverage risk The company’s growth headroom could be limited
Water resource risk The business warrants a large quantum of raw water
Receivables risk The company’s financial hygiene could be compromised by a longer credit cycle
ImpactThis could result in the need for significant capital expenditure, straining the Balance Sheet.
Counter-initiativeThe company’s gearing of 0.57 as on March 31, 2021 is expected to strengthen, widening borrowing room should the company select to exercise that option. The company had borrowed only close to 18% of its sanctioned working capital for its Indian operations as on March 31, 2021.
ImpactThis could potentially affect raw water availability for non-commercial users in the neighbourhood
Counter-initiativeThe company initiated rainwater harvesting tanks (ponds) to collect the runoff generated at site. The collected rainwater is reused for various purposes. The total rain water harvesting capacity of system is 80,000 Cum. In the FY2019-20, the constructed a new pond of capacity 50000 cum, enhancing rain water storage pond capacity to 130,000 Cum.
ImpactThis reality could moderate cash flows, increase interest outflow and weaken the Balance Sheet
Counter-initiativeThe company consciously focused on credible sales within a prudent receivables cycle, selecting to do good business over any business. The result is that the company reported a blended (across products) receivables cycle of 28 days of turnover equivalent during the last financial year with a negligible proportion of bad debt
ImpactThis could impact the confidence of investors (institutional and individual)
Counter-initiativeThe company’s promoters owned a 53.1% stake in the company as on March 31, 2021. Besides, all the shares belonging to the promoter were unencumbered and not pledged to any external lender as on March 31, 2021. The promoter had no other business interest except Greenpanel, ensuring complete involvement.
ImpactThere is a larger preference for MDF over plywood in the global markets (80-20) as opposed to India where the preference is just the reverse. Besides, demand has been muted on account of a low do -it-yourself mindset among users.
Counter-initiativeThe company is engaged in enhancing awareness of the utility and price-value proposition of MDF over cheaper plywood, a trend that is gaining traction.
ImpactLow experience could affect the company’s ability to negotiate market cycles
Counter-initiativeThe company has been drawn from the House of Greenply, one of the largest and most respected wood panel players in India with a distinctive track record in the innovation and launch of differentiated products and features. The result is that the company has been engaged in the launch of new generation solutions in wood paneling and surface enhancement
Ownership risk The company’s growth could be limited by a low promoter stake in the company’s equity or the promoter’s equity holding being pledged to lenders.
Awareness risk The industry suffers from low awareness related to the utility of MDF
Experience risk The business warrants multi-year experience
36 | Greenpanel Industries Limited Annual Report 2020-21 | 37
CORPORATE OVERVIEW STATUTORY STATEMENTS FINANCIAL STATEMENTS

Greenpanel has de-risked itself by being relevant to evolving consumer needs
1 2 3 4
The consumer’s biggest requirements A need to moderate cost
A need to enhance furniture integrity
A need to enhance surface aesthetics
A need to utilise products that are environmentally responsible
Greenpanel’s consumer proposition MDF is an environment-friendly product
The product utilises a low ratio of wood compared to plywood
The product makes it possible to build the most amount of furniture by using the least amount of wood
Consumers have less time to monitor furniture fabrication There is a premium on time – with people working
from their homes or in the external environment
A number of them feel that it is easier to buy completed furniture than fabricate from scratch
Nowhere is this more evident than in the renovation of kitchens where downtime can pose a large family inconvenience
Greenpanel’s consumer proposition Greenpanel has developed MDF products
compatible with the need for modular kitchens
Greenpanel is responding to the need for products with superior functional characteristics
Greenpanel works closely with trade influencers (carpenters) to enhance their MDF use efficiency
Consumers have a wider furniture design range to select from A larger number of customers are researching
interior designs on the net
There is a wider choice available across a number of sites and pages
The access to these design repositories is free, creating an effective demand driver
Greenpanel’s consumer proposition Greenpanel invested in the largest MDF
manufacturing capacity in India
MDF is used as a building block for furniture by OEMs
Its products are ideal for automated factory-fabricated furniture
Factory-fabricated furniture is respected for dimensional accuracy, competitive cost of manufacture and the ability to deliver a high aesthetic value
Consumers are seeking a comprehensive interiors solution Consumers do not just buy one product during
home or office renovation
Consumers seek to buy a complement of products from the same brand
Greenpanel’s consumer proposition Greenpanel has developed a portfolio of products
The portfolio comprises MDF (building block), floors, plywood, doors and decorative veneers
In doing so, Greenpanel has accounted for a larger share of the consumer’s wallet
38 | Greenpanel Industries Limited Annual Report 2020-21 | 39
CORPORATE OVERVIEW STATUTORY STATEMENTS FINANCIAL STATEMENTS
Our company Habufa is a prominent Dutch company that specialises
in the marketing of world-class furniture benchmarked around EU standards, which comprise among the most demanding standards in the world.
Our objective is to engage with like-minded base material providers who are completely aligned around the highest standards of product integrity.
I am happy to say that Greenpanel complies with our exacting procurement standards. When we encountered some additional requirements, the Greenpanel team – shopfloor and corporate office – responded with speed to rework their product completely in line with our requirements.
There was one other critical
factory that made it imperative for us to shift from the traditional use of chip board to medium density fibre. In the western markets, there is a stipulation that furniture up to 80 kgs can be carried by only two people; anything in excess of that weight needs to be carried by four persons, enhancing additional people deployment and related costs. Besides, MDF was less expensive than plywood and with a smoother surface, enhancing preference.
Greenpanel collaborated with us to manufacture a MDF variety that would enable the end furniture to be well within the weight requirements without any quality compromise. This provided us with the basis to extend from the use of chip board to MDF; the switch proved a bit expensive but the additional benefits more than
compensated for the cost increase.
The result of Greenpanel’s responsiveness was reflected in the volume of business that we generated between our companies: what we achieved within the space of a year was the equivalent of what is normally achieved in a number of years.
Ambarish DagaAssistant to the Board of Directors, Habufa b.v.
“What Greenpanel achieved within the space of a year with us was the equivalent of what is normally achieved in a number of years”
“We used to buy much of our MDF from another vendor; in the last couple of years we shifted to Greenpanel”
Our company is a 100% exports company engaged in the export of furniture
(and other products) for 40 years. We believe that India is perched at the cusp of an attractive global opportunity: a number of global buyers seek to de-risk their business away from China. During the last few months, India has been able to successfully carve away a number of international orders away from China and Vietnam, indicating the country’s enhanced competitiveness. We believe that a world of an opportunity lies ahead of Indian furniture fabrication companies: we account for only 4% of the global furniture market and the time has come to enhance this proportion to 12% by 2022.
To respond to this opportunity with speed, skill and sensitivity, a company like CL Gupta Exports
has deepened relationships with trusted vendors. Greenpanel is one of them. During the last couple of years that our company has been engaged with Greenpanel, we have procured large quantities of MDF in varying thicknesses to manufacture engineered wood of a consistently high standard.
What has helped grow our relationship with Greenpanel has been its global certifications: they have helped open doors to some of the most prestigious global brands (especially Ashley Furniture). Besides, Greenpanel provides batchwise records, has validated its quality in laboratory tests as per high quality standards, has been able to customise MDF as per our needs and delivered the product with speed. We used to buy much of our MDF from another vendor; in the last couple of years we
shifted to Greenpanel.
We believe that MDF enjoys a good future for its advantage over solid wood for reasons of strength and water resistance: its use in our resource mix has increased from around 10% a few years ago to 45% today.
Sunil SisodiyaGeneral Manager, Furniture business, CL Gupta Exports Ltd
40 | Greenpanel Industries Limited Annual Report 2020-21 | 41
CORPORATE OVERVIEW STATUTORY STATEMENTS FINANCIAL STATEMENTS

Value creation
ways in which we intend to enhance shareholder value
10Our value-enhancement strategy
Higher volumes
Large capacity
Stronger amortisation
Relatively low capital cost / MT
Superior margins
Increased capacity utilisation
Stronger reinvestment in capacity
Enhanced Increased customer confidence
Portfolio focus
FY19
25
FY20
26
FY21
221
% of revenues derived from non-
MDF products
Initiative
The company is largely focused on the manufacture of MDF and variants; what used to be a standalone product is gradually becoming a multi-product portfolio.
Benefits
This is helping broadbase the company’s products pyramid on the one hand and enhance cross-sale opportunities on the other.
Asset utilization
FY19
3.2
FY20
1.2
FY21
5.52
Return on Gross Block (%)
Initiative
The company possesses a credible track record in maximizing the utilisation of invested assets through investments in balancing equipment and de-bottlenecking
Benefits
The company has generally reported a high Return on Gross Block across the years. Besides, increased asset utilisation will translate into RoCE-accretive growth.
Gearing
FY19
4.02
FY20
2.88
FY21
5.893
Interest cover (x)
Initiative
The company has drawn out an aggressive debt (long-term) repayment schedule.
Benefits
This will enable the company to become debt-free by 2023, strengthening interest cover and credit rating.
Debt cost
FY19
4.64
FY20
8.50
FY21
7.164
Average cost of debt (%)
Initiative
The company will leverage its improving gearing to negotiate a progressively lower cost of working capital mobilised from banks.
Benefits
A probable decline in the cost funds will enhance margins, cash flows and credit rating (a virtuous cycle).
42 | Greenpanel Industries Limited Annual Report 2020-21 | 43
CORPORATE OVERVIEW STATUTORY STATEMENTS FINANCIAL STATEMENTS
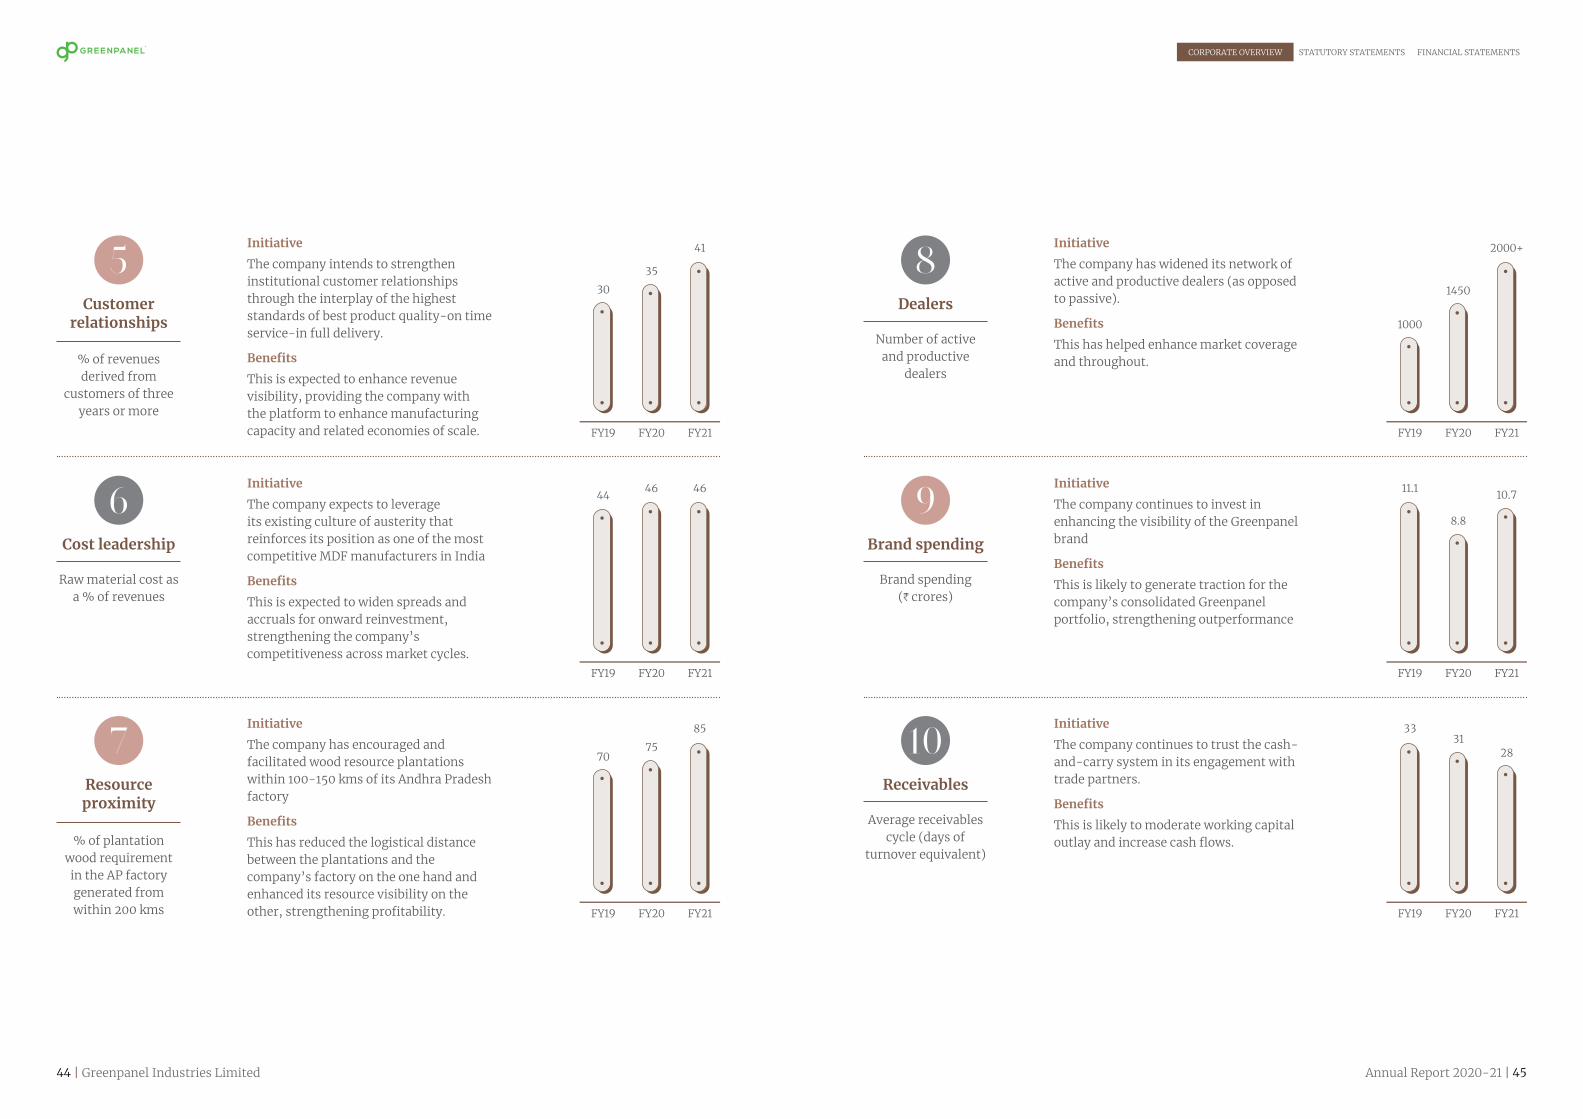
Customer relationships
FY19
30
FY20
35
FY21
415
% of revenues derived from
customers of three years or more
Initiative
The company intends to strengthen institutional customer relationships through the interplay of the highest standards of best product quality-on time service-in full delivery.
Benefits
This is expected to enhance revenue visibility, providing the company with the platform to enhance manufacturing capacity and related economies of scale.
Cost leadership
FY19
44
FY20
46
FY21
46 6
Raw material cost as a % of revenues
Initiative
The company expects to leverage its existing culture of austerity that reinforces its position as one of the most competitive MDF manufacturers in India
Benefits
This is expected to widen spreads and accruals for onward reinvestment, strengthening the company’s competitiveness across market cycles.
Resource proximity
FY19
70
FY20
75
FY21
857
% of plantation wood requirement in the AP factory generated from within 200 kms
Initiative
The company has encouraged and facilitated wood resource plantations within 100-150 kms of its Andhra Pradesh factory
Benefits
This has reduced the logistical distance between the plantations and the company’s factory on the one hand and enhanced its resource visibility on the other, strengthening profitability.
Dealers
FY19
1000
FY20
1450
FY21
2000+8
Number of active and productive
dealers
Initiative
The company has widened its network of active and productive dealers (as opposed to passive).
Benefits
This has helped enhance market coverage and throughout.
Brand spending
FY19
11.1
FY20
8.8
FY21
10.7 9
Brand spending (H crores)
Initiative
The company continues to invest in enhancing the visibility of the Greenpanel brand
Benefits
This is likely to generate traction for the company’s consolidated Greenpanel portfolio, strengthening outperformance
Receivables
FY19
33
FY20
31
FY21
2810
Average receivables cycle (days of
turnover equivalent)
Initiative
The company continues to trust the cash-and-carry system in its engagement with trade partners.
Benefits
This is likely to moderate working capital outlay and increase cash flows.
44 | Greenpanel Industries Limited Annual Report 2020-21 | 45
CORPORATE OVERVIEW STATUTORY STATEMENTS FINANCIAL STATEMENTS

Broad basing through a robust product mix
1000
20
H crores revenues, 2020-21
per cent growth over
2019-20
An analysis of how we addressed the challenges of a volatile 2020-21
Key challenges, 2020-21By the virtue of being a new brand, there was a need to be proactive and aggressive in enhancing reach and awareness, a momentum that was interrupted by the Covid-19 pandemic
The Covid-19 onset affected the trade-led business, channel marketing, retail branding and engagement; below the line and point of sale initiatives were impacted.
Counter-challenge initiatives, 2020-21A decline in brand communication options enhanced focus and innovation
The ‘Work-from-Home’ option empowered the company to enhance its digitalisation marketing focus on the social media and the mobile phone with trade and trade influencers coupled with frequent social
media campaigns (organic and inorganic). Following the lock-down, the social media campaign and mobile communication were sustained. The company launched Digital literature (e-brochure) to enhance product awareness in addition to social media campaigns (21-day Fitness Challenge using furniture, WFH furniture décor, product led entertaining posts and Covid-19 Care posters)
Achievements, 2020-21The company leveraged its understanding of ‘touchless’ digital marketing platform, empathy and judicious resource use
The company reported an improvement in brand acceptance during the challenging first quarter, which empowered it to build upon in the second quarter.
As the lockdown was gradually lifted, the company strengthened
its pan-India retail branding and Covid-19 care merchandise (on the counter protective frames for dealers, masks for carpenters/ contactors and field sales team as well as merchandise for trade partners).
The company reinforced extensive retail branding with advertising in trade magazines and a responsive website to enhance visibility
OutlookThe company intends to enhance its trade engagement through focussed activity (retail branding, fresh literature, point of sale visibility, trade merchandise and planned meets. The company intends to utilise the power of mobile and digital platform to enhance reach and brand salience, building better synergies with branches to customise region-specific marketing solutions
Opinions“The amount of time all of us have been spending at home is really reflecting on how we have begun to see the needs at home. That has had an impact in terms of the interest in home furnishing and what consumers have done in the last nine months. In most Indian homes having a study room or a study table was a nice-to-have feature. Now, it may be a necessity. A lot of allied areas are seeing interest. We can clearly see a big increase in the cooking and eating-related range, apart from organizing and storing related goods.” Kavitha Rao, country commercial manager, Ikea India, Business Standard
“Local sourcing is a very big initiative for us. Two areas where we are trying to make a difference…is solid wood-based furniture and board-based material.” Kavitha Rao, country commercial manager, Ikea India
“From a qualitative point of view, India today is contributing a lot to us. Being in India is helping us fine-tune the business model….We are currently doing sourcing of more than 300 million Euros. This will double and double and double as we keep opening stores in India. We will have stores in Hyderabad, Mumbai, Delhi NCR and Karnataka in the first phase
and expand with more stores in these four cities. Then we will go to more states with stores in Chennai, Ahmedabad, Surat, Pune, Kolkata and Kerala. From there, we will go to other places.” IKEA India’s chief executive officer (CEO) Juvencio Maeztu
“India is a great destination and a great source of investment opportunity. People are adapting, moving forward the underlying trends I would say are a very young demographic, a growing consumerism and consumption that I think would be powering a lot of growth.” Kewsong Lee, CEO, The Carlyle Group, The Economic Times: 26.11.2020
46 | Greenpanel Industries Limited Annual Report 2020-21 | 47
CORPORATE OVERVIEW STATUTORY STATEMENTS FINANCIAL STATEMENTS

Our portfolio mix
MDFPLYWOOD
DECORATIVE VENEERS
WOOD FLOORS DOORS
Industrial grade Club
Exterior grade BWP
Club GradeMR
E1/E0.5/ Carb P02
Grade
Gold
Pre-laminated
Acurate
VeneeredG Pro
Naturemax
Spectrumwood
Natural Teak
Black Forest
Royale
Prima Collection (AC3/AC4)
Flush doors
Persona Collection (AC4/AC5)
Commercial doors
48 | Greenpanel Industries Limited Annual Report 2020-21 | 49
CORPORATE OVERVIEW STATUTORY STATEMENTS FINANCIAL STATEMENTS

Club: Greenpanel club plywood is a high-density, premium-grade structural plywood that can handle heavier loads. It is CE-certified and emission-free as per E1 standard. Greenpanel club plywood comes with lifetime guarantee. Greenpanel club plywood is perfect for applications like stretched skin panels and plywood web beams.
BWP: With a density of 0.50 gm/cc, Greenpanel BWP Grade blockboard offers great structural stability and strength along with excellent screw-holding capacity. It is boiling water-proof and eco-friendly. Greenboard BWP
Grade blockboard is perfect for wood panel partitions, cupboards, shelves, and shutters. It is often also used for load bearing and horizontal panel applications.
MR: Greenpanel MR grade plywood is superior-quality plywood that conforms to IS 303. It is resistant to moisture, termites and borer. MR grade plywood is suitable for all interior applications where durability and economy are equally important. Greenpanel MR grade plywood is ideal for panel inserts in panel doors, partitions, paneling, cabins, and false ceilings.
G Pro: G Pro is the fully loaded ply, sourced from specially selected eco-friendly timber. G Pro is borer proof and termite-resistant with lesser susceptibility to weather variance. Best suited for residential and commercial places. Made from selected species, G Pro plywood and block boards are the best choice for many when they think of doing their interiors. This is because, along with being weather-proof, these boards are anti-fungal and borer resistant too, making it ideal for application in residential & commercial places.
Naturemax: These veneers are made from exclusively hand-picked wood species from some of the most exotic forests from all over the world. Elegant and abstract in design these veneers are sure to lend a touch of class to your interiors and make them an object of envy for anyone and everyone.
Spectrum wood: Greenpanel spectrum wood veneer combines a natural timber base and aesthetic
designs. It comes with a fleece backing and is flexible enough to adapt to curved furniture.
Natural Teak: Greenpanel teak veneer is made from 100% Burma teak, with the natural marks in wood enhanced for the perfect finish. Greenpanel teak veneer is available in thicknesses from 4mm to 19mm.
Black Forest: Greenpanel veneer offers an exclusive range of unique and exotic designs. Each
veneer is assembled and designed to enhance its natural beauty. The veneer face is imported from Europe and Burma. The main features of Greenpanel veneer are joint-less decorative sheets, no undulation after polishing because of defect-free smooth surface base ply, no gap or overlap of decorative veneer in surface layer, and no chip-off on cutting.
Flush doors: Flush doors are simple door designs that have plain facings on both sides. They can be interior (more commonly) but also exterior. They are often used where space is at a premium and would probably be placed towards the ‘functional’ end of the door design spectrum rather than
the ‘style’ end but as with anything a little imagination goes a long way. They may be kept deliberately simple in appearance to highlight other features nearby. Flush doors are applied in making fire, acoustic and X-ray doors.
Commercial doors: Greenpanel
Commercial Doors are especially designed for enhanced strength and security. They can be customised to add visions, louvers, special hinges, locks and rails. Provisions can also be made for double-leaf doors of equal or unequal shutter sizes.
PLYWOOD
DECORATIVE VENEERS
Industrial grade: Medite or industrial MDF is a ground- breaking construction material. With the acetylated wood fibre combining with manufacturing technology of industrial MDF, the product may now be used in and applications where normal MDF panels cannot. The thickness of this MDF ranges from 4 mm to 25 mm.
Exterior grade: Greenpanel Exterior Grade MDF Boards are engineered for greater density and strength. They offer uniform thickness and a homogenous structure. They are resistant to moisture (MR), termite, borer and fungus. They are also eco-friendly and register very low formaldehyde emission levels. It is ideal for water prone and humid conditions, Greenpanel Exterior Grade MDF Boards are the perfect branded solution for semi-outdoor and outdoor furniture like garden tables and balcony chairs. With a thickness of 3.6 mm to 35 mm, the exterior grade MDF is available in various sizes.
Club Grade HDF: Greenpanel club grade HDF board is the perfect
substitute for plywood and the first priority for applications in moisture prone areas like kitchen and bathrooms. Made from high density fibre, these boards are anti-fungal and also borer resistant, making this brand the first priority for customers when it comes to interior designing for residential houses. These boards are eco-friendly and versatile in their applicability. Plus ease of application and high resistance to natural threats make these an ideal choice for any establishment.
E1/E0.5/ Carb P02 Grade: E1 MDF is eco-friendly. It is produced using technology and resins that keep formaldehyde emissions well within the safe limit. E1 MDF is strong and offers dimensional stability.
CARB is short for California Air Resources Board—it certifies wood products that emit negligible formaldehyde gas, making them the safest option for kitchens, wardrobes, and home furniture. Greenpanel CARB MDF is available on request.
Pre-laminated: Greenpanel Pre-laminated MDF is moisture-
resistant, scratch-free and extremely easy to maintain. It is also beautiful and varied, with 43 contemporary designs and colours and two distinct finishes (suede and matte) to choose from. Available in grade I (exterior MDF); grade II (interior MDF); one-side laminated; both-side laminated; one-side bare; both-side balancing variants. Greenpanel pre-laminated MDF is especially suited for areas where dimensional stability is of key importance. Like kitchen cupboards and bathroom cabinets. The thickness of the wood ranges from 5.5 mm to 35 mm, with the exterior-grade pre-laminated MDF available in custom thickness. The size of this MDF measures at 2.44 mmx122mm, with a few designs available in 2.44 mmx1.83 mm.
Veneered: It is made from quality wood veneers that are attached to premium fibreboards of average densities. Today, veneered MDF is the ideal substitute for solid wood. Customers who are looking for beauty and quality in wood finish usually go for this option as it rarely disappoints.
Prima Collection (AC3/AC4): The prima range is tailor made for new age residential living. This range spells class and luxury. The wooden floors give a feeling of cleanliness, modernity
and expanse that adds a feel of grandeur.
Persona Collection (AC4/AC5): These super premium wood floors are handpicked and characterised by an extraordinary finish. Each
wooden tile is equal to 2-3 slim tiles, interspersed with grains and crown which embrace nature. Breathe life into modern condos and commercial spaces with the Persona Collection.
MDF
WOOD FLOORS
DOORS
50 | Greenpanel Industries Limited Annual Report 2020-21 | 51
CORPORATE OVERVIEW STATUTORY STATEMENTS FINANCIAL STATEMENTS
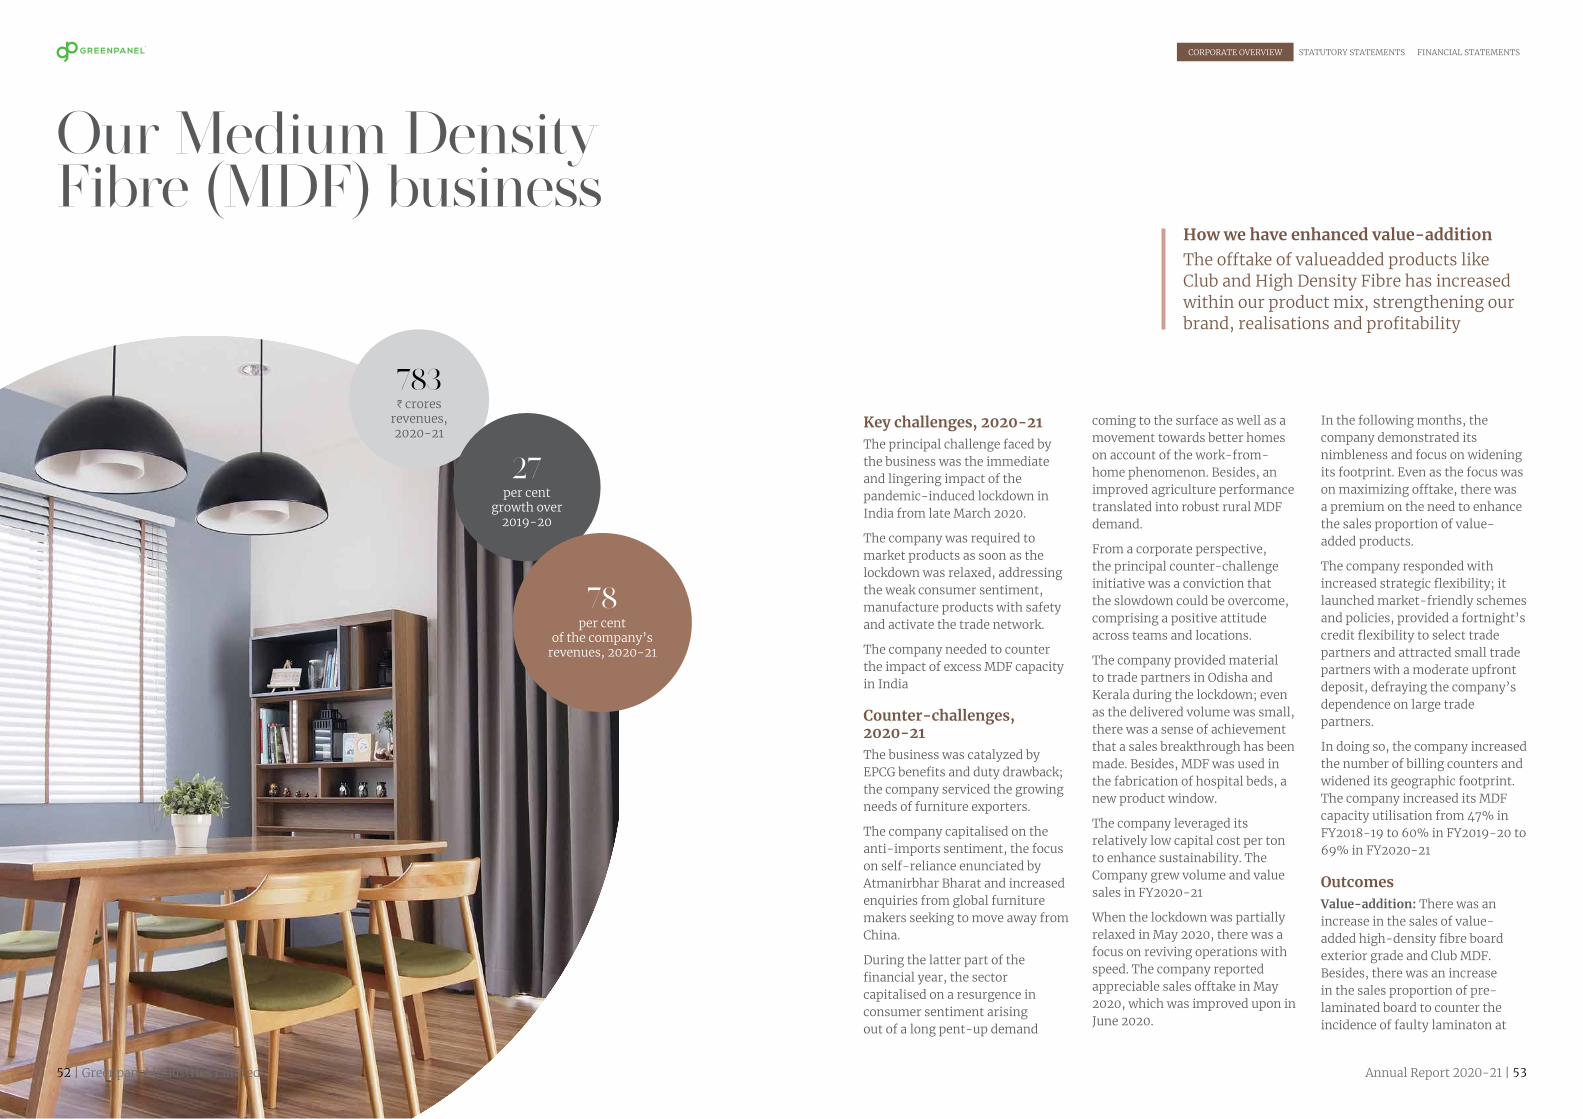
Our Medium Density Fibre (MDF) business
Key challenges, 2020-21The principal challenge faced by the business was the immediate and lingering impact of the pandemic-induced lockdown in India from late March 2020.
The company was required to market products as soon as the lockdown was relaxed, addressing the weak consumer sentiment, manufacture products with safety and activate the trade network.
The company needed to counter the impact of excess MDF capacity in India
Counter-challenges, 2020-21The business was catalyzed by EPCG benefits and duty drawback; the company serviced the growing needs of furniture exporters.
The company capitalised on the anti-imports sentiment, the focus on self-reliance enunciated by Atmanirbhar Bharat and increased enquiries from global furniture makers seeking to move away from China.
During the latter part of the financial year, the sector capitalised on a resurgence in consumer sentiment arising out of a long pent-up demand
coming to the surface as well as a movement towards better homes on account of the work-from-home phenomenon. Besides, an improved agriculture performance translated into robust rural MDF demand.
From a corporate perspective, the principal counter-challenge initiative was a conviction that the slowdown could be overcome, comprising a positive attitude across teams and locations.
The company provided material to trade partners in Odisha and Kerala during the lockdown; even as the delivered volume was small, there was a sense of achievement that a sales breakthrough has been made. Besides, MDF was used in the fabrication of hospital beds, a new product window.
The company leveraged its relatively low capital cost per ton to enhance sustainability. The Company grew volume and value sales in FY2020-21
When the lockdown was partially relaxed in May 2020, there was a focus on reviving operations with speed. The company reported appreciable sales offtake in May 2020, which was improved upon in June 2020.
In the following months, the company demonstrated its nimbleness and focus on widening its footprint. Even as the focus was on maximizing offtake, there was a premium on the need to enhance the sales proportion of value-added products.
The company responded with increased strategic flexibility; it launched market-friendly schemes and policies, provided a fortnight’s credit flexibility to select trade partners and attracted small trade partners with a moderate upfront deposit, defraying the company’s dependence on large trade partners.
In doing so, the company increased the number of billing counters and widened its geographic footprint. The company increased its MDF capacity utilisation from 47% in FY2018-19 to 60% in FY2019-20 to 69% in FY2020-21
OutcomesValue-addition: There was an increase in the sales of value-added high-density fibre board exterior grade and Club MDF. Besides, there was an increase in the sales proportion of pre-laminated board to counter the incidence of faulty laminaton at
How we have enhanced value-additionThe offtake of valueadded products like Club and High Density Fibre has increased within our product mix, strengthening our brand, realisations and profitability
783 H crores
revenues, 2020-21
27per cent
growth over 2019-20
78per cent
of the company’s revenues, 2020-21
52 | Greenpanel Industries Limited Annual Report 2020-21 | 53
CORPORATE OVERVIEW STATUTORY STATEMENTS FINANCIAL STATEMENTS

Why MDF is a preferred furniture fabrication resource Increased resource availabilityThe resource for MDF is now being increasingly grown on commercial plantations, enhancing quality and availability
Environment-friendlyThe product is classified as ‘green’, enhancing its preference by prominent OEM brands
EdgeThe product is as good as plywood and conclusively better than cheaper plywood
Resilient and durableThe product is treated against borer and termites, which enhances its resilience and durability
Product robustnessThe product does not comprise any internal hollowness; its denseness, absence of air grain consistency has enhanced its preference
Superior price-valueThe product has been accepted as durable, strengthening its price-value proposition
Easy on vendorsThe product can be easily painted upon by carpenters who find the exercise less cumbersome and also consume 50% less paint
Attractive savingThe product provides a 40% upfront saving and a 70% total saving, enhancing its price-value proposition
Consumer friendlyThe product fits into the classic Indian consumer’s ‘sasta-sundar-tikaaoo’ (economical, aesthetic, enduring) proposition
DurabilityMedium Density Fibre Board is engineered wood manufactured with hardwood wood fibres bonded by synthetic resin adhesives under heat and pressure - interior building material enjoying high and consistent density
SuitabilityMDF’s strength and stability make it preferred for interior infrastructure applications like building and construction, residential and office furniture, wall panelling, modular kitchens, doors and wood floors. Greenpanel MDF is easier to rout, carve and finish. This makes it perfect for use in contemporary furniture.
Functional advantageMDF is dense and stiff – with no
knots, which makes it machinable. The fine and uniform particles enhance dimensional stability without a predominant grain. Since the product is industrially manufactured under the standards of quality, it contains no voids and possesses sharp edges with no tear outs.
MDF attributesUltra-light MDF plate is best applied for applications. Typically green MDF is ideal for moisture-rich geographies as the product is moisture-resistant. Typically red or blue MDF is fire-retardant. Also, given the fact that most consumers will be moving towards ready-made furniture in the future, MDF will have increased prospects as a choice of raw material because of its efficiency and lower price.
Advantage over particle boardMDF is denser than particle board. It is stronger, more durable and with no gaps or voids that could enhance swelling. The result is that if you buy expensive furniture made from MDF there is a high likelihood that it will last for years; when made with particle board, you may be enthused by the fact that it costs less to begin with but over just a few years, you will recognise your error when you need to replace the furniture. The message that is becoming increasingly apparent: when you need performance, you turn to MDF.
the carpenter’s end. In view of this, the sales proportion of plain MDF declined over the years, an index of the growing consumer maturity.
Domestic focus: The company replaced its erstwhile exports presence with enhanced domestic offtake, especially increased demand coming out of South India. The company maximised cross-sale between MDF and flooring, which enhanced people productivity (achieving more with less) and throughput.
Systemic productivity: The company reported an increase in value per transaction; correspondingly, branch expense as a percentage of turnover declined to around 5% and within a quarter of the lockdown (September 2020), the company reported a record month for domestic sales, followed by another sales peak the following month. The company reported successive month-on-month stock outs, liquidating inventory. There was a decline in discounts, enhancing realisations.
OutlookMDF is extensively popular in a number of countries where the majority of the consumption is slanted towards MDF and a nominal proportion towards plywood. This is the reverse in India for historical reasons of product supply. Over time, we believe that the consumption transition will accelerate, widening the market for a company like Greenpanel. The company is optimistic of growing the domestic size of this business from H663 crores in 2020-21 to a projected revenue of H900 crores in 2021-22.
54 | Greenpanel Industries Limited Annual Report 2020-21 | 55
CORPORATE OVERVIEW STATUTORY STATEMENTS FINANCIAL STATEMENTS
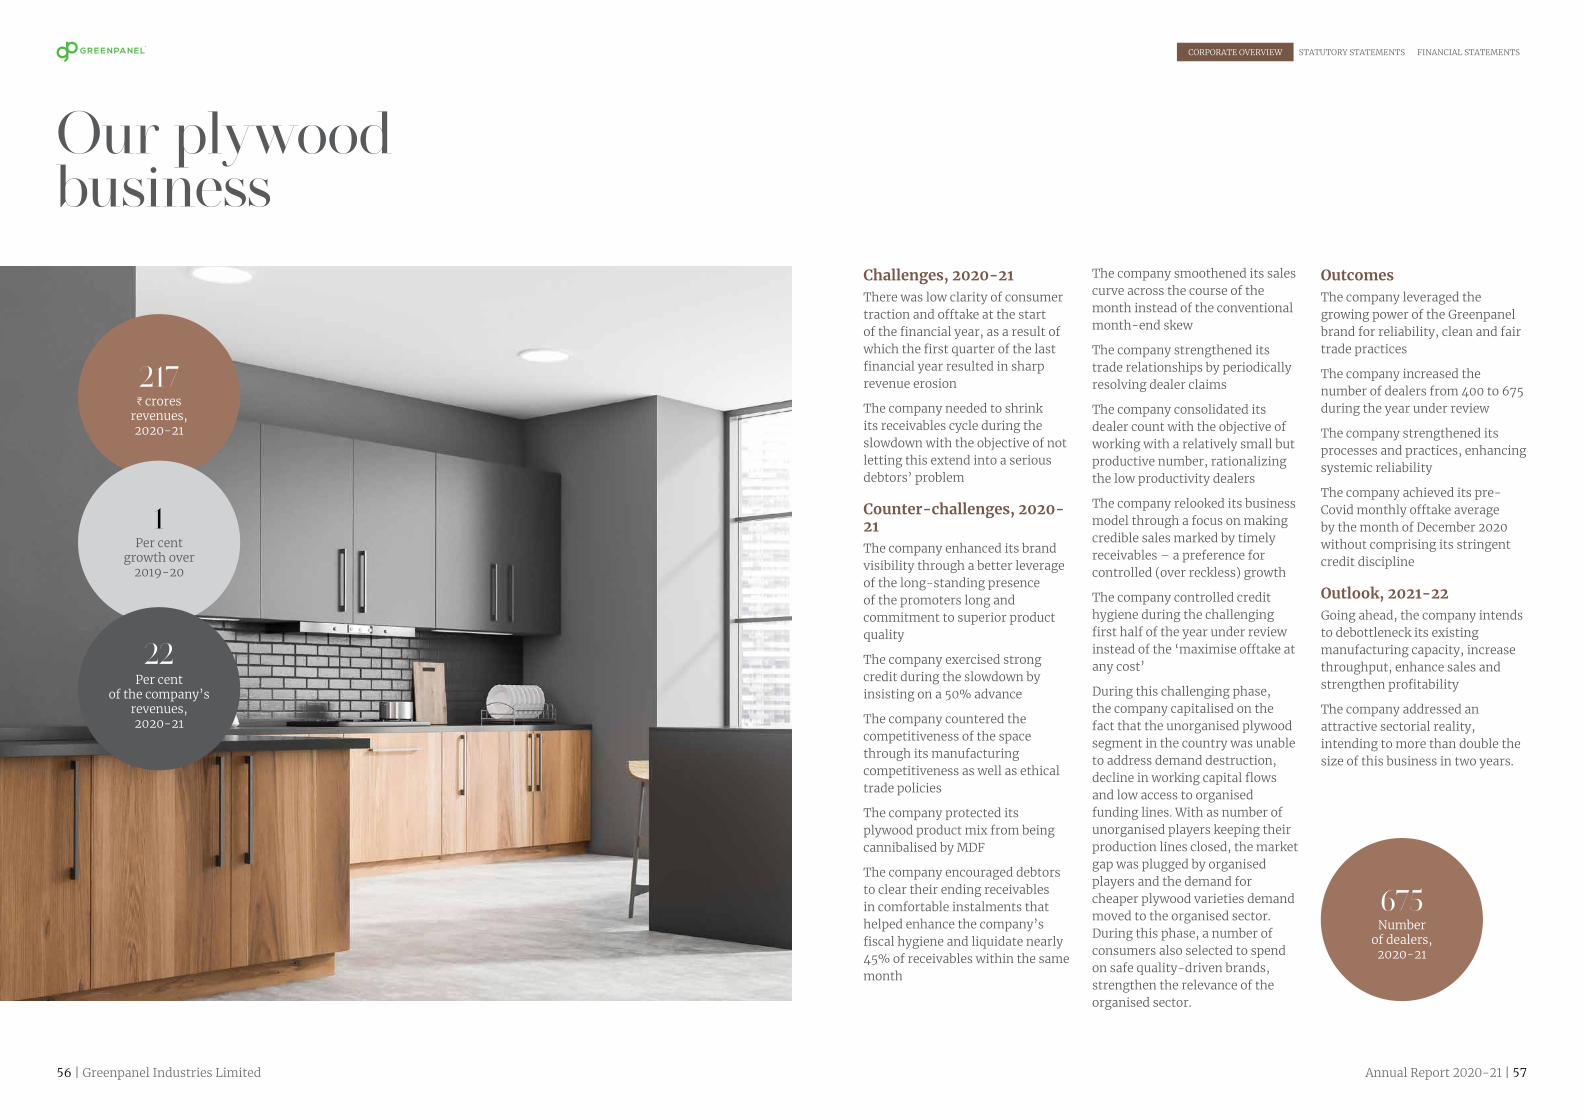
Our plywood business
217H crores
revenues, 2020-21
675Number
of dealers, 2020-21
1Per cent
growth over 2019-20
22Per cent
of the company’s revenues, 2020-21
Challenges, 2020-21There was low clarity of consumer traction and offtake at the start of the financial year, as a result of which the first quarter of the last financial year resulted in sharp revenue erosion
The company needed to shrink its receivables cycle during the slowdown with the objective of not letting this extend into a serious debtors’ problem
Counter-challenges, 2020-21The company enhanced its brand visibility through a better leverage of the long-standing presence of the promoters long and commitment to superior product quality
The company exercised strong credit during the slowdown by insisting on a 50% advance
The company countered the competitiveness of the space through its manufacturing competitiveness as well as ethical trade policies
The company protected its plywood product mix from being cannibalised by MDF
The company encouraged debtors to clear their ending receivables in comfortable instalments that helped enhance the company’s fiscal hygiene and liquidate nearly 45% of receivables within the same month
The company smoothened its sales curve across the course of the month instead of the conventional month-end skew
The company strengthened its trade relationships by periodically resolving dealer claims
The company consolidated its dealer count with the objective of working with a relatively small but productive number, rationalizing the low productivity dealers
The company relooked its business model through a focus on making credible sales marked by timely receivables – a preference for controlled (over reckless) growth
The company controlled credit hygiene during the challenging first half of the year under review instead of the ‘maximise offtake at any cost’
During this challenging phase, the company capitalised on the fact that the unorganised plywood segment in the country was unable to address demand destruction, decline in working capital flows and low access to organised funding lines. With as number of unorganised players keeping their production lines closed, the market gap was plugged by organised players and the demand for cheaper plywood varieties demand moved to the organised sector. During this phase, a number of consumers also selected to spend on safe quality-driven brands, strengthen the relevance of the organised sector.
OutcomesThe company leveraged the growing power of the Greenpanel brand for reliability, clean and fair trade practices
The company increased the number of dealers from 400 to 675 during the year under review
The company strengthened its processes and practices, enhancing systemic reliability
The company achieved its pre-Covid monthly offtake average by the month of December 2020 without comprising its stringent credit discipline
Outlook, 2021-22Going ahead, the company intends to debottleneck its existing manufacturing capacity, increase throughput, enhance sales and strengthen profitability
The company addressed an attractive sectorial reality, intending to more than double the size of this business in two years.
56 | Greenpanel Industries Limited Annual Report 2020-21 | 57
CORPORATE OVERVIEW STATUTORY STATEMENTS FINANCIAL STATEMENTS

OverviewThe company is moving towards holistic interior solutions using MDF as the building block.
Even as non-engineered wood addresses the high end of applications, the company focuses on the use of high density fibre or Club-based flooring as well as vinyl sheet or imported sheet on MDF board.
Rationale for presenceThe extension from MDF manufacture into this business has helped enhance value-addition (2.5x). The use of proprietary MDF as raw material has helped protect product quality. Besides, the company leverages its existing trade network to market this product, enhancing sales throughput (an incentive) for trade partners, strengthening their loyalty.
The company commissioned this business with proprietary resources; it did not outsource any part of the raw material used in production.
Access to the principal raw material (MDF) manufactured within the company assured the
company of the right density and durability of the end product (paper was imported from Germany for the veneer version).
The inclusion of this product strengthened the company’s brand as a single-point solution provider
The company generated a 10% premium by the virtue of the Greenpanel brand - without promotional spending
Challenges in 2020-21During the last financial year, there was a need to market the wooden flooring concept over competing alternatives, enhance segment visibility and highlight the company’s standing as a reliable material provider in a fragmented market.
Counter-challenges, 2020-21The company enhanced its focus on the segment, which helped increase revenues during the year under review.
OutlookThe company intends to double revenues in the current financial year.
Our floorings business Maintains the
thermostatic room temperature,
enhancing locational comfort
Provides a rich international interiors look
Easy to commission or dismantle,
generally done in a fraction of the time taken to instal tiles
or marble
Installation relatively noiseless
with minimal disturbance
Introduction of technology-led
durable, fire- and water-resistant wooden flooring
options
The advantages of our flooring product
60,000250,000 H crores, annual market for marble in India
H crores, annual market for tiles in India
600H crores, annual market for wooden flooring in India
Room for growth
How Greenpanel surprised a hospitality client with speed
A prominent hospitality chain in North India encountered a challenge, One of its prominent properties needed to change its flooring across its rooms. The problem was that this transpired in the peak tourist season; the chain could not afford to close its rooms for a few days as it would result in precious revenue loss. The chain approached Greenpanel; the company responded with a solution: it would respond with this modular flooring that could be laid with speed. The client asked: How fast? Greenpanel replied: between the time a guest has vacated in the morning and the other guest has checked in by the afternoon. The client was hesitant; Greenpanel surprised the client through additional deployment of implementation professionals and delivering a neat, noiseless and convenient solution within the day.
58 | Greenpanel Industries Limited Annual Report 2020-21 | 59
CORPORATE OVERVIEW STATUTORY STATEMENTS FINANCIAL STATEMENTS
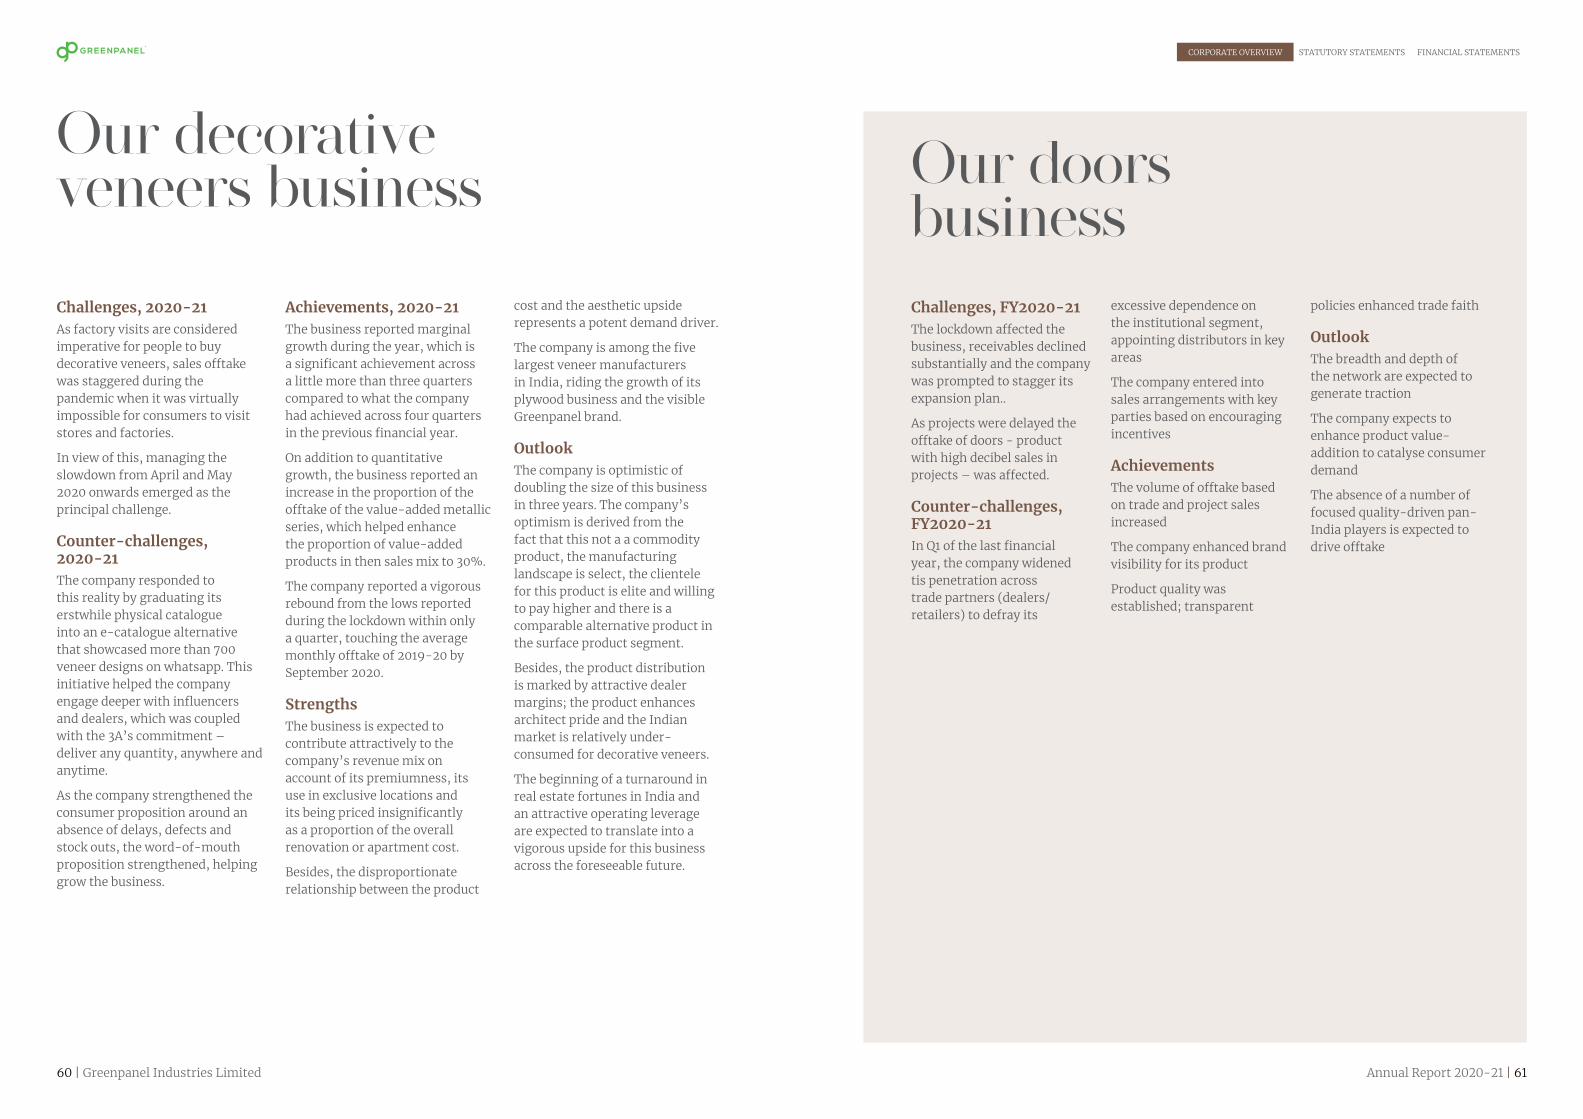
Our decorative veneers business
Challenges, 2020-21As factory visits are considered imperative for people to buy decorative veneers, sales offtake was staggered during the pandemic when it was virtually impossible for consumers to visit stores and factories.
In view of this, managing the slowdown from April and May 2020 onwards emerged as the principal challenge.
Counter-challenges, 2020-21The company responded to this reality by graduating its erstwhile physical catalogue into an e-catalogue alternative that showcased more than 700 veneer designs on whatsapp. This initiative helped the company engage deeper with influencers and dealers, which was coupled with the 3A’s commitment – deliver any quantity, anywhere and anytime.
As the company strengthened the consumer proposition around an absence of delays, defects and stock outs, the word-of-mouth proposition strengthened, helping grow the business.
Achievements, 2020-21The business reported marginal growth during the year, which is a significant achievement across a little more than three quarters compared to what the company had achieved across four quarters in the previous financial year.
On addition to quantitative growth, the business reported an increase in the proportion of the offtake of the value-added metallic series, which helped enhance the proportion of value-added products in then sales mix to 30%.
The company reported a vigorous rebound from the lows reported during the lockdown within only a quarter, touching the average monthly offtake of 2019-20 by September 2020.
StrengthsThe business is expected to contribute attractively to the company’s revenue mix on account of its premiumness, its use in exclusive locations and its being priced insignificantly as a proportion of the overall renovation or apartment cost.
Besides, the disproportionate relationship between the product
cost and the aesthetic upside represents a potent demand driver.
The company is among the five largest veneer manufacturers in India, riding the growth of its plywood business and the visible Greenpanel brand.
OutlookThe company is optimistic of doubling the size of this business in three years. The company’s optimism is derived from the fact that this not a a commodity product, the manufacturing landscape is select, the clientele for this product is elite and willing to pay higher and there is a comparable alternative product in the surface product segment.
Besides, the product distribution is marked by attractive dealer margins; the product enhances architect pride and the Indian market is relatively under-consumed for decorative veneers.
The beginning of a turnaround in real estate fortunes in India and an attractive operating leverage are expected to translate into a vigorous upside for this business across the foreseeable future.
Our doors businessChallenges, FY2020-21The lockdown affected the business, receivables declined substantially and the company was prompted to stagger its expansion plan..
As projects were delayed the offtake of doors - product with high decibel sales in projects – was affected.
Counter-challenges, FY2020-21In Q1 of the last financial year, the company widened tis penetration across trade partners (dealers/retailers) to defray its
excessive dependence on the institutional segment, appointing distributors in key areas
The company entered into sales arrangements with key parties based on encouraging incentives
AchievementsThe volume of offtake based on trade and project sales increased
The company enhanced brand visibility for its product
Product quality was established; transparent
policies enhanced trade faith
OutlookThe breadth and depth of the network are expected to generate traction
The company expects to enhance product value-addition to catalyse consumer demand
The absence of a number of focused quality-driven pan-India players is expected to drive offtake
60 | Greenpanel Industries Limited Annual Report 2020-21 | 61
CORPORATE OVERVIEW STATUTORY STATEMENTS FINANCIAL STATEMENTS

Greenpanel. Broad basing through stronger people practices
OverviewIn a business where a range of competencies are needed, there is a premium on the need to recruit, train and retain talent. During the last financial year, as the Covid-19 impact unfolded, there was an additional priority: to enhance organisational morale and productivity.
Challenges, FY2020-21The company was required to address the challenges arising out of the Covid-19 pandemic.
There was growing job insecurity, fear, hopelessness, low productivity and challenges arising out of change in the workplace environment (from office to home), warranting increased community to plug the gap.
Counter-challenges, FY2020-21The company introduced Branch Connect, a structured programme to enhance intra-organisational engagement lasting 150 minutes per location across four months so ensure that every voice was heard and there was enhanced employee clarity on team priorities.
The company introduced a Covid Policy that provided employee assurance, guidelines and
incentives to recoup what may have been lost through salary moderation.
AchievementsThe Company outsourced the payroll function to an external specialist, liberating organisational bandwidth; it launched a Human Resource Management System focused on automated attendance management.
The company strengthened new recruit fitment which comprised a review of joinees every 30, 60 and 90 days; it launched an HR Clinic that responsively addressed employee problems each Friday.
The company re-launched an in-house magazine; it launched an approach where new recruits were confirmed on Day One following a wider employee engagement in recruitment; it introduced grade parity of remuneration with the prevailing industry standard.
The company strengthened its recruitment and retention around a structured system; it charted career paths for employees.
The company introduced an HR Manual that enhanced organisational clarity and communication transparency; it strengthened its compliance with external requirements.
1816Number of employees,
March 31, 2021
35Average age,
March 31, 2021
OutlookThe Company intends to strengthen teams with the objective to enhance people retention.
62 | Greenpanel Industries Limited Annual Report 2020-21 | 63
CORPORATE OVERVIEW STATUTORY STATEMENTS FINANCIAL STATEMENTS

What does it mean to work at GreenpanelEmployees speak about the distinctive Greenpanel culture
“I joined the Delhi NCR branch of Greenpanel in February 2020 and following a brief stint, workplace attendance was discontinued on account of the pandemic. During the last few months I have seen major changes related to productivity and volumes. What impressed me is that the company launched a user-friendly app to track team members; the employees do not need to physically meet, which saves time and increases business.”
Ramandeep SinghAssistant general manager, Delhi NCR
“The senior management approves recommendations within half an hour, enhancing a culture of urgency.”
Ranabir SinghaBranch manager, Guwahati
“I joined Greenpanel after having 32 years in Malaysia. As a General Manager, my responsibility was to instil an international way of functioning. We have achieved quite a bit in this area in terms of safety, workplace discipline, processes and systems. The Chairman awards a trophy to the best performed audit by an employee.”
Victor. P. XavierGeneral manager, Operations, Srikalahasti, MDF 2
“I am extremely satisfied with my job at Greenpanel. I have been empowered with complete knowledge on everything about the plant, making it my second home.”
G. GurumurtyAssistant Manager, safety, Srikalahasti, MDF 2
“At a time when everyone around the world is encountering job insecurity, Greenpanel gave increments and opportunities to employees. This is a company that supports its workforce: it granted me permission to take my team to Mukhteshwar in spite of a financial crunch. The workers desperately needed this break and learning opportunity on account of the workload and home sickness.”
Ramandeep SinghAssistant general manager, Delhi NCR
“During the pandemic, Greenpanel initiated the use of a mobile medical van, which not only enhanced employee safety but also the safety of neighbouring villagers. This will generate large multi-year goodwill.”
Ch. V. NandakishoreAssistant general manager, Human resource
“When the new value-added products Okume MDF and Veener MDF were launched some months ago, the production and sales team got on a conference call with OEM customers to understand their needs and preferences, which helped customise the product.”
S.P. SinghGeneral Manager- MDF and Flooring
“When people around the world were losing their jobs or recruitment was being deferred, Greenpanel honoured its recruitment commitment. I am not likely to forget this.”
S.P. SinghGeneral Manager- MDF and Flooring
“A Greenpanel employee suffered an accident and instead of escalating this to the senior management, the local team addressed the issue with necessary funding. Besides, when I was unwell, the workforce treated me like they had known me for years.”
Victor. P. XavierGeneral manager, Operations, Srikalahasti, MDF 2
“The acceptability of Greenpanel upgrades results in an ever-contemporary range of designs. Every year the company adds more than designs, finishes and textures to provide a completely new look to its product swatch.”
S.P. SinghGeneral Manager- MDF and Flooring
“Employees were impressed by the priority accorded to safety at Greenpanel: through the aggressive use of automation, environment-friendly systems and aggressive resource recycling. Besides, masks were made mandatory, the manufacturing plants were sanitized daily, social distancing was practiced, rapid Covid-19 testing was implemented, online meetings were scheduled and oxymeters installed. The message: the company cares!”
Ch. V. NandakishoreAssistant general manager, Human resource
“Greenpanel’s health department takes care of each health issue of not only employees but also villagers.”
Vunnam SripriyaNurse
“Greenpanel is a MDF pioneer in India, a status that has generated longstanding goodwill. Besides, there has been a follow on respect for its quality standard and consistency. When people buy from Greenpanel, they buy a peace of mind.”
S.P. SinghGeneral Manager- MDF and Flooring
“The company resolves any complaints within a day, owing to the sense of ownership within every individual working within. We don’t need to get an approval from the headquarters for everything.”
S.P. SinghGeneral Manager- MDF and Flooring
64 | Greenpanel Industries Limited Annual Report 2020-21 | 65
CORPORATE OVERVIEW STATUTORY STATEMENTS FINANCIAL STATEMENTS

The plywood manufactured by Greenpanel is the most reliable and in the past few
years, I have not experienced any issue with it. What I value is how the Company kept its word despite challenges due to the pandemic, which no other organisation did.”
Sri Gopal Sri Gopal Ply and Laminates Pvt Ltd, Hyderabad
The Greenpanel management takes quick decisions and this makes our work
easier. Even during the pandemic, Greenpanel put no pressure on us regarding distribution, handling the situation with calmness. The Company is like second family to me.”
Aneet Jain MD Woods, Indore
It has almost been two and a half years I have been associated with Greenpanel and the company put no pressure on its dealers, helping them with a flexible
policy (which did not change during the pandemic). At a time when most companies would panic due to the losses caused by the outbreak of the pandemic, Greenpanel stayed calm and this cascaded to top is trade partners as well.”
Paras Maroti Owner, Maroti Hardware, Silchar
What dealers have to say about working with GreenpanelAn enduring relationship with a credible organisation
Greenpanel contributes 25% to my revenues. The reason why the brand has created successful traction is that it has always maintained its quality and commitments
towards dealers and customers. The result is that the trade partners market Greenpanel as if it is their proprietary brand.”
Rakesh MehtaOwner, Mahaveer Laminates, Coimbatore
Greenpanel uses only the best quality raw materials to produce
products. This explains why I have received no after-sales complaints till date on account of durability, longevity, availability and delivery. I call it the ‘no jhanjhat wala account’”
W hen you purchase Greenpanel,
you buy peace of mind. If any complaint is registered, the marketing team responds within two hours and the issue is resolved in two days.”
T he thing that I admire most about the company is
its transparent policy. Greenpanel maintains the same pricing and payment policy for all its dealers across India.”
W henever I go to visit the company’s
plant in Uttaranchal, Shiv Prakashji and Shobhanji personally greet me. There is an unusually warm culture about this organisation.”
W hen I have an urgent requirement
Greenpanel ensures delivery within 5 days (which generally takes 10 days). This enhances my confidence that Greenpanel will never let me lose a sale.”
Greenpanel seeks dealer feedback of every single
product each month. As a result, the brand stands for trustworthiness.”
66 | Greenpanel Industries Limited Annual Report 2020-21 | 67
CORPORATE OVERVIEW STATUTORY STATEMENTS FINANCIAL STATEMENTS

Greenpanel. Broad-basing through manufacturing excellence
OverviewAt Greenpanel, we invested in the largest MDF manufacturing capacity in India (organisationally and at a single location) and among the largest in the world. During the year under review, there was a need to increase production, reduce manufacturing cost produced and deliver a consistently high product quality.
Challenges, FY2020-21 During the lockdown as demand
declined, it was not feasible or profitable to manufacture, there was a challenge in sustaining some plant operations (effluent treatment plant, fire protection system, uninterrupted power system, DG sets plant security and maintenance) and in the utilization of perishable consumables
There was a challenge related to worker and raw material availability (wood logs, resin, spares and consumables) as soon as the lockdown was partially lifted and it was time to re-commence operations
There was a priority to protect employee health during the lockdown and after and stay in responsible engagement with neighbouring villagers and government officials.
Strengths An annual production capacity
of 3,60,000 CBM at Andhra
Plant, Asia’s largest and most technologically advanced MDF manufacturing facility equipped with the best of European technology
The use of German equipment for forming, press and raw board handling from Dieffenbacher; use of GreCon Dieffensor for scanning fibre mat to produce uniform density panels; use of GreCon Stenograph for inline monitoring of density profile; use of 14 Head Sanding Machine from Steinemann for better finished surfaces; investment in state-of-the-art technology for treatment of industrial waste water, multi-fuel hybrid energy generation plant from Thermax (India) and Through Panel density testing technology
Employment of 70% local talent (first salaries persons in their families), largely recruited from nearby colleges and trained by industrial experts and technology partners
Achievements, 2020-21The company sustained some process to keep them in a state of readiness for a time when operations resumed, resulting in a cost increase without a corresponding revenue source.
The effluent treatment and power plants were sustained with minimal people and material resources.
The company continued to sustain maintenance & security operations following approvals from the district collector and corresponding health/hygiene safeguards.
The company engaged with its vendors for raw material (wood logs, resin, spares & consumables) to resume plant operations
The company distributed masks, hand sanitizers, bleaching power, vegetables and refined oil to surrounding villages as well as masks and hand sanitizers to health workers.
The Company achieved a blended capacity of 69% in MDF across both plants, an increase of 900 bps over the previous year.
The Company optimised its administrative costs by resorting to more e-meetings over video conferences and moderating travel
The company reported a capacity utilisation of 69% in its MDF operations; the company reported higher plant productivity increased through increased employee involvement, training, application of 5S and Lean Manufacturing approach and optimised production plan
The company placed an order for a paper Impregnation unit to address the increased market demand for pre laminated boards.
The company is in discussions to commission a Smart wash system, mat heating and pond solar plant for plant optimization.
The company utilised the digitalised dashboard system to check deviations and align efficiencies around a global benchmark.
OutlookThe company intends to develop new products and enhance quality following equipment modification
68 | Greenpanel Industries Limited Annual Report 2020-21 | 69
CORPORATE OVERVIEW STATUTORY STATEMENTS FINANCIAL STATEMENTS

OverviewIn a business marked by temporary overcapacity, there is a premium on the need to manage financial resources with the objective to generate controlled, profitable and sustainable growth.
ChallengesThe principal challenge was to manage cash flows on the one hand as well as liabilities on the other (overheads and debt servicing) during the lockdown and after.
The challenge was to protect the integrity of the Balance Sheet, minimising impairment that would make it possible for the company to rebound with speed when demand revived.
There was a greater demand among trade partners for longer credit to generate offtake
CompetitiveGreenpanel borrowed Euro 42 million with a
10-year window at a cost of six month Euribor plus
0.50%, enhancing its competitiveness
The Company was required to explore new product applications at a time when the health of its largest customer segment (real estate) remained muted
The weakness of the Indian currency against the US Dollar and Euro translated into currency losses in the first part of the year (affecting the P&L account more than cash flows).
Achievements, FY2020-21The Company reported 20% growth in revenues; the growth in the last three quarters was 45%
over the corresponding period of the previous year
The Company achieved a blended capacity of 69% in MDF, an increase of 900 bps over the previous year, which helped amortise fixed costs effectively
The Company focused on maximising domestic sales, capitalising on the growing strength of the Indian currency in the last three quarters.
The Company strengthened working capital management; it reduced the working capital cycle from 65 days of turnover
equivalent as on March 31, 2019 to 45 days towards the close of FY2019-20 and 35 days in FY2020-21.
The Company repaid H49 crores of debt, strengthening its gearing (for long-term debt) from 0.78 to 0.57. It reduced net debt by H157 crores during the year under review.
The company increased the proportion of revenues derived from value-added products, strengthening cash flows and profitability.
OutlookThe Company will focus on sustaining revenue growth by leveraging its brand better, maintaining or strengthening its working capital cycle and strengthening the proportion of value-added products.
Greenpanel. Broad-basing through stronger financials
70 | Greenpanel Industries Limited Annual Report 2020-21 | 71
CORPORATE OVERVIEW STATUTORY STATEMENTS FINANCIAL STATEMENTS

Greenpanel. Broad-basing through a stronger brand
Why consumers trust the Greenpanel brand
OverviewIn a business where the product offtake is driven by visibility-induced recall, there is a premium on consistent and measured brand building.
Key challenges, 2020-21There was a challenge in needing to conserve cash at a time when consumers would not step out to buy wood panel products
There was a challenge in educating customers about the positive attributes of MDF over lower-priced plywood.
There was a challenge in enhancing retail visibility across small multi-brand outlets to
enhance consumer recall at a time of economic weakness.
There was a challenge in marketing products to the real estate sector, apartment buyers and commercial offices in view of the lock-down-induced slowness.
Countering the challengesThe Company engaged deeper with first-level product influencers (carpenters, contractors and architects), showcasing product
capability and the company’s quality standards
The Company engaged in brand building on exterior walls along national highways, enhancing familiarity. The Company enhanced signages and in-shop displays at outlets especially in untapped Tier II and Tier III cities.
The Company introduced e-catalogues across product segments; it strengthened its digital presence through relevant
social media platforms.
The Company widened the application of its Standard Operating Procedure (SOP) for carpenters and product installers, enhancing the effectiveness of the delivered solution
The Company grew the traction of its wooden floors website to engage deeper with architects, channel partners and consumers. The website comprised a simulation feature through which
the visitor could visualise different wood floor designs before arriving at a purchase decision.
The brand invested in wider choice of wood panelling and surface enhancement products addressing different price points.
The Company enhanced magazine advertising to enhance visibility across architects and channel partners.
Enhanced consumer experience
(availability, accessibility, affordability)
Drawn from Greenply
Distinctively positive user experience
Ethical trade practices
Environment friendly (MDF)
Superior price-value
proposition
Enhances consumer pride
Invested in cutting-edge
German technology
Built around the highest product
quality
Focus on enhancing
stakeholder value
72 | Greenpanel Industries Limited Annual Report 2020-21 | 73
CORPORATE OVERVIEW STATUTORY STATEMENTS FINANCIAL STATEMENTS

During lockdown it implemented a 21-day fitness challenge, reaching out to more than 25 lacs people while its Work from Home contest reached out to more than 9 lacs people; its mobile campaign during the lockdown engaged with retail customers and carpenters
AchievementsThe Greenpanel brand has been in existence for three years. During this short period, the brand encountered various challenges: the need to establish visibility in a cluttered market, counter the economic and real estate slowdown and finally the impact of the Covid-19 pandemic.
The brand’s principal achievement has been that bit has increased revenues every single year since its launch: H571 crores in FY2018-19, H830 crores in FY2019-20 and H1000 crores in FY2020-21.
Even while there was a premium on revenue growth, the company enhanced the proportion of revenues from value-added products, protected its receivables and established a growing respect for product integrity.
OutlookThe Company will continue to enhance the visibility of its new interactive website for Greenpanel wood floors (www.gpwoodfloors.com)
It will widen its retail branding and highways branding initiative across India on the one hand and deepen digital marketing on social media (Facebook and Instagram)
The Company intends to enhance footfalls at ‘Wood Chimes’- its experience centre dedicated to Decorative Veneers in the Rudrapur plant
74 | Greenpanel Industries Limited Annual Report 2020-21 | 75
CORPORATE OVERVIEW STATUTORY STATEMENTS FINANCIAL STATEMENTS

Greenpanel. Broad-basing through a responsible Environment, Health and Safety commitment
OverviewThe truly sustainable companies are also the ones most committed to a high standard of health-safety-environment. A high HSE standard is not only a driver of statutory approval but also of business sustainability in the form of stringer customer traction, organisational stability, enhanced respect, superior credit ratings and possibly higher market valuation.
Greenpanel’s environment commitmentGreenpanel manufactures a product that has been derived from nature, indicating that its source is non-synthetic, bio-degradable and sustainable.
Besides, Greenpanel has invested in environment integrity through the use of superior technologies, renewable resources, resource consumption reduction, credibility enhancing certifications and responsible effluents treatment. The company’s Andhra Pradesh factory has been rated as an environment showpiece, validated by the prestigious IGBC Green Factory Building with a Gold rating for sustainable manufacturing practices.
At Greenpanel, our environment sustainability begins with a commitment to help grow and source natural resources. The Company provides clonal saplings to farmers to raise specific wood species that consume less water and comprise a relatively short gestation period - a win-win
proposition for farmers, earth and company.
Greenpanel created a team to drive environment responsibility within its manufacturing facilities. The Company appointed an external agency to monitor the environment standards across its manufacturing units, enhancing
the integrity of its findings. Reports were submitted on a periodic basis to the pollution control units, strengthening compliance.
Resource conservation initiatives, FY2020-21At Greenpanel, we believe that a lower consumption of resources of any kind lies at the heart of environment sustainability. In view of this, the Company outlined a priority to moderate the consumption of natural resources within its manufacturing operations. This strengthened the Company’s commitment to
generate a lower carbon footprint.
Rainwater harvesting: At Greenpanel, we are not only focused on the moderation of water in our manufacturing process but also the capture of every drop of rain within our water harvesting system for onward reuse. The total rain water harvesting capacity of the system commissioned by the Company in its Andhra Pradesh plant was 130,000 Cum. Greenpanel commissioned a laboratory to periodically monitor water quality.
Waste disposal: Greenpanel implemented 5S among all employees and started training for all employees to improve House Keeping Practices (Sort out/Set in Order/Shine/ Standardize/Sustain). The 5S initiatives were sustained through regular audits, training, competitions, rewards and recognition. The plant installed separate bins to collect different waste types generated in the manufacturing process; the same was moved to a central scrap yard on a periodic basis for segregation, storage and disposal through authorised re-processors and recyclers. All the waste generated from the processes was documented and disposed as per PCB norms. The company tied up with brick manufacturers for the use of fly ash generated from the energy plant.
Reduction in energy consumption: Over the years, the Company invested in energy conservation equipment (energy efficient chillers, DGUs, etc.). The result of the Company’s commitment translated into energy saving that was 34% higher than the Green Building baseline. The Company installed energy meters to monitor performance and indicate improvement opportunities. The Company
At Greenpanel, our environment sustainability begins with a commitment to help grow and source natural resources.
76 | Greenpanel Industries Limited Annual Report 2020-21 | 77
CORPORATE OVERVIEW STATUTORY STATEMENTS FINANCIAL STATEMENTS

designed its manufacturing area through the prudent use of skylights that maximised natural light energy and minimised LED fixtures. Required capacitor banks maintained Power Factor 1 and were monitored hourly.
Process improvement: A continuous monitoring of equipment performance related to power consumption, coupled with optimised process cycle time at every stage of the manufacturing
process, generated continuous improvement.
Green belt development: The company developed a green belt within its premises at various locations.
Environment initiatives: The company’s objective is to keep the entire plant area clean. The company appointed an external agency for monitoring environmental conditions within the plant premises and vicinity
areas. Greenpanel appointed experts with lab facilities for monitoring water quality on day-to-day basis and controlling the same with proper records to meet environmental standards. The company controlled vehicle movement within the plant premises by issuing a gate pass; unauthorised vehicle movement was controlled and vehicle speed was controlled up to 20 km/hr within the plant premises.
Greenpanel’s environment commitment
The Company strengthened its initiatives to moderate power consumption that would, in turn, moderate its drawal from the state electricity grid that was driven by power generated from fossil fuels.
Power equipment with high motor ratings was equipped with variable frequency drives.
The monitoring and control of energy consumption was
conducted through energy meters.
Streetlights were provided timers to keep them on during specific hours.
Standby measures were followed wherein manufacturing equipment with no raw material would stop automatically.
Motor-driven pumps were automatically operated, the
floats preventing an over-run that translated into lower consumption.
Temperature sensor-driven equipment was installed to control power consumption.
LED lights, consuming lower power, were installed in place of flood lights and other variants that consumed more electricity.
At Greenpanel, we believe that index of our HSE commitment lies in the health of our employees. The objective of the Company is to periodically monitor employee health and enhance fitness awareness. As an extension of this commitment, the Company’s medical team periodically visits neighbouring villages to provide medication and enhance health also awareness.
Medical facilities: As per industrial norms the plant is providing emergency medical facilities viz. First-aid room, doctor and nurse. An ambulance has been provided to cater to any emergency and transit
Health initiatives, FY2020-21
the person to nearby hospital in case of something serious.
Safe drinking water: The Company installed a dedicated
reverse osmosis plant for drinking water purposes maintained by a dedicated team to address water quality and quantity needs
Safety initiatives, FY2020-21At Greenpanel, our objective is to achieve a ‘zero accident’ rate through training and employee awareness programmes.
The Company focused on making its workplace completely safe as measured by zero accidents in manufacturing units. In FY2020-21, the safety initiatives c
Appointed a Safety Officer to monitor and control safety activities
Initiated and monitored the issue of personal protecting equipment to employees based on process locations
Initiated and monitored the Work Permit System with LOTO procedures wherever required.
Conducted safety training for employees; conducted Safety Committee meetings.
Investigated all accidents and incidents
Monitored safe person-hours
Circulated monthly safety reports
Audited the fire protection equipment
What our stakeholders
have to say about our HSE commitment
A t Greenpanel, safety comes first, second and last.
This is a modern international operating culture that covers equipment (cutting-edge European technology) and mindsets.”
A t Greenpanel’s Andhra Pradesh plant, we take
collective daily oaths on issues relating to the environment and safety, which is reaffirming.”
T he operative word at our plants is ‘safety’. In our
plants almost all functions are automated. This enhances our focus on quality and efficiency instead of worried about safety.”
A t Greenpanel, each worker is provided appropriate
shoes, masks and clothes. The shop-floor is cleaned every couple of hours.”
78 | Greenpanel Industries Limited Annual Report 2020-21 | 79
CORPORATE OVERVIEW STATUTORY STATEMENTS FINANCIAL STATEMENTS

Greenpanel. Broad-basing through growing resource security
OverviewIn the business of plywood and MDF manufacture, there is a premium on the ability to procure the largest wood volume at the most affordable cost from within the shortest procurement distance.
When Greenpanel embarked on an ambitious project to encourage farmers in growing plantation wood in and around its Andhra Pradesh manufacturing facility, the challenges were large: the vast wood appetite warranted a long-term investment that was not easily available from within the Company’s financials. This reality notwithstanding, the Company invested, demonstrated the proof of its concept, scaled and transformed the growth of plantation wood into a full-fledged movement.
The result is this initiative has translated into a rural transformation influence in the areas of the Company’s presence: enhanced farmer livelihoods, secured availability of precious raw material from within 200 kms of the Company’s manufacturing facilities, moderated the delivered cost of wood resource, enhanced rural prosperity, enhanced re-investment in commercial farming and enhanced wood quality.
StrengthsLower distance: The Company moderated the average distance covered in the procurement of wood resource, reducing time and distance taken on the one hand and the average cost of procurement on the other.
Stability of engagement: The Company entered into stable engagements with a growing number of farmers, representing a dependable procurement
backbone, resulting in multi-year resource visibility.
Holistic role: The Company has graduated from just a buyer to a friend-philosopher-guide, helping farmers generate superior yields and advising on re-investments, widening the circle of prosperity.
Clonal: The Company reinforced its wood plantation programme through the availability of high yielding clonal saplings, increasing tonnage per hectare and enhancing
farmer prosperity. Besides, a reduction in the gestation period by 40% to grow the clonal saplings into full-fledged trees has proved win-win: quicker incomes for farmers, greater inducement to grow trees and secured material availability for the Company.
Outlook, 2020-21The Company will widen plantation footprint and accelerate the shift from seedlings to clonal saplings.
Sustainability and farmers
Greenpanel: Empowering farmers
These helped increase
tonnage per hectare, reduce gestation and
enhance farmer incomes
The Company facilitates wood
movement to the factory
The Company provides superior
returns to farmers without intermediaries
The Company provides
farmers with high yielding
clonal saplings
The Company assures farmers
of clonal-derived wood
buyback
Greenpanel has done a lot for raitus (Telugu word for
farmers). I had three acres lying barren for years. Greenpanel taught us the benefits of plantation. I planted 4,500 saplings on three acres. I will profit from them once they mature.”
P. Dharmayya, Farmer, Aalathur
Me and my bharta (Telugu word for husband) are
poor farmers. It was difficult for us to generate an adayam (Telugu word for income) only through crop cultivation. We had a lot of barren land. Greenpanel educated us on plantations. We planted 18,800 saplings on 13 acres.”
K. Bharati, Farmer, Anjurasuramala
FY2019-20 summary
Species Saplings planted Acres Area (Hectares)
Eucalyptus 225500 158 63.94
Casuarina 40800 26 10.52
Total 266300 184 74.46
FY2020-21 summary
Species Saplings planted Acres Area (Hectares)
Eucalyptus 302980 202 81.75
Casuarina 0 0 0.00
Total 302980 202 81.75
80 | Greenpanel Industries Limited Annual Report 2020-21 | 81
CORPORATE OVERVIEW STATUTORY STATEMENTS FINANCIAL STATEMENTS

Greenpanel. Responsible corporate citizen OverviewAt Greenpanel, we profess a responsibility that extends beyond profit towards responsible corporate citizenship.
Over the years, we invested in CSR activities of high social value around our manufacturing facilities. The following were conducted in the vicinity of our Andhra Pradesh plant:
Delivered medical services to 23 neighbouring villages
Facilitated the delivery of drinking water through the installation of reverse osmosis plants
Supported child education initiatives
Developed natural resources
Our achievements, FY2020-21 Greenpanel served ~60,000
people through health care services as an ESC (Entrepreneur Social Commitment) in Andhra Pradesh
Provided medical Services to 23 villages; completed 193 visits.
Provided medical services to 9000+ villagers.
Distributed medicines to villagers.
Launched a mobile medical van service trail to enhance an awareness of rural health concerns
Provided medical consultation, assistance, counselling and medicines for basic and general diseases without charge.
Strengthened infrastructure and education center at Primary Government School, Pipliya, Udham Singh Nagar, Uttarakhand
60,000Number of
people whose lives we touched
Management discussion and analysis
Global economic overview
Performance of some major economies
Indian economic review
The global economy reported de-growth of 3.5% in 2020 compared to a growth of 2.9% in 2019, the sharpest contraction since World War II. This steep decline in global
economic growth was largely due to the outbreak of the novel coronavirus and the consequent suspension of economic activities across the world. This led to global
supply chain disruptions, resulting in a de-growth in some of the largest global economies. (Source: IMF)
United States: The country witnessed a GDP de-growth of 3.4% in 2020 compared to a growth of 2.3% in 2019.
China: The country’s Gross Domestic Product grew 2.3% in 2020 compared to 6.1% in 2019 despite being the epicenter of the outbreak of the novel coronavirus.
United Kingdom: Britain’s GDP shrank 9.9% in 2020 compared to 1.4% growth in 2019, 2x the annual contraction recorded in the aftermath of the global meltdown in 2009.
Japan: Japan witnessed a contraction of 4.8% in 2020, the first instance of a contraction
since 2009. (Source: CNN, IMF, Economic Times, trading economics, Statista, CNBC)
The global economy is projected to grow by 5.5% in 2021 largely due to the successful roll-out of vaccines across the globe, coupled with policy support in large economies. (Source: IMF)
The Indian economy passed through one of the volatile periods in living memory in 2020-21.
At the start of 2020, India was among five largest global economies; its economic growth rate was the fastest among major economies (save China); its market size at 1.38 billion was the second largest in the world; its rural population of the under-consumed was the largest in the world.
The Indian government announced a complete lockdown in public movement and economic activity from the fourth week of March 2020. As economic activity came to
a grinding halt, the lockdown had a devastating impact on an already-slowing economy as 1.38 billion Indians were required to stay indoors - one of the most stringent lockdowns enforced in the world.
The outbreak of the novel coronavirus and the consequent suspension of economic activities due to the pandemic-induced lockdown, coupled with muted consumer sentiment and investments, had a severe impact on the Indian economy during the first quarter of the year under review. The Indian economy de-grew 23.9% in the first quarter of
2020-21, the sharpest de-growth experienced by the country since the index was prepared.
The Indian and state governments selectively lifted controls on movement, public gatherings and events from June 2020 onwards, each stage of lockdown relaxation linked to corresponding economic recovery. Interestingly, as controls relaxed what the country observed was a new normal: individuals were encouraged to work from home; inter-city business travel was replaced by virtual engagement; a greater premium was placed on the
82 | Greenpanel Industries Limited Annual Report 2020-21 | 83
CORPORATE OVERVIEW STATUTORY STATEMENTS FINANCIAL STATEMENTS

ownership of personal mobility modes (cars and two-wheelers); there was a sharp increase in home purchase following the need to accommodate an additional room for home working.
The result is that India’s relief consumption, following the lifting of social distancing controls, translated into a full-blown economic recovery. A number of
sectors in India – real estate, steel, cement, home building products and consumer durables, among others - reported unprecedented growth. India de-grew at a relatively improved 7.5% in the July-September quarter and reported 0.4% growth in the October-December quarter of the year under review.
The result is that India’s GDP
contracted during 2020-21, largely on account of the sharp depreciation of the first two quarters. This sharp Indian recovery – one of the most decisive among major economies – validated India’s robust long-term consumption potential.
Y-o-Y growth of the Indian economy
FY18 FY19 FY20
Real GDP growth (%) 7 6.1 4.2
Growth of the Indian economy, 2020-21
Q1, FY21 Q2, FY21 Q3, FY21
Real GDP growth (%) (23.9) (7.5) 0.4
(Source: Economic Times, IMF, EIU, Business Standard, McKinsey)
Indian economic reforms and recoveryThere were a number of positive features of the Indian economy during the year under review.
India reported improving Goods and Services Tax (GST) collections month-on-month in the second half of 2020-21 following the relaxation of the lockdown, validating the consumption-driven improvement in the economy.
The per capita income was estimated to have declined by 5% from H1.35 lacs in 2019-20 to H1.27 lacs in 2020-21, which was considered moderate in view of the extensive demand destruction in the first two quarters of 2020-21.
A slowdown in economic growth and inflation weakened the country’s currency rate nearly 2.83% in 2020 from H71.28 to H73.30 to a US dollar before recovering towards the close of the financial year.
Despite the gloomy economic scenario, foreign direct investments (FDI) in India increased 13% to USD57 billion in 2020.
The gap between government expenditure and revenue was estimated at ~H12 trillion due to increased borrowing by the government in May 2020 to address the COVID-19 outbreak.
India jumped 14 places to 63 in the 2020 World Bank's Ease of Doing Business ranking and was the only country in the emerging market basket that received positive FPIs of $23.6 billion in 2020; the country ranked eighth among the world’s top stock markets with a market capitalisation of $2.5 trillion in 2020.
The Indian government initiated structural reforms in agriculture, labour laws and medium-small enterprise segments. The labour reforms were intended to empower
MSMEs increase employment, enhance labour productivity and wages.
India extended the Partial Credit Guarantee Scheme by relaxing the criteria and allowing state-owned lenders more time to purchase liabilities of shadow banks. Under the H45,000 crores partial credit guarantee scheme, announced as a part of the Atmanirbhar Bharat package, three additional months were given to banks to purchase the portfolio of non-banking financial companies.
The government approved amendments to the Essential Commodities Act and brought an ordinance to allow farmers to sell their crop to anyone; the changes to the Essential Commodities Act, 1955, were intended to ‘deregulate’ agricultural commodities (cereals, pulses, oilseeds, edible oils, onions and potatoes from stock limits). The government approved the Farming Produce Trade
and Commerce (Promotion and Facilitation) Ordinance, 2020, to ensure barrier-free trade in agriculture produce.
The Government relaxed foreign direct investment (FDI) norms for sectors like defence, coal mining, contract manufacturing and single-brand retail trading.
The Union Cabinet approved the production-linked incentive (PLI) scheme for 10 sectors: pharmaceuticals, automobiles and auto components, telecom and networking products, advanced chemistry cell batteries, textile, food products, solar modules, white goods and specialty steel. These incentives could attract outsized investments, catalysing India’s growth journey.
OutlookThe outlook for the country appears to be positive in view of the possibility that three down cycles – long-term, medium-term and short-term – could well be reversing at the same time. The long-term downtrend, as a result of non-performing assets, scams and overcapacity could be over; the medium-term downtrend that was caused by the ILFS crisis, select banks collapse and weakening NBFCs could well be over; the short-term downtrend on account of the pandemic has weakened following the introduction of the vaccine.
There is a possibility of each of these downtrends having played out, which could well lead to
a multi-year revival in capital investments. Besides, a change in the US leadership could result in a revival in global, trade, benefiting Indian exporters.
The Indian economy is projected to grow by more than 10% in FY22 as per various institutional estimates, making it one of the fastest-growing economies. India’s growth journey could be the result of a culmination of favourable tailwinds like consistent agricultural performance, flattening of the COVID-19 infection curve, increase in government spending, favourable reforms and an efficient roll-out of the vaccine, among others.
Global furniture industry overview
The global furniture market was estimated at USD 509.8 billion in 2020 and is anticipated to reach USD 650.7 billion by 2027. Increasing demand for commercial and residential spaces equipped with harm-resistant features is one of the major factors catalysing the demand for furniture. Asia-Pacific accounted for more than 48% of the overall revenue share and is expected to increase exponentially over the foreseeable future. This growth was catalysed by the rapid urbanisation and improving consumer socio-economic factors in the developing economies.
Residential application dominated the global furniture market in 2020 mainly due to the Covid-19 pandemic. There has also been a notable increase in the exports and
imports of luxurious furniture due to the rising disposable income and changing lifestyles, which in turn, is enhancing the demand for upholstered furniture.
The global furniture market is projected to grow at a CAGR of 12.91% between 2020-26. The North America and Asia-Pacific markets are set to witness attractive growth through 2026, which will be catalysed by the rapid expansion of the construction sector, rising investment in infrastructural projects and increasing disposable income of the populace. The construction of hotels, schools, colleges, hospitals and commercial office spaces could also be a growth driver for the furniture industry. (Source: Global Market Insights, Statista)
509.8(USD, billion)
Global furniture market value in
2020
650.7(USD, billion)
Estimated global furniture market
value in 2027
84 | Greenpanel Industries Limited Annual Report 2020-21 | 85
CORPORATE OVERVIEW STATUTORY STATEMENTS FINANCIAL STATEMENTS

25.12
73.66
50.2
84.43
(USD, billion) Global MDF market value in 2020
(USD, billion) Global plywood market value in 2020
(USD, billion) Estimated global MDF market value in 2027
(USD, billion) Estimated global plywood market value in 2027
Global MDF market overview
Global plywood market overview
Indian furniture market overview
The global MDF market was estimated at USD 25.12 billion in 2020. The growth was catalysed by the increasing building and construction activities in the developing countries. Over the past few years, the demand for MDF products have increased exponentially due to its sustainable nature as it is manufactured from recycled wood. The MDF market is projected to reach a market value of USD 50.2 billion by 2027,
growing at a CAGR of 9.6% during 2020-27. After the initial setback due to the COVID-19 lockdown, the residential and commercial segments are expected to bounce back and register a CAGR of 10.2% during 2020-27, whereas the new construction and replacement segment is projected to grow at a CAGR of 8.9% during the same period. (Source: GlobeNewsWire, Researchandmarkets)
The global plywood market was estimated to have reached a market value of USD 73.66 billion in 2020. Asia-Pacific accounts for the largest market share followed by the Middle-East and Africa. The growing trend of ready-made and easy-to-install furniture, lightweight nature and durability go hand-in-hand with the
changing urban lifestyle and are some of the main factors driving the demand for plywood products. The global plywood market is projected to reach a market value of USD 84.43 billion by 2027, growing at a CAGR of 2.3% during 2020-27. (Source: Globe News Wire, wboc)
The Indian domestic furniture market was estimated at USD 55 billion in 2020 and is projected to grow at a CAGR of 12.91% during 2020-24. The overall revenues generated from the furniture and homeware segment was estimated to have reached USD 1,313 million in 2020 and is expected to grow at a CAGR of 10.2% to reach a projected market volume of USD 2,131 million by 2025. Increased housing and commercial construction activities, coupled with the rising disposable income has been some of the key drivers of growth of the Indian furniture industry. The average revenue per user is also projected to reach USD 13.67 by 2025.
The furniture sector in India is grossly under-developed and the modernisation of this sector with machines and technology will enable it to capitalise on its massive untapped export potential. India’s furniture exports stood at USD 909 million in 2020. China is currently the leading exporter of furniture products, accounting for ~37.5% of global exports, followed by Germany, Poland, Italy and USA. Despite being the market leaders, their export growth is much slower when compared to the growth rates of the developing economies like Vietnam and India.
One of the biggest game-changers for the industry was the sudden emergence of the Indian work-
from-home (WFH) industry. The outbreak of the novel coronavirus and the resulting lockdown resulted in majority of the companies opting for the work-from-home model for their employees. This resulted in the immediate increase in the sales of products like sofa, study table and tables, chairs, beanbags, pouffes, ottoman and recliners, among others. Out of these, study tables and tables segment accounted for the largest share in the India WFH furniture market in 2020. The Indian WFH furniture market is estimated to have reached a value of USD 2.22 billion in FY21 and is projected to reach USD 3.49 billion by FY26. (Source: TPCI, Globe News Wire, Indianretailer.com)
Indian MDF market overview
Indian plywood sector overview
Growth drivers
India’s population is slowly shifting towards ready-made and easy-to-install furniture due to the rising disposable incomes and rapid urbanisation. This has led to the increased demand for medium density fibre (MDF) over plywood. The Indian MDF capacity is
projected to have increased to 7000 cbm per day, whereas the capacity utilisation was estimated around ~55-60%. About 80% of the global wood panel consumption is that of MDF and other types of particle board while plywood makes up only 15 to 20% of the
total mix. In India, the statistics are exactly inverted with plywood still dominating the market with 80 to 85% consumption. (Source: Ply Reporter, Global Woods Market Info)
The Indian plywood industry was estimated to have reached a market value of INR 222.5 billion in 2020. Over the years, the demand for plywood has increased significantly due to its structural strength and flexibility, resistance to chemicals and fire as well as insulation against sound and excessive heat. The result is that it
has emerged the preferred choice for doors, stairs, external cladding, flooring, framing, interior rails, balustrades, internal panels and timber joinery products. Based on this product acceptability, plywood market is expected to grow to a value of more than USD 55 billion by 2024. (Source: Ply Reporter)
Rising population: India’s population was estimated at 1.38 billion in 2020 and is projected to reach 1.52 billion by 2036 and overtake China as the world’s most populous country by 2031. This increase in population is projected to drive the demand for furniture over the coming years.
Urbanisation: India’s urban population was pegged at ~35% in 2020 and is projected to increase to ~40% by 2030; an addition of 225 million in urban areas. The additional population in urban areas is projected to drive the demand for furniture over the foreseeable future.
Growing replacement demand: The standard of living of the people has been constantly improving as a result of the rising disposable income; more people are adopting
modern ways of living. This has resulted in the shortening of the furniture replacement cycle, which, in turn, led to an increase in the demand for wood panel products.
Real estate growth: India’s services sector is a long-standing success story accounting for more than 50% of the country’s GDP (2020-21), catalyzing the growth of the realty sector. About 25% of the urban population lives in homes comprising two rooms or more; 45% live in homes of three rooms or less; about 16% live in single-room homes.
Commercial growth: India’s office furniture segment caters to the commercial and office spaces and consequent office space demand leading to the sustained growth of the country’s furniture industry.
Low average base rates: The average base rate released by RBI, which works as a benchmark interest rate for non-banking financial companies (NBFCs) and micro finance institutions (MFIs) for Q4 FY21 was 7.81%, which has decreased in comparison to 8.67% for Q4 FY21. This will help consumers to get home loans at cheaper rates resulting in higher demand for houses. This is further expected to have a positive impact on the furniture market in India.
Production-linked incentive: The Government of India has planned to offer H1.68 lacs crores to 10 sectors including furniture in order to boost the domestic manufacturing sector of the country. (Source: The wire, Economic Times, IBEF)
222.5(INR 222.5 billion) The
Indian plywood industry was estimated to have
reached a market value in 2020.
86 | Greenpanel Industries Limited Annual Report 2020-21 | 87
CORPORATE OVERVIEW STATUTORY STATEMENTS FINANCIAL STATEMENTS
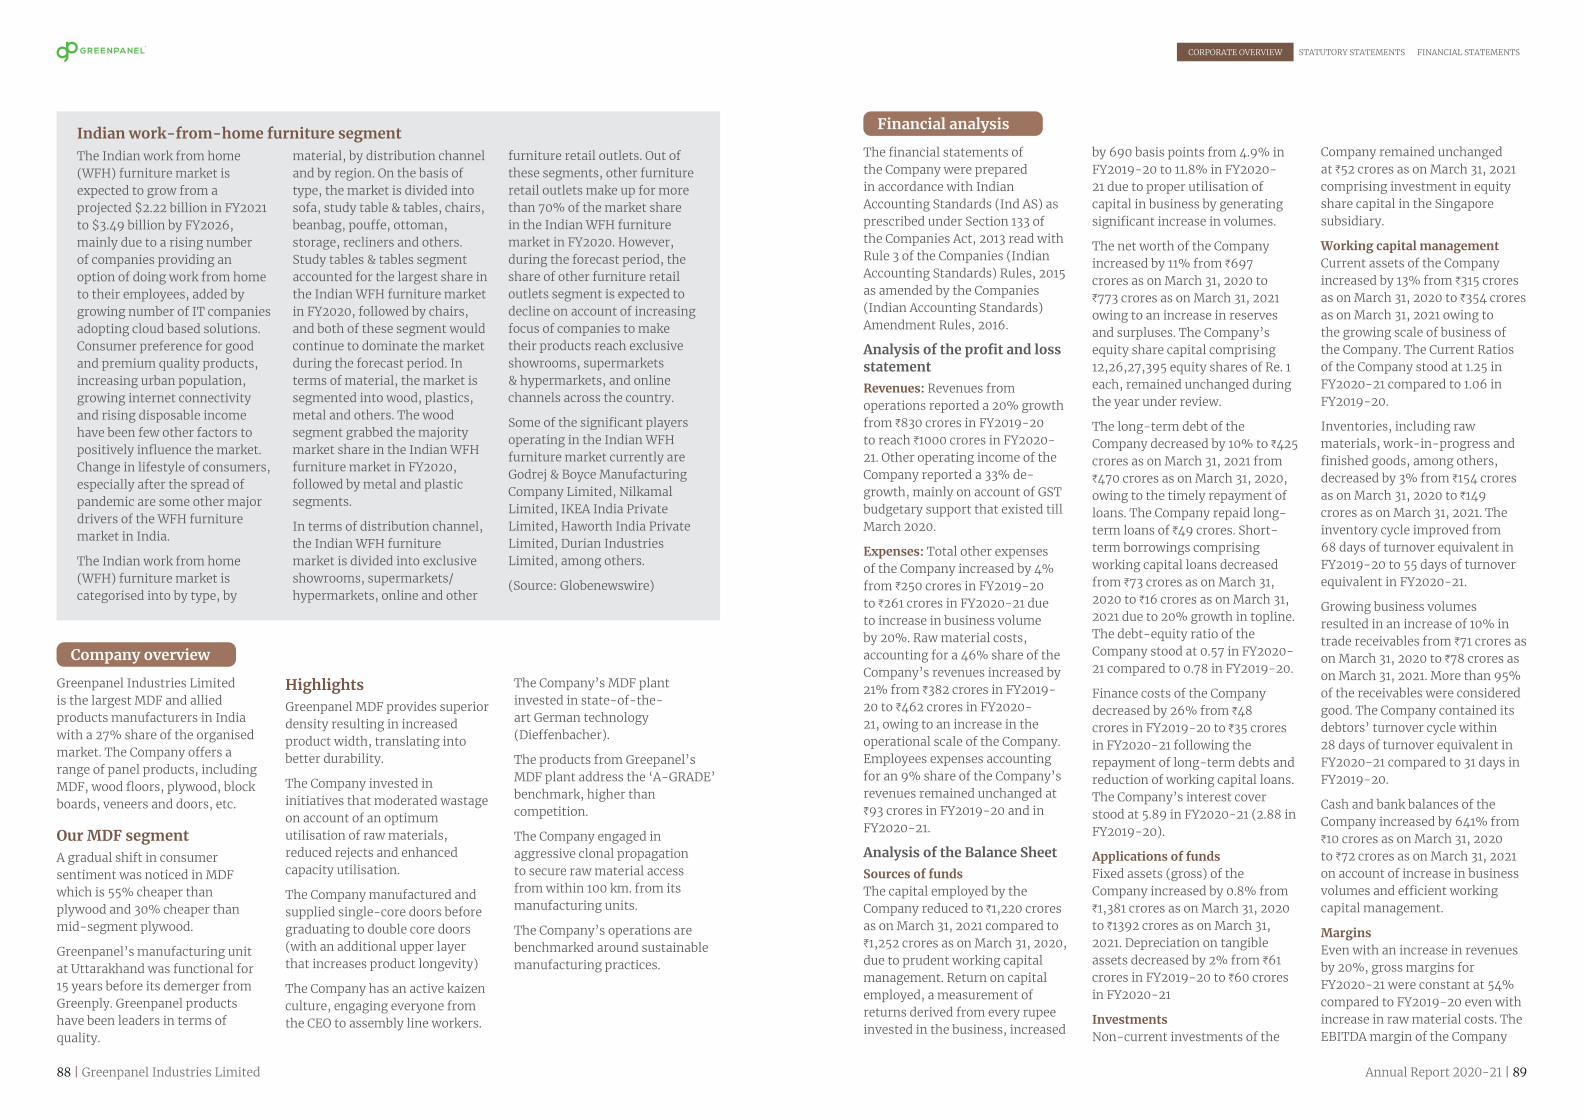
Indian work-from-home furniture segmentThe Indian work from home (WFH) furniture market is expected to grow from a projected $2.22 billion in FY2021 to $3.49 billion by FY2026, mainly due to a rising number of companies providing an option of doing work from home to their employees, added by growing number of IT companies adopting cloud based solutions. Consumer preference for good and premium quality products, increasing urban population, growing internet connectivity and rising disposable income have been few other factors to positively influence the market. Change in lifestyle of consumers, especially after the spread of pandemic are some other major drivers of the WFH furniture market in India.
The Indian work from home (WFH) furniture market is categorised into by type, by
material, by distribution channel and by region. On the basis of type, the market is divided into sofa, study table & tables, chairs, beanbag, pouffe, ottoman, storage, recliners and others. Study tables & tables segment accounted for the largest share in the Indian WFH furniture market in FY2020, followed by chairs, and both of these segment would continue to dominate the market during the forecast period. In terms of material, the market is segmented into wood, plastics, metal and others. The wood segment grabbed the majority market share in the Indian WFH furniture market in FY2020, followed by metal and plastic segments.
In terms of distribution channel, the Indian WFH furniture market is divided into exclusive showrooms, supermarkets/ hypermarkets, online and other
furniture retail outlets. Out of these segments, other furniture retail outlets make up for more than 70% of the market share in the Indian WFH furniture market in FY2020. However, during the forecast period, the share of other furniture retail outlets segment is expected to decline on account of increasing focus of companies to make their products reach exclusive showrooms, supermarkets & hypermarkets, and online channels across the country.
Some of the significant players operating in the Indian WFH furniture market currently are Godrej & Boyce Manufacturing Company Limited, Nilkamal Limited, IKEA India Private Limited, Haworth India Private Limited, Durian Industries Limited, among others.
(Source: Globenewswire)
Company overview
Greenpanel Industries Limited is the largest MDF and allied products manufacturers in India with a 27% share of the organised market. The Company offers a range of panel products, including MDF, wood floors, plywood, block boards, veneers and doors, etc.
Our MDF segmentA gradual shift in consumer sentiment was noticed in MDF which is 55% cheaper than plywood and 30% cheaper than mid-segment plywood.
Greenpanel’s manufacturing unit at Uttarakhand was functional for 15 years before its demerger from Greenply. Greenpanel products have been leaders in terms of quality.
HighlightsGreenpanel MDF provides superior density resulting in increased product width, translating into better durability.
The Company invested in initiatives that moderated wastage on account of an optimum utilisation of raw materials, reduced rejects and enhanced capacity utilisation.
The Company manufactured and supplied single-core doors before graduating to double core doors (with an additional upper layer that increases product longevity)
The Company has an active kaizen culture, engaging everyone from the CEO to assembly line workers.
The Company’s MDF plant invested in state-of-the-art German technology (Dieffenbacher).
The products from Greepanel’s MDF plant address the ‘A-GRADE’ benchmark, higher than competition.
The Company engaged in aggressive clonal propagation to secure raw material access from within 100 km. from its manufacturing units.
The Company’s operations are benchmarked around sustainable manufacturing practices.
Financial analysis
The financial statements of the Company were prepared in accordance with Indian Accounting Standards (Ind AS) as prescribed under Section 133 of the Companies Act, 2013 read with Rule 3 of the Companies (Indian Accounting Standards) Rules, 2015 as amended by the Companies (Indian Accounting Standards) Amendment Rules, 2016.
Analysis of the profit and loss statementRevenues: Revenues from operations reported a 20% growth from H830 crores in FY2019-20 to reach H1000 crores in FY2020-21. Other operating income of the Company reported a 33% de-growth, mainly on account of GST budgetary support that existed till March 2020.
Expenses: Total other expenses of the Company increased by 4% from H250 crores in FY2019-20 to H261 crores in FY2020-21 due to increase in business volume by 20%. Raw material costs, accounting for a 46% share of the Company’s revenues increased by 21% from H382 crores in FY2019-20 to H462 crores in FY2020-21, owing to an increase in the operational scale of the Company. Employees expenses accounting for an 9% share of the Company’s revenues remained unchanged at H93 crores in FY2019-20 and in FY2020-21.
Analysis of the Balance SheetSources of fundsThe capital employed by the Company reduced to H1,220 crores as on March 31, 2021 compared to H1,252 crores as on March 31, 2020, due to prudent working capital management. Return on capital employed, a measurement of returns derived from every rupee invested in the business, increased
by 690 basis points from 4.9% in FY2019-20 to 11.8% in FY2020-21 due to proper utilisation of capital in business by generating significant increase in volumes.
The net worth of the Company increased by 11% from H697 crores as on March 31, 2020 to H773 crores as on March 31, 2021 owing to an increase in reserves and surpluses. The Company’s equity share capital comprising 12,26,27,395 equity shares of Re. 1 each, remained unchanged during the year under review.
The long-term debt of the Company decreased by 10% to H425 crores as on March 31, 2021 from H470 crores as on March 31, 2020, owing to the timely repayment of loans. The Company repaid long-term loans of H49 crores. Short-term borrowings comprising working capital loans decreased from H73 crores as on March 31, 2020 to H16 crores as on March 31, 2021 due to 20% growth in topline. The debt-equity ratio of the Company stood at 0.57 in FY2020-21 compared to 0.78 in FY2019-20.
Finance costs of the Company decreased by 26% from H48 crores in FY2019-20 to H35 crores in FY2020-21 following the repayment of long-term debts and reduction of working capital loans. The Company’s interest cover stood at 5.89 in FY2020-21 (2.88 in FY2019-20).
Applications of fundsFixed assets (gross) of the Company increased by 0.8% from H1,381 crores as on March 31, 2020 to H1392 crores as on March 31, 2021. Depreciation on tangible assets decreased by 2% from H61 crores in FY2019-20 to H60 crores in FY2020-21
InvestmentsNon-current investments of the
Company remained unchanged at H52 crores as on March 31, 2021 comprising investment in equity share capital in the Singapore subsidiary.
Working capital managementCurrent assets of the Company increased by 13% from H315 crores as on March 31, 2020 to H354 crores as on March 31, 2021 owing to the growing scale of business of the Company. The Current Ratios of the Company stood at 1.25 in FY2020-21 compared to 1.06 in FY2019-20.
Inventories, including raw materials, work-in-progress and finished goods, among others, decreased by 3% from H154 crores as on March 31, 2020 to H149 crores as on March 31, 2021. The inventory cycle improved from 68 days of turnover equivalent in FY2019-20 to 55 days of turnover equivalent in FY2020-21.
Growing business volumes resulted in an increase of 10% in trade receivables from H71 crores as on March 31, 2020 to H78 crores as on March 31, 2021. More than 95% of the receivables were considered good. The Company contained its debtors’ turnover cycle within 28 days of turnover equivalent in FY2020-21 compared to 31 days in FY2019-20.
Cash and bank balances of the Company increased by 641% from H10 crores as on March 31, 2020 to H72 crores as on March 31, 2021 on account of increase in business volumes and efficient working capital management.
MarginsEven with an increase in revenues by 20%, gross margins for FY2020-21 were constant at 54% compared to FY2019-20 even with increase in raw material costs. The EBITDA margin of the Company
88 | Greenpanel Industries Limited Annual Report 2020-21 | 89
CORPORATE OVERVIEW STATUTORY STATEMENTS FINANCIAL STATEMENTS

increased by 420 basis points from 16.5% in FY2019-20 to 20.7% while the net profit margin of the Company increased by 560 basis points from 2.0% in FY2019-20 to 7.6% in FY2020-21. The EBITDA margin and net profit margin increased primarily due to surge in business volumes, superior product mix and reduction in wastage.
Our plywood segment The Company scaled the business
by reaching out to 600+ dealers
Its products are available in 209 cities and towns
Its plywood manufacturing unit
in Rudrapur is one of the most advanced in India
It works closely with our trade partners, engaging in uniform pricing for dealers
It arranged engagement programmes with architects, carpenters and influencers
It conducted in-house educational programmes to enhance product portfolio awareness
StrengthsThe Company uses 100% compost core stitched into plywood products, so that its bonding
remains unharmed even after the finished product has been extensively used.
It started using Southern Yellow Pine in blockboards, increasing product density and weight (from around 25 kgs to 32 kgs)
It operates pan-India; we are among the top players in the plywood sector
It works with an active pool of product influencers through the digital media
It is engaged in periodic shop-meets where its products are showcased to prospective buyers
Key numbers
Particulars FY2019-20 FY2020-21
EBITDA/Turnover (%) 16.5% 20.7%
Debt-equity ratio 0.78 0.57
Return on equity (%) 2.3% 9.8%
Book value per share (H) 56.8 63.1
Earnings per share (H) 1.32 6.21
Debtors Turnover (days) 31 28
Inventory Turnover (days) 68 55
Interest Coverage Ratio 2.88 5.89
Current Ratio 1.06 1.25
Gross Profit Margin (%) 54% 54%
Net Profit Margin (%) 2.0% 7.6%
Information technology
At Greenpanel, IT is viewed as a key business enabler. The Company invested significantly in information technology. Greenpanel invested in the SAP HANA platform to derive real-time data analysis. Greenpanel
implemented business intelligence tools to analyze data and create data visibility for informed decision-making. Greenpanel is using data leakage prevention to secure data. The Company is now adopting e-meetings over video
conferences through Microsoft Teams amid the Covid pandemic and plans to go ahead with this culture to minimize travel and administration costs.
Our IT initiatives
Human resources
Our HR Initiatives
Sustainability
SD WAN Implementation: This increases application performance and delivers a high quality user experience by using a centralised control function to securely and intelligently direct traffic across the WAN. This further results in increased business productivity and minimised downtime.
DMARC / BIMI Implementation: By Implementing BIMI, recipients
will see the Greenpanel logo next to their incoming email in their inbox and enhances safety. This makes it easy to identify spam and phishing messages and keep them out of Users’ inboxes.
SAP application: By implementing Order Collection Platform, customers will be able to place orders online, download invoices and account statements and check
their scheme eligibility based on available slabs. Payment Collection Automation helps the company to minimize manual payment posting errors and provide better service. Credit Note Automation makes it possible to automatically generate credit notes in SAP without manual intervention. The implementation of BI Reports helps users access data on real-time basis.
Greenpanel’s human resource practices helped reinforce market leadership. The Company invested in formal and informal training as well as on-the-job learning. It emphasised engagements
with employees by providing an enriched workplace, challenging job profile and regular dialogues with the management. The Company enjoys one of the highest employee retention rates in the
industry; it creates leaders from within, strengthening prospects. As on March 31, 2021, the Company’s employee base stood at 1816.
A 9 Box Matrix was implemented by the company for the entire organization (Performance versus Potential Matrix). It identified
critical talent, implemented PIP Process for smooth exits, issued Smart ID cards in the COVID-19 environment and relaunched its
e-magazine (Panel Talk and U Share Green Care).
The Company remains focused on its long-term goal to create an operational model revolving around economic and environmental sustainability. Greenpanel’s operational model
focuses on reducing unsustainable environmental footprint, practices of conservation and a moderated consumption of resources. The Company uses proactive measures, considerable investments in
modern manufacturing resources, sound methodologies and a heightened sense of awareness to achieve the target.
Internal control systems and their adequacy
Strong internal control procedures are implemented by the Company in order to commensurate with its size and operations. The guidelines are set by the Board of Directors who are responsible for the internal control system. They verify its adequacy,
effectiveness and application thereafter. The Company’s internal control system is designed to ensure management efficiency, measurability and verifiability, reliability of accounting and management information, compliance with all applicable laws
and regulations, and the protection of the Company’s assets. This is to timely identify and manage the Company’s operational, compliance-related, economic and financial risks.
90 | Greenpanel Industries Limited Annual Report 2020-21 | 91
CORPORATE OVERVIEW STATUTORY STATEMENTS FINANCIAL STATEMENTS

Risk management
Cautionary statement
Greenpanel’s risk management process aims at ensuring that management takes risk-informed decisions, with adequate consideration put into actual and prospective risks, including medium and long-term ones, within the framework of a comprehensive vision. All management and functional levels as well as project areas are strengthened by the company’s risk management policy to help
the management to evaluate the risk and mitigate it to achieve corporate targets and value.
The economic effects of the coronavirus pandemic turned out to be the furniture industry’s biggest risk faced in 2020. The lockdown affected the business severely causing major risks to the company (exports, retail, raw material procurement, capacity utilisation and distribution network). Decline in consumer
capacity and sentiment could turn out to be major factors affecting sectors related to Greenpanel’s business like real-estate, furniture retail, carpentry, hotel and hospitality, interior decoration firms, architecture firms etc. No clear guideline to mitigate such unforeseen risks has been prescribed, even as the Company expects to rebound following changes in trade and operational strategies.
This statement made in this section describes the Company’s objectives, projections, expectation
and estimations which may be ‘forward-looking statements’ within the meaning of applicable
securities laws and regulations.
Profile of the Board of DirectorsMr. Shiv Prakash MittalExecutive Chairman
He holds a Bachelor’s degree in Science from the University of Calcutta. He was one of the founders of Greenply Industries
Limited. He was associated with Kitply Industries Limited for 21 years. He has over 30 years of experience in the fields of
production and marketing in plywood, laminates, MDF and allied products.
Mr. Shobhan MittalManaging Director & CEO
He holds a Bachelor’s degree in Business Administration and was Joint Managing Director & CEO of Greenply Industries Ltd. He possesses over 10 years
of experience in Business Administration and Marketing Strategy. He was instrumental in setting up of the MDF units of the Company at Pantnagar
and Chittoor. After successfully streamlining the Pantnagar unit, he is involved in streamlining operations at the Chittoor unit.
Mr. Salil Kumar BhandariIndependent Director
He is FCA qualified and graduated from Shri Ram College of Commerce, Delhi University, and has a Diploma in Business Administration from the All India Council for Management Studies, Chennai. He is Founder and Managing Partner of BGJC & Associates LLP, an audit and management consulting firm
in New Delhi. Earlier he held positions in various organisation: Former President of the PHD Chamber of Commerce & Industry, Chairperson of Society for Integrated Development of Himalayas and Child Fund India Member of Task Force – Commission on Centre State Relations, Govt. of India. He was
a Managing Committee member at ASSOCHAM. He was a Member of Advisory Committee, Dept. of Company Affairs, Govt. of India. Presently, Mr. Bhandari, besides being on the Board of Indian Institute of Management, Indore, also holds Directorships in several companies and their statutory committees.
Mr. Arun Kumar SarafIndependent Director
He is a Chartered Accountant by qualification, has been practicing as a Tax Consultant for over 33 years. He had been managing
Income Tax-related matters for over 250 companies across Kolkata, Bangalore and Mumbai. Besides, he has also been appointed as a
Director in Loyalie IT-Solutions Private Limited.
92 | Greenpanel Industries Limited Annual Report 2020-21 | 93
CORPORATE OVERVIEW STATUTORY STATEMENTS FINANCIAL STATEMENTS

Mr. Mahesh Kumar JiwrajkaIndependent Director
He belonged to the Indian Forest Service, Maharashtra Cadre (March 1, 1977 to March 31, 2009) and took voluntary retirement from March 31, 2009. Among various positions, he also was the Inspector General of Forests & Head North-East Cell, Ministry of Environment & Forests, Government of India. In his many years of experience, besides handling various important
issues dealing with various aspects of environment, he also held the following positions: Member Secretary, High Power Committee for the North Eastern Region, constituted by the Hon’ble Supreme Court of India (1998 to 2016). He was a member of the Special Investigation Team, Constituted by the Hon’ble Supreme Court of India (February 13, 2000 to 2016).
He was Member Secretary, Central Empowered Committee, constituted by the Hon’ble Supreme Court of India (May 9, 2002 to 2016). He was Member, CAMPA, constituted by the Hon’ble Supreme Court (May 2005 to 2016). Presently, Mr. Jiwrajka is the proprietor of SRDA Advisory Services, specializing in financial, legal and environment consultancy.
Ms. Sushmita SinghaIndependent Director
She is a post graduate in English from the Patna University, has done a Diploma in Urban Town Planning from the Human Settlement Management Institute, New Delhi, as well as a certification course in Enhancement of Managerial Capability from the Indian Institute of Management, Lucknow. Besides holding Directorships in several companies and their committees, Ms. Singha has also been actively involved in
several social organisations and Government initiatives: Former Secretary General of the PHD Chamber of Commerce & Industry and Former Member of the UN Task Force-Millennium Development Committee for Water and Sanitation. She has been a Member of the Task Force on Tenancy Rights, Ministry of Urban Development, Government of India. She was a Member of the National Tourism Advisory Council, Ministry
of Tourism, Government of India. She is a Former Member of the State Supervisory Board, Department of Health, Government of Uttar Pradesh. She received awards from the Islamic Republic of Afghanistan as well as Sri Lanka. She is also on the Advisory Board of BJGC & Associates LLP. Presently, Ms. Sushmita Singha is associated with NGOs like My Anchor Foundation, Sapna NGO, and INTACH etc. in various capacities.
94 | Greenpanel Industries Limited Annual Report 2020-21 | 95

96 | Greenpanel Industries Limited Annual Report 2020-21 | 97
Corporate overview Statutory StatementS FinanCial StatementS
Directors’ Report
Your Directors have pleasure in presenting their 4th Annual Report on the business and operations of the Company along with the Audited Accounts of the Company for the Financial Year ended March 31, 2021.
Financial highlightsThe financial performance of your Company, for the year ended March 31, 2021 is summarised below:
(H in lacs)
Particulars 2020-21 2020-21 2019-20 2019-20Standalone Consolidated Standalone Consolidated
Revenue from Operations 1,01,997.40 1,02,075.54 85,979.39 87,656.62Profit before finance charges, Tax, Depreciation/Amortization (PBITDA)
20,739.91 20,681.31 13,733.24 14,000.26
Less: Finance Charges 3,520.08 3,721.00 4,766.74 4,828.94Profit before Depreciation/Amortization (PBTDA)
17,219.83 16,960.31 8,966.50 9,171.32
Less: Depreciation 6,386.61 6,863.17 6,537.86 6,916.54Net Profit before Exceptional items and Tax 10,833.22 10,097.14 2,428.64 2,254.78Exceptional items - - 1,083.74 1,083.74Net Profit before Tax (PBT) 10,833.22 10,097.14 1,344.90 1,171.04Provision for tax / Tax expenses 3,216.30 3,216.30 (275.02) (275.02)Profit/(Loss) after Tax (PAT) 7,616.92 6,880.84 1,619.92 1,446.06Balance brought forward from earlier year 6,027.48 4,898.31 4,407.56 3,452.25Balance carried to Balance Sheet 13,644.40 11,774.15 6,027.48 4,898.31
Result of operations and the state of Company’s affairsDuring the year under review, your Company has achieved revenue from operation of H101,997.40 lacs as against H85,979.39 lacs in the previous year, resulting increase in revenue by 19% compared to previous year. Profit after tax for the financial year 2020-21 was H7616.92 lacs as against H1,619.92 lacs in the previous year, resulting increase in profit by 370% compared to previous year.
Exports during the year 2020-21 was H11,986.12 lacs as against H13,633.88 lacs during the previous year, resulting decrease in export by 12% due to COVID-19 and adverse market situation. Your Company is
continuously trying to locate new export markets for its products and see good potential for growth in the exports business. As per the consolidated financial statements, the revenue from operations and profit after tax for the financial year 2020-21 were H102,075.54 lacs and H6,880.84 lacs, respectively as against H87,656.62 lacs and H1,446.06 lacs, respectively in the previous year, resulting increase in consolidated revenue and profit by 16% and 376% respectively, compared to previous year.
The Company has pioneering presence in India and has played a missionary role in creating a pan India market for MDF products. Being the leader in producing and dealing in MDF products your Company is the preferred partner of choice for a large number of real estate
For financial year 2020-21
projects, offices and home builders. Your Company continues to focus on having a comprehensive product range, servicing clients at every point of the price spectrum and to retain and reinforce its market share under organised sector with a pan-India distribution network. Your Company is continuously expending its dealer network at different parts of country and is present across different price points to cater to the needs of all customers across the high-end, mid-market and value-for-money segments. The Company’s pan-India distribution network ensures easy availability of products in almost every part of India.
IMPACT OF COVID-19The Second wave of COVID-19 has hit the country like tsunami and has badly affected the human life, medical facilities and economy of the Country. The situation became grave in April 2021 resulting lockdown by many states governments in India. The sudden spike of COVID cases pushed the Indian Economy into a technical recession due to deadly pandemic wave.
Employee safety remained the Company’s priority. Employees of the Company were allowed to work from home during the lockdown. The Company has taken various measures to control COVID-19 at its plants and workplaces such as sensitization, thermal and oxygen level checking of employees reporting for duty. The Company has provided adequate Group Mediclaim Insurance cover for treatment of employees and their dependent family members. Proper Social distancing is being maintained in all the offices and production units of the Company.
Outlook and expansionThe Company’s outlook remains favourable on account of its product integration capabilities, increasing brand visibility, market and dealership expansion and the continuous support from its stakeholders. Wood panel market is one of the major verticals of the interior infrastructure, comprising materials used in building furniture. Such materials include plywood, engineered wood panels and decorative surface products. Your Company is currently operating primarily in the structural sphere of interior infrastructure domain with almost all the products in its basket catering to the structural needs of the customers. The demand for readymade furniture, manufactured with engineered panels like medium density fibreboards (MDF), is growing. Demand for personalised furniture / MDF product is expected to rise due to increase of work from home facilities being provided by IT and other companies. The real estate industry is one of the most significant growth drivers for the plywood sector and the demand of Company’s products is expected to surge after resumption of work in stalled projects. Your company is also focused on the value-added products to improve the margin.
An increasing shift towards the organised sector is foreseen in the industry. Growing customer awareness, brand consciousness and a plethora of choices at the disposal of consumers is encouraging product innovation and quality focus from the organised players. However, high price differentiation between the unorganised and organised segment persists.
Indian furniture industry is one of the largest furniture markets in the world. It is primarily driven by a rising national population, substantial middle-class population, rapid urbanisation, growing replacement demand, Real Estate growth, Commercial Growth, favourable demographics, increasing per capita income, improving lifestyle, and growing nuclear families. This will encourage strong demand growth for plywood, MDF and allied products. Reconstituted wood products, such as plywood, board and medium density fibreboards are likely to be used increasingly by consumers, real estate developers, furniture makers, hospital, railways, defence and hospitality industries are among other users. Innovations and use of technology shall help the wood industry to grow profitably, and leverage opportunities in the future. The current pandemic situation fueled work from home furniture market. Going forward, there is an increasing shift being witnessed towards the organised sector owing to brand and quality awareness. With wider choice, product innovation and warranty, being offered by organised players, customers are putting more focus on this segment.
Your Directors are confident of achieving better results in the coming years.
Subsidiary and Joint VentureAs on March 31, 2021, your Company has one overseas wholly owned subsidiary viz. Greenpanel Singapore Pte. Ltd., Singapore, engaged in the business of trading and marketing of panel products, wooden flooring & allied products.
Change(s) in the nature of businessThere has been no change in the nature of business of the Company during the year under review.
Consolidated financial statementsFor the period under review, the Company has consolidated the financial statements of its wholly owned subsidiary viz. Greenpanel Singapore Pte. Ltd., Singapore. In accordance with third proviso of Section 136(1) of the Companies Act, 2013, the Annual Report of the Company, containing therein its standalone and the consolidated financial statements has been placed on the website of the Company, www.greenpanel.com. Further, as per fourth proviso of the said section, audited annual accounts of the subsidiary company has also been placed on the website of the Company, www.greenpanel.com. Shareholders interested in obtaining a
98 | Greenpanel Industries Limited Annual Report 2020-21 | 99
Corporate overview Statutory StatementS FinanCial StatementS
copy of the audited annual accounts of the subsidiary company may write to the Company Secretary at the Company’s registered office. Pursuant to Section 129(3) of the Companies Act 2013 read with Rule 5 of the Companies (Accounts) Rules, 2014, A statement containing salient features of the financial statements of subsidiary in form AOC -1 is annexed to this Report.
Credit RatingOur strong commitment towards financial discipline and continuous performance growth has also translated into upgrade in our external credit rating by CARE Ratings Limited for long term bank facilities from “CARE BBB+” to “CARE A-” with stable outlook and for short term bank facilities from “CARE A2” to “CARE A2+” with stable outlook.
Additionally, ICRA Limited assigned “ICRA A-” with stable outlook for long term bank facilities and “ICRA A2+” with stable outlook for short term bank facilities.
DividendTo conserve the resources of the Company, the Board has not recommended any dividend for the financial year 2020-21.
Transfer to ReservesYour Directors do not propose to transfer any amount to General Reserve.
Change in Share CapitalDuring the year under review, there was no change in Share Capital of the Company.
Directors and Key Managerial PersonnelIn accordance with the provisions of the Companies Act, 2013 and the Articles of Association of the Company, Mr Shiv Prakash Mittal [DIN: 00237242] Executive Chairman, shall retire by rotation at the ensuing Annual General Meeting and being eligible offers himself for re- appointment.
None of the Directors of your Company is disqualified under the provisions of Section 164(2)(a) & (b) of the Companies Act, 2013 and a certificate dated May 7, 2021, received from M/s. T. Chatterjee & Associates, Company Secretaries certifying that none of the Directors on the Board of the Company have been debarred or disqualified from the appointment or continuing as Directors of the Companies by SEBI/Ministry of Corporate Affairs or any such statutory authority is annexed to the Corporate Governance Report.
Declaration by Independent DirectorsThe Independent Directors of the Company i.e. Mr Salil Kumar Bhandari [DIN: 00017566], Ms Sushmita Singha [DIN: 02284266], Mr Mahesh Kumar Jiwrajka [DIN: 07657748] and Mr Arun Kumar Saraf [DIN: 00087063] have given their declarations to the Company for the financial year 2020-21 that they meet the criteria of
independence as provided in Section 149(6) of the Companies Act 2013 and Regulation 16 of the SEBI (Listing Obligations and Disclosure Requirements) Regulations, 2015.
Meetings of the Board of DirectorsFive (5) Board Meetings were held during the financial year ended March 31, 2021. The details of the Board Meetings about their dates and attendance of each of the Directors thereat have been provided in the Corporate Governance Report.
Performance EvaluationPursuant to the provisions of the Companies Act, 2013 and other applicable provisions, the Independent Directors in their meeting held on January 27, 2021 have evaluated the performance of Non-Independent Directors of the Company, Board as a whole and assessed the quality, quantity and timeliness of flow of information between the Company’s Management and the Board. The Board has carried out the Annual Performance Evaluation of the Directors individually as well as evaluation of the working of the Board as a whole. The criteria for evaluation are outlined below:
a. For Non Executive Independent Directors: y Knowledge and Skills
y Professional conduct
y Duties, role and functions
y Rendering independent and unbiased opinion and judgements
y Attendance and active participation in meetings of Board
y Assistance in implementing corporate governance practices
y Updation of skills and knowledge
y Information regarding external environment
y Understanding and assessment of Risk Management
y Raising of concerns, if any, to the Board
y Study of agenda in depth prior to Meeting
y Contribution towards the formulation and implementation of strategy for achieving the goals of the Company
b. For Executive Directors: y Performance as Member
y Working expertise
y Evaluating Business Opportunity and analysis of Risk Reward Scenarios
y Professional Conduct and Integrity
y Sharing of Information with the Board
y Attendance and active participation in the Board Meetings and Meetings of Members of the Company
y Whether difference of opinion was voiced in the meeting
y Assistance in implementing corporate governance practices
y Review of integrity of financial information and risk management
y Updation of skills and knowledge
y Information regarding external environment
y Raising of concerns, if any, to the Board
y Ensures implementation of decisions of the Board
y Ensures compliance with applicable legal and regulatory requirements
y Alignment of Company’s resources and budgets to the implementation of the organization’s strategic plan
y Creativity and innovations in creating new products
y Understanding of the business and products of the Company
c. For Committees of the Board: y Adequate and appropriate written terms of
reference
y Volume of business handled by the committee set at the right level.
y Whether the committees work in an ‘inclusive’ manner
y Effectiveness of the Board’s Committees with respect to their role, composition and their interaction with the Board
y Are the committees used to the best advantage in terms of management development, effective decision, etc.
y Attendance and active participation of each member in the meetings
y Review of the action taken reports and follows up thereon
d. For Board of Directors as a whole: y Setting of clear performance objectives and how
well it has performed against them
y Contribution to the testing and development and strategy
y Contribution to ensuring robust and effective risk management
y Composition of the board appropriate with the right mix of knowledge and skills sufficient to maximise performance in the light of future strategy
y Effectiveness of inside and outside Board relationship
y Responding to the problems or crisis that have emerged
y Updation with latest developments in regulatory environments and the market in which the Company operates
y Role and functioning of the Board on the matters
y Framing Policies and procedures for statutory compliance, Internal Financial Control and safeguard the interest of the Company
The Directors have expressed their satisfaction with the evaluation process.
Familiarization ProgrammeThe details of the familiarization programme undertaken during the year have been provided in the Corporate Governance Report along with the web link thereof.
Auditors and their report(i) Statutory Auditor:The Shareholders of the Company at their 1st Annual General Meeting held on August 28, 2018 had approved appointment of M/s. S.S. Kothari Mehta & Co., Chartered Accountants (ICAI Firm Registration No. 000756N) as the Statutory Auditors of the Company to hold office for a term of 5 (five) consecutive years from the conclusion of 1st Annual General Meeting, until the conclusion of the 6th Annual General Meeting to be held in the calendar year 2023.
The Statutory Auditors’ Report on the Standalone and Consolidated Financial Statements of the Company for the financial year ended March 31, 2021 forms part of this Annual Report. The Notes on Financial Statements referred to in the Auditors’ Report are self-explanatory and, therefore, do not call for further clarification. There is no qualification, reservation, adverse remark or disclaimer by the Statutory Auditors in their Statutory Audit Report and hence, no explanation or comments of the Board is required in this regard.
(ii) Cost Auditor:During the year under review, cost audit was not applicable to the Company.
(iii) Secretarial Auditor:The Board of Directors of the Company at their meeting held on August 06, 2020 had reappointed M/s. T. Chatterjee & Associates, Practicing Company Secretaries having office at 152, S.P. Mukherjee Road, Kolkata-700026 for conducting the Secretarial Audit of the Company for the financial year 2020-21. The Secretarial Audit Report in form MR-3 for the financial year ended March 31, 2021 is annexed herewith as “Annexure-III”

100 | Greenpanel Industries Limited Annual Report 2020-21 | 101
Corporate overview Statutory StatementS FinanCial StatementS
(iv) Internal Auditor:The Board of Directors of the Company at their meeting held on November 07,2019 had appointed M/S KRA & Associates, Chartered Accountant, having office at FF-114, Vipul Business Park, Sohna Road, Sector-48, Gurgaon-122009 as Internal Auditor of the Company to carry out internal audit of branches, offices and manufacturing units of the Company. The Audit Committee periodically reviews the Internal Audit Report.
Audit CommitteeAs on March 31, 2021, the Audit Committee of the Company comprises of four Non-Executive Independent Directors viz. Mr Salil Kumar Bhandari as Chairman, Mr Mahesh Kr. Jiwrajka, Mr Arun Kumar Saraf and Ms Sushmita Singha and one Executive-Promoter Director Mr Shiv Prakash Mittal as members. The Committee inter-alia reviews the Internal Control System, reports of Internal Auditors, compliance of various regulations and evaluates the internal financial controls and risk management system of the Company. The Committee also reviews at length the Financial Statements and Financial Results before they are placed before the Board. The terms of reference of the Committee and the details of the Committee meetings are provided in the Corporate Governance Report.
Nomination and Remuneration CommitteeAs on March 31, 2021, the Nomination & Remuneration Committee of the Company comprises of three Non-Executive Independent Directors viz. Mr Salil Kumar Bhandari as Chairman, Mr Mahesh Kumar Jiwrajka and Ms Sushmita Singha as members. The terms of reference of the Committee and the details of the Committee meetings are provided in the Corporate Governance Report. The summary of Remuneration Policy of the Company prepared in accordance with the provisions of Section 178 of the Companies Act 2013 read with Part D of Schedule II of the SEBI (Listing Obligations and Disclosure Requirements) Regulations, 2015 are provided in the Corporate Governance Report. This Policy applies to all the “Executives” of the Company and extends to the remuneration of Non-Executive Directors, including principles of selection of the Independent Directors of the Company. The Board of Directors has adopted the remuneration policy at the recommendation of the Committee. This Policy shall be valid for all employment agreements entered into after the approval of the Policy and for changes made to existing employment agreements thereafter. The Remuneration Policy is uploaded on the website of the Company. The weblink is https://www.greenpanel.com/wp-content/uploads/2019/08/Remuneration-Policy.pdf.
Stakeholders Relationship CommitteeAs on March 31, 2021, the Stakeholders Relationship Committee of the Company comprises of one Non-Executive Independent Director viz. Mr Mahesh Kumar Jiwrajka as Chairman and two Promoter Directors viz. Mr Shiv Prakash Mittal and Mr Shobhan Mittal as members. The terms of reference of the Committee and the details of the Committee meetings are provided in the Corporate Governance Report.
Vigil MechanismPursuant to the provisions of Section 177(9) & (10) of the Companies Act 2013 and the SEBI (Listing Obligations and Disclosure Requirements) Regulations 2015, a Vigil Mechanism Policy, for Directors & employees to report genuine concerns has been implemented. The Policy safeguard the whistle blowers to report the concerns or grievance and provides direct access to the Chairman of the Audit Committee. The Policy is available on the website of the Company and the weblink of the same has been provided in the Corporate Governance Report.
Extract of the Annual ReturnThe extract of Annual Return as required under section 134(3)(a) of the Companies Act, 2013 read with Rule 12(1) of the Companies (Management and Administration) Rules, 2014 in Form No. MGT-9, is annexed to this Report as “Annexure-V”.
Material changes and commitmentsThere have been no material changes and commitments affecting the financial position of the Company since the close of financial year i.e. since March 31, 2021 and to the date of this report.
Significant and material orders passed by the Regulators / Courts / Tribunals impacting the going concern status and the Company’s operations in futureDuring the period under review, no significant and material order has been passed by any Regulators/Courts/Tribunals impacting the going concern status and the Company’s operation in future.
Internal financial controlsYour Company has, in all material respects, an adequate internal financial controls system over financial reporting and such internal financial controls over financial reporting are operating effectively based on the internal control over financial reporting criteria established by the Company considering the essential components of internal control. Your Company had laid down guidelines, policies, procedures, and structure for appropriate internal financial controls across the company. These control processes enable and ensure orderly and efficient conduct of the Company’s
business, including safeguarding of assets, prevention and detection of frauds and errors, the accuracy and completeness of the accounting records and timely preparation & disclosure of financial statements. Review and control mechanisms are built in to ensure that such control systems are adequate and operating effectively.
A report on the internal financial controls under clause (i) of sub-section 3 of Section 143 of the Companies Act, 2013 issued by M/s. S.S. Kothari Mehta & Co., Chartered Accountants (ICAI Firm Registration No. 000756N), Statutory Auditors of the Company is attached with their Independent Auditor’s report and the same is self-explanatory.
Corporate Social ResponsibilityThe Corporate Social Responsibility Committee has formulated and recommended to the Board, a Corporate Social Responsibility Policy describing the activities to be undertaken by the Company, which has been approved by the Board and is available on the Company’s website. The weblink is https://www.greenpanel.com/wp-content/uploads/2021/04/Corporate-Social-Responsibility-Policy.pdf
The composition of the Corporate Social Responsibility Committee is provided in the Annual Report on CSR Activities. The Average Net Profits of the Company for the last three financial years is H760.25 lacs and accordingly the prescribed CSR expenditure during the year under review shall not be less than H15.21 lacs (i.e. 2% of the Average Net Profits of the Company for the last three financial years). During the year under review the Company spent an amount of H18.63 lacs on its CSR activities as against H15.21 lacs required under Section 135 of the Companies Act, 2013, which shows its commitment towards social welfare over and above the legal requirements. The Annual Report on CSR Activities is annexed as “Annexure-IV” to this Report.
InsuranceYour Company’s properties, including building, plant, machineries and stocks, among others, are adequately insured against risks.
Loans, Guarantees or Investments under Section 186 of the Companies Act, 2013The Company has not granted any loans/advances, given guarantees and made investments during the year under review under the provisions of Section 186 of the Companies Act, 2013.
DepositsDuring the financial year 2020-21, the Company did not invite or accept any deposits from the public under Section 76 of the Companies Act, 2013.
Related Party TransactionsThere are no materially significant related party transactions made by the Company which may have potential conflict with the interest of the Company. Related party transactions that were entered into during the year under review were on arm’s length basis and were in ordinary course of business. The particulars of material related party transactions which were entered into on arm’s length basis are provided in Form AOC-2 as required under Section 134(3)(h) of the Companies Act, 2013 read with Rule 8(2) of the Companies (Accounts) Rules, 2014 which is annexed herewith as “Annexure-II”. Further, suitable disclosure as required by the Accounting Standards (Ind AS 24) has been made in the notes to the Financial Statements. The Board has approved a Policy for material related party transactions which has been uploaded on the website of the Company. The weblink is https://www.greenpanel.com/wp-content/uploads/2021/04/Related-Party-Transactions-Policy.pdf
Corporate Governance ReportA detailed Report on Corporate Governance for the financial year 2020-21, pursuant to the SEBI (Listing Obligations and Disclosure Requirements) Regulations, 2015 along with Auditor’s Certificate on compliance with the conditions of Corporate Governance is annexed to this report.
Management Discussion and Analysis ReportThe Management Discussion and Analysis Report for the financial year 2020-21, pursuant to the SEBI (Listing Obligations and Disclosure Requirements) Regulations, 2015 is given as a separate statement in the Annual Report.
CEO and CFO CertificationPursuant to Regulation 17(8) of the SEBI (Listing Obligations and Disclosure Requirements) Regulations, 2015, the CEO and CFO certification as specified in Part B of Schedule II thereof is annexed to the Corporate Governance Report.
Code of Conduct for Directors and Senior Management PersonnelThe Code of Conduct for Directors and Senior Management Personnel has been uploaded on the website of the Company. The Managing Director & CEO of the Company has given a declaration that all Directors and Senior Management Personnel concerned has affirmed compliance with the Code of Conduct with reference to the financial year ended on March 31, 2021. The declaration is annexed to the Corporate Governance Report.

102 | Greenpanel Industries Limited Annual Report 2020-21 | 103
Corporate overview Statutory StatementS FinanCial StatementS
Disclosure regarding compliance of applicable Secretarial StandardsThe Company has complied with all the mandatory applicable secretarial standards issued by The Institute of Company Secretaries of India and approved by the Central Government under Section 118(10) of the Companies Act 2013.
Conservation of energy, technology absorption, foreign exchange earnings and outgoThe information required under section 134(3)(m) of the Companies Act, 2013 read with Rule 8(3) of the Companies (Accounts) Rules, 2014, is annexed to this Report as “Annexure -VI”.
Directors’ Responsibility StatementIn terms of provisions of Section 134(3)(c) read with Section 134(5) of the Companies Act, 2013, your directors state that:
(i) in the preparation of the annual financial statements for the financial year ended March 31, 2021, the applicable accounting standards have been followed along with proper explanation relating to material departures, if any;
(ii) the directors have selected such accounting policies and applied them consistently and made judgments and estimates that are reasonable and prudent so as to give a true and fair view of the state of affairs of the Company at the end of the financial year and of the profit of the Company for that period;
(iii) the directors have taken proper and sufficient care for the maintenance of adequate accounting records in accordance with the provisions of this Act for safeguarding the assets of the Company and for preventing and detecting fraud and other irregularities;
(iv) the directors have prepared the annual accounts on a going concern basis;
(v) the directors have laid down internal financial controls to be followed by the Company and that such internal financial controls are adequate and were operating effectively and
(vi) the directors have devised proper systems to ensure compliance with the provisions of all applicable laws and that such systems were adequate and operating effectively.
Fraud ReportingThere have been no frauds reported by the Auditors of the Company to the Audit Committee or the Board of Directors under sub-section (12) of section 143 of the Companies Act, 2013 during the financial year 2020-21.
Constitution of Internal Complaints CommitteePursuant to the requirement under Sexual Harassment of Women at Workplace (Prevention, Prohibition and Redressal) Act 2013, an Internal Complaints Committee has been duly constituted by the Company and the composition of the same is disclosed in the Policy on Prevention of Sexual Harassment at Workplace, which is uploaded on the website of the Company under the weblink https://www.greenpanel.com/wp-content/uploads/2020/08/POSH_Policy_Greenpanel.pdf
Disclosures under Sexual Harassment of Women at Workplace (Prevention, Prohibition & Redressal) Act, 2013No case was filed under the Sexual Harassment of Women at Workplace (Prevention, Prohibition & Redressal) Act, 2013 during the year under review.
Particulars of employeesThe information required under section 197(12) of the Companies Act, 2013 read with Rule 5(2) and 5(3) of the Companies (Appointment and Remuneration of Managerial Personnel) Rules, 2014 is annexed to this Report as “Annexure-VII”.
AcknowledgementsYour Directors place on record their sincere thanks and appreciation for the continuing support of financial institutions, consortium of banks, vendors, clients, investors, Central Government, State Governments and other regulatory authorities. The Directors also place on record their heartfelt appreciation for the commitment and dedication of the employees of the Company across all the levels who have contributed to the growth and sustained success of the Company.
For and on behalf of the Board of Directors
Shiv Prakash MittalPlace: Kolkata Executive Chairman Date: May 14, 2021 DIN: 00237242
Annexure to the Director’s Report
ANNEXURE -I
Form AOC-1Statement containing salient features of the financial statement of Subsidiaries/Associate Companies/Joint Ventures
[Pursuant to first proviso to sub-section (3) of section 129 read with rule 5 of Companies (Accounts) Rules, 2014]
Part “A”: Subsidiaries (H in lacs)
1. Name of the subsidiary Greenpanel Singapore Pte. Ltd., Singapore2. Reporting period for the subsidiary 01.04.2020 - 31.03.20213. Reporting currency and Exchange rate as on the last date of
the relevant Financial year USD / INR = 73.1050
4. Share Capital 5,665.645. Reserves & Surplus 4,728.876. Total Assets 3,441.107. Total Liabilities 2,504.338. Investments Nil9. Turnover 1,250.3410. Profit / (Loss) before taxation (including Other
Comprehensive Income)(726.30)
11. Provision for taxation Nil12. Profit / (Loss) after taxation (including Other
Comprehensive Income)(726.30)
13. Proposed Dividend Nil14. % of shareholding 100%
Notes:1. Names of subsidiaries which are yet to commence operations – None
2. Names of subsidiaries which have been liquidated or sold during the year – None
Part B: Statement Pursuant to Section 129(3) of the Companies Act, 2013 related to Associate Companies and Joint Ventures:The Company has no Associate or Joint Venture Company.
For and on behalf of the Board of Directors
Shiv Prakash Mittal Shobhan MittalExecutive Chairman Managing Director & CEO (DIN: 00237242) (DIN: 00347517)
V.Venkatramani Lawkush PrasadChief Financial Officer Company Secretary & AVP-Legal
Place: Kolkata Date: May 14, 2021
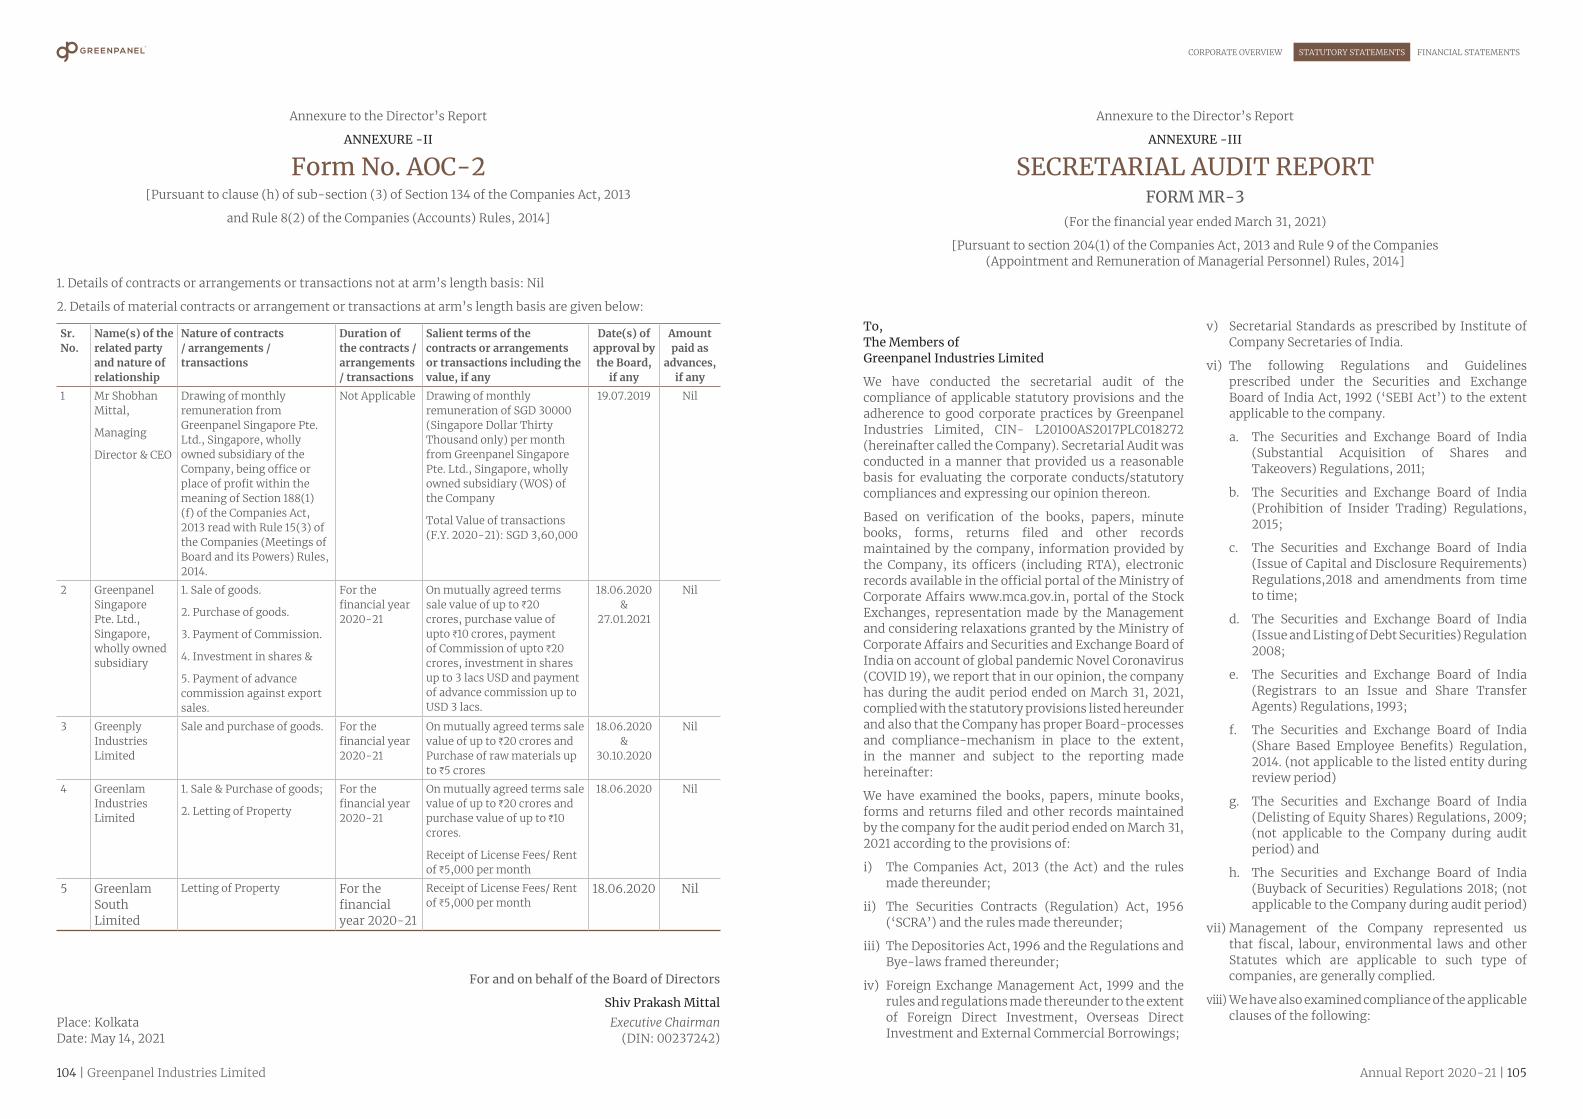
104 | Greenpanel Industries Limited Annual Report 2020-21 | 105
Corporate overview Statutory StatementS FinanCial StatementS
Annexure to the Director’s Report
ANNEXURE -II
Form No. AOC-2[Pursuant to clause (h) of sub-section (3) of Section 134 of the Companies Act, 2013
and Rule 8(2) of the Companies (Accounts) Rules, 2014]
1. Details of contracts or arrangements or transactions not at arm’s length basis: Nil
2. Details of material contracts or arrangement or transactions at arm’s length basis are given below:
Sr. No.
Name(s) of the related party and nature of relationship
Nature of contracts / arrangements / transactions
Duration of the contracts / arrangements / transactions
Salient terms of the contracts or arrangements or transactions including the value, if any
Date(s) of approval by the Board,
if any
Amount paid as
advances, if any
1 Mr Shobhan Mittal,
Managing
Director & CEO
Drawing of monthly remuneration from Greenpanel Singapore Pte. Ltd., Singapore, wholly owned subsidiary of the Company, being office or place of profit within the meaning of Section 188(1)(f) of the Companies Act, 2013 read with Rule 15(3) of the Companies (Meetings of Board and its Powers) Rules, 2014.
Not Applicable Drawing of monthly remuneration of SGD 30000 (Singapore Dollar Thirty Thousand only) per month from Greenpanel Singapore Pte. Ltd., Singapore, wholly owned subsidiary (WOS) of the Company
Total Value of transactions (F.Y. 2020-21): SGD 3,60,000
19.07.2019 Nil
2 Greenpanel Singapore Pte. Ltd., Singapore, wholly owned subsidiary
1. Sale of goods.
2. Purchase of goods.
3. Payment of Commission.
4. Investment in shares &
5. Payment of advance commission against export sales.
For the financial year 2020-21
On mutually agreed terms sale value of up to H20 crores, purchase value of upto H10 crores, payment of Commission of upto H20 crores, investment in shares up to 3 lacs USD and payment of advance commission up to USD 3 lacs.
18.06.2020 &
27.01.2021
Nil
3 Greenply Industries Limited
Sale and purchase of goods. For the financial year 2020-21
On mutually agreed terms sale value of up to H20 crores and Purchase of raw materials up to H5 crores
18.06.2020 &
30.10.2020
Nil
4 Greenlam Industries Limited
1. Sale & Purchase of goods;
2. Letting of Property
For the financial year 2020-21
On mutually agreed terms sale value of up to H20 crores and purchase value of up to H10 crores.
Receipt of License Fees/ Rent of H5,000 per month
18.06.2020 Nil
5 Greenlam South Limited
Letting of Property For the financial year 2020-21
Receipt of License Fees/ Rent of H5,000 per month
18.06.2020 Nil
For and on behalf of the Board of Directors
Shiv Prakash MittalPlace: Kolkata Executive Chairman Date: May 14, 2021 (DIN: 00237242)
Annexure to the Director’s Report
ANNEXURE -III
SECRETARIAL AUDIT REPORTFORM MR-3
(For the financial year ended March 31, 2021)
[Pursuant to section 204(1) of the Companies Act, 2013 and Rule 9 of the Companies (Appointment and Remuneration of Managerial Personnel) Rules, 2014]
To,The Members ofGreenpanel Industries Limited
We have conducted the secretarial audit of the compliance of applicable statutory provisions and the adherence to good corporate practices by Greenpanel Industries Limited, CIN- L20100AS2017PLC018272 (hereinafter called the Company). Secretarial Audit was conducted in a manner that provided us a reasonable basis for evaluating the corporate conducts/statutory compliances and expressing our opinion thereon.
Based on verification of the books, papers, minute books, forms, returns filed and other records maintained by the company, information provided by the Company, its officers (including RTA), electronic records available in the official portal of the Ministry of Corporate Affairs www.mca.gov.in, portal of the Stock Exchanges, representation made by the Management and considering relaxations granted by the Ministry of Corporate Affairs and Securities and Exchange Board of India on account of global pandemic Novel Coronavirus (COVID 19), we report that in our opinion, the company has during the audit period ended on March 31, 2021, complied with the statutory provisions listed hereunder and also that the Company has proper Board-processes and compliance-mechanism in place to the extent, in the manner and subject to the reporting made hereinafter:
We have examined the books, papers, minute books, forms and returns filed and other records maintained by the company for the audit period ended on March 31, 2021 according to the provisions of:
i) The Companies Act, 2013 (the Act) and the rules made thereunder;
ii) The Securities Contracts (Regulation) Act, 1956 (‘SCRA’) and the rules made thereunder;
iii) The Depositories Act, 1996 and the Regulations and Bye-laws framed thereunder;
iv) Foreign Exchange Management Act, 1999 and the rules and regulations made thereunder to the extent of Foreign Direct Investment, Overseas Direct Investment and External Commercial Borrowings;
v) Secretarial Standards as prescribed by Institute of Company Secretaries of India.
vi) The following Regulations and Guidelines prescribed under the Securities and Exchange Board of India Act, 1992 (‘SEBI Act’) to the extent applicable to the company.
a. The Securities and Exchange Board of India (Substantial Acquisition of Shares and Takeovers) Regulations, 2011;
b. The Securities and Exchange Board of India (Prohibition of Insider Trading) Regulations, 2015;
c. The Securities and Exchange Board of India (Issue of Capital and Disclosure Requirements) Regulations,2018 and amendments from time to time;
d. The Securities and Exchange Board of India (Issue and Listing of Debt Securities) Regulation 2008;
e. The Securities and Exchange Board of India (Registrars to an Issue and Share Transfer Agents) Regulations, 1993;
f. The Securities and Exchange Board of India (Share Based Employee Benefits) Regulation, 2014. (not applicable to the listed entity during review period)
g. The Securities and Exchange Board of India (Delisting of Equity Shares) Regulations, 2009; (not applicable to the Company during audit period) and
h. The Securities and Exchange Board of India (Buyback of Securities) Regulations 2018; (not applicable to the Company during audit period)
vii) Management of the Company represented us that fiscal, labour, environmental laws and other Statutes which are applicable to such type of companies, are generally complied.
viii) We have also examined compliance of the applicable clauses of the following:

106 | Greenpanel Industries Limited Annual Report 2020-21 | 107
Corporate overview Statutory StatementS FinanCial StatementS
a. Secretarial Standards, Guidance Note issued by The Institute of Company Secretaries of India with respect to board and general meetings.
b. The Listing Agreements entered into by the Company with BSE Ltd and National Stock Exchange Ltd read with the provisions of the Securities and Exchange Board of India (SEBI) [Listing Obligations & Disclosure Requirements] Regulations 2015;
During the period under review the Company has complied with the provisions of the Act, Rules, Regulations, Guidelines, Standards, Listing Agreements etc mentioned above.
We report that:a) The Company has made an application pursuant to
Section 196 read with Schedule V of the Companies Act, 2013, for appointment of Mr Shobhan Mittal as Managing Director & CEO of the Company to the Central Government for its approval under SRN: R16286213, dated 26-11-2019, approval is awaited.
We further report that:a) The Board of Directors of the Company is duly
constituted with proper balance of Executive Directors, Non-Executive Directors and Independent Directors. There were no changes in the composition of the Board of Directors during the period under review.
b) Adequate notice is given to all directors to schedule the Board Meetings, agenda and detailed notes on agenda were sent at least seven days in advance
except meeting held at shorter notice and a system exists for seeking and obtaining further information and clarifications on the agenda items before the meeting and for meaningful participation at the meeting.
c) As per the minutes, the decisions at the Board meetings were taken unanimously.
We further report that there are adequate systems and processes in the Company commensurate with the size and operations of the Company to monitor and ensure compliance with applicable laws, rules, regulations and guidelines.
We further report that during the audit period, no events occurred which had bearing on the Company’s affairs in pursuance of the above referred laws, rules, regulations, guidelines, standard etc.
For T.Chatterjee & Associates Company Secretaries FRN No. - P2007WB067100
Binita Pandey Partner
Place: Kolkata ACS: 41594, CP: 19730 Date: May 7, 2021 UDIN: A041594C000254686
This report is to be read with our letter of even date which is annexed as Annexure A and forms an integral part of this report.
‘Annexure A’
To,The Members ofGreenpanel Industries Limited
Our report of even date is to be read along with this letter.
1. Maintenance of secretarial record is the responsibility of the management of the company. Our responsibility is to express an opinion on these secretarial records based on our audit.
2. We have followed the audit practices and processes as were appropriate to obtain reasonable assurance about the correctness of the contents of the Secretarial records. The verification was done on test basis to ensure that correct facts are reflected in secretarial records. We believe that the processes and practices, we followed provide a reasonable basis for our opinion.
3. Where ever required, we have obtained the Management representation about the compliance
of laws, rules and regulations and happening of events etc.
4. The compliance of the provisions of Corporate and other applicable laws, rules, regulations, standards is the responsibility of management. Our examination was limited to the verification of procedures on test basis.
5. The Secretarial Audit is neither an assurance as to the future viability of the company nor of the efficacy or effectiveness with which the management has conducted the affairs of the Company.
For T.Chatterjee & Associates Company Secretaries FRN No. - P2007WB067100
Binita Pandey Partner
Place: Kolkata ACS: 41594, CP: 19730 Date: May 7, 2021 UDIN: A041594C000254686
Annexure to the Director’s Report
ANNEXURE -IV
ANNUAL REPORT ON CORPORATE SOCIAL RESPONSIBILITY (CSR) ACTIVITIES
FOR THE YEAR ENDED MARCH 31, 2021(Pursuant to clause (o) of Sub-section (3) of Section 134 of the Companies Act 2013 and Rule 9 of the Companies
(Corporate Social Responsibility Policy) Rules, 2014)
1. A brief outline of the Company’s CSR Policy, including overview of projects or programs proposed to be undertaken and a reference to the weblink to the CSR Policy and Projects or ProgrammesBrief outline of the CSR PolicyGreenpanel Industries Limited believes that as a responsible corporate citizen, it has a duty towards the society, environment, and the Country where it operates. The Company’s sense of responsibility (which goes beyond just complying with operational and business statutes) towards the community and environment, both ecological and social, in which it operates is known as corporate social responsibility. The Company recognises that by contributing towards the same, it is not doing any philanthropy but is in fact the very basis of doing sustainable profitable business. In view of the above the Company has formulated its Corporate Social Responsibility Policy (“Policy”) with objective to integrate the business processes with social processes and to guide the Company and its people to empathise with social activities also. The Company believes that CSR Policy is the Company’s faith in socially inclusive and sustainable business as the way of doing business.
Priority ProjectsThe Company has currently identified the following Priority Projects to be undertaken by the CSR Committee:
i. Promoting education including special education and employment enhancing vocation skills especially among children, women, elderly, and the differently abled and livelihood enhancement projects;
ii. Eradicating hunger, poverty and malnutrition, promoting healthcare including preventive
healthcare and sanitization and making available safe drinking water;
iii. Rural Development Projects
Web link to the CSR Policy of the Companyh t t p s : / / w w w . g r e e n p a n e l . c o m / w p - c o n t e n t /uploads/2021/04/Corporate-Social-Responsibility-Policy.pdf
2. Composition of the CSR CommitteeThe Committee members are as follows:
i. Ms Sushmita Singha - Chairperson (Independent Director)
ii. Mr Shiv Prakash Mittal – Member (Executive Chairman)
iii. Mr Shobhan Mittal – Member (Managing Director & CEO)
3. Average net profit of the Company for last three financial years:H760.25 lacs
4. Prescribed CSR Expenditure (two percent of the amount as in item 3 above):H15.21 lacs
5. Details of CSR spent during the financial year:i. Total amount to be spent for the financial year:
H15.21 lacs
ii. Amount unspent, if any: NIL
iii. Manner in which the amount spent during the financial year 2020-21 is detailed below:

108 | Greenpanel Industries Limited Annual Report 2020-21 | 109
Corporate overview Statutory StatementS FinanCial StatementS
Sr. No.
CSR Project or Activity identified
Sector in which the Project is covered
Projects or programs (1) Local area or other (2) Specify the State and district where projects or programs was undertaken
Amount outlay (budget) project or program wise
Amount spent on the projects or programs Subheads: (1) Direct expenditure on projects or programs (2) Overheads
Cumulative expenditure up to the reporting period
Amount spent: Direct or through imple-menting agency *
1 Mobile Medical Van (MMV) to provide basic diagnostic, medicine, curative, referral and counselling services to the rural population, with the aim of improving access to medical services in the remote areas as well as raising the level of awareness among the community towards healthy and hygienic living.
Eradicating hunger, poverty and malnutrition, promoting preventive health care and sanitation and making available safe drinking water
Healthcare Project through Mobile Medical Van (MMV) in the nearby villages of Chittoor, Andhra Pradesh
H7,00,000/- for the period 2020-21
Direct Expenditure: H7,97,221/-
H7,97,221/- Direct
2 Infrastructure development and strengthening of education center at Primary Government School, Pipliya, Udham Singh Nagar, Uttarakhand
Promoting education, including special education and employment enhancing vocation skills especially among children, women, elderly, and the differently abled and livelihood enhancement projects
Pipliya, District - Udham Singh Nagar, Uttarakhand
H7,00,000/- for the period 2020-21
Direct Expenditure: H7,47,293/-
H7,47,293/- Direct
3 Vocational Skill Development in the domain of Carpentry
Promoting education, including special education and employment enhancing vocation skills especially among children, women, elderly, and the differently abled and livelihood enhancement projects
Gurgaon, Haryana
H3,00,000/- for the period 2020-21
Direct Expenditure: H3,18,600/-
H3,18,600/- Direct
TOTAL H17,00,000/- H18,63,114/- H18,63,114/-
6. In case the Company has failed to spend the two percent of the average net profits of the last three financial years or any part thereof, the Company shall provide the reasons for not spending the amount in its Board Report:The Company has spent the required amount on CSR Activities.
7. A responsibility statement of the CSR Committee that the implementation and monitoring of CSR Policy is in compliance with CSR Objectives and Policy of the Company:The implementation and monitoring of the CSR Policy is in Compliance with CSR Objectives and Policy of the Company.
On behalf of the Company and the CSR Committee
Sushmita SinghaPlace: Udaipur Independent Director & Chairperson of CSR Committee
Date: May 14, 2021 DIN: 02284266
Annexure to the Director’s Report
ANNEXURE -V
Form No. MGT-9EXTRACT OF ANNUAL RETURN
as on financial year ended on March 31, 2021
[Pursuant to section 92(3) of the Companies Act, 2013 and rule 12(1) of the Companies
(Management and Administration) Rules, 2014]
I. REGISTRATION AND OTHER DETAILS:CIN L20100AS2017PLC018272Registration Date December 13, 2017Name of the Company GREENPANEL INDUSTRIES LIMITEDCategory / Sub-Category of the Company Public Company limited by sharesAddress of the Registered office and contact details Makum Road, Tinsukia – 786 125, Assam
Phone No.- 033-40840600 Fax No. 033-24645525
Whether listed company YesName, Address and Contact details of Registrar and Transfer Agent, if any
Maheshwari Datamatics Pvt. Ltd.
23, R.N. Mukherjee Road, 5th Floor, Kolkata - 700 001
Phone No. 033-2248-2248 E mail: [email protected]
II. PRINCIPAL BUSINESS ACTIVITIES OF THE COMPANYAll the business activities contributing 10% or more of the total turnover of the company shall be stated:
Sl. No.
Name and Description of main products/ services
NIC Code (2008) of the Product/ service
% to total turnover of the company
1 Medium Density Fibreboard 1621 78.292 Plywood 1621 21.71
III. PARTICULARS OF HOLDING, SUBSIDIARY AND ASSOCIATE COMPANIESSl. NO.
Name and Address of the Company CIN/GLN Holding/ Subsidiary/
Associate
% of shares held
Applicable Section
1 Greenpanel Singapore Pte. Ltd., Singapore Not Applicable Subsidiary 100% 2(87)(ii)
IV. SHARE HOLDING PATTERN(Equity Share Capital Breakup as percentage of Total Equity)
i) Category-wise Share Holding:
Category of Shareholders
No. of Shares held at the beginning of the year (as on April 01, 2020)
No. of Shares held at the end of the year (as on March 31, 2021)
% Change during
the yearDemat Physical Total % of Total Shares
Demat Physical Total % of Total Shares
A. Promoters & Promoter Group
(1) Indian
a) Individual/ HUF 16659180 - 16659180 13.59 16659180 - 16659180 13.59 -

110 | Greenpanel Industries Limited Annual Report 2020-21 | 111
Corporate overview Statutory StatementS FinanCial StatementS
Category of Shareholders
No. of Shares held at the beginning of the year (as on April 01, 2020)
No. of Shares held at the end of the year (as on March 31, 2021)
% Change during
the yearDemat Physical Total % of Total Shares
Demat Physical Total % of Total Shares
b) Central Govt - - - - - - - - -
c) State Govt (s) - - - - - - - - -
d) Bodies Corp. 48450820 48450820 39.51 48450820 48450820 39.51 -
e) Banks/FI
f) Any Other - - - - - - - - -
Sub-total (A) (1): 65110000 - 65110000 53.10 65110000 - 65110000 53.10 -
(2) Foreign
a) NRIs – Individuals - - - - - - - - -
b) Other – Individuals - - - - - - - - -
c) Bodies Corp. - - - - - - - - -
d) Banks / FI - - - - - - - - -
e) Any Other - - - - - - - - -
Sub-total (A) (2): - - - - - - - - -
Total shareholding of Promoter (A) = (A)(1) +(A) (2)
65110000 - 65110000 53.10 65110000 - 65110000 53.10 -
B. Public Shareholding
1. Institutions
a) Mutual Funds 20583295 20583295 16.78 20497463 - 20497463 16.72 (0.07)
b) Banks/FI 535 535 0.00 535 - 535 0.00 -
c) Central Govt - - - - - - - -
d) State Govt(s) - - - - - - -
e) Venture Capital Funds
- - - - - - -
f) Insurance Companies 58644 58644 0.05 1050231 - 1050231 0.86 0.81
g) FIIs - - - - - - - -
h) Foreign Venture Capital Funds
- - - - - - - - -
i) Others: - - - - - - - - -
i. Alternate Investment Fund
2142976 2142976 1.75 1775406 - 1775406 1.45 (0.30)
ii. Foreign Portfolio Investors
13171594 13171594 10.74 5166213 - 5166213 4.21 (6.53)
Sub-total (B)(1): 35957044 35957044 29.32 28489848 - 28489848 23.23 (6.09)
2. Non-Institutions -
a) Bodies Corporate
i) Indian 1354545 8000 1362545 1.11 4754273 8000 4762273 3.88 2.77
ii) Overseas 3639875 - 3639875 2.97 - - - - (2.97)
b) Individuals
i) Individual shareholders holding nominal share capital upto H1 lacs
9870145 61870 9932015 8.10 13209396 61870 13271266 10.82 2.72
ii) Individual shareholders holding nominal share capital in excess of H1 lacs
5011096 - 5011096 4.09 9553510 - 9553510 7.79 3.70
c) Others:
i. NBFCs registered with RBI
655 - 655 0.00 85100 - 85100 0.07 0.07
ii. IEPF Authority 30185 - 30185 0.02 30185 - 30185 0.02 0.00
Category of Shareholders
No. of Shares held at the beginning of the year (as on April 01, 2020)
No. of Shares held at the end of the year (as on March 31, 2021)
% Change during
the yearDemat Physical Total % of Total Shares
Demat Physical Total % of Total Shares
iii. Clearing Member 115587 - 115587 0.09 340731 - 340731 0.28 0.18
iv. Non-Resident Individual
1341359 - 1341359 1.09 959586 - 959586 0.78 (0.31)
v. Trusts 118688 - 118688 0.10 13550 - 13550 0.01 (0.09)
vi. Foreign National - - - 3000 - 3000 0.00 -
vii. Domestic Corporate Unclaimed Shares Account
8346 - 8346 0.01 8346 - 8346 0.01 -
Sub-total (B)(2): - 21490481 69870 21560351 17.58 28957677 69870 29027547 23.67 6.09
Total Public Shareholding (B) = (B)(1) + (B)(2)
57447525 69870 57517395 46.90 57447525 69870 57517395 46.90 -
C. Shares held by Custodian for GDRs & ADRs
- - - - - - - - -
Grand Total (A+B+C) 122557525 69870 122627395 100.00 122557525 69870 122627395 100.00 -
(ii) Shareholding of Promoters & Promoter Group:
Sl. No.
Shareholder’s Name Shareholding at the beginning of the year (April 01, 2020)
Shareholding at the end of the year (March 31, 2021)
% change in shareholding
during the yearNo. of
Shares% of total
Shares of the
company
% of Shares Pledged/
encumbered to total shares
No. of Shares
% of total
Shares of the
company
% of Shares Pledged/
encumbered to total shares
1 Shobhan Mittal 10588380 8.63 - 10588380 8.63 - -
2 Rajesh Mittal 3079900 2.51 - 3079900 2.51 - -
3 Santosh Mittal 1465900 1.20 - 1465900 1.20 - -
4 Shiv Prakash Mittal 755000 0.62 - 755000 0.62 - -
5 Karuna Mittal 680000 0.55 - 680000 0.55 - -
6 Sanidhya Mittal 90000 0.07 - 90000 0.07 - -
7 S.M. Management Pvt. Ltd.
31626965 25.79 - 31626965 25.79 - -
8 Prime Holdings Pvt. Ltd.
13332800 10.87 - 13332800 10.87 - -
9 Vanashree Properties Pvt.Ltd.
3116055 2.54 - 3116055 2.54 - -
10 Bluesky Projects Private Limited
375000 0.31 - 375000 0.31 - -
Total 65110000 53.10 - 65110000 53.10 - -
(iii) Change in Promoters’ & Promoter Group Shareholding:
Sl. No.
Particulars Shareholding at the beginning of the year (April
01, 2020)
Cumulative Shareholding during the year (April 01, 2020
to March 31, 2021)
No. of shares
% of total shares of the
company
No. of shares % of total shares of the
company
At the beginning of the year 65110000 53.10 - -
Date wise Increase /Decrease in Promoters Shareholding during the year specifying the reasons for increase / decrease
- - - -
At the end of the year - - 65110000 53.10

112 | Greenpanel Industries Limited Annual Report 2020-21 | 113
Corporate overview Statutory StatementS FinanCial StatementS
(iv) Shareholding Pattern of top ten Shareholders (other than Directors, Promoters and Holders of GDRs and ADRs):
Sl. No.
For each of the Top 10 Shareholders Shareholding at the beginning of the year
Cumulative Shareholding during the year
No. of shares
% of total shares of the
company
No. of shares % of total shares of the
company
1 HDFC TRUSTEE COMPANY LTD - A/C HDFC HYBRID EQUITY FUND
At the beginning of the year 7712011 6.289 - -
Changes during the year:
24/04/2020 - Transfer -27011 0.0220 7685000 6.2670
01/05/2020 - Transfer -19057 0.0155 7665943 6.2514
08/05/2020 - Transfer -45000 0.0367 7620943 6.2147
22/05/2020 - Transfer -120943 0.0986 7500000 6.1161
12/06/2020 - Transfer -17500 0.0143 7482500 6.1018
19/06/2020 - Transfer -7800 0.0064 7474700 6.0955
31/07/2020 - Transfer -166443 0.1357 7308257 5.9597
04/09/2020 - Transfer -96500 0.0787 7211757 5.8810
11/09/2020 - Transfer -10762 0.0088 7200995 5.8723
18/09/2020 - Transfer -66115 0.0539 7134880 5.8183
25/09/2020 - Transfer -2300 0.0019 7132580 5.8165
At the end of the year - - 7132580 5.8165
2 IDFC EMERGING BUSINESSES FUNDAt the beginning of the year 5000000 4.0774 - -Changes during the year:17/04/2020 - Transfer 208646 0.1701 5208646 4.247524/04/2020 - Transfer 30293 0.0247 5238939 4.272208/05/2020 - Transfer 81061 0.0661 5320000 4.338322/05/2020 - Transfer 30000 0.0245 5350000 4.362810/07/2020 - Transfer 1399 0.0011 5351399 4.364031/07/2020 - Transfer 48601 0.0396 5400000 4.403614/08/2020 - Transfer 37751 0.0308 5437751 4.434428/08/2020 - Transfer 62249 0.0508 5500000 4.485104/09/2020 - Transfer 100000 0.0815 5600000 4.566727/11/2020 - Transfer 600000 0.4893 6200000 5.056004/12/2020 - Transfer 100000 0.0815 6300000 5.137511/12/2020 - Transfer -90000 0.0734 6210000 5.064118/12/2020 - Transfer -55000 0.0449 6155000 5.019331/12/2020 - Transfer -169579 0.1383 5985421 4.881001/01/2021 - Transfer -89708 0.0732 5895713 4.807808/01/2021 - Transfer -137959 0.1125 5757754 4.695315/01/2021 - Transfer -257754 0.2102 5500000 4.485122/01/2021 - Transfer -50000 0.0408 5450000 4.444405/02/2021 - Transfer -17945 0.0146 5432055 4.429712/02/2021 - Transfer 17945 0.0146 5450000 4.444431/03/2021 - Transfer 80000 0.0652 5530000 4.5096At the end of the year - - 5530000 4.5096
3 TATA INDIA CONSUMER FUNDAt the beginning of the year 2187500 1.7839 - -Changes during the year:20/11/2020 - Transfer 170000 0.1386 2357500 1.9225
Sl. No.
For each of the Top 10 Shareholders Shareholding at the beginning of the year
Cumulative Shareholding during the year
No. of shares
% of total shares of the
company
No. of shares % of total shares of the
company
11/12/2020 - Transfer -100000 0.0815 2257500 1.840922/01/2021 - Transfer -10000 0.0082 2247500 1.832812/03/2021 - Transfer 2600000 2.1202 4847500 3.953019/03/2021 - Transfer 200000 0.1631 5047500 4.1161At the end of the year - - 5047500 4.1161
4 KUBER INDIA FUNDAt the beginning of the year - - - -Changes during the year:31/03/2021 – Transfer 3500000 2.8542 3500000 2.8542At the end of the year - - 3500000 2.8542
5 SBI CONSUMPTION OPPORTUNITIES FUNDAt the beginning of the year 4635273 3.78 - -Changes during the year:06/11/2020 - Transfer -461474 0.3763 4173799 3.403613/11/2020 - Transfer -121503 0.0991 4052296 3.304620/11/2020 - Transfer -194414 0.1585 3857882 3.146027/11/2020 - Transfer 1075749 0.8773 2782133 2.268804/12/2020 - Transfer -397546 0.3242 2384587 1.944611/12/2020 - Transfer -384587 0.3136 2000000 1.631012/02/2021 - Transfer -36415 0.0297 1963585 1.601319/02/2021 - Transfer -1439 0.0012 1962146 1.600126/02/2021 - Transfer -130815 0.1067 1831331 1.493405/03/2021 - Transfer -100113 0.0816 1731218 1.411812/03/2021 - Transfer -2113 0.0017 1729105 1.4100At the end of the year - - 1729105 1.4100
6 MAURYAN FIRSTAt the beginning of the year 1985961 1.6195 - -Changes during the year:13/11/2020 - Transfer -22620 0.0184 1963341 1.601127/11/2020 - Transfer -1291 0.0011 1962050 1.600011/12/2020 - Transfer -60000 0.0489 1902050 1.551118/12/2020 - Transfer -10000 0.0082 1892050 1.542931/12/2020 - Transfer -15687 0.0128 1876363 1.530101/01/2021 - Transfer -25000 0.0204 1851363 1.509708/01/2021 - Transfer -51363 0.0419 1800000 1.467915/01/2021 - Transfer -60000 0.0489 1740000 1.418922/01/2021 - Transfer -8180 0.0067 1731820 1.412329/01/2021 - Transfer -39420 0.0321 1692400 1.380105/02/2021 - Transfer -109058 0.0889 1583342 1.291212/02/2021 - Transfer -2508 0.0020 1580834 1.2891At the end of the year - - 1580834 1.2891
7 SAJJAN BHAJANKAAt the beginning of the year 707552 0.5770 - -Changes during the year:17/04/2020 - Transfer 50000 0.0408 757552 0.6178

114 | Greenpanel Industries Limited Annual Report 2020-21 | 115
Corporate overview Statutory StatementS FinanCial StatementS
Sl. No.
For each of the Top 10 Shareholders Shareholding at the beginning of the year
Cumulative Shareholding during the year
No. of shares
% of total shares of the
company
No. of shares % of total shares of the
company
08/05/2020 - Transfer 449272 0.3664 1206824 0.984115/05/2020 - Transfer 52641 0.0429 1259465 1.027122/05/2020 - Transfer 20142 0.0164 1279607 1.043529/05/2020 - Transfer 21466 0.0175 1301073 1.061005/06/2020 - Transfer 1007 0.0008 1302080 1.061811/12/2020 - Transfer 85000 0.0693 1387080 1.131118/12/2020 - Transfer 112920 0.0921 1500000 1.2232At the end of the year - - 1500000 1.2232
8 INDIA INSIGHT VALUE FUNDAt the beginning of the year 630000 0.5138 - -Changes during the year:01/05/2020 - Transfer 30000 0.0245 660000 0.538208/05/2020 - Transfer 105000 0.0856 765000 0.623815/05/2020 - Transfer 60000 0.0489 825000 0.672822/05/2020 - Transfer 42000 0.0343 867000 0.707012/06/2020 - Transfer 95021 0.0775 962021 0.784526/06/2020 - Transfer 87979 0.0717 1050000 0.856311/09/2020 - Transfer 60000 0.0489 1110000 0.905218/09/2020 - Transfer 27000 0.0220 1137000 0.927225/09/2020 - Transfer 23722 0.0193 1160722 0.946530/09/2020 - Transfer 39586 0.0323 1200308 0.978802/10/2020 - Transfer 29692 0.0242 1230000 1.0030At the end of the year - - 1230000 1.0030
9 PROFITEX SHARES AND SECURITIES PRIVATE LIMITEDAt the beginning of the year - - - -Changes during the year:19/03/2021 - Transfer 441071 0.3597 441071 0.359726/03/2021 - Transfer 500000 0.4077 941071 0.767431/03/2021 - Transfer 191148 0.1559 1132219 0.9233At the end of the year - - 1132219 0.9233
10 KOTAK MAHINDRA LIFE INSURANCE COMPANY LTD.At the beginning of the year - - - -Changes during the year:19/03/2021 - Transfer 1040561 0.8486 1040561 0.848626/03/2021 - Transfer 6515 0.0053 1047076 0.853931/03/2021 - Transfer 3155 0.0026 1050231 0.8564At the end of the year - - 1050231 0.8564
11 JWALAMUKHI INVESTMENT HOLDINGS #At the beginning of the year 11787720 9.6126 - -Changes during the year:29/01/2021 – Transfer -337890 0.2755 11449830 9.337105/02/2021 – Transfer -397729 0.3243 11052101 9.012812/03/2021 – Transfer -3850947 3.1404 7201154 5.872419/03/2021 - Transfer -7201154 5.8724 0 0.0000At the end of the year - - 0 0.0000
Sl. No.
For each of the Top 10 Shareholders Shareholding at the beginning of the year
Cumulative Shareholding during the year
No. of shares
% of total shares of the
company
No. of shares % of total shares of the
company
12 WESTBRIDGE CROSSOVER FUND, LLC #At the beginning of the year 3639875 2.9682 - -Changes during the year:19/03/2021 - Transfer -3639875 2.9682 0 0.0000At the end of the year - - 0 0.0000
13 MANGAL BHANSHALI #At the beginning of the year 1225000 0.9990 - -Changes during the year:29/01/2021 - Transfer -233308 0.1903 991692 0.808719/02/2021 - Transfer -33781 0.0275 957911 0.7812At the end of the year - - 957911 0.7812
14 LATA BHANSHALI #At the beginning of the year 1000000 0.8155 - -Changes during the year: - - - -At the end of the year - - 1000000 0.8155
# Ceased to be in the list of Top 10 shareholders as on 31/03/2021. The same is reflected above since the shareholder was one of the Top 10 shareholders as on 01/04/2020.
Note: The date(s) of acquisition / transfer of shares mentioned above are the quarter-end/weekly benpos date.
(v) Shareholding of Directors and Key Managerial Personnel:
Sl. No.
For Each of the Directors and KMP Shareholding at the beginning of the year
(01.04.2020)
Cumulative Shareholding during the year
(01.04.2020-31.03.2021)
No. of shares
% of total shares of the
company
No. of shares % of total shares of the
company
1 Mr Shiv Prakash Mittal, Executive ChairmanAt the beginning of the year 755000 0.62 - -Changes during the year - - - -At the End of the year - - 755000 0.62
2 Mr Shobhan Mittal, Managing Director & CEOAt the beginning of the year 10588380 8.63 - -Changes during the year - - - -At the End of the year - - 10588380 8.63
3 Mr Salil Kumar Bhandari, Independent DirectorAt the beginning of the year 5000 0.00 - -Changes during the year - - - -At the End of the year - - 5000 0.00
4 Mr Mahesh Kumar Jiwrajka, Independent DirectorAt the beginning of the year - - - -Changes during the year - - - -At the End of the year - - - -
5 Ms Sushmita Singha, Independent DirectorAt the beginning of the year - - - -Changes during the year - - - -At the End of the year - - - -

116 | Greenpanel Industries Limited Annual Report 2020-21 | 117
Corporate overview Statutory StatementS FinanCial StatementS
Sl. No.
For Each of the Directors and KMP Shareholding at the beginning of the year
(01.04.2020)
Cumulative Shareholding during the year
(01.04.2020-31.03.2021)
No. of shares
% of total shares of the
company
No. of shares % of total shares of the
company
6 Mr Arun Kumar Saraf, Independent DirectorAt the beginning of the yearChanges during the year - - - -On 26.06.2020 & 29.06.2020 acquired 20000 shares
- - 20000 0.01
At the End of the year - - 20000 0.017 Mr Vishwanathan Venkatramani, Chief Financial Officer
At the beginning of the year 56359 0.04 - -Changes during the year:On 12.03.2021 acquired 10000 shares 10000 0.01 66359 0.05At the End of the year - - 66359 0.05
8 Mr Lawkush Prasad, Company Secretary & AVP-LegalAt the beginning of the year - - - -Changes during the yearOn 13.08.2020 acquired 1000 shares 1000 0.00 1000 0.00On 01.12.2020 acquired 4000 shares 4000 0.00 5000 0.00On 04.02.2021 & 05.02.2021 acquired 5000 shares
5000 0.00 10000 0.01
At the End of the year - - 10000 0.01
Note: The date(s) of acquisition / transfer of shares mentioned above are the quarter-end/weekly benpos date.
V. INDEBTEDNESSIndebtedness of the Company including interest outstanding/accrued but not due for payment
(H in lacs)
Secured Loans Excluding deposits
Unsecured Loans
Deposits Total Indebtedness
Indebtedness at the beginning of the financial yeari) Principal Amount 55,091.02 387.93 - 55,478.95ii) Interest due but not paid - - - -iii) Interest accrued but not due 153.11 8.96 - 162.07Total (i+ii+iii) 55,244.13 396.89 - 55,641.02Change in Indebtedness during the financial year y Addition - - - - y Reduction 10,861.32 18.96 - 10,880.28
Net Change 10,861.32 18.96 - 10,880.28Indebtedness at the end of the financial yeari) Principal Amount 44,309.98 377.93 - 44,687.91ii) Interest due but not paid - - - -iii) Interest accrued but not due 72.83 - - 72.83Total (i+ii+iii) 44,382.81 377.93 - 44,760.74
VI. REMUNERATION OF DIRECTORS AND KEY MANAGERIAL PERSONNELA. Remuneration to Managing Director, Whole time Directors and/or Manager:
Sl. No.
Particulars of Remuneration Name of MD/WTD/ Manager Total AmountShiv Prakash
Mittal, Executive Chairman
Shobhan Mittal, Managing
Director & CEO1 Gross salary
(a) Salary as per provisions contained in Section 17(1) of the Income-tax Act, 1961
136.14 79.96 216.10
(b) Value of perquisites u/s 17(2) Income-tax Act, 1961 - 11.88 11.88(c) Profits in lieu of salary under Section 17(3) Income- tax Act, 1961
- - -
2 Stock Option - - -3 Sweat Equity - - -4 Commission
- as % of profit 162.50 162.50 325.00- others, specify
5 Others (Contribution to Provident Fund) 9.72 6.48 16.20Total (A) 308.36 260.82 569.18Ceiling as per the Act * 487.83 487.83 975.66
*Being 5% of Net Profits of the Company calculated as per Section 198 of the Companies Act, 2013.
B. Remuneration to other directors:(H In lacs)
Sl. No.
Particulars of Remuneration Name of Directors Total AmountMr Salil
Kumar Bhandari,
Independent Director
Mr Mahesh Kumar
Jiwrajka, Independent
Director
Ms Sushmita Singha,
Independent Director
Mr Arun Kumar Saraf, Independent
Director
1 Independent Directors y Fee for attending board &
committee’s meetings5.80 6.60 6.00 5.20 23.60
y Commission - - - - - y Others, please specify - - - - -
Total (1) 5.80 6.60 6.00 5.20 23.602 Other Non- Executive Directors
y Fee for attending board and committee meetings
- - - - -
y Commission - - - - - y Others, please specify - - - - -
Total (2) - - - - -Total (B) = (1 + 2) 5.80 6.60 6.00 5.20 23.60Total Managerial Remuneration***
- - - - 592.78
Overall Ceiling as per the Act****
- - - - 1073.24
***Total remuneration paid to Managing Director & CEO, Executive Chairman and other Independent Directors (being total of A & B)
****Being 11% of net profits of the Company calculated as per Section 198 of the Companies Act 2013

118 | Greenpanel Industries Limited Annual Report 2020-21 | 119
Corporate overview Statutory StatementS FinanCial StatementS
C. Remuneration to Key Managerial Personnel other than MD/Manager/WTD:
Sl. No.
Particulars of Remuneration Key Managerial Personnel TotalMr V. Venkatramani,
Chief Financial Officer
Mr Lawkush Prasad, Company Secretary &
AVP-Legal1 Gross salary
(a) Salary as per provisions contained in Section 17(1) of the Income-tax Act, 1961
108.81 21.93 130.74
(b) Value of perquisites u/s 17(2) Income-tax Act, 1961
- - -
(c) Profits in lieu of salary under Section 17(3) Income-tax Act, 1961
- - -
2 Stock Option - - -3 Sweat Equity - - -4 Commission
- as % of profit - - -- others- Provident Fund - - -
5 Others, please specify 5.12 1.25 6.37Total 113.93 23.18 137.11
VII. Penalties/Punishment/Compounding of Offences
Type Section of the
Companies Act
Brief Description
Details of Penalty/ Punishment/
Compounding fees imposed
Authority [RD/
NCLT/ COURT]
Appeal made, if
any (give details)
A. COMPANYPenalty -. - - - -Punishment - - - - -Compounding - - - - -B. DIRECTORSPenalty - - - - -Punishment - - - - -Compounding - - - - -C. OTHER OFFICERS IN DEFAULTPenalty - - - - -Punishment - - - - -Compounding - - - - -
For and on behalf of the Board of Directors
Shiv Prakash MittalPlace: Kolkata Executive Chairman
Date: May 14, 2021 DIN: 00237242
Annexure to the Director’s Report
ANNEXURE -VIInformation required under Section 134(3)(m) of the Companies Act, 2013 read with Rule 8(3)
of the Companies (Accounts) Rules, 2014 pertaining to Conservation of Energy, Technology Absorption, Foreign Exchange Earnings and Outgo
A. Conservation of energyi. Steps taken or impact on conservation of energy: y Fibre dryer fan speed reduced from 70% to 68%
resulting in saving of power consumption. y Plant productivity increased in turn saving of
energy by following,y Optimizing production Plan & Market orders.
y Operational & service team skill level advancement
y Application of 6S and Lean Manufacturing approach
y Online webinar session from solution provider for increasing the operator skills which effectively work in productivity increase.
y Outside lighting equipped with timers so that it can automatically turned off as per scheduled time, resulting reduction in power consumption.
y Providing the interlock on Dryer purge blower so that it can be maintained by temperature set values consequently reduce the over run which results reduced power consumption.
y Raw board handling system logic optimised for multiple recipe handling resulting reduction in power consumption.
y All section lifting tables interlocks alarm created in logic which helps us to find out the problem easily and rectified the same as earliest, this reduced the downtime as well as reduces the power consumption.
y Identified and reduce the Hydraulic overrun in pallet cassette section by modified the logic with help of reduce the timing. This helped to optimise the power consumption.
y Pit pumps including resin plant condensate pit pumps equipped with float switches which ultimately reduces the overrun of pump in idle condition and optimise the power consumption.
y Mat reject exhaust section empty run timing reduced through logic, resulting reduction in power consumption.
y Additional junction boxes installed in several area (Press heating pump, press exhaust fan) due to cable heat up which result in downtime, after modification heat up issue solved, downtime
reduced and optimised the power consumption. y Chip wash flush water additional pump installed
for stand by purpose which reduces the downtime and optimised the power consumption.
y Mini chipper system installed for chipping of oversize chips and utilised as energy plant fuel which resulted reduction of chipping through main chipper and optimisation of power consumption.
y Heater ID fan running on minimal speed and stop while running very high and very low thickness board due to heat requirement is low and oil temperature maintained by suction damper this helped us optimise the power consumption.
y Spreader fan logic modified earlier if fan stopped their related total accessories stopped and steam pressure dropped drastically, now only related some accessories stopped other fan in line accessories maintaining the steam pressure, due to this again energy plant start up time and power saved.
ii. Steps taken for utilising alternate sources of energy:Company is exploring feasibility of utilizing alternate source of energy at its manufacturing units. Ex: Solar Powered Parking Sheds, Solar Ponds
iii. Improvement and Optimization of Resources: y Introduced vibro screen under settling tank in chip
wash area which reduce the load on ETP. y Deaerator overflow line height increased by 150
mm so that loss of feed water through overflow line avoided.
y Utilization of bark and overssri chips as a fuel for energy plant rejected from chip screen.
y Reduction in sludge moisture results in increase the calorific value of energy plant fuel.
y Utilization of final reject water for plant irrigation results in reduction in water consumption.
y Utilization of WTP reject water in chemical preparation which results in reduction of water consumption.
y Recycling of WTP balance reject water it resulted reduction in consumption of fresh water.
y Vibro screen installed at inlet of effluent water as a result reduction in chemical dosing as well as chemical consumption.
y Utilization of ETP treated water in chip wash

120 | Greenpanel Industries Limited Annual Report 2020-21 | 121
Corporate overview Statutory StatementS FinanCial StatementS
area which resulted reduction in consumption of chemical in tertiary treatment.
y Utilization of STP treatment water in Plant gardening activity which helped in optimization of fresh water consumption.
iv. Capital Investment on energy conservation equipment:Apart from routine maintenance expenditure, there was no major capital investment made on energy conservation during the year under review.
B. Technology absorptioni. The efforts made towards technology absorption: y Installation of Smart wax system to reduce wax
consumption and uniform distribution of wax across fibre is under progress.
y Testing of formalin catcher on MDF boards for reducing emission in final product is under progress.
y Introduction of Dynasteam system in Press which shall result in 15-30% increase in production capacity as well as decrease in 25-30% Press belt power absorption and reduction in resin consumption.
y Introduction of line profile sensor (Sanding machine) from standard product which is cost effective and easily available rather than use of customised edge sensor.
y Introduction of thickness sensor (Sanding machine) from standard product which is cost effective and
easily available rather than use of customised thickness sensor.
ii. The benefits derived like product improvement, cost reduction, product development or import substitution:Increase in efficiency and production capacity and decrease in consumption of resin, power, and overall cost of production.
iii. in case of imported technology (imported during the last three years reckoned from the beginning of the financial year):a. the details of technology imported: The Company
did not have the need to import technology or foreign technical collaborations, but the Company had guidance from technical experts as well from the foreign machinery suppliers.
b. the year of import: Not Applicablec. whether the technology been fully absorbed: Not
Applicabled. if not fully absorbed, areas where absorption
has not taken place, and the reasons thereof: Not Applicable
iv. the expenditure incurred on Research and Development:
(H in lacs)
Capital -Revenue -Total -Total R&D expenditure as a percentage of net turnover (%)
-
C. Foreign exchange earnings and outgo1. Efforts: The Company regularly participates in international exhibitions and carries out market survey and direct mail campaigns. It is intensifying focus on selected countries and also exploring new markets. The Company is continuously exploring avenues to increase exports.Foreign exchange earnings and outgo:Earnings and outgo:
(H in lacs)
Particulars FY2020-21 FY2019-20Earnings on account of:a) FOB value of exports 11,030.39 12,966.30Total 11,030.39 12,966.30Outgo on account of:a) Raw materials 2,599.66 3543.39b) Capital goods 275.25 599.64c) Traded goods - -d) Stores & spare parts 618.13 536.31Total 3,493.04 4679.34
For and on behalf of the Board of Directors Shiv Prakash MittalPlace: Kolkata Executive ChairmanDate: May 14, 2021 DIN: 00237242
Annexure to the Director’s Report
ANNEXURE -VII
A. Particulars of employees for the year ended March 31, 2021 as required under Section 197 of the Companies Act, 2013 read with Rule 5(1) of the Companies (Appointment and Remuneration of Managerial Personnel) Rules, 2014(a) The ratio of the remuneration of each director to the median remuneration of the employees of the Company
for the financial year;
Name Designation Ratio to median remuneration of employeesMr Shiv Prakash Mittal Executive Chairman 119.01 Mr Shobhan Mittal Managing Director & CEO 96.91 Mr Mahesh Kumar Jiwrajka Independent Director 2.75 Ms Sushmita Singha Independent Director 2.50 Mr Salil Kumar Bhandari Independent Director 2.42 Mr Arun Kumar Saraf Independent Director 2.17
(b) The percentage increase in remuneration of each director, Chief Financial Officer, Chief Executive Officer, Company Secretary or Manager, if any, in the financial year;
Name Designation % increaseMr Shiv Prakash Mittal Executive Chairman 131.97%Mr Shobhan Mittal Managing Director & CEO 231.84%Mr Mahesh Kumar Jiwrajka Independent Director -Mr Salil Kumar Bhandari Independent Director -Ms Sushmita Singha Independent Director -Mr Arun Kumar Saraf Independent Director -Mr Vishwanathan Venkatramani Chief Financial Officer -Mr Lawkush Prasad Company Secretary & AVP-Legal -
(c) The percentage increase in the median remuneration of employees in the financial year 2020-21: (3.35%)
(d) The number of permanent employees on the rolls of Company as on March 31, 2021: 1816
(e) average percentile increase made in the salaries of employees other than the managerial personnel in the last financial year and its comparison with the percentile increase in the managerial remuneration and justification thereof and point out if there are any exceptional circumstances for increase in the managerial remuneration:
Non - Managerial Personnel: (3.19%)
Managerial Personnel: 99.72%
Due to lockdown, disruption of production and adverse market situation, there was reduction of salary during the 1st quarter 2020-21 for Managerial and Non-Managerial Personnel of the Company, resulting 3.19% reduction in remuneration of Non – Managerial personnel. Increase in remuneration of Managerial personnel was on account of payment of Commission @1.50% of Profit during the year under review. Commission could not be paid during previous year due to inadequacy of profit.
(f) Affirmation that the remuneration paid during the year ended March 31, 2021 is as per the Remuneration Policy of the Company: It is hereby affirmed that the remuneration paid during the year ended March 31, 2021 is as per the Remuneration Policy of the Company

122 | Greenpanel Industries Limited Annual Report 2020-21 | 123
Corporate overview Statutory StatementS FinanCial StatementS
Information as per Rule 5 (2) of the Companies (Appointment and Remuneration of Managerial Personnel) Rules, 2014 and forming part of the Board’s Report for the year ended on March 31, 2021
a. Details of Top ten employees in terms of remuneration drawn:
Sl. No.
Name of Employee
Designation Remuneration (H in lacs)
Qualification Experience Date of commencement of Employment
Age
Yrs.
The Last Employment held before joining the Company
1. Mr Shiv Prakash Mittal
Executive Chairman
308.36 B.Sc. 48 yrs. 01.02.2007 71 yrs.
Himalaya Granites Ltd.
2. Mr Shobhan Mittal
Managing Director &
CEO
260.82 BBA 16 yrs. 01.09.2006 40 yrs.
Worthy Plywoods Ltd.
3. Mr Shekhar Chandra Sati
President Sales-MDF & Flooring
128.07 MBA 26 yrs 15.10.2019 47 yrs.
Welspun Global Brands Limited
4. Mr Vishwanathan Venkatramani
Chief Financial
Officer
113.93 CA 34 yrs. 01.07.1995 56 yrs.
MKJ Enterprises
5. Mr Subhash Kumar Aggarwal
Senior Vice-President- Operations
102.33 Post Diploma in Chemical Engineering
40 Yrs. 21.06.2010 60 yrs.
Nuchem Limited
6. Mr Neeladri Basu
Senior Vice-President- Finance & Accounts
88.72 CA, IFRR 25 yrs. 01.02.2013 49 yrs.
Ingersoll Rand
7. Mr Atul Dixit National Head-Sales-
Plywood
68.09 Executive General
Management Program IIM
Bangalore
30 yrs. 01.10.2018 54 yrs.
RMC Switchgears Ltd
8. Mr Vinod Kumar Tiwary
National Head-Sales-
Decorative
61.33 PGDGSM 23 yrs. 10.03.2015 45 yrs.
Mayur Ind Pvt Ltd.
9. Dinesh Kumar Maloo
Vice-President-Operations
49.92 CA 21 yrs 03.12.2012 46 yrs.
Hindusthan National Glass & Industries Ltd.
10. Amit Kashyap Vice-President-
HR
41.76 MPM, PGBDM-HR
14 yrs 11.02.2020 39 yrs.
Diageo India
b. None of the employee employed throughout the year or part of year was in receipt of remuneration exceeding remuneration drawn by the Managing Director or Whole Time Director of the Company and hold 2% or more of the paid-up share capital of the Company either by himself or along with his/her spouse and dependent children.Notes:
1. Remuneration shown above includes salary, allowances, cost of accommodation, medical reimbursement, contribution to provident fund, annual commission and other perquisites as per the terms of employment. However, the above remuneration does not include provision for gratuity and expenses towards club membership fees.
2. All the employees have requisite experience to discharge the responsibility assigned to them.
3. Nature and terms of employment are as per resolution/appointment letter.
4. Within the meaning of Section 2(77) of the Companies Act, 2013, Mr Shiv Prakash Mittal and Mr Shobhan Mittal are related to each other.
For and on behalf of the Board of Directors Shiv Prakash MittalPlace: Kolkata Executive ChairmanDate: May 14, 2021 DIN: 00237242
Corporate Governance ReportFor financial year 2020-21
As required under Regulation 34(3) read with Part C of Schedule V of the SEBI (Listing Obligations and Disclosure Requirements) Regulations, 2015 (hereinafter referred to as “the Listing Regulations”), the details of compliance by the Company with the norms on Corporate Governance are as under:
1. Company’s philosophy on the code of Corporate GovernanceThe Company has complied with the principles and practices of good Corporate Governance. The Company’s philosophy is to attain transparency and accountability in its relationship with employees, shareholders, creditors, consumers, dealers and lenders, ensuring a high degree of regulatory compliance. Your Company firmly believes that a good governance process represents the foundation of corporate excellence. We have adopted required policies & codes to carry out our duties and responsibilities in an ethical manner.
2. Board of Directorsa) Composition of the Board of Directors and Category of Directors:The Board comprises of optimum combination of Executive, Non-Executive and Independent Directors. As on March 31, 2021, the composition of the Board is as under:
y One Executive Promoter Chairman
y One Executive Promoter Director
y Four Non-Executive Independent Directors (including one woman Director)
The composition of the Board is in accordance with Regulation 17(1) of the Listing Regulations and Section 149 of the Companies Act, 2013 (hereinafter referred to as “the Act”).
The Independent Directors neither have nor had any material pecuniary relationship with the Company, its subsidiary or associate company(ies), or their promoters, or directors, during the two immediately preceding financial years or during the current financial year apart from receiving the sitting fees, reimbursement of expenses incurred for attending the Board meeting, Committee meetings, and Independent Directors’ meeting. All the Independent Directors have given declarations that they have satisfied the Criteria of Independency as laid down in Regulation 16(1)(b) of the Listing Regulations and Section 149(6) of the Act.
b) Attendance of Directors at the meetings of the Board of Directors and at the 3rd Annual General Meeting of the Company:During the financial year 2020-21, 5 (five) meetings of Board of Directors were held on June 18, 2020; August 6, 2020; October 30, 2020; December 30, 2020; and January 27, 2021.
The composition of the Board of the Company and the attendance of each Director at the Board Meetings held during the financial year 2020-21 and at the previous Annual General Meeting (“AGM”) i.e. at the 3rd Annual General Meeting held on September 18, 2020 are as follows:
Sl. No.
Name of the Directors and Director Identification Number (DIN)
Category of directorship No. of Board Meetings Attendance at 3rd AGMHeld Attended
1. Mr Shiv Prakash Mittal(DIN: 00237242)
Executive Chairman- Promoter Director
5 4 Yes
2. Mr Shobhan Mittal(DIN: 00347517)
Managing Director & CEO- Promoter Director
5 5 Yes
3. Mr Salil Kumar Bhandari(DIN: 00017566)
Non-Executive - Independent Director
5 5 No
4. Mr Mahesh Kumar Jiwrajka(DIN: 07657748)
Non-Executive - Independent Director
5 5 Yes
5. Ms Sushmita Singha(DIN: 02284266)
Non-Executive - Independent Director
5 5 Yes
6. Mr Arun Kumar Saraf(DIN: 00087063)
Non-Executive - Independent Director
5 5 Yes

124 | Greenpanel Industries Limited Annual Report 2020-21 | 125
Corporate overview Statutory StatementS FinanCial StatementS
a) The number of other listed entity’s Board(s) or Board Committees where Directors are member/ chairperson and name of other Listed Companies along with Category of Directorship:The number of other listed entity’s Board(s) or Board Committees in which the Directors are member/ chairperson and name of other Listed Companies along with Category of Directorship as on March 31, 2021 are as follows:
Sl. No.
Name of the Director
No. of outside directorship held
No. of outside committees** (in public limited companies)
Name of other Listed Companies and Category of DirectorshipPublic Private Member# Chairman
1Mr Shiv Prakash Mittal
1 5 1 1Greenlam Industries Limited -Non-Executive Chairman
2 Mr Shobhan Mittal - 8 - - -
3Mr Salil Kumar Bhandari
4 2 2 1Somany Home Innovation Limited- Director
4Mr Mahesh Kumar Jiwrajka
- 2 - - -
5Ms Sushmita Singha
3 2 1 1
i. Kajaria Ceramics Limited -Independent Director
ii. Radico Khaitan Limited-Independent Director
6Mr Arun Kumar Saraf
- 1 - - -
** Membership/Chairmanship of Audit Committee and Stakeholders’ Relationship Committee has only been considered
# Number of Membership also includes Chairmanship held in the Committee(s)
The number of Directorships, Committee Membership(s) / Chairmanship(s) of all Directors is within respective limits prescribed under the Act and Listing Regulations.
a) Information supplied to the Board of Directors:During the financial year 2020-21, all necessary information, as required under the applicable provisions of the Act, Listing Regulations and other applicable laws and rules were placed and discussed at the Board Meetings.
b) Shareholding of Non-Executive Director(s):As on March 31, 2021, none of the Non-Executive Directors was holding any shares or convertible instruments in the Company except Mr Salil Kumar Bhandari who is holding 5,000 equity shares of the Company (comprising of 0.0041% of the total paid-up share capital) and Mr Arun Kumar Saraf who is holding 20,000 equity shares of the Company (comprising 0.01% of the total paid-up share capital).
c) Separate Meeting of Independent Directors:During the year under review, a separate meeting of the Independent Directors of the Company was convened on January 27, 2021, inter alia, to perform the following:
y Review the performance of Non-Independent Directors and the Board as a whole;
y Review the performance of the Chairman of the Company, taking into account the views of the Executive Directors and Non-Executive Directors;
y Assess the quality, quantity and timeliness of flow of information between the Company Management and the Board that is necessary for the Board to effectively and reasonably perform their duties.
All the Independent Directors were present at the above Meeting.
d) Familiarisation programme for Independent Directors:Pursuant to regulation 25(7) of the Listing Regulations, during the financial year 2020-21, the Company has conducted the familiarisation program for Independent Directors to facilitate them to understand the ‘Prevention of Sexual Harassment at Workplace’ Policy adopted by the Company to prevent, prohibit and redress Sexual Harassment of every ‘Women employee’ across the Organization. The details of the same have been disclosed on the website of the Company at https://www.greenpanel.com/wp-content/uploads/2021/04/F a m i l i a r i s a t i o n - P r o g r a m m e s - i m p a r t e d - t o -IDs_2020-21.pdf
e) Confirmation that in the opinion of the Board of Directors the Independent Directors of the Company fulfils the conditions specified in the SEBI Listing Regulations and are independent of the management of the Company:Based on the declaration of independency pursuant to Section 149(6) of the Act, and Listing Regulations, received from each of the Independent Directors of the Company and placed before the Board of Directors in
their meeting held on June 18, 2020, it is confirmed by the Board of directors that Mr Salil Kumar Bhandari, Mr Mahesh Kumar Jiwrajka, Mr Arun Kumar Saraf and Ms Sushmita Singha, Independent Directors of the Company fulfils the conditions specified in SEBI Listing Regulations and are independent of the management.
i) Chart/matrix setting out the skills/expertise/competence of the Board of Directors:The Board has identified the following core skills, expertise, competencies as required in the context of the business of the Company and the sector in which the Company is operating:
Sl. No.
Skills/Expertise/Competencies required by the Board of Directors
Status of availability
with the Board
Directors who have such skills/ expertise/competence
1. Understanding of Business/Industry
(a) Of the relevant laws, rules, regulations policies applicable to the Company, the industry/ sector to which it relates.
(b) Of processes, policies, codes and practices followed by the Company
Yes 1. Mr Shiv Prakash Mittal2. Mr Shobhan Mittal3. Mr Mahesh Kumar Jiwrajka4. Mr Salil Kumar Bhandari5. Ms Sushmita Singha6. Mr Arun Kumar Saraf
2. Strategy and strategic planning
Ability to develop effective strategies after identification of opportunities, along with implementation of the strategy effectively & efficiently, and incorporation of necessary changes wherever required
Yes 1. Mr Shiv Prakash Mittal2. Mr Shobhan Mittal
3. Understanding of finance and related aspects
Ability to analyse and understand the key financial statements, and knowledge of how to assess the financial value of the Company
Yes 1. Mr Shiv Prakash Mittal2. Mr Shobhan Mittal3. Mr Salil Kumar Bhandari4. Mr Arun Kumar Saraf
4. HR/ people orientation
(a) Understanding of HR Policies
(b) Managing HR activities, talent development and strengthening the people function
Yes 1. Mr Shiv Prakash Mittal2. Mr Shobhan Mittal3. Ms Sushmita Singha
5. Risk oversight and management and compliance oversight
(a) Ability to identify and monitor key risks, supervise risk management plans and framework
(b) Ability to manage skills
Yes 1. Mr Shiv Prakash Mittal2. Mr Shobhan Mittal3. Mr Salil Kumar Bhandari4. Mr Arun Kumar Saraf
6. Knowledge of technology and innovation
Understanding of emerging trends in technology and innovations and the ability to guide necessary interventions that can be utilised in making the business more competitive and sustainable
Yes 1. Mr Shiv Prakash Mittal2. Mr Shobhan Mittal3. Mr Mahesh Kumar Jiwrajka4. Mr Salil Kumar Bhandari5. Ms Sushmita Singha6. Mr Arun Kumar Saraf
7. Personal Attributes
(a) Carrying of professional attitude
(b) Possession of relationship building capacity
(c) Active contribution/ participation in discussions, especially critical discussions
(d) Performance oriented attitude
Yes 1. Mr Shiv Prakash Mittal2.Mr Shobhan Mittal3. Mr Mahesh Kumar Jiwrajka4. Mr Salil Kumar Bhandari5. Ms Sushmita Singha6. Mr Arun Kumar Saraf

126 | Greenpanel Industries Limited Annual Report 2020-21 | 127
Corporate overview Statutory StatementS FinanCial StatementS
j) Disclosures of relationships between Directors inter-se:
Name of the Directors Category of Directorship Relationship between DirectorsMr Shiv Prakash Mittal Executive Chairman-Promoter Director Mr Shobhan Mittal (Son) Mr Shobhan Mittal Managing Director & CEO - Promoter Director Mr Shiv Prakash Mittal (Father)Mr Salil Kumar Bhandari Non-Executive-Independent Director NoneMr Mahesh Kumar Jiwrajka Non-Executive-Independent Director NoneMs Sushmita Singha Non-Executive-Independent Director NoneMr Arun Kumar Saraf Non-Executive-Independent Director None
k) Board Evaluation:The Nomination & Remuneration Committee has formulated a Policy for evaluation of the Board, its Committees and Directors and the same has been approved and adopted by the Board. The details of Board Evaluation forms part of the Board’s Report.
l) Terms and conditions of appointment of Independent Directors:The terms and conditions of appointment of Independent Directors have been placed on the website of the Company. The same is available at https://www.greenpanel.com/wp-content/uploads/2020/05/Appointment-Letters-of-Independent-Directors.pdf
3. Code of ConductDetails of the Code of Conduct for Board members and senior management of the Company is available on the Company’s website at https://www.greenpanel.com/wp-content/uploads/2020/05/Code-of-Conduct-of-BOD-Senior-Mngt-Personnel.pdf. Annual declaration signed by the Managing Director & CEO of the Company
pursuant to Regulation 26(3) read with Schedule V (Part D) of the Listing Regulations is annexed to this Report as “Annexure-A”.
4. Committees of Board of DirectorsThere are four Committees of the Board namely, the Audit Committee, Nomination and Remuneration Committee, Stakeholders Relationship Committee and Corporate Social Responsibility Committee. Apart from these Committees, the Company also has an Operational Committee of the Board.
The Committees have been constituted with the approval of the Board of Directors of the Company to carry out defined roles which are considered to be performed by members of the Board, as a part of good governance practice. The minutes of the meetings of all Committees are placed before the Board for review.
a) Audit Committee:The Audit Committee of the Company is constituted in alignment with the provisions of Section 177 of the Act and Regulation 18 of the Listing Regulations.
Mr Lawkush Prasad, Company Secretary & AVP - Legal of the Company, acts as the Secretary of the Audit Committee.
Brief description of terms of reference:POWERS OF AUDIT COMMITTEE(i) To investigate any activity within its terms of
reference.
(ii) To seek information required from any employee.
(iii) To obtain outside legal or other professional advice.
(iv) To secure attendance of outsiders with relevant expertise, if it considers necessary.
ROLE OF AUDIT COMMITTEEThe role of Audit Committee shall include the following:
(i) Oversight of the Company’s financial reporting process and the disclosure of its financial information to ensure that the financial statement is correct, sufficient and credible;
(ii) Recommendation for appointment, remuneration
Composition, name of members and chairman:As on March 31, 2021, the Audit Committee of the Company, comprises of 5 (five) Directors i.e. 4 (Four) Non-Executive Independent Directors and 1 (one) Executive-Promoter Director as follows:
Sl. No. Name of the Committee Member Category Designation1 Mr Salil Kumar Bhandari Independent Director Chairman2 Mr Shiv Prakash Mittal Executive-Promoter Director Member3 Mr Mahesh Kumar Jiwrajka Independent Director Member4 Mr Arun Kumar Saraf Independent Director Member5 Ms Sushmita Singha Independent Director Member
and terms of appointment of auditors of the Company;
(iii) Approval of payment to statutory auditors for any other services rendered by the statutory auditors except those which are specifically prohibited;
(iv) Reviewing, with the management, and examination of the financial statements and auditor’s report thereon before submission to the board for approval, with particular reference to:
a. Matters required to be included in the Director’s Responsibility Statement to be included in the Board’s report in terms of clause (c) of sub-section 3 of section 134 of the Act
b. Changes, if any, in accounting policies and practices and reasons for the same
c. Major accounting entries involving estimates based on the exercise of judgment by management
d. Significant adjustments made in the financial statements arising out of audit findings
e. Compliance with listing and other legal requirements relating to financial statements
f. Disclosure of any related party transactions
g. Modified opinion(s) in the draft audit report
(v) Reviewing, with the management, the quarterly financial statements before submission to the board for approval;
(vi) Reviewing, with the management, the statement of uses / application of funds raised through an issue (public issue, rights issue, preferential issue, etc.), the statement of funds utilised for purposes other than those stated in the offer document / prospectus / notice and the report submitted by the monitoring agency monitoring the utilisation of proceeds of a public or rights issue, and making appropriate recommendations to the Board to take up steps in this matter;
(vii) Review and monitor the auditor’s independence and performance, and effectiveness of audit process;
(viii) Approval or any subsequent modification of transactions of the Company with related parties and scrutiny of the method used to determine the arm’s length price of any transaction;
(ix) Scrutiny of inter-corporate loans and investments;
(x) Valuation of undertakings or assets of the company, wherever it is necessary;
(xi) Evaluation of internal financial controls and risk
management systems;
(xii) Reviewing, with the management, performance of statutory and internal auditors, adequacy of the internal control systems;
(xiii) Reviewing the adequacy of internal audit function, if any, including the structure of the internal audit department, staffing and seniority of the official heading the department, reporting structure coverage and frequency of internal audit;
(xiv) Discussion with internal auditors of any significant findings and follow up there on;
(xv) Reviewing the findings of any internal investigations by the internal auditors into matters where there is suspected fraud or irregularity or a failure of internal control systems of a material nature and reporting the matter to the board;
(xvi) Discussion with statutory auditors before the audit commences, about the nature and scope of audit as well as post-audit discussion to ascertain any area of concern;
(xvii) To look into the reasons for substantial defaults in the payment to the depositors, debenture holders, shareholders (in case of non-payment of declared dividends) and creditors;
(xviii) To review the functioning of the Whistle Blower mechanism;
(xix) Approval of appointment of Chief Financial Officer after assessing the qualifications, experience and background, etc. of the candidate;
(xx) Reviewing the utilization of loans and/or advances from/investment by the holding company in the subsidiary exceeding rupees 100 crores or 10% of the asset size of the subsidiary, whichever is lower including existing loans/advances/investments existing as on the date of coming into force of this provision.
(xxi) Reviewing the compliance with the provisions of SEBI (Prohibition of Insider Trading) Regulations, 2015 at least once in a financial year and shall verify that the systems for internal control are adequate and are operating effectively.
(xxii) Carrying out any other function as may be delegated by the Board of Directors from time to time or as may be required by applicable law or as is mentioned in the terms of reference of the audit committee.
REVIEW OF INFORMATION BY AUDIT COMMITTEE:The Audit Committee shall mandatorily review the following information:

128 | Greenpanel Industries Limited Annual Report 2020-21 | 129
Corporate overview Statutory StatementS FinanCial StatementS
(i) Management discussion and analysis of financial condition and results of operations;
(ii) Statement of significant related party transactions (as defined by the Audit Committee), submitted by management;
(iii) Management letters / letters of internal control weaknesses issued by the statutory auditors;
(iv) Internal audit reports relating to internal control weaknesses; and
(v) The appointment, removal and terms of
remuneration of the Chief internal auditor shall be subject to review by the Audit Committee.
(vi) Statement of deviations:
a. quarterly statement of deviation(s) including report of monitoring agency, if applicable, submitted to stock exchange(s) in terms of Regulations 32(1) of the Listing Regulations
b. annual statement of funds utilised for purposes other than those stated in the offer document/prospectus/notice in terms of Regulation 32(7) of the Listing Regulations
Meetings and attendance during the year:During the financial year 2020-21, 5 (five) meetings of the Audit Committee were held on June 18, 2020; August 06, 2020; October 30, 2020, November 23, 2020 and January 27, 2021.
The attendances of Committee Members were as under:
Name of the Committee Members Category Number of meetingsHeld Attended
Mr Salil Kumar Bhandari Non-Executive-Independent Director 5 5Mr Shiv Prakash Mittal Executive-Promoter Director 5 5Mr Mahesh Kumar Jiwrajka Non-Executive-Independent Director 5 5Mr Arun Kumar Saraf Non-Executive-Independent Director 5 5Ms Sushmita Singha Non-Executive-Independent Director 5 5
Besides the Committee members, the Committee Meetings are attended by the Representative of Statutory Auditors and Internal Auditors.
b) Nomination & Remuneration Committee:The Nomination and Remuneration Committee of the Company is constituted in alignment with the provisions of Section 178 of the Act and Regulation 19 of the Listing Regulations and terms of reference, including role & powers of the Committee, has been modified accordingly.
Composition, name of members and chairperson:As on March 31, 2021, the Nomination & Remuneration Committee of the Company, comprises of 3 (three) Non- Executive Independent Directors as follows:
Sl. No. Name of the Committee Member Category Designation1 Mr Salil Kumar Bhandari Independent Director Chairman2 Mr Mahesh Kumar Jiwrajka Independent Director Member3 Ms Sushmita Singha Independent Director Member
Mr Lawkush Prasad, Company Secretary & AVP - Legal of the Company, acts as the Secretary of the Nomination & Remuneration Committee.
Terms of reference:The Nomination and Remuneration Committee shall be responsible for, beside the other things as may be required from time to time, the following:
1. To formulate criteria for:
i. determining qualifications, positive attributes and independence of a director;
ii. evaluation of performance of independent directors and the Board of Directors.
2. To devise the policies on:
i. remuneration including any compensation related payments of the directors, key managerial personnel and other employees and recommend the same to the Board of the Company;
ii. Board diversity laying out an optimum mix of executive, independent and non-independent directors keeping in mind the needs of the Company.
Meetings and attendance during the year:During the financial year 2020-21, 3 (three) meetings of the Nomination & Remuneration Committee were held on June 18, 2020; October 30, 2020; and January 27, 2021.
The attendances of Committee Members were as under:
Name of the Committee Members Category Number of meetingsHeld Attended
Mr Salil Kumar Bhandari Non-Executive-Independent Director 3 3Mr Mahesh Kumar Jiwrajka Non-Executive-Independent Director 3 3Ms Sushmita Singha Non-Executive-Independent Director 3 3
3. To identify persons who are qualified to:
i. become directors in accordance with the criteria laid down, and recommend to the Board the appointment and removal of directors;
ii. be appointed in senior management in accordance with the policies of the Company and recommend their appointment or removal to the HR Department and to the Board.
4. To specify the manner for effective evaluation of performance of Board, its committees and individual directors to be carried out either by the Board, by the Nomination and Remuneration Committee or by an independent external agency and review its implementation and compliance;
5. To carry out evaluation of the performance of every director of the Company;
6. To express opinion to the Board that a director possesses the requisite qualification(s) for the practice of the profession in case the services to be rendered by a director are of professional nature.
7. To decide whether to extend or continue the term of appointment of the independent director, on the basis of report of performance evaluation of independent directors;
8. To recommend to the board, all remuneration, in whatever form, payable to senior management personnel.
9. To carry out such other business as may be required by applicable law or delegated by the Board or considered appropriate in view of the general terms of reference and the purpose of the Nomination and Remuneration Committee.
REMUNERATION TO DIRECTORS:(i) Executive Directors:The details of remuneration including commission to all Executive Directors for the year ended on March 31, 2021 are as follows and the same is within the ceiling prescribed under the applicable provisions of the Companies Act, 2013.
(H in lacs)
Name and designation Service contract/Notice period*
Salary Commission Provident Fund
Perquisites and other
allowances
Total
Mr Shiv Prakash Mittal (Executive Chairman)
Appointed w.e.f. July 19, 2019 till June 30, 2024
136.14 162.50 9.72 - 308.36
Mr Shobhan Mittal (Managing Director & CEO)
Appointed w.e.f. July 19, 2019 till June 30, 2024
79.96 162.50 6.48 11.88 260.82
* The appointment may be terminated by either party by giving three months’ notice or salary in lieu thereof or by mutual consent.
Performance evaluation criteria for all the Directors (including Independent Directors):The Nomination and Remuneration Committee has duly formulated the performance evaluation criteria for all the directors (including Independent Directors) of the Company. The said criteria are disclosed in the Directors’ Report forming part of the Annual Report of the Company.
Remuneration policy, details of remuneration and other terms of appointment of Directors:The Board has adopted the Remuneration Policy on the recommendation of the Nomination and Remuneration Committee in compliance with Section 178 of the Act and Regulation 19 read with Part D of Schedule II of the Listing Regulations. The Remuneration Policy of the Company is uploaded on the website of the Company at https://www.greenpanel.com/wp-content/uploads / 2019/11/Remuneration-Policy.pdf

130 | Greenpanel Industries Limited Annual Report 2020-21 | 131
Corporate overview Statutory StatementS FinanCial StatementS
(ii) Non-Executive Directors:The details of sitting fees to Non-Executive Directors for the financial year 2020-21 are as follows:
Name Service contract/Notice period Sitting fees (H In lacs)Mr Salil Kumar Bhandari Appointed for five years w.e.f. August 06, 2018 till
August 05, 2023.5.80
Mr Mahesh Kumar Jiwrajka Appointed for five years w.e.f. August 06, 2018 till August 05, 2023.
6.60
Ms Sushmita Singha Appointed for five years w.e.f. August 06, 2018 till August 05, 2023
6.00
Mr Arun Kumar Saraf Appointed for five years w.e.f. August 14, 2019 till August 13, 2024
5.20
No sitting fee is paid to the Chairman and the Managing Director & CEO for attending the Board Meetings or Committee Meetings thereof. There are no pecuniary relationship or transaction between the non-executive Independent directors and the Company, except for sitting fees for attending the meeting of the Board and Committee(s) thereof. The Company has not granted any stock option to its Directors.
The criteria for making payment to Non-Executive Directors is disclosed on the website of the Company at https://www.greenpanel.com/wp-content/uploads/2020/05/Criteria-for-making-payment-to-Non-Executive-Directors.pdf
The details of shares held by the Executive and Non-Executive Directors of the Company as on March 31, 2021 are as follows:
Name of the Directors Category Number of Equity Shares heldMr Shiv Prakash Mittal Executive Promoter Director 7,55,000Mr Shobhan Mittal Executive Promoter Director 1,05,88,380Mr Salil Kumar Bhandari Non-Executive Independent Director 5,000Mr Mahesh Kumar Jiwrajka Non-Executive Independent Director 0Ms Sushmita Singha Non-Executive Independent Director 0Mr Arun Kumar Saraf Non-Executive Independent Director 20,000
c) Stakeholders Relationship Committee:Stakeholders Relationship Committee of the Company is constituted in line with the provisions of Section 178 of the Act and Regulation 20 of the Listing Regulations.
Composition, name of members and chairperson:As on March 31, 2021, the Stakeholders Relationship Committee of the Company, comprises of 1 (one) Non- Executive Independent Director and 2(two) Executive Promoter Directors as follows:
Sl. No. Name of the Committee Member Category Designation1 Mr Mahesh Kumar Jiwrajka Independent Director Chairman2 Mr Shiv Prakash Mittal Executive Promoter Director Member3 Mr Shobhan Mittal Executive Promoter Director Member
In terms of Regulation 6 and Schedule V of the Listing Regulations, the Board has appointed Mr Lawkush Prasad Company Secretary & AVP-Legal as the Compliance Officer of the Company.
Terms of reference of the Stakeholder’s Relationship Committee are as follows:1. To ensure proper and timely attendance and
redressal of grievances of security holders of the Company in relation to:
a. Transfer/transmission of shares,
b. Non-receipt of annual reports,
c. Non-receipt of declared dividends,
d. All such complaints directly concerning the shareholders / investors as stakeholders of the Company; and
e. Any such matters that may be considered necessary in relation to shareholders and investors of the Company.
2. Reviewing the measures taken for effective exercise of voting rights by shareholders.
3. Reviewing the adherence to the service standards adopted by the Company in respect of various services being rendered by the Registrar & Share Transfer Agent.
4. Review of the various measures and initiatives taken by the listed entity for reducing the quantum of unclaimed dividends and ensuring timely receipt of dividend warrants/annual reports/statutory notices by the shareholders of the company.
5. Formulation of procedures in line with the statutory guidelines to ensure speedy disposal of various requests received from the shareholders from time to time;
6. To review and / or approve applications for transfer, transmission, transposition and mutation of share certificates including issue of duplicate certificates and new certificates on split / sub-division / consolidation / renewal and to deal with all related matters as may be permissible under applicable law.
7. To review and/or approve requests of dematerialization and rematerialisation of securities of the Company and such other related matters;
8. Appointment and fixing of remuneration of Registrar and Transfer Agents and overseeing their performance;
9. Review the status of the litigation(s) filed by/against the security holders of the Company;
10. Review the status of claims received for unclaimed shares;
11. Recommending measures for overall improvement in the quality of investor services;
12. Review the impact of enactments/ amendments issued by the MCA/ SEBI and other regulatory authorities on matters concerning the investors in general;
Such other matters as per the directions of the Board of Directors of the Company and/ or as required under Regulation 20 read with Part D of Schedule II of the Listing Regulations.
13. To carry out such other business as may be required by applicable law or delegated by the Board of Directors of the Company or considered appropriate in view of its terms of reference.
Details of complaints received and resolved during the year ended March 31, 2021:
Received during the year Resolved during the year Not solved to the satisfaction of the shareholders
Pending at the end of the year
- - - -
Meetings and attendance during the year:During the financial year 2020-21, 4 (Four) meetings of the Stakeholders Relationship Committee were held on June 18, 2020, August 06, 2020, October 30, 2020 and January 27, 2021.
The attendances of Committee Members were as under:
Name of the Committee Members Category Number of meetingsHeld Attended
Mr Mahesh Kumar Jiwrajka Non-Executive-Independent Director 4 4Mr Shiv Prakash Mittal Executive-Promoter Director 4 4Mr Shobhan Mittal Executive-Promoter Director 4 4
d) Corporate & Social Responsibility Committee:Corporate Social Responsibility (CSR) Committee of the Company is constituted as per Section 135 of the Act. CSR Committee, inter alia, had formulated and recommended to the Board, a Corporate Social Responsibility Policy which indicates the activities to be undertaken by the Company as specified in Schedule VII to the Act. The CSR Committee recommends the amount of expenditure to be incurred on the CSR activities and monitor the CSR activities undertaken by the Company from time to time.
Composition, name of members and chairperson:As on March 31, 2021, the Corporate Social Responsibility Committee of the Company, comprises of 1 (one) Non- Executive Independent Director and 2(two) Executive Promoter Directors as follows:
Sl. No. Name of the Committee Member Category Designation1 Ms Sushmita Singha Independent Director Chairperson2 Mr Shiv Prakash Mittal Executive Promoter Director Member3 Mr Shobhan Mittal Executive Promoter Director Member
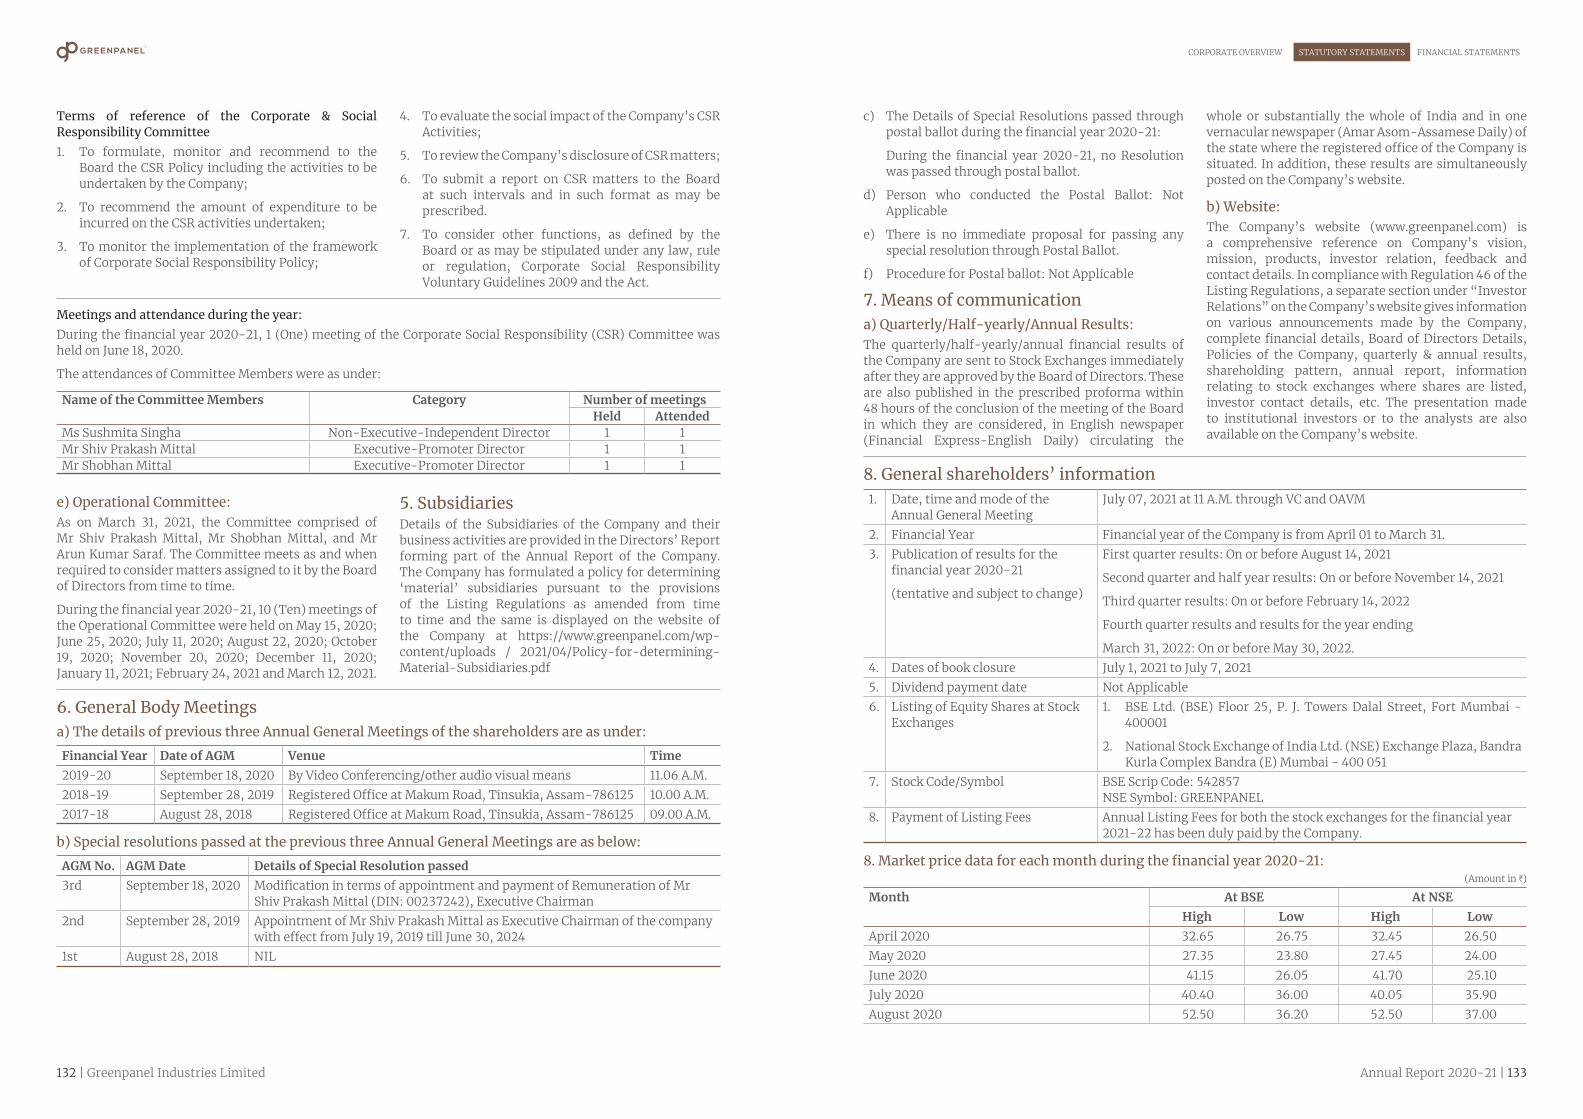
132 | Greenpanel Industries Limited Annual Report 2020-21 | 133
Corporate overview Statutory StatementS FinanCial StatementS
Terms of reference of the Corporate & Social Responsibility Committee1. To formulate, monitor and recommend to the
Board the CSR Policy including the activities to be undertaken by the Company;
2. To recommend the amount of expenditure to be incurred on the CSR activities undertaken;
3. To monitor the implementation of the framework of Corporate Social Responsibility Policy;
4. To evaluate the social impact of the Company’s CSR Activities;
5. To review the Company’s disclosure of CSR matters;
6. To submit a report on CSR matters to the Board at such intervals and in such format as may be prescribed.
7. To consider other functions, as defined by the Board or as may be stipulated under any law, rule or regulation, Corporate Social Responsibility Voluntary Guidelines 2009 and the Act.
e) Operational Committee:As on March 31, 2021, the Committee comprised of Mr Shiv Prakash Mittal, Mr Shobhan Mittal, and Mr Arun Kumar Saraf. The Committee meets as and when required to consider matters assigned to it by the Board of Directors from time to time.
During the financial year 2020-21, 10 (Ten) meetings of the Operational Committee were held on May 15, 2020; June 25, 2020; July 11, 2020; August 22, 2020; October 19, 2020; November 20, 2020; December 11, 2020; January 11, 2021; February 24, 2021 and March 12, 2021.
5. SubsidiariesDetails of the Subsidiaries of the Company and their business activities are provided in the Directors’ Report forming part of the Annual Report of the Company. The Company has formulated a policy for determining ‘material’ subsidiaries pursuant to the provisions of the Listing Regulations as amended from time to time and the same is displayed on the website of the Company at https://www.greenpanel.com/wp-content/uploads / 2021/04/Policy-for-determining-Material-Subsidiaries.pdf
Meetings and attendance during the year:During the financial year 2020-21, 1 (One) meeting of the Corporate Social Responsibility (CSR) Committee was held on June 18, 2020.
The attendances of Committee Members were as under:
Name of the Committee Members Category Number of meetingsHeld Attended
Ms Sushmita Singha Non-Executive-Independent Director 1 1Mr Shiv Prakash Mittal Executive-Promoter Director 1 1Mr Shobhan Mittal Executive-Promoter Director 1 1
6. General Body Meetingsa) The details of previous three Annual General Meetings of the shareholders are as under:
Financial Year Date of AGM Venue Time2019-20 September 18, 2020 By Video Conferencing/other audio visual means 11.06 A.M.2018-19 September 28, 2019 Registered Office at Makum Road, Tinsukia, Assam-786125 10.00 A.M.2017-18 August 28, 2018 Registered Office at Makum Road, Tinsukia, Assam-786125 09.00 A.M.
b) Special resolutions passed at the previous three Annual General Meetings are as below:
AGM No. AGM Date Details of Special Resolution passed3rd September 18, 2020 Modification in terms of appointment and payment of Remuneration of Mr
Shiv Prakash Mittal (DIN: 00237242), Executive Chairman2nd September 28, 2019 Appointment of Mr Shiv Prakash Mittal as Executive Chairman of the company
with effect from July 19, 2019 till June 30, 20241st August 28, 2018 NIL
c) The Details of Special Resolutions passed through postal ballot during the financial year 2020-21:
During the financial year 2020-21, no Resolution was passed through postal ballot.
d) Person who conducted the Postal Ballot: Not Applicable
e) There is no immediate proposal for passing any special resolution through Postal Ballot.
f) Procedure for Postal ballot: Not Applicable
7. Means of communicationa) Quarterly/Half-yearly/Annual Results:The quarterly/half-yearly/annual financial results of the Company are sent to Stock Exchanges immediately after they are approved by the Board of Directors. These are also published in the prescribed proforma within 48 hours of the conclusion of the meeting of the Board in which they are considered, in English newspaper (Financial Express-English Daily) circulating the
whole or substantially the whole of India and in one vernacular newspaper (Amar Asom-Assamese Daily) of the state where the registered office of the Company is situated. In addition, these results are simultaneously posted on the Company’s website.
b) Website:The Company’s website (www.greenpanel.com) is a comprehensive reference on Company’s vision, mission, products, investor relation, feedback and contact details. In compliance with Regulation 46 of the Listing Regulations, a separate section under “Investor Relations” on the Company’s website gives information on various announcements made by the Company, complete financial details, Board of Directors Details, Policies of the Company, quarterly & annual results, shareholding pattern, annual report, information relating to stock exchanges where shares are listed, investor contact details, etc. The presentation made to institutional investors or to the analysts are also available on the Company’s website.
8. General shareholders’ information1. Date, time and mode of the
Annual General MeetingJuly 07, 2021 at 11 A.M. through VC and OAVM
2. Financial Year Financial year of the Company is from April 01 to March 31.3. Publication of results for the
financial year 2020-21
(tentative and subject to change)
First quarter results: On or before August 14, 2021
Second quarter and half year results: On or before November 14, 2021
Third quarter results: On or before February 14, 2022
Fourth quarter results and results for the year ending
March 31, 2022: On or before May 30, 2022.4. Dates of book closure July 1, 2021 to July 7, 20215. Dividend payment date Not Applicable6. Listing of Equity Shares at Stock
Exchanges1. BSE Ltd. (BSE) Floor 25, P. J. Towers Dalal Street, Fort Mumbai -
400001
2. National Stock Exchange of India Ltd. (NSE) Exchange Plaza, Bandra Kurla Complex Bandra (E) Mumbai - 400 051
7. Stock Code/Symbol BSE Scrip Code: 542857NSE Symbol: GREENPANEL
8. Payment of Listing Fees Annual Listing Fees for both the stock exchanges for the financial year 2021-22 has been duly paid by the Company.
8. Market price data for each month during the financial year 2020-21:(Amount in H)
Month At BSE At NSEHigh Low High Low
April 2020 32.65 26.75 32.45 26.50May 2020 27.35 23.80 27.45 24.00June 2020 41.15 26.05 41.70 25.10July 2020 40.40 36.00 40.05 35.90August 2020 52.50 36.20 52.50 37.00

134 | Greenpanel Industries Limited Annual Report 2020-21 | 135
Corporate overview Statutory StatementS FinanCial StatementS
(Amount in H)
Month At BSE At NSEHigh Low High Low
September 2020 52.60 42.95 51.55 42.00October 2020 73.40 49.60 73.35 48.85November 2020 89.40 76.05 90.50 76.00December 2020 128.15 82.00 128.40 83.05January 2021 188.00 124.40 187.50 124.00February 2021 202.75 165.20 203.35 165.05March 2021 185.20 150.30 186.00 150.35
9. E-mail ID for Investors: [email protected]
10. Performance in comparison to broad based indices such as BSE Sensex, CRISIL Index etc. Greenpanel Industries Limited share performance:GREENPANEL HIGH Vs. SENSEX HIGH
Gre
enpa
nel S
tock
Pri
ce
Sens
ex
210
160
110
60
10
60,000.00
55,000.00
50,000.00
45,000.00
40,000.00
35,000.00
30,000.00Apr, 2020
Aug, 2020
Dec, 2020
Jun, 2020
Oct, 2020
Feb, 2021
May, 2020
Sep, 2020
Jan, 2021
Jul, 2020
Nov, 2020
Mar, 2021
Greepanel BSE Sensex
11. Suspension of Securities during the financial year 2020-21:During the financial year 2020-21, the securities of the Company were not suspended from trading.
12. Registrar & Share Transfer Agent (“R&T Agent”):Maheshwari Datamatics Private Limited
Contact Person: Mr S. Rajagopal
Address: 23, R. N. Mukherjee Road, 5th Floor, Kolkata – 700001
Phone No. 033 2243-5029 / 2248-2248 / 2231-6839
E-mail ID: [email protected]
13. Share Transfer System:The Company has a Committee of the Board of Directors called Stakeholders Relationship Committee and takes necessary steps as per its terms of reference duly approved by the Board from time to time.
No Share transfer requests were received during the Financial Year 2020-21.
14. Distribution of equity shareholding as on March 31, 2021:Distribution of shareholding by size is as given below:
Range in number of shares held
Number of shareholders
Percentage of Shareholders
Number of shares held
Percentage of shares held
1-500 16194 82.59 1589603 1.30501-1000 1208 6.16 963086 0.79
1001-2000 867 4.42 1342565 1.092001-3000 387 1.97 981267 0.803001-4000 193 0.98 686406 0.564001-5000 142 0.72 666284 0.545001-10000 258 1.32 1922124 1.57
10001-50000 256 1.31 5429064 4.4350001-100000 45 0.23 3294175 2.69
100001 and above 57 0.30 105752821 86.23Total 19607 100.00 122627395 100.00
Distribution of shareholding by category is as given below:
Category of shareholders Number of shares Percentage of sharesPromoter and Promoter Group 65110000 53.10Alternate Investment Funds 1775406 1.45Foreign Portfolio Investor 5166213 4.21Mutual Funds 20497463 16.72Bodies Corporate 4762273 3.88Resident Individuals 22824776 18.61NBFCs registered with RBI 85100 0.07Clearing Member 340731 0.28NRI 959586 0.78Trusts 13550 0.01Foreign Company 0 0.00Investor Education and Protection Fund Authority 30185 0.02Financial Institutions/banks 535 0.00Insurance Companies 1050231 0.86Foreign National 3000 0.00Unclaimed Share Suspense Account 8346 0.01Total 122627395 100.00
15. Dematerialisation of shares and liquidity:The Company’s equity shares are tradable compulsorily in electronic form and are available for trading in the depository systems of both National Securities Depository Ltd (NSDL) and the Central Depository Services (India) Ltd (CDSL). The International Securities Identification Number (ISIN) of the Company, as allotted by NSDL and CDSL, is INE08ZM01014. Nearly 99.94% of total listed equity shares have been dematerialised as on March 31, 2021.
16. Outstanding ADRs/GDRs/Warrants or any other convertible instruments, conversion date and likely impact on equity:Nil
17. Commodity price risk or foreign exchange risk and hedging activities:The Company has significant foreign exchange exposure towards imports, export and foreign currency loans.
i. Imports are hedged and exports are partially hedged;
ii. Foreign Currency Loans of LBBW is partially hedged.
18. Corporate Identification Number (CIN):L20100AS2017PLC018272
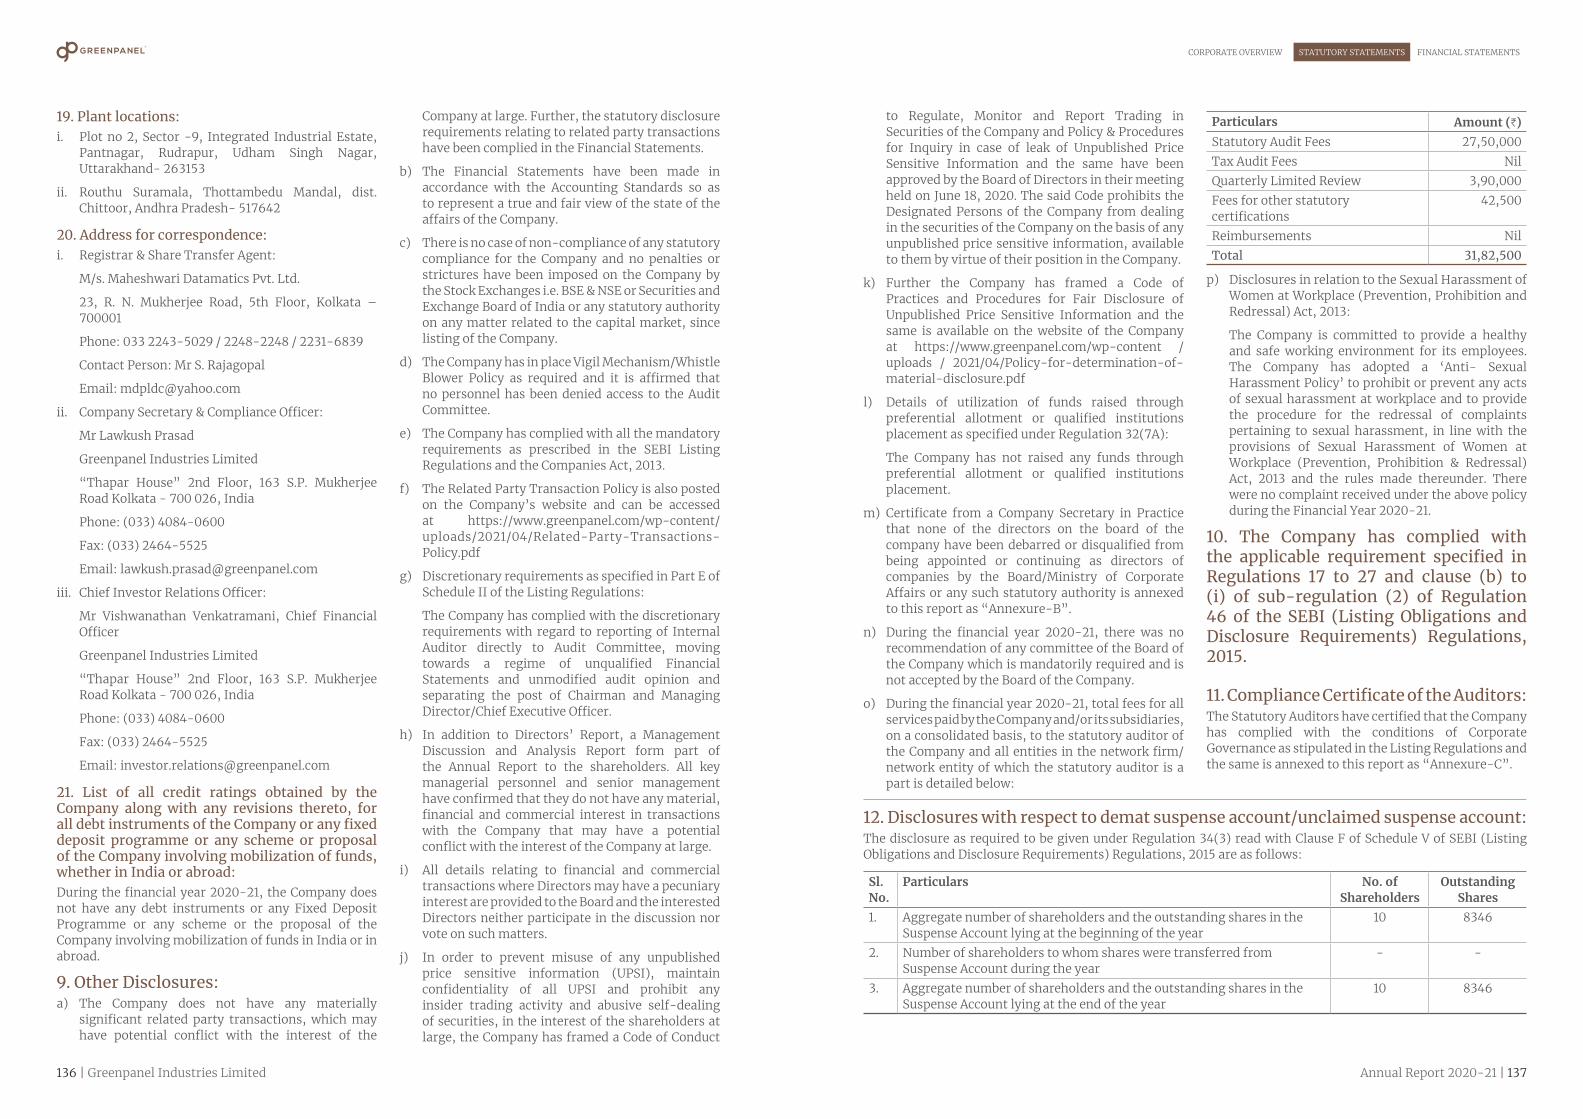
136 | Greenpanel Industries Limited Annual Report 2020-21 | 137
Corporate overview Statutory StatementS FinanCial StatementS
19. Plant locations:i. Plot no 2, Sector -9, Integrated Industrial Estate,
Pantnagar, Rudrapur, Udham Singh Nagar, Uttarakhand- 263153
ii. Routhu Suramala, Thottambedu Mandal, dist. Chittoor, Andhra Pradesh- 517642
20. Address for correspondence:i. Registrar & Share Transfer Agent:
M/s. Maheshwari Datamatics Pvt. Ltd.
23, R. N. Mukherjee Road, 5th Floor, Kolkata – 700001
Phone: 033 2243-5029 / 2248-2248 / 2231-6839
Contact Person: Mr S. Rajagopal
Email: [email protected]
ii. Company Secretary & Compliance Officer:
Mr Lawkush Prasad
Greenpanel Industries Limited
“Thapar House” 2nd Floor, 163 S.P. Mukherjee Road Kolkata - 700 026, India
Phone: (033) 4084-0600
Fax: (033) 2464-5525
Email: [email protected]
iii. Chief Investor Relations Officer:
Mr Vishwanathan Venkatramani, Chief Financial Officer
Greenpanel Industries Limited
“Thapar House” 2nd Floor, 163 S.P. Mukherjee Road Kolkata - 700 026, India
Phone: (033) 4084-0600
Fax: (033) 2464-5525
Email: [email protected]
21. List of all credit ratings obtained by the Company along with any revisions thereto, for all debt instruments of the Company or any fixed deposit programme or any scheme or proposal of the Company involving mobilization of funds, whether in India or abroad:During the financial year 2020-21, the Company does not have any debt instruments or any Fixed Deposit Programme or any scheme or the proposal of the Company involving mobilization of funds in India or in abroad.
9. Other Disclosures:a) The Company does not have any materially
significant related party transactions, which may have potential conflict with the interest of the
Company at large. Further, the statutory disclosure requirements relating to related party transactions have been complied in the Financial Statements.
b) The Financial Statements have been made in accordance with the Accounting Standards so as to represent a true and fair view of the state of the affairs of the Company.
c) There is no case of non-compliance of any statutory compliance for the Company and no penalties or strictures have been imposed on the Company by the Stock Exchanges i.e. BSE & NSE or Securities and Exchange Board of India or any statutory authority on any matter related to the capital market, since listing of the Company.
d) The Company has in place Vigil Mechanism/Whistle Blower Policy as required and it is affirmed that no personnel has been denied access to the Audit Committee.
e) The Company has complied with all the mandatory requirements as prescribed in the SEBI Listing Regulations and the Companies Act, 2013.
f) The Related Party Transaction Policy is also posted on the Company’s website and can be accessed at https://www.greenpanel.com/wp-content/uploads/2021/04/Related-Party-Transactions-Policy.pdf
g) Discretionary requirements as specified in Part E of Schedule II of the Listing Regulations:
The Company has complied with the discretionary requirements with regard to reporting of Internal Auditor directly to Audit Committee, moving towards a regime of unqualified Financial Statements and unmodified audit opinion and separating the post of Chairman and Managing Director/Chief Executive Officer.
h) In addition to Directors’ Report, a Management Discussion and Analysis Report form part of the Annual Report to the shareholders. All key managerial personnel and senior management have confirmed that they do not have any material, financial and commercial interest in transactions with the Company that may have a potential conflict with the interest of the Company at large.
i) All details relating to financial and commercial transactions where Directors may have a pecuniary interest are provided to the Board and the interested Directors neither participate in the discussion nor vote on such matters.
j) In order to prevent misuse of any unpublished price sensitive information (UPSI), maintain confidentiality of all UPSI and prohibit any insider trading activity and abusive self-dealing of securities, in the interest of the shareholders at large, the Company has framed a Code of Conduct
to Regulate, Monitor and Report Trading in Securities of the Company and Policy & Procedures for Inquiry in case of leak of Unpublished Price Sensitive Information and the same have been approved by the Board of Directors in their meeting held on June 18, 2020. The said Code prohibits the Designated Persons of the Company from dealing in the securities of the Company on the basis of any unpublished price sensitive information, available to them by virtue of their position in the Company.
k) Further the Company has framed a Code of Practices and Procedures for Fair Disclosure of Unpublished Price Sensitive Information and the same is available on the website of the Company at https://www.greenpanel.com/wp-content /uploads / 2021/04/Policy-for-determination-of-material-disclosure.pdf
l) Details of utilization of funds raised through preferential allotment or qualified institutions placement as specified under Regulation 32(7A):
The Company has not raised any funds through preferential allotment or qualified institutions placement.
m) Certificate from a Company Secretary in Practice that none of the directors on the board of the company have been debarred or disqualified from being appointed or continuing as directors of companies by the Board/Ministry of Corporate Affairs or any such statutory authority is annexed to this report as “Annexure-B”.
n) During the financial year 2020-21, there was no recommendation of any committee of the Board of the Company which is mandatorily required and is not accepted by the Board of the Company.
o) During the financial year 2020-21, total fees for all services paid by the Company and/or its subsidiaries, on a consolidated basis, to the statutory auditor of the Company and all entities in the network firm/ network entity of which the statutory auditor is a part is detailed below:
Particulars Amount (H)Statutory Audit Fees 27,50,000Tax Audit Fees NilQuarterly Limited Review 3,90,000Fees for other statutory certifications
42,500
Reimbursements NilTotal 31,82,500
p) Disclosures in relation to the Sexual Harassment of Women at Workplace (Prevention, Prohibition and Redressal) Act, 2013:
The Company is committed to provide a healthy and safe working environment for its employees. The Company has adopted a ‘Anti- Sexual Harassment Policy’ to prohibit or prevent any acts of sexual harassment at workplace and to provide the procedure for the redressal of complaints pertaining to sexual harassment, in line with the provisions of Sexual Harassment of Women at Workplace (Prevention, Prohibition & Redressal) Act, 2013 and the rules made thereunder. There were no complaint received under the above policy during the Financial Year 2020-21.
10. The Company has complied with the applicable requirement specified in Regulations 17 to 27 and clause (b) to (i) of sub-regulation (2) of Regulation 46 of the SEBI (Listing Obligations and Disclosure Requirements) Regulations, 2015.
11. Compliance Certificate of the Auditors:The Statutory Auditors have certified that the Company has complied with the conditions of Corporate Governance as stipulated in the Listing Regulations and the same is annexed to this report as “Annexure-C”.
12. Disclosures with respect to demat suspense account/unclaimed suspense account:The disclosure as required to be given under Regulation 34(3) read with Clause F of Schedule V of SEBI (Listing Obligations and Disclosure Requirements) Regulations, 2015 are as follows:
Sl. No.
Particulars No. of Shareholders
Outstanding Shares
1. Aggregate number of shareholders and the outstanding shares in the Suspense Account lying at the beginning of the year
10 8346
2. Number of shareholders to whom shares were transferred from Suspense Account during the year
- -
3. Aggregate number of shareholders and the outstanding shares in the Suspense Account lying at the end of the year
10 8346
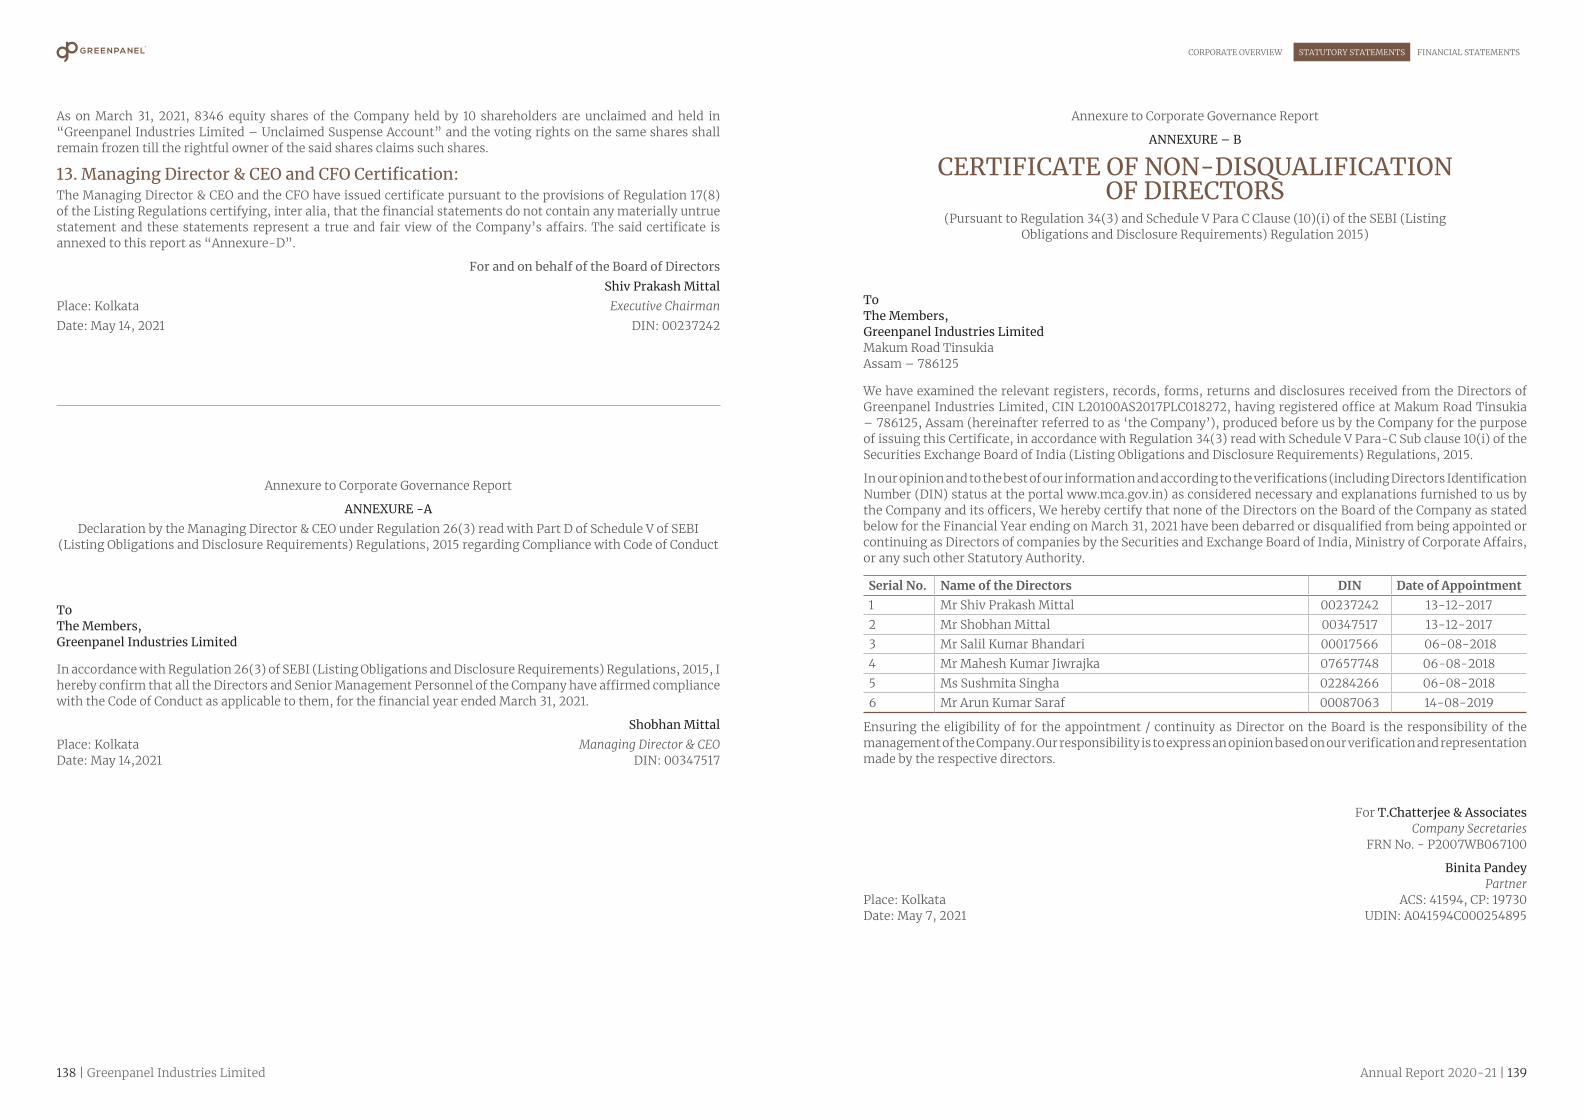
138 | Greenpanel Industries Limited Annual Report 2020-21 | 139
Corporate overview Statutory StatementS FinanCial StatementS
As on March 31, 2021, 8346 equity shares of the Company held by 10 shareholders are unclaimed and held in “Greenpanel Industries Limited – Unclaimed Suspense Account” and the voting rights on the same shares shall remain frozen till the rightful owner of the said shares claims such shares.
13. Managing Director & CEO and CFO Certification:The Managing Director & CEO and the CFO have issued certificate pursuant to the provisions of Regulation 17(8) of the Listing Regulations certifying, inter alia, that the financial statements do not contain any materially untrue statement and these statements represent a true and fair view of the Company’s affairs. The said certificate is annexed to this report as “Annexure-D”.
For and on behalf of the Board of Directors Shiv Prakash MittalPlace: Kolkata Executive ChairmanDate: May 14, 2021 DIN: 00237242
Annexure to Corporate Governance Report
ANNEXURE -ADeclaration by the Managing Director & CEO under Regulation 26(3) read with Part D of Schedule V of SEBI
(Listing Obligations and Disclosure Requirements) Regulations, 2015 regarding Compliance with Code of Conduct
ToThe Members,Greenpanel Industries Limited
In accordance with Regulation 26(3) of SEBI (Listing Obligations and Disclosure Requirements) Regulations, 2015, I hereby confirm that all the Directors and Senior Management Personnel of the Company have affirmed compliance with the Code of Conduct as applicable to them, for the financial year ended March 31, 2021.
Shobhan MittalPlace: Kolkata Managing Director & CEO Date: May 14,2021 DIN: 00347517
Annexure to Corporate Governance Report
ANNEXURE – B
CERTIFICATE OF NON-DISQUALIFICATION OF DIRECTORS
(Pursuant to Regulation 34(3) and Schedule V Para C Clause (10)(i) of the SEBI (Listing Obligations and Disclosure Requirements) Regulation 2015)
ToThe Members,Greenpanel Industries LimitedMakum Road TinsukiaAssam – 786125
We have examined the relevant registers, records, forms, returns and disclosures received from the Directors of Greenpanel Industries Limited, CIN L20100AS2017PLC018272, having registered office at Makum Road Tinsukia – 786125, Assam (hereinafter referred to as ‘the Company’), produced before us by the Company for the purpose of issuing this Certificate, in accordance with Regulation 34(3) read with Schedule V Para-C Sub clause 10(i) of the Securities Exchange Board of India (Listing Obligations and Disclosure Requirements) Regulations, 2015.
In our opinion and to the best of our information and according to the verifications (including Directors Identification Number (DIN) status at the portal www.mca.gov.in) as considered necessary and explanations furnished to us by the Company and its officers, We hereby certify that none of the Directors on the Board of the Company as stated below for the Financial Year ending on March 31, 2021 have been debarred or disqualified from being appointed or continuing as Directors of companies by the Securities and Exchange Board of India, Ministry of Corporate Affairs, or any such other Statutory Authority.
Serial No. Name of the Directors DIN Date of Appointment 1 Mr Shiv Prakash Mittal 00237242 13-12-20172 Mr Shobhan Mittal 00347517 13-12-20173 Mr Salil Kumar Bhandari 00017566 06-08-20184 Mr Mahesh Kumar Jiwrajka 07657748 06-08-20185 Ms Sushmita Singha 02284266 06-08-20186 Mr Arun Kumar Saraf 00087063 14-08-2019
Ensuring the eligibility of for the appointment / continuity as Director on the Board is the responsibility of the management of the Company. Our responsibility is to express an opinion based on our verification and representation made by the respective directors.
For T.Chatterjee & Associates Company Secretaries FRN No. - P2007WB067100
Binita Pandey Partner Place: Kolkata ACS: 41594, CP: 19730 Date: May 7, 2021 UDIN: A041594C000254895

140 | Greenpanel Industries Limited Annual Report 2020-21 | 141
Corporate overview Statutory StatementS FinanCial StatementS
Annexure to Corporate Governance Report
ANNEXURE – C
Auditor’s certificate on Corporate Governance
ToThe Members ofGreenpanel Industries Limited
We have examined the compliance of conditions of Corporate Governance by Greenpanel Industries Limited (CIN: L20100AS2017PLC018272) (“the Company”), as stipulated under Regulations 17 to 27, clauses (b) to (i) of sub regulation (2) of Regulation 46 and para C, D and E of Schedule V of the Securities and Exchange Board of India (Listing Obligations and Disclosure Requirements) Regulations, 2015 (“SEBI Listing Regulations”) for the financial year ended March 31, 2021.
Management’s Responsibility for compliance with the conditions of Listing RegulationsThe compliance of conditions of Corporate Governance is the responsibility of the Management. Our examination was limited to the review of procedures and implementation thereof adopted by the Company for ensuring compliance of the conditions of Corporate Governance as stipulated in the said Regulations. This certificate is neither an assurance as to the future viability of the Company nor of the efficacy or effectiveness with which the management has conducted the affairs of the Company.
Auditors’ ResponsibilityWe conducted our examination in accordance with the Guidance Note on Reports or Certificates for Special Purposes issued by the Institute of Chartered Accountants of India. The Guidance Note requires that we comply with the ethical requirements of the Code of Ethics issued by the Institute of Chartered Accountants of India. We have complied with the relevant applicable requirements of the Standard on Quality Control (SQC) 1, Quality Control for Firms that Perform Audits and Reviews of Historical Financial Information, and Other Assurance and Related Services Engagements.
OpinionIn our opinion, and to the best of our information and according to explanations given to us, we certify that the Company has complied with the conditions of Corporate Governance as stipulated in the SEBI Listing Regulations for the financial year ended March 31, 2021.
We further state that such compliance is neither an assurance as to the future viability of the Company nor the efficiency or effectiveness with which the Management has conducted the affairs of the Company.
Restriction on useThe certificate is addressed and provided to the members of the Company solely for the purpose to enable the Company to comply with the requirement of the Listing Regulations, and it should not be used by any other person or for any other purpose. Accordingly, we do not accept or assume any liability or any duty of care for any other purpose or to any other person to whom this certificate is shown or into whose hands it may come without our prior consent in writing.
For S. S. KOTHARI MEHTA & COMPANYChartered Accountants
FRN - 000756N
Sunil Wahal Partner Place: New Delhi Membership No. 087294 Date: May 14, 2021 UDIN: 21087294AAAAGV8084
Annexure to Corporate Governance Report
ANNEXURE -D
Certification by Chief Executive Officer and Chief Financial Officer pursuant to Regulation 17(8) of SEBI
(Listing Obligations and Disclosure Requirements) Regulations, 2015
ToThe Board of Directors,Greenpanel Industries Ltd.
a) We have reviewed the Financial Statements and the Cash Flow Statement for the financial year ended on March 31, 2021 and that to the best of our knowledge and belief:
i. these statements do not contain any materially untrue statement or omit any material fact or contain statements that might be misleading;
ii. these statements together present a true and fair view of the Company’s affairs and are in compliance with existing Accounting Standards, applicable laws and regulations.
b) There are, to the best of our knowledge and belief, no transactions entered into by the Company during the year which are fraudulent, illegal or violative of the Company’s code of conduct.
c) We accept responsibility for establishing and maintaining internal controls for financial reporting and that we have evaluated the effectiveness of internal control systems of the Company pertaining to financial reporting and we have disclosed to the Auditors and the Audit Committee, deficiencies in the design or operation of such internal controls, if any, of which we are aware and the steps we have taken or propose to take to rectify these deficiencies.
d) We have indicated to the Auditors and the Audit Committee that there are no:
i. Significant changes in internal control over financial reporting during the year;
ii. Significant changes in accounting policies during the year and the same have been disclosed in the notes to the financial statements; and
iii. Instances of significant fraud of which we have become aware and the involvement therein of the management or an employee having a significant role in the Company’s internal control system over financial reporting.
Shobhan Mittal Vishwanathan VenkatramaniPlace: Kolkata Managing Director & CEO Chief Financial Officer Date: May 14, 2021 DIN: 00347517

142 | Greenpanel Industries Limited Annual Report 2020-21 | 143
CORPORATE OVERVIEW STATUTORY STATEMENTS FINANCIAL STATEMENTS
Financial Statements
Standalone Financial
Statements
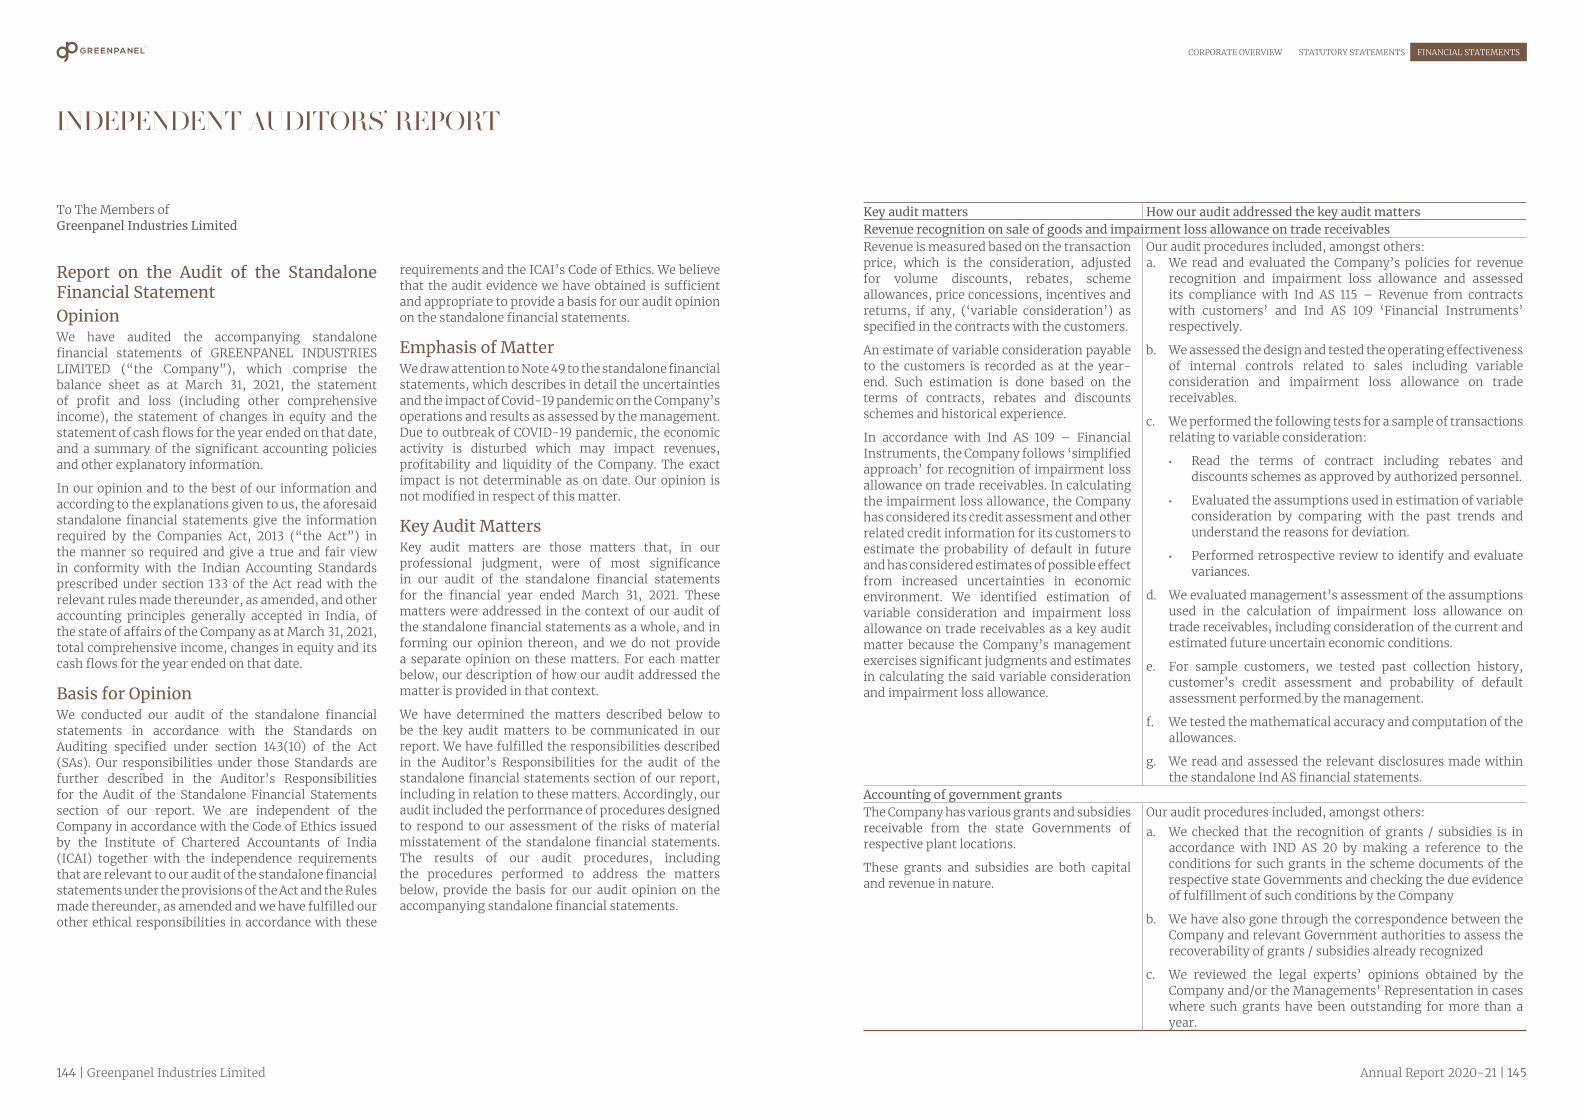
144 | Greenpanel Industries Limited Annual Report 2020-21 | 145
CORPORATE OVERVIEW STATUTORY STATEMENTS FINANCIAL STATEMENTS
INDEPENDENT AUDITORS’ REPORT
To The Members ofGreenpanel Industries Limited
Report on the Audit of the Standalone Financial StatementOpinionWe have audited the accompanying standalone financial statements of GREENPANEL INDUSTRIES LIMITED (“the Company”), which comprise the balance sheet as at March 31, 2021, the statement of profit and loss (including other comprehensive income), the statement of changes in equity and the statement of cash flows for the year ended on that date, and a summary of the significant accounting policies and other explanatory information.
In our opinion and to the best of our information and according to the explanations given to us, the aforesaid standalone financial statements give the information required by the Companies Act, 2013 (“the Act”) in the manner so required and give a true and fair view in conformity with the Indian Accounting Standards prescribed under section 133 of the Act read with the relevant rules made thereunder, as amended, and other accounting principles generally accepted in India, of the state of affairs of the Company as at March 31, 2021, total comprehensive income, changes in equity and its cash flows for the year ended on that date.
Basis for OpinionWe conducted our audit of the standalone financial statements in accordance with the Standards on Auditing specified under section 143(10) of the Act (SAs). Our responsibilities under those Standards are further described in the Auditor’s Responsibilities for the Audit of the Standalone Financial Statements section of our report. We are independent of the Company in accordance with the Code of Ethics issued by the Institute of Chartered Accountants of India (ICAI) together with the independence requirements that are relevant to our audit of the standalone financial statements under the provisions of the Act and the Rules made thereunder, as amended and we have fulfilled our other ethical responsibilities in accordance with these
requirements and the ICAI’s Code of Ethics. We believe that the audit evidence we have obtained is sufficient and appropriate to provide a basis for our audit opinion on the standalone financial statements.
Emphasis of MatterWe draw attention to Note 49 to the standalone financial statements, which describes in detail the uncertainties and the impact of Covid-19 pandemic on the Company’s operations and results as assessed by the management. Due to outbreak of COVID-19 pandemic, the economic activity is disturbed which may impact revenues, profitability and liquidity of the Company. The exact impact is not determinable as on date. Our opinion is not modified in respect of this matter.
Key Audit MattersKey audit matters are those matters that, in our professional judgment, were of most significance in our audit of the standalone financial statements for the financial year ended March 31, 2021. These matters were addressed in the context of our audit of the standalone financial statements as a whole, and in forming our opinion thereon, and we do not provide a separate opinion on these matters. For each matter below, our description of how our audit addressed the matter is provided in that context.
We have determined the matters described below to be the key audit matters to be communicated in our report. We have fulfilled the responsibilities described in the Auditor’s Responsibilities for the audit of the standalone financial statements section of our report, including in relation to these matters. Accordingly, our audit included the performance of procedures designed to respond to our assessment of the risks of material misstatement of the standalone financial statements. The results of our audit procedures, including the procedures performed to address the matters below, provide the basis for our audit opinion on the accompanying standalone financial statements.
Key audit matters How our audit addressed the key audit mattersRevenue recognition on sale of goods and impairment loss allowance on trade receivables Revenue is measured based on the transaction price, which is the consideration, adjusted for volume discounts, rebates, scheme allowances, price concessions, incentives and returns, if any, (‘variable consideration’) as specified in the contracts with the customers.
An estimate of variable consideration payable to the customers is recorded as at the year-end. Such estimation is done based on the terms of contracts, rebates and discounts schemes and historical experience.
In accordance with Ind AS 109 – Financial Instruments, the Company follows ‘simplified approach’ for recognition of impairment loss allowance on trade receivables. In calculating the impairment loss allowance, the Company has considered its credit assessment and other related credit information for its customers to estimate the probability of default in future and has considered estimates of possible effect from increased uncertainties in economic environment. We identified estimation of variable consideration and impairment loss allowance on trade receivables as a key audit matter because the Company’s management exercises significant judgments and estimates in calculating the said variable consideration and impairment loss allowance.
Our audit procedures included, amongst others:a. We read and evaluated the Company’s policies for revenue
recognition and impairment loss allowance and assessed its compliance with Ind AS 115 – Revenue from contracts with customers’ and Ind AS 109 ‘Financial Instruments’ respectively.
b. We assessed the design and tested the operating effectiveness of internal controls related to sales including variable consideration and impairment loss allowance on trade receivables.
c. We performed the following tests for a sample of transactions relating to variable consideration:
• Read the terms of contract including rebates and discounts schemes as approved by authorized personnel.
• Evaluated the assumptions used in estimation of variable consideration by comparing with the past trends and understand the reasons for deviation.
• Performed retrospective review to identify and evaluate variances.
d. We evaluated management’s assessment of the assumptions used in the calculation of impairment loss allowance on trade receivables, including consideration of the current and estimated future uncertain economic conditions.
e. For sample customers, we tested past collection history, customer’s credit assessment and probability of default assessment performed by the management.
f. We tested the mathematical accuracy and computation of the allowances.
g. We read and assessed the relevant disclosures made within the standalone Ind AS financial statements.
Accounting of government grantsThe Company has various grants and subsidies receivable from the state Governments of respective plant locations.
These grants and subsidies are both capital and revenue in nature.
Our audit procedures included, amongst others:a. We checked that the recognition of grants / subsidies is in
accordance with IND AS 20 by making a reference to the conditions for such grants in the scheme documents of the respective state Governments and checking the due evidence of fulfillment of such conditions by the Company
b. We have also gone through the correspondence between the Company and relevant Government authorities to assess the recoverability of grants / subsidies already recognized
c. We reviewed the legal experts’ opinions obtained by the Company and/or the Managements’ Representation in cases where such grants have been outstanding for more than a year.
146 | Greenpanel Industries Limited Annual Report 2020-21 | 147
CORPORATE OVERVIEW STATUTORY STATEMENTS FINANCIAL STATEMENTS
Information Other than the Financial Statements and Auditor’s Report ThereonThe Company’s Board of Directors is responsible for the other information. The other information comprises the information included in the Director’s report but does not include the financial statements and our auditor’s report thereon.
Our opinion on the financial statements does not cover the other information and we do not express any form of assurance conclusions thereon.
In connection with our audit of the financial statements, our responsibility is to read the other information and, in doing so, consider whether the other information is materially inconsistent with the financial statements or our knowledge obtained during the course of our audit or otherwise appears to be materially misstated.
If, based on the work we have performed, we conclude that there is a material misstatement of this other information, we are required to report that fact. We have nothing to report in this regard.
Responsibility of Management for the Standalone Financial StatementsThe Company’s Board of Directors is responsible for the matters stated in section 134(5) of the Act with respect to the preparation of these standalone financial statements that give a true and fair view of the financial position, financial performance, total comprehensive income, changes in equity and cash flows of the Company in accordance with the Ind AS and other accounting principles generally accepted in India. This responsibility also includes maintenance of adequate accounting records in accordance with the provisions of the Act for safeguarding the assets of the Company and for preventing and detecting frauds and other irregularities; selection and application of appropriate accounting policies; making judgments and estimates that are reasonable and prudent; and design, implementation and maintenance of adequate internal financial controls, that were operating effectively for ensuring the accuracy and completeness of the accounting records, relevant to the preparation and presentation of the standalone financial statements that give a true and fair view and are free from material misstatement, whether due to fraud or error.
In preparing the standalone financial statements, management is responsible for assessing the Company’s ability to continue as a going concern, disclosing, as applicable, matters related to going concern and using the going concern basis of accounting unless management either intends to liquidate the Company or to cease operations, or has no realistic alternative but to do so.
The Board of Directors are also responsible for overseeing the Company’s financial reporting process.
Auditor’s Responsibilities for the Audit of the Standalone Financial StatementsOur objectives are to obtain reasonable assurance about whether the standalone financial statements as a whole are free from material misstatement, whether due to fraud or error, and to issue an auditor’s report that includes our opinion. Reasonable assurance is a high level of assurance, but is not a guarantee that an audit conducted in accordance with SAs will always detect a material misstatement when it exists. Misstatements can arise from fraud or error and are considered material if, individually or in the aggregate, they could reasonably be expected to influence the economic decisions of users taken on the basis of these standalone financial statements.
As part of an audit in accordance with SAs, we exercise professional judgment and maintain professional scepticism through out the audit.We also:
• Identify and assess the risks of material misstatement of the standalone financial statements, whether due to fraud or error, design and perform audit procedures responsive to those risks, and obtain audit evidence that is sufficient and appropriate to provide a basis for our opinion. The risk of not detecting a material misstatement resulting from fraud is higher than for one resulting from error, as fraud may involve collusion, forgery, intentional omission, misrepresentations, or the override of internal control.
• Obtain an understanding of internal financial controls relevant to the audit in order to design audit procedures that are appropriate in the circumstances. Under section 143(3)(i) of the Act, we are also responsible for expressing our opinion on whether the Company has adequate internal financial controls system in place and the operating effectiveness of such controls.
• Evaluate the appropriateness of accounting policies used and the reasonableness of accounting estimates and related disclosures made by management.
• Conclude on the appropriateness of management’s use of the going concern basis of accounting and, based on the audit evidence obtained, whether a material uncertainty exists related to events or conditions that may cast significant doubt on the Company’s ability to continue as a going concern. If we conclude that a material uncertainty exists, we are required to draw attention in our auditor’s report to the related disclosures in the standalone financial statements or, if such disclosures are
inadequate, to modify our opinion. Our conclusions are based on the audit evidence obtained up to the date of our auditor’s report. However, future events or conditions may cause the Company to cease to continue as a going concern.
• Evaluate the overall presentation, structure and content of the standalone financial statements, including the disclosures, and whether the standalone financial statements represent the underlying transactions and events in a manner that achieves fair presentation.
We communicate with those charged with governance regarding, among other matters, the planned scope and timing of the audit and significant audit findings, including any significant deficiencies in internal control that we identify during our audit.
We also provide those charged with governance with a statement that we have complied with relevant ethical requirements regarding independence, and to communicate with them all relationships and other matters that may reasonably be thought to bear on our independence, and where applicable, related safeguards.
Report on Other Legal and Regulatory Requirements1. As required by the Companies (Auditor’s Report)
Order, 2016 (“the Order”), issued by the Central Government of India in terms of sub-section (11) of Section 143 of the Act, we give in the “Annexure A” a statement on the matters specified in paragraphs 3 and 4 of the Order, to the extent applicable.
2. As required by Section 143(3) of the Act, based on our audit we report that:
a) We have sought and obtained all the information and explanations which to the best of our knowledge and belief were necessary for the purposes of our audit.
b) In our opinion, proper books of account as required by law have been kept by the Company so far as it appears from our examination of those books.
b) The balance sheet, the statement of profit and loss including other comprehensive income,statement of changes in equity and the statement of cash flow dealt with by this Report are in agreement with the relevant books of account.
c) In our opinion, the aforesaid standalone financial statements comply with the Ind AS specified under Section 133 of the Act read with the relevant rules made thereunder, as amended, and other accounting principles generally accepted in India.
e) On the basis of the written representations received from the directors as on March 31,2021 taken on record by the Board of Directors, none of the directors is disqualified as on March 31, 2021 from being appointed as a director in terms of Section 164(2) of the Act.
f) With respect to the adequacy of the internal financial controls over financial reporting of the Company and the operating effectiveness of such controls, refer to our separate Report in “Annexure B”. Our report expresses an unmodified opinion on the adequacy and operating effectiveness of the Company’s internal financial controls over financial reporting.
g) With respect to the other matters to be included in the Auditor’s Report in accordance with the requirements of section 197(16) of the Act, as amended:
In our opinion and to the best of our information and according to the explanations given to us, the remuneration paid by the Company to its directors during the year is in accordance with the provisions of section 197 of the Act
h) With respect to the other matters to be included in the Auditor’s Report in accordance withRule 11 of the Companies (Audit and Auditors)Rules, 2014, as amended in our opinion and to the best of our information and according to the explanations given to us:
i. The Company has disclosed the impact of pending litigations as at March 31, 2021 on its financial position in its standalonefinancial statements- Refer Note 37 (a) to the standalone financial statements.
ii. The Company has made provision, as required under the applicable law or accounting standards, for material foreseeable losses, if any, on long-term contracts including derivative contracts.
iii. There was no amount required to be transferred, to the Investor Education and Protection Fund by the Company during the year ended March 31, 2021.
For S. S. Kothari Mehta & CompanyChartered AccountantsFirm Registration No. 000756N
Sunil WahalPartnerMembership No: - 087294Place: New DelhiDate: May 14, 2021UDIN: 21087294AAAAHB1783

148 | Greenpanel Industries Limited Annual Report 2020-21 | 149
CORPORATE OVERVIEW STATUTORY STATEMENTS FINANCIAL STATEMENTS
Annexure A to the Independent Auditor’s Report to the Members of GREENPANEL INDUSTRIES LIMITED on its standalone financial statements dated May 14, 2021Report on the matters specified in paragraph 3 of the Companies (Auditor’s Report) Order, 2016 (“the Order’) issued by the Central Government of India in terms of section 143(11) of the Companies Act, 2013 (“the Act”) as referred to in paragraph 1 of ‘Report on Other Legal and Regulatory Requirements’ section.
i. (a) The Company has maintained proper records showing full particulars including quantitative details and situation of fixed assets.
(b) The Company has a regular program of physical verification of its fixed assets by which fixed asset of respective locations are verified in phased manner. In our opinion the frequency of physical verification is reasonable having regard to the size of the Company and the nature of its fixed assets. No material discrepancies were noticed on such physical verification.
(c) According to the information and explanations given to us and on the basis of our examination of the records of the Company, the title deeds of immovable properties are held in the name of the Company.
ii. The inventories of raw material and components of the Company (except stock lying with the third parties and in transit) have been physically verified by the management at the end of the year and in respect of inventory of stores and spares there is perpetual inventory system and substantial portion of the stock have been verified during the year. In our opinion, the procedures of physical verification of inventory followed by the Management are reasonable in relation to the size of the Company and nature of its business. The discrepancies, if any, were not material and adjusted in the books.
iii. The company has not granted any loans, secured or unsecured, to companies, firms or other parties covered in the register maintained under section 189 of the Act. Accordingly, clauses 3(iii) (a) to (c) of the Order are not applicable.
iv. According to the information, explanations and representations provided by the management and based upon audit procedures performed, we are of the opinion that in respect of loans, investments, guarantees and security, the Company has complied with the provisions of the Section 185 and 186 of the Act.
v. As the Company has not accepted deposits, the directives issued by the Reserve Bank of India and the provisions of Section 73 to76 of the Act or any other relevant provisions of the Act and the rules framed there under are not applicable. Neither an order has been passed by the Company Law Board or National Company Law Tribunal or Reserve Bank of India or any Court or any other Tribunal, nor is any proceeding pending before such authority.
vi. The Company is not required to maintain the books of account pursuant to the rules made by the Central Government for the maintenance of cost records under section 148(1) of the Act. However, company maintains adequate cost records in respect of the company’s products. We have, however, not made a detailed examination of the said records with a view to determine whether they are accurate or complete.
vii. (a) According to the information and explanations given to us and the records of the Company examined by us, in our opinion, the Company is generally regular in depositing undisputed statutory dues including provident fund, employees’ state insurance, income-tax, duty of customs, goods and service tax, cess and other material statutory dues, as applicable, with the appropriate authorities and there are no such undisputed amounts payable which have remained outstanding as at March 31, 2021 for a period of more than six months from the date they became payable.
(b) According to the records and information & explanations given to us, certain dues in respect of Income tax, sales tax, service tax, duty of customs, duty of excise and value added tax that have not been deposited with the appropriate authorities on account of dispute and the forum where the dispute is pending are given below:
Name of the statute
Nature of dues Amount (H in lacs)
Period to which the amount relates
Forum where dispute is pending
Service Tax Act, 1944
Denial of refund of service tax refund on Timber transportation
51.64 August 2013 to May 2014
CESTAT, New Delhi
Service Tax Act, 1944
Demand of Service tax on GTA services availed for transportation of wood log
445.68 June 2014 to September 2016
Commissioner Customs, Central
Excise & Service Tax, Hapur
Service Tax Act, 1944
Demand of Service tax on GTA services availed for transportation of wood log
133.34 October 2016 to June 2017
Commissioner, Central Goods & Service Tax,
DehradunCustoms Act, 1962
Disallowance of benefits under SHIS license
391.92 July 2013 to December 2014
CESTAT, Kolkata
Customs Act, 1962
Disallowance of benefits under SHIS license
6.49 2013-2014 to 2014-2015
CESTAT, Kolkata
viii. In our opinion, on the basis of audit procedures and according to the information and explanations given to us, the Company has not defaulted in repayment of loans and borrowings to financial institutions, banks, Government and dues to debenture holders. The Company has not taken any loan from Government.
ix. In our opinion and according to the information and explanations given to us, term loans were applied for the purpose for which the term loan were obtained.No money has been raised during the year by way of initial public offer / further public offer.
x. During the course of our examination of the books and records of the Company carried out in accordance with the generally accepted auditing practices in India, we have neither come across any instance of fraud on or by the Company or any fraud on the Company by its officers or employees has been noticed or reported during the year, nor have we been informed of such case by the management.
xi. In our opinion and according to the Information and explanation given to us, the company has paid/provided managerial remuneration in accordance with the requisite approvals mandated by the provisions of section 197 read with Schedule V to the Act.
xii. As the Company is not a Nidhi Company, the provision of clause 3(xii) of the Order are not applicable to the Company.
xiii. According to the information and explanations given to us, all transactions with related parties are in compliance with sections 177 and 178 of the Act, as applicable and the details have been disclosed in these standalone financial statements as required by the applicable accounting standards.
xiv. The company has not made any preferential allotment or private placement of shares or fully or partly convertible debentures during the year under review. Accordingly, the provisions of clause 3 (xiv) of the Order are not applicable to the Company.
xv. In our opinion and on the basis of information and explanations given to us, the company has not entered into non-cash transactions with directors and persons connected with him. Hence, the provisions of section 192 of Act are not applicable.
xvi. According to the information and explanations given to us, the provisions of section 45-IA of the Reserve Bank of India Act, 1934 are not applicable to the Company.
For S. S. Kothari Mehta & CompanyChartered AccountantsFirm Registration No. 000756N
Sunil WahalPartnerMembership No: - 087294Place: New DelhiDate: May 14, 2021UDIN: 21087294AAAAHB1783
150 | Greenpanel Industries Limited Annual Report 2020-21 | 151
CORPORATE OVERVIEW STATUTORY STATEMENTS FINANCIAL STATEMENTS
Annexure B to the Independent Auditor’s Report to the Members of GREENPANEL INDUSTRIES LIMITED dated May 14, 2021 on its standalone financial statements
Report on the Internal Financial Controls under Clause (i) of Sub-section 3 of Section 143 of the Companies Act, 2013 (“the Act”) as referred to in paragraph 2(f) of ‘Report on Other Legal and Regulatory Requirements’ section
We have audited the internal financial controls over financial reporting of GREENPANEL INDUSTRIES LIMITED (“the Company”) as of March 31, 2021 in conjunction with our audit of the standalone financial statements of the Company for the year ended on that date.
Management’s Responsibility for Internal Financial ControlsThe Company’s Management is responsible for establishing and maintaining internal financial controls based on “the internal control over financial reporting criteria established by the Company considering the essential components of internal control stated in the Guidance Note on Audit of Internal Financial Controls over Financial Reporting issued by the Institute of Chartered Accountants of India”. These responsibilities include the design, implementation and maintenance of adequate internal financial controls that were operating effectively for ensuring the orderly and efficient conduct of its business, including adherence to the Company’s policies, the safeguarding of its assets, the prevention and detection of frauds and errors, the accuracy and completeness of the accounting records, and the timely preparation of reliable financial information, as required under the Act.
Auditors’ ResponsibilityOur responsibility is to express an opinion on the Company’s internal financial controls over financial reporting based on our audit.
We conducted our audit in accordance with the Guidance Note on Audit of Internal Financial Controls Over Financial Reporting (the “Guidance Note”) and the Standards on Auditing as specified under section 143(10) of the Act, to the extent applicable to an audit of internal financial controls, both applicable to an audit of Internal Financial Controls and both issued by the Institute of Chartered Accountants of India. Those Standards and the Guidance Note require that we comply with ethical requirements and plan and perform the audit to obtain reasonable assurance about whether adequate internal financial controls over financial reporting was established and maintained
and if such controls operated effectively in all material respects.
Our audit involves performing procedures to obtain audit evidence about the adequacy of the internal financial controls system over financial reporting and their operating effectiveness.
Our audit of internal financial controls over financial reporting included obtaining an understanding of internal financial controls over financial reporting, assessing the risk that a material weakness exists, and testing and evaluating the design and operating effectiveness of internal control based on the assessed risk. The procedures selected depend on the auditor’s judgement, including the assessment of the risks of material misstatement of the financial statements, whether due to fraud or error.
We believe that the audit evidence we have obtained is sufficient and appropriate to provide a basis for our audit opinion on the Company’s internal financial controls system over financial reporting.
Meaning of Internal Financial Controls over Financial ReportingA company’s internal financial control over financial reporting is a process designed to provide reasonable assurance regarding the reliability of financial reporting and the preparation of financial statements for external purposes in accordance with generally accepted accounting principles. A company’s internal financial control over financial reporting includes those policies and procedures that:
a) pertain to the maintenance of records that, in reasonable detail, accurately and fairly reflect the transactions and dispositions of the assets of the company;
b) provide reasonable assurance that transactions are recorded as necessary to permit preparation of financial statements in accordance with generally accepted accounting principles, and that receipts and expenditures of the company are being made only in accordance with authorizations of management and directors of the company; and
c) provide reasonable assurance regarding prevention or timely detection of unauthorized acquisition, use, or disposition of the company’s assets that could have a material effect on the financial statements.
Inherent Limitations of Internal Financial Controls over Financial ReportingBecause of the inherent limitations of internal financial controls over financial reporting, including the possibility of collusion or improper management override of controls, material misstatements due to error or fraud may occur and not be detected. Also, projections of any evaluation of the internal financial controls over financial reporting to future periods are subject to the risk that the internal financial control over financial reporting may become inadequate because of changes in conditions, or that the degree of compliance with the policies or procedures may deteriorate.
OpinionIn our opinion, to the best of our information and according to the explanations, given to us the Company
has, in all material respects, an adequate internal financial controls system over financial reporting and such internal financial controls over financial reporting were operating effectively as at March 31, 2021, based on the internal control over financial reporting criteria established by the Company considering the essential components of internal control stated in the Guidance Note on Audit of Internal Financial Controls Over Financial Reporting issued by the Institute of Chartered Accountants of India.
For S. S. Kothari Mehta & CompanyChartered AccountantsFirm Registration No. 000756N
Sunil WahalPartnerMembership No: - 087294Place: New DelhiDate: May 14, 2021UDIN: 21087294AAAAHB1783

152 | Greenpanel Industries Limited Annual Report 2020-21 | 153
CORPORATE OVERVIEW STATUTORY STATEMENTS FINANCIAL STATEMENTS
Standalone Balance Sheet as at March 31, 2021H in lacs
Note March 31, 2021 March 31, 2020Assets(1) Non-current assets
(a) Property, plant and equipment 4 1,01,865.96 1,06,292.38(b) Capital work-in-progress 5 358.40 568.84(c) Other intangible assets 6 17.48 43.53(d) Right of use assets 2,407.00 2,456.57(e) Financial assets
(i) Investments 7 5,244.62 5,244.62(ii) Loans 8 1,423.79 1,411.47
(f) Non-current tax assets (net) 9 255.92 261.39(g) Other non-current assets 14 502.19 1,489.93
Total non-current assets 1,12,075.36 1,17,768.73(2) Current assets
(a) Inventories 10 14,935.80 15,388.67(b) Financial assets
(i) Trade receivables 11 7,775.98 7,052.11(ii) Cash and cash equivalents 12 1,266.48 937.06(iii) Other bank balances 13 5,891.16 28.93(iv) Loans 8 76.84 96.72(v) Derivatives 24 - 552.41(vi) Other financial assets 15 4,226.16 4,016.44
(c) Other current assets 16 1,256.09 3,410.75Total current assets 35,428.51 31,483.09Total assets 1,47,503.87 1,49,251.82Equity and liabilitiesEquity
(a) Equity share capital 17 1,226.27 1,226.27(b) Other equity 18 76,119.37 68,463.07Total equity 77,345.64 69,689.34
Liabilities(1) Non-current liabilities (a) Financial liabilities
(i) Borrowings 19 35,623.84 43,080.74(ii) Other financial liabilities 20 2,120.20 2,295.64
(b) Provisions 21 807.04 967.39(c) Deferred tax liabilities (net) 35 2,017.31 688.94(d) Other non-current liabilities 22 1,219.73 2,866.01
Total non-current liabilities 41,788.12 49,898.72(2) Current liabilities (a) Financial liabilities
(i) Borrowings 19 1,598.81 7,270.64 (ii) Trade payables 23
total outstanding dues of micro enterprises and small enterprises 5.98 1.72total outstanding dues of creditors other than micro enterprises and small enterprises
13,130.36 12,273.21
(iii) Derivatives 24 86.59 - (iv) Other financial liabilities 20 9,473.82 6,710.92
(b) Other current liabilities 25 3,662.46 3,175.99(c) Provisions 21 150.06 231.28(d) Current tax liabilities (net) 9 262.03 -
Total current liabilities 28,370.11 29,663.76Total liabilities 70,158.23 79,562.48Total equity and liabilities 1,47,503.87 1,49,251.82Significant accounting policies 3
The accompanying notes form an integral part of the standalone financial statements
As per our report of even date attachedFor S.S. Kothari Mehta & Company For and on behalf of Board of Directors ofChartered Accountants Greenpanel Industries LimitedFirm Registration number: 000756N CIN: L20100AS2017PLC018272
Sunil Wahal Shiv Prakash Mittal Shobhan MittalPartner Executive Chairman Managing Director & CEOMembership No: 087294 (DIN : 00237242) (DIN : 00347517)
V. Venkatramani Lawkush Prasad ChiefFinancialOfficer CompanySecretary&AVP-Legal
Place : New Delhi Place : KolkataDated : May 14, 2021 Dated :May 14, 2021
Standalone Statement of Profit and Loss for the year ended March 31, 2021H in lacs
Note Year ended March 31, 2021
Year ended March 31, 2020
I. Revenue from operations 26 1,01,997.40 85,979.39
II. Other income 27 258.28 203.69
III Total income (I+II) 1,02,255.68 86,183.08
IV. Expenses
Cost of materials consumed 28 42,638.29 38,870.33
Purchase of stock in trade 29 1,000.66 401.11
Changes in inventories of finished goods, work-in-progress and stock in trade
30 2,514.35 (1,086.73)
Employees benefits expense 31 9,276.45 9,277.73
Finance costs 32 3,520.08 4,766.74
Depreciation and amortisation expense 33 6,386.61 6,537.86
Other expenses 34 26,086.02 24,987.40
Total expenses (IV) 91,422.46 83,754.44
V. Profit before exceptional items and tax (III-IV) 10,833.22 2,428.64
VI. Exceptional items 48 - 1,083.74
VII. Profit before tax (V-VI) 10,833.22 1,344.90
Current tax (1,909.09) (258.85)
Deferred tax (1,307.21) 533.87
VIII. Tax expense 35 (3,216.30) 275.02
IX. Profit for the year (VII+VIII) 7,616.92 1,619.92
X. Other comprehensive income
Items that will not be reclassified subsequently to profit or loss:
Remeasurements of defined benefit liability/(asset) 60.54 50.10
Income tax relating to items that will not be reclassified to profit or loss (21.16) (17.51)
Net other comprehensive income not to be reclassified subsequently to profit or loss
39.38 32.59
XI. Total comprehensive income for the year (IX+X) 7,656.30 1,652.51
XII. Earnings per equity share 36
[Face value of equity share H1 each (previous year H1 each)]
- Basic (H) 6.21 1.32
- Diluted (H) 6.21 1.32
Significant accounting policies 3
The accompanying notes form an integral part of the standalone financial statements
As per our report of even date attachedFor S.S. Kothari Mehta & Company For and on behalf of Board of Directors ofChartered Accountants Greenpanel Industries LimitedFirm Registration number: 000756N CIN: L20100AS2017PLC018272
Sunil Wahal Shiv Prakash Mittal Shobhan MittalPartner Executive Chairman Managing Director & CEOMembership No: 087294 (DIN : 00237242) (DIN : 00347517)
V. Venkatramani Lawkush Prasad ChiefFinancialOfficer CompanySecretary&AVP-Legal
Place : New Delhi Place : KolkataDated : May 14, 2021 Dated : 14 May 2021

154 | Greenpanel Industries Limited Annual Report 2020-21 | 155
CORPORATE OVERVIEW STATUTORY STATEMENTS FINANCIAL STATEMENTS
Standalone Statement of changes in equity for the year ended March 31, 2021H in lacsa) Equity share capitalParticulars Note AmountBalance as at April 1, 2019 1,226.27 Issue of equity share capital during the year 17 - Balance as at March 31, 2020 1,226.27 Issue of equity share capital during the year 17 - Balance as at March 31, 2021 1,226.27
b) Other equityParticulars Note Reserves and surplus Items of OCI Total
Capital reserve
Retained earnings
Remeasurements of defined benefit
liabilityBalance as at April 1,2019 62,380.34 4,407.56 22.66 66,810.56 Total comprehensive income for the year ended March 31, 2020Profit or loss - 1,619.92 - 1,619.92 Other comprehensive income (net of tax) - - 32.59 32.59 Total comprehensive income - 1,619.92 32.59 1,652.51 Balance as at March 31, 2020 62,380.34 6,027.48 55.25 68,463.07 Balance as at April 1, 2020 62,380.34 6,027.48 55.25 68,463.07 Total comprehensive income for the year ended March 31, 2021Profit or loss - 7,616.92 - 7,616.92 Other comprehensive income (net of tax)
- - 39.38 39.38
Total comprehensive income - 7,616.92 39.38 7,656.30 Balance as at March 31, 2021 62,380.34 13,644.40 94.63 76,119.37 Significant accounting policies 3
The accompanying notes form an integral part of the standalone financial statements
As per our report of even date attachedFor S.S. Kothari Mehta & Company For and on behalf of Board of Directors ofChartered Accountants Greenpanel Industries LimitedFirm Registration number: 000756N CIN: L20100AS2017PLC018272
Sunil Wahal Shiv Prakash Mittal Shobhan MittalPartner Executive Chairman Managing Director & CEOMembership No: 087294 (DIN : 00237242) (DIN : 00347517)
V. Venkatramani Lawkush Prasad ChiefFinancialOfficer CompanySecretary&AVP-Legal
Place : New Delhi Place : KolkataDated : May 14,2021 Dated : May 14, 2021
Standalone Statement of Cash Flows for the year ended March 31, 2021H in lacs
Year ended March 31, 2021
Year ended March 31, 2020
A. Cash flows from operating activitiesProfit before exceptional items and tax 10,833.22 2,428.64 Adjustments for:Depreciation and amortisation expense 6,386.61 6,537.86 Finance costs 2,271.26 2,956.44 Provision for doubtful debts - 100.19 Loss on sale/discard of property, plant and equipment 26.97 32.47 Interest income (222.96) (202.82)Unrealised foreign exchange fluctuations (net) (1,084.62) 348.78 Government grants - EPCG scheme (refer note 22) (1,696.28) (1,853.94)
5,680.98 7,918.98 Operating cash flows before working capital changes 16,514.20 10,347.62 Working capital adjustments:(Increase)/decrease in trade and other receivables (2,799.06) (2,806.28)(Increase)/decrease in inventories 452.87 (2,307.51)Increase/(decrease) in trade and other payables 2,597.28 5,500.87
251.09 387.08 Cash generated from operating activities 16,765.29 10,734.70 Income tax paid (net) (1,641.59) (610.83)Net cash from operating activities 15,123.70 10,123.87
B. Cash flows from investing activitiesAcquisition of property, plant and equipment (2,017.06) (2,562.68)Acquisition of investments - (534.56)Proceeds from sale of property, plant and equipment 113.46 158.28 Interest received 185.94 187.06 Net cash used in investing activities (1,717.66) (2,751.90)
C. Cash flows from financing activitiesProceeds from long term borrowings 6,000.00 - Proceeds from short term borrowings (net) (5,671.83) 2,728.94 Repayment of long term borrowings (10,870.97) (8,014.02)Interest paid (2,058.08) (2,477.38)Payment of lease liabilities (371.32) (371.99)Interest paid on lease liabilities (104.42) (110.83)Net cash flow from financing activities (13,076.62) (8,245.28)
Net (decrease)/increase in cash and cash equivalents 329.42 (873.31)Cash and cash equivalents at April 1, 2020 (refer note 12) 937.06 1,810.37 Cash and cash equivalents at March 31, 2021 (refer note 12) 1,266.48 937.06
Notes:
(i) Standalone Statement of Cash Flows has been prepared under the indirect method as set out in Ind AS 7 specified under Section 133 of the Companies Act, 2013.
(ii) Acquisition of property, plant and equipment includes movements of capital work-in-progress (including capital advances and liability for capital goods) during the year.
(iii) Change in liabilities arising from financing activities:H in lacs
Particulars As on March 31, 2020 Cash flows Fair value changes As on March 31, 2021
Non-current Borrowings including current maturities (Note 19) 53,315.61 (10,870.97) 644.46 43,089.10
Current Borrowings (Note 19) 4,541.70 (5,671.83) 2,728.94 1,598.81
The accompanying notes form an integral part of the standalone financial statements
As per our report of even date attachedFor S.S. Kothari Mehta & Company For and on behalf of Board of Directors ofChartered Accountants Greenpanel Industries LimitedFirm Registration number: 000756N CIN: L20100AS2017PLC018272
Sunil Wahal Shiv Prakash Mittal Shobhan MittalPartner Executive Chairman Managing Director & CEOMembership No: 087294 (DIN : 00237242) (DIN : 00347517)
V. Venkatramani Lawkush Prasad ChiefFinancialOfficer CompanySecretary&AVP-Legal
Place : New Delhi Place : KolkataDated : May 14, 2021 Dated : May 14, 2021
156 | Greenpanel Industries Limited Annual Report 2020-21 | 157
CORPORATE OVERVIEW STATUTORY STATEMENTS FINANCIAL STATEMENTS
Notes to the standalone financial statements for the year ended March 31, 2021 Notes to the standalone financial statements for the year ended March 31, 2021
1. Reporting entityGreenpanel Industries Limited (the ‘Company’) is a public company domiciled in India having its registered office situated at Makum Road, P.O. Tinsukia, Assam-786125, India. The Company has been incorporated under the provisions of the Indian Companies Act. The Company is primarily involved in manufacturing of plywood, medium density fibre boards (MDF) and allied products.The Company has an overseas wholly owned subsidiary company namely Greenpanel Singapore Pte. Limited, incorporated in Singapore, is engaged into trading of Medium Density Fibreboards and allied products.
2. Basis of preparation a. Statement of compliance
These standalone financial statements are prepared in accordance with Indian Accounting Standards (Ind AS) as per the Companies (Indian Accounting Standards) Rules, 2015 as amended, notified under Section 133 of the Companies Act, 2013 (‘Act’) and other relevant provisions of the Act.The standalone financial statements are authorised for issue by the Board of Directors of the Company at their meeting held on May 14, 2021.The details of the Company’s accounting policies are included in note 3
b. Functional and presentation currencyThese standalone financial statements are presented in Indian Rupees (H), which is also the Company’s functional currency. All amounts have been rounded off to the nearest lacs, unless otherwise indicated.
c. Basis of measurementThe standalone financial statements have been prepared on historical cost basis, except for the following items:Items MeasurementDerivative financial instruments Fair valueNet defined benefit (asset)/ liability Present value of defined benefit obligations
d. Use of estimates and judgementsIn preparing these standalone financial statements, management has made judgements, estimates and assumptions that affect the application of accounting policies and the reported amounts of assets, liabilities, income and expenses. Management believes that the estimates used in the preparation of the standalone financial statements are prudent and reasonable. Actual results may differ from these estimates. Estimates and underlying assumptions are reviewed on an ongoing basis. Revisions to accounting estimates are recognised prospectively.
JudgementsInformation about judgements made in applying accounting policies that have the most significant effects on the amounts recognised in the standalone financial statements is included in the note on lease classification.
Assumptions and estimation uncertaintiesInformation about assumptions and estimation uncertainties that have a significant risk of resulting in a material adjustment in the standalone financial statements for the every period ended is included in the following notes:
- Note 4 – useful life and residual value of property, plant and equipment;- Note 31 – measurement of defined benefit obligations: key actuarial assumptions;- Note 35 – recognition of deferred tax assets;- Note 37 – recognition and measurement of provisions and contingencies: key assumptions about
the likelihood and magnitude of an outflow of resources;- Note 42 – impairment of financial assets: key assumptions used in estimating recoverable cash
flows
e. Measurement of fair valuesA number of the Company’s accounting policies and disclosures require the measurement of fair values, for both financial and non-financial assets and liabilities.The Company has an established control framework with respect to the measurement of fair values. The management has overall responsibility for overseeing all significant fair value measurements and it regularly reviews significant unobservable inputs and valuation adjustments. If third party information, such as broker quotes or pricing services, is used to measure fair values, then the management assesses the evidence obtained from the third parties to support the conclusion that these valuations meet the requirements of Ind AS, including the level in the fair value hierarchy in which the valuations should be classified.Significant valuation issues are reported to the Company’s audit committee.
Fair values are categorised into different levels in a fair value hierarchy based on the inputs used in the valuation techniques as follows:
- Level 1: quoted prices (unadjusted) in active markets for identical assets or liabilities.
- Level 2: inputs other than quoted prices included in Level 1 that are observable for the asset or liability, either directly (i.e. as prices) or indirectly (i.e. derived from prices).
- Level 3: inputs for the asset or liability that are not based on observable market data (unobservable inputs).
When measuring the fair value of an asset or a liability, the Company uses observable market data as far as possible. If the inputs used to measure the fair value of an asset or a liability fall into different levels of the fair value hierarchy, then the fair value measurement is categorised in its entirety in the same level of the fair value hierarchy as the lowest level input that is significant to the entire measurement.The Company recognises transfers between levels of the fair value hierarchy at the end of the reporting period during which the change has occurred.Further information about the assumptions made in measuring fair values is included in note 41.
3. Significant accounting policies a. Current and non-current classification
All assets and liabilities are classified as current or non-current as per the Company’s normal operating cycle and other criteria set out in the Schedule III to the Act.
AssetsAn asset is classified as current when it satisfies any of the following criteria:(i) it is expected to be realised in, or is intended for sale or consumption in the Company’s normal operating
cycle;(ii) it is held primarily for the purpose of being traded;(iii) it is expected to be realised within 12 months after the reporting date; or(iv) it is cash or cash equivalent unless it is restricted from being exchanged or used to settle a liability for
at least 12 months after the reporting date.Current assets include current portion of non-current financial assets.All other assets are classified as non-current.
LiabilitiesA liability is classified as current when it satisfies any of the following criteria:
(i) it is expected to be settled in the Company’s normal operating cycle;(ii) it is held primarily for the purpose of being traded;(iii) it is due to be settled within 12 months after the reporting date; or

158 | Greenpanel Industries Limited Annual Report 2020-21 | 159
CORPORATE OVERVIEW STATUTORY STATEMENTS FINANCIAL STATEMENTS
(iv) the Company does not have an unconditional right to defer settlement of the liability for at least 12 months after the reporting date. Terms of a liability that could, at the option of the counterparty, result in its settlement by the issue of equity instruments do not affect its classification.
Current liabilities include current portion of non-current financial liabilities. All other liabilities are classified as non-current. Deferred tax assets and liabilities are classified as non-current assets and liabilities.
Operating cycleFor the purpose of current/non-current classification of assets and liabilities, the Company has ascertained its normal operating cycle as twelve months. This is based on the nature of business and the time between the acquisition of assets for processing and their realisation in cash and cash equivalents.
b. Foreign currency transactionsTransactions in foreign currencies are translated into the respective functional currency of the Company at the exchange rates prevailing at the dates of the transactions.Monetary assets and liabilities denominated in foreign currencies are translated into the functional currency at the exchange rate at the reporting date. Non-monetary assets and liabilities that are measured at fair value in a foreign currency are translated into the functional currency at the exchange rate when the fair value was determined. Non-monetary assets and liabilities that are measured based on historical cost in a foreign currency are translated at the exchange rate at the date of the transaction.Exchange differences are recognised in the Statement of Profit and Loss in the period in which they arise.
c. Financial instruments (i) Recognition and initial measurement
Trade Receivables are initially recognised when they are originated. All financial assets and financial liabilities are initially recognised when the Company becomes a party to the contractual provisions of the instrument. Trade receivables are initially measured at transaction price.A financial asset or financial liability is initially measured at fair value plus, for an item not at fair value through profit and loss (FVTPL), transaction costs that are directly attributable to its acquisition or issue.
(ii) Classification and subsequent measurement Financial assets
On initial recognition, a financial asset is classified and measured at:- Amortised cost; or- Fair value through Profit or Loss (FVTPL); or- Fair value through Other Comprehensive Income (FVTOCI).Financial assets are not reclassified subsequent to their initial recognition, except if and in the period the Company changes its business model for managing financial assets.
Financial assets at amortised costA financial asset is measured at amortised cost if it meets both of the following conditions and is not designated as at FVTPL.
(a) the asset is held within a business model whose objective is to hold assets to collect contractual cash flows; and
(b) the contractual terms of the financial asset give rise on specified dates to cash flows that are solely payments of principal and interest (SPPI) on the principal amount outstanding.
The effective interest rate (EIR) method of amortisation is included in finance income in the Statement of Profit and Loss. This category generally applies to long-term deposits and long-term trade receivables.
Financial assets at FVTPLAll financial assets which are not classified and measured at amortised cost or Fair value through other comprehensive income (FVOCI) as described above are measured at FVTPL. On initial recognition, the Company may irrevocably designate a financial asset that otherwise meets the requirements to be measured at amortised cost or at FVOCI as at FVTPL if doing so eliminates or significantly reduces an accounting mismatch that would otherwise arise.Financial assets: Assessment whether contractual cash flows are solely payments of principal and interest (SPPI).For the purposes of this assessment, ‘principal’ is defined as the fair value of the financial asset on initial recognition. ‘Interest’ is defined as consideration for the time value of money and for the credit risk associated with the principal amount outstanding during a particular period of time and for other basic lending risks and costs (e.g. liquidity risk and administrative costs), as well as a profit margin. In assessing whether the contractual cash flows are solely payments of principal and interest, the Company considers the contractual terms of the instrument. This includes assessing whether the financial asset contains a contractual term that could change the timing or amount of contractual cash flows such that it would not meet this condition.
In making this assessment, the Company considers:- contingent events that would change the amount or timing of cash flows;- terms that may adjust the contractual coupon rate, including variable interest rate features;- prepayment and extension features; and- terms that limit the Company’s claim to cash flows from specified assets (e.g. non-recourse
features).
A prepayment feature is consistent with the solely payments of principal and interest criterion if the prepayment amount substantially represents unpaid amounts of principal and interest on the principal amount outstanding, which may include reasonable additional compensation for early termination of the contract. Additionally, for a financial asset acquired at a significant discount or premium to its contractual paramount, a feature that permits or requires prepayment at an amount that substantially represents the contractual par amount plus accrued (but unpaid) contractual interest (which may also include reasonable additional compensation for early termination) is treated as consistent with this criterion if the fair value of the prepayment feature is insignificant at initial recognition.
Financial assets: Subsequent measurementFinancial assets at FVTPL: These assets are subsequently measured at fair value. Net gains and losses, including any interest or dividend income, are recognised in Statement of Profit and Loss.
Financial assets at amortised cost: These assets are subsequently measured at amortised cost using the effective interest rate (EIR) method. The amortised cost is reduced by impairment losses, if any. Interest income, foreign exchange gains and losses and impairment are recognised in Statement of Profit and Loss. Any gain or loss on derecognition is recognised in Statement of Profit and Loss.
Investments in subsidiaries are carried at cost in standalone financial statementsFinancial liabilities: Classification, subsequent measurement and gains and lossesFinancial liabilities are classified as measured at amortised cost or FVTPL.
Financial liabilities through FVTPLA financial liability is classified as at FVTPL if it is classified as held-for-trading, or it is a derivative or it is designated as such on initial recognition. Financial liabilities at FVTPL are measured at fair value and net gains and losses, including any interest expense, are recognised in Statement of Profit and Loss. This category also includes derivative financial instruments entered into by the Company that are not designated as hedging instruments in hedge relationships as defined by Ind AS 109.
Notes to the standalone financial statements for the year ended March 31, 2021 Notes to the standalone financial statements for the year ended March 31, 2021

160 | Greenpanel Industries Limited Annual Report 2020-21 | 161
CORPORATE OVERVIEW STATUTORY STATEMENTS FINANCIAL STATEMENTS
Financial liabilities at amortised costOther financial liabilities are subsequently measured at amortised cost using the effective interest rate (EIR) method. Interest expense and foreign exchange gains and losses are recognised in Statement of Profit and Loss. Any gain or loss on derecognition is also recognised in Statement of Profit and Loss. Interest bearing loans and borrowings are subsequently measured at amortised cost using the EIR method. Gains and losses are recognised in Statement of Profit and Loss when the liabilities are derecognised as well as through the EIR amortisation process. For trade and other payables maturing within one year from the balance sheet date, the carrying amounts approximates fair value due to the short maturity of these instruments.
Financial guarantee liabilitiesFinancial guarantees issued by the Company are those contracts that require payment to be made to reimburse the holder for a loss it incurs because the specified debtor fails to make a payment when due in accordance with the terms of a debt instrument. Financial guarantee contracts are recognised initially as a liability at fair value net off transaction costs that are directly attributable to the issuance of the guarantee. Subsequently, the liability is measured at the higher of the amount of loss allowance determined as per impairment requirements of Ind AS 109 and the amount recognised less cumulative amortisation.
(iii) Derecognition Financial assets
The Company derecognises a financial asset:- when the contractual rights to the cash flows from the financial asset expire, or- it transfers the rights to receive the contractual cash flows in a transaction in which substantially all
of the risks and rewards of ownership of the financial asset are transferred or in which the Company neither transfers nor retains substantially all of the risks and rewards of ownership and does not retain control of the financial asset.
Financial liabilitiesThe Company derecognises a financial liability when its contractual obligations are discharged or cancelled, or expire. The Company also derecognises a financial liability when its terms are modified and the cash flows under the modified terms are substantially different. In this case, a new financial liability based on the modified terms is recognised at fair value. The difference between the carrying amount of the financial liability extinguished and the new financial liability with modified terms is recognised in Statement of Profit and Loss.
(iv) OffsettingFinancial assets and financial liabilities are offset and the net amount presented in the balance sheet when and only when, the Company currently has a legally enforceable right to set off the amounts and it intends either to settle them on a net basis or to realise the asset and settle the liability simultaneously.
(v) Derivative financial instrumentsThe Company holds derivative financial instruments, such as foreign currency forward contracts, interest rate swaps, to hedge its foreign currency and interest rate risk exposures.Derivatives are initially measured at fair value. Subsequent to initial recognition, derivatives are measured at fair value, and changes therein are recognised in Statement of Profit and Loss. Derivatives are carried as financial assets when the fair value is positive and as financial liabilities when the fair value is negative.
d. Property, plant and equipment (i) Recognition and measurement
Items of property, plant and equipment are measured at cost, which includes capitalised borrowing costs, less accumulated depreciation and accumulated impairment losses, if any.
The cost of an item of property, plant and equipment comprises its purchase price, including import duties and non-refundable purchase taxes, after deducting trade discounts and rebates, any directly attributable cost of bringing the item to its working condition for its intended use and estimated costs of dismantling and removing the item and restoring the site on which it is located.
The cost of a self-constructed item of property, plant and equipment comprises the cost of materials and direct labour, any other costs directly attributable to bringing the item to working condition for its intended use, and estimated costs of dismantling and removing the item and restoring the site on which it is located.Borrowing costs directly attributable to the acquisition or construction of those qualifying property, plant and equipment, which necessarily take a substantial period of time to get ready for their intended use, are capitalised. If significant parts of an item of property, plant and equipment have different useful lives, then they are accounted for as separate components of property, plant and equipment.
A fixed asset is eliminated from the financial statements on disposal or when no further benefit is expected from its use. Any gain or loss on disposal of an item of property, plant and equipment is recognised in Statement of Profit and Loss. Property, plant and equipment under construction are disclosed as Capital work-in-progress. Assets retired from active use and held for disposal are stated at the lower of their net book value and fair value less cost to sell and shown under ‘Current assets’.
(ii) Subsequent expenditureSubsequent expenditure is capitalised only if it is probable that the future economic benefits associated with the expenditure will flow to the Company. Ongoing repairs and maintenance are expensed as incurred.
(iii) Depreciation and amortisationDepreciation and amortisation for the year is recognised in the Statement of Profit and Loss. Depreciation is calculated on cost of items of property, plant and equipment less their estimated residual values over their estimated useful lives using the straight line method over the useful lives of assets, in the manner specified in Part C of Schedule II of the Act.
Assets acquired under finance lease are depreciated over the shorter of the lease term and their useful life unless it is reasonably certain that the Company will obtain ownership by the end of the lease term.Freehold land is not depreciated.Leasehold land (includes development cost) is amortised on a straight line basis over the period of respective lease, except leasehold land acquired on perpetual lease. Depreciation methods, useful lives and residual values are reviewed at each financial year end and adjusted as appropriate.
The estimated useful lives of items of property, plant and equipment are as follows:
Asset Useful life as per Schedule IIBuildings 3 to 60 yearsPlant and equipments 15 to 25 yearsFurniture and fixtures 10 yearsVehicles 8 to 10 yearsOffice equipments 3 to 10 years
Depreciation method, useful lives and residual values are reviewed at each financial year-end and adjusted if appropriate. Depreciation on additions (discard/disposals) is provided on a pro-rata basis i.e. from (upto) the date on which asset is ready for use (discarded/disposed off ).
e. Intangible assets (i) Recognition and measurement
Intangible assets are initially measured at cost and subsequently measured at cost less accumulated amortisation and any accumulated impairment losses.
Notes to the standalone financial statements for the year ended March 31, 2021 Notes to the standalone financial statements for the year ended March 31, 2021
162 | Greenpanel Industries Limited Annual Report 2020-21 | 163
CORPORATE OVERVIEW STATUTORY STATEMENTS FINANCIAL STATEMENTS
(ii) Subsequent expenditureSubsequent expenditure is capitalised only when it increases the future economic benefits embodied in the specific asset to which it relates. All other expenditure, including expenditure on internally generated goodwill and brands, is recognised in profit or loss as incurred.
(iii) AmortisationAmortisation is calculated to write off the cost of intangible assets less their estimated residual values over their estimated useful lives using the straight-line method, and is included in depreciation and amortisation in Statement of Profit and Loss.The estimated useful lives are as follows:- Computer software 5 yearsAmortisation method, useful lives and residual values are reviewed at the end of each financial year and adjusted if appropriate.
f. InventoriesInventories which comprise raw materials, work-in-progress, finished goods, packing materials, stores and spares are measured at the lower of cost and net realisable value.The cost of inventories is ascertained on the ‘weighted average’ basis, and includes expenditure incurred in acquiring the inventories, production or conversion costs and other costs incurred in bringing them to their present location and condition. Raw materials, components and other supplies held for use in the production of finished products are not written down below cost except in cases where material prices have declined and it is estimated that the cost of the finished products will exceed their net realisable value. The comparison of cost and net realisable value is made on an item-by-item basis.The net realisable value of work-in-progress is determined with reference to the selling prices of related finished products.In the case of manufactured inventories and work-in-progress, cost includes an appropriate share of fixed production overheads based on normal operating capacity.Net realisable value is the estimated selling price in the ordinary course of business, less the estimated costs of completion and the estimated costs necessary to make the sale.Assessment of net realisable value is made at each subsequent reporting date. When the circumstances that previously caused inventories to be written down below cost no longer exist or when there is clear evidence of an increase in net realisable value because of changed economic circumstances, the amount of the write-down is reversed.
g. Impairment (i) Impairment of financial instruments: financial assets
Financial assets, other than those at FVTPL, are assessed for indicators of impairment at the end of each reporting period. A financial asset is ‘credit- impaired’ when one or more events that have a detrimental impact on the estimated future cash flows of the financial asset have occurred.The Company recognises loss allowances using the expected credit loss (ECL) model for the financial assets which are not fair valued through profit or loss. Loss allowance for trade receivable with no significant financing component is measured at an amount equal to lifetime of the ECL. For all other financial assets, expected credit losses are measured unless there has been a significant increase in credit risk from initial recognition in which case those are measured at lifetime of the ECL. The amount of expected credit losses (or reversal) that is required to adjust the loss allowance at the reporting date to the amount that is required to be recognised is recognised as an impairment gain or loss in Statement of Profit and Loss.In case of trade receivables, the Company follows the simplified approach permitted by Ind AS 109 Financial Instruments for recognition of impairment loss allowance. The application of simplified approach does not require the Company to track changes in credit risk. The Company calculates the
expected credit losses on trade receivables using a provision matrix on the basis of its historical credit loss experience.When determining whether the credit risk of a financial asset has increased significantly since initial recognition and when estimating expected credit losses, the Company considers reasonable and supportable information that is relevant and available without undue cost or effort. This includes both quantitative and qualitative information and analysis, based on the Company’s historical experience and informed credit assessment and including subsequent information. Loss allowances for financial assets measured at amortised cost are deducted from the gross carrying amount of the assets.The gross carrying amount of a financial asset is written off (either partially or in full) to the extent that there is no realistic prospect of recovery. This is generally the case when the Company determines that the debtor does not have assets or sources of income that could generate sufficient cash flows to repay the amounts subject to the write-off. However, financial assets that are written off could still be subject to enforcement activities in order to comply with the Company’s procedures for recovery of amounts due.
(ii) Impairment of non-financial assetsThe Company’s non-financial assets, other than inventories and deferred tax assets, are reviewed at each reporting date to determine whether there is any indication of impairment. If any such indication exists, then the asset’s recoverable amount is estimated.For impairment testing, assets that do not generate independent cash inflows are grouped together into cash-generating units (CGUs). Each CGU represents the smallest group of assets that generates cash inflows that are largely independent of the cash inflows of other assets or CGUs.The recoverable amount of a CGU (or an individual asset) is the higher of its value in use and its fair value less costs to sell. Value in use is based on the estimated future cash flows, discounted to their present value using a pre-tax discount rate that reflects current market assessments of the time value of money and the risks specific to the CGU (or the asset).The Company’s corporate assets (e.g. corporate office for providing support to various CGUs) do not generate independent cash inflows. To determine impairment of a corporate asset, recoverable amount is determined for the CGUs to which the corporate asset belongs. An impairment loss is recognised if the carrying amount of an asset or CGU exceeds its estimated recoverable amount. Impairment losses are recognised in the Statement of Profit and Loss.Impairment loss recognised in respect of a CGU is allocated first to reduce the carrying amount of any goodwill allocated to the CGU, and then to reduce the carrying amounts of the other assets of the CGU (or group of CGUs) on a pro rata basis.An impairment loss in respect of other assets for which impairment loss has been recognised in prior periods, the Company reviews at each reporting date whether there is any indication that the loss has decreased or no longer exists. An impairment loss is reversed if there has been a change in the estimates used to determine the recoverable amount. Such a reversal is made only to the extent that the asset’s carrying amount does not exceed the carrying amount that would have been determined, net of depreciation or amortisation, if no impairment loss had been recognised.Intangible assets with indefinite useful lives and intangible assets not yet available for use are tested for impairment at least annually, and whenever there is an indication that the asset may be impaired.
h. Non-current assets or disposal group held for saleNon-current assets, or disposal groups comprising assets and liabilities are classified as held for sale if it is highly probable that they will be recovered primarily through sale rather than through continuing use.Such assets, or disposal groups, are generally measured at the lower of their carrying amount and fair value less costs to sell. Any resultant loss on a disposal group is allocated first to goodwill, and then to remaining assets and liabilities on pro rata basis, except that no loss is allocated to inventories, financial assets, deferred tax assets, employee benefit assets, and biological assets, which continue to be measured in accordance with the Company’s other accounting policies. Losses on initial classification as held for sale and subsequent gains and losses on re-measurement are recognised in profit or loss.
Notes to the standalone financial statements for the year ended March 31, 2021 Notes to the standalone financial statements for the year ended March 31, 2021

164 | Greenpanel Industries Limited Annual Report 2020-21 | 165
CORPORATE OVERVIEW STATUTORY STATEMENTS FINANCIAL STATEMENTS
Once classified as held-for-sale, intangible assets and property, plant and equipment are no longer amortised or depreciated.
i. Employee benefits (i) Short-term employee benefits
Short-term employee benefit obligations are measured on an undiscounted basis and are expensed as the related service is provided. A liability is recognised for the amount expected to be paid e.g., under short-term cash bonus, if the Company has a present legal or constructive obligation to pay this amount as a result of past service provided by the employee, and the amount of obligation can be estimated reliably.
(ii) Defined contribution plansA defined contribution plan is a post-employment benefit plan under which an entity pays fixed contributions into Employees’ Provident Fund established under The Employees’ Provident Fund and Miscellaneous Provisions Act 1952 and will have no legal or constructive obligation to pay further amounts. The Company makes specified monthly contributions under employee provident fund to Government administered provident fund scheme. Obligations for contributions to defined contribution plans are recognised as an employee benefit expense in Statement of Profit and Loss in the periods during which the related services are rendered by employees.Prepaid contributions are recognised as an asset to the extent that a cash refund or a reduction in future payments is available.
(iii) Defined benefit plansA defined benefit plan is a post-employment benefit plan other than a defined contribution plan. The Company’s gratuity benefit scheme is a defined benefit plan. The Company’s net obligation in respect of defined benefit plans is calculated by estimating the amount of future benefit that employees have earned in the current and prior periods, discounting that amount and deducting the fair value of any plan assets.The calculation of defined benefit obligation is performed quarterly by an independent qualified actuary using the projected unit credit method. When the calculation results in a potential asset for the Company, the recognised asset is limited to the present value of economic benefits available in the form of any future refunds from the plan or reductions in future contributions to the plan (‘the asset ceiling’). In order to calculate the present value of economic benefits, consideration is given to any minimum funding requirements. The Company recognises all actuarial gains and losses arising from defined benefit plan immediately in the Statement of Profit and Loss.Remeasurements of the net defined benefit liability, which comprise actuarial gains and losses, the return on plan assets (excluding interest) and the effect of the asset ceiling (if any, excluding interest), are recognised in Other comprehensive income (OCI). The Company determines the net interest expense (income) on the net defined benefit liability (asset) for the period by applying the discount rate used to measure the defined benefit obligation at the beginning of the annual period to the then-net defined benefit liability (asset), taking into account any changes in the net defined benefit liability (asset) during the period as a result of contributions and benefit payments. Net interest expense and other expenses related to defined benefit plans are recognised in Statement of Profit and Loss.When the benefits of a plan are changed or when a plan is curtailed, the resulting change in benefit that relates to past service (‘past service cost’ or ‘past service gain’) or the gain or loss on curtailment is recognised immediately in Statement of Profit and Loss. The Company recognises gains and losses on the settlement of a defined benefit plan when the settlement occurs.
(iv) Other long-term employee benefitsThe Company’s net obligation in respect of long-term employee benefits other than post-employment benefits is the amount of future benefit that employees have earned in return for their service in the current and prior periods; that benefit is discounted to determine its present value. Such benefits are in form of leave encashment that accrue to employees in return of their service. The calculation of other long term employee benefits is performed quarterly by an independent qualified actuary using
the projected unit credit method. Remeasurements of the net defined benefit liability, which comprise actuarial gains and losses, the return on plan assets (excluding interest) and the effect of the asset ceiling (if any, excluding interest), are recognised in Other comprehensive income (OCI). Net interest expense and other expenses related to defined benefit plans are recognised in Statement of Profit and Loss.
(v) Termination benefitsTermination benefits are expensed at the earlier of when the Company can no longer withdraw the offer of those benefits and when the Company recognises costs for a restructuring. If benefits are not expected to be settled wholly within 12 months of the reporting date, then they are discounted.
j. Provisions (other than for employee benefits)A provision is recognised if, as a result of a past event, the Company has a present legal or constructive obligation that can be estimated reliably, and it is probable that an outflow of economic benefits will be required to settle the obligation.Provisions are determined by discounting the expected future cash flows (representing the best estimate of the expenditure required to settle the present obligation at the balance sheet date) at a pre-tax rate that reflects current market assessments of the time value of money and the risks specific to the liability.The unwinding of the discount is recognised as finance cost. Expected future operating losses are not provided for.The amount recognised as a provision is the best estimate of the consideration required to settle the present obligation at the end of the reporting period, taking into account the risks and uncertainties surrounding the obligation.
k. Revenue (i) Sale of goods
The Company follows Ind AS 115 “Revenue from Contracts with Customers.The Company manufactures and sells in plywood and allied products, medium density fibreboard and allied products. Sales are recognised when control of the products has transferred, being when the products are delivered to the dealer, the dealer has full discretion over the channel and price to sell the products, and there is no unfulfilled obligation that could affect the dealer’s acceptance of the products. Delivery occurs when the products have been shipped to the specific location, the risk of obsolescence and loss have been transferred to the dealer, and either the dealer has accepted the products in accordance with the sales contract, the acceptance provisions have lapsed, or the Company has objective evidence that all criteria for acceptance have been satisfied.The products are often sold with retrospective volume discounts based on aggregate sales over a 12 months period, cash discount on payment within specified period, promotional gift on achieving specific targets, quality claims if claims made in the specified period and other promotional expenses such as tours and travel packages to dealer, etc. Revenue from these sales is recognised based on the price specified in the contract, net of the estimated volume discounts, cash discounts, quality claims and promotional expenses. Accumulated experience is used to estimate and provide for the discounts/claims/provisions, using the expected value method, and revenue is only recognised to the extent that it is highly probable that a significant reversal will not occur. A refund liability (netted off with trade receivables) is recognised for expected volume discount payables, expected cash discount payables and expected quality claims to dealers in relation to sale made until the end of reporting period. Provision (included in other current liabilities) is recognised for expected sales promotional expenses against the sales made until the end of reporting period. No element of financing is deemed present as the sales are made with a credit term of 30-90 days, which is consistent with market practice.
(ii) Rental incomeRental income is recognised as part of other income on a straight-line basis over the term of the lease except where the rentals are structured to increase in line with expected general inflation.
Notes to the standalone financial statements for the year ended March 31, 2021 Notes to the standalone financial statements for the year ended March 31, 2021

166 | Greenpanel Industries Limited Annual Report 2020-21 | 167
CORPORATE OVERVIEW STATUTORY STATEMENTS FINANCIAL STATEMENTS
(iii) Insurance claimInsurance claim due to uncertainty in realisation are accounted for on acceptance basis.
l. Government GrantsGrants from Government are recognised at their fair value where there is reasonable assurance that the grant will be received and the Company will comply with the conditions attached thereto.Government grants related to revenue are recognised in the Statement of Profit and Loss on a systematic and rational basis in the periods in which the Company recognises the related costs for which the grants are intended to compensate and are netted off with the related expenditure. If not related to a specific expenditure, it is taken as income and presented under “Other Income”.Government grants relating to property, plant and equipment are treated as deferred income and are credited to the statement of profit and loss on a systematic basis over the expected useful life of the related asset to match them with the costs for which they are intended to compensate and presented within other income.
m. Leases (i) Determining whether an arrangement contains a lease
At inception of an arrangement, it is determined whether the arrangement is or contains a lease. The arrangement is, or contains, a lease if fulfilment of the arrangement is dependent on the use of a specific asset or assets and the arrangement conveys a right to use the asset or assets, even if that right is not explicitly specified in an arrangement.At inception or on reassessment of the arrangement that contains a lease, the payments and other consideration required by such an arrangement are separated into those for the lease and those for other elements on the basis of their relative fair values. If it is concluded for a finance lease that it is impracticable to separate the payments reliably, then an asset and a liability are recognised at an amount equal to the fair value of the underlying asset. The liability is reduced as payments are made and an imputed finance cost on the liability is recognised using the incremental borrowing rate.
(ii) Assets held under leasesLeases of property, plant and equipment that transfer to the Company substantially all the risks and rewards of ownership are classified as finance leases. The leased assets are measured initially at an amount equal to the lower of their fair value and the present value of the minimum lease payments. Subsequent to initial recognition, the assets are accounted for in accordance with the accounting policy applicable to similar owned assets.Assets held under leases that do not transfer to the Company substantially all the risks and rewards of ownership (i.e. operating leases) are not recognised in the Company’s Balance Sheet.The Company has adopted Ind AS 116, Leases from 1 April 2019. Ind AS 116 is a single, on-balance sheet lease accounting model for lessees. A lessee recognises a right-of-use asset representing its right to use the underlying asset and a lease liability representing its obligation to make lease payments. There are recognition exemptions for short-term leases and leases of low-value items. Lessor accounting remains similar to the current standard – i.e. lessors continue to classify leases as finance or operating leases. It replaces existing leases guidance, Ind AS 17, Leases. The Company has recognised new assets and liabilities for its operating leases of land and office premises facilities. The nature of expenses related to those leases has now changed because the Company has recognised a depreciation charge for right-of-use assets and interest expense on lease liabilities.Previously, the Company recognised operating lease expense on a straight-line basis over the term of the lease, and recognised assets and liabilities only to the extent that there was a timing difference between actual lease payments and the expense recognised.
(iii) Lease paymentsPayments made under operating leases are generally recognised in Statement of Profit and Loss on a straight-line basis over the term of the lease unless such payments are structured to increase in line with expected general inflation to compensate for the lessor’s expected inflationary cost increases.
Lease incentives received are recognised as an integral part of the total lease expense over the term of the lease. Minimum lease payments made under finance leases are apportioned between the finance charge and the reduction of the outstanding liability. The finance charge is allocated to each period during the lease term so as to produce a constant periodic rate of interest on the remaining balance of the liability.
n. Recognition of dividend income, interest income or expenseDividend income is recognised in Statement of Profit and Loss on the date on which the Company’s right to receive payment is established.Interest income or expense is recognised using the effective interest method. The ‘effective interest rate’ is the rate that exactly discounts estimated future cash payments or receipts through the expected life of the financial instrument to:- the gross carrying amount of the financial asset; or- the amortised cost of the financial liability.
In calculating interest income and expense, the effective interest rate is applied to the gross carrying amount of the asset (when the asset is not credit-impaired) or to the amortised cost of the liability. However, for financial assets that have become credit-impaired subsequent to initial recognition, interest income is calculated by applying the effective interest rate to the amortised cost of the financial asset. If the asset is no longer credit-impaired, then the calculation of interest income reverts to the gross basis.
o. Income taxIncome tax expense comprises of current tax and deferred tax. Current tax and deferred tax is recognised in the Statement of Profit and Loss except to the extent that it relates to a business combination, or items recognised directly in equity or in OCI.
(i) Current taxCurrent tax comprises the expected tax payable or receivable on the taxable income or loss for the year and any adjustment to the tax payable or receivable in respect of previous years. The amount of current tax reflects the best estimate of the tax amount expected to be paid or received after considering the uncertainty, if any, related to income taxes. It is measured using tax rates (and tax laws) enacted or substantively enacted by the reporting date.Current tax assets and current tax liabilities are off set only if there is a legally enforceable right to set off the recognised amounts, and it is intended to realise the asset and settle the liability on a net basis or simultaneously.
(ii) Deferred taxDeferred tax is recognised in respect of temporary differences between the carrying amounts of assets and liabilities for financial reporting purposes and the corresponding amounts used for taxation purposes (tax base). Deferred tax is also recognised in respect of carried forward tax losses and tax credits. Deferred tax is not recognised for:
- temporary differences arising on the initial recognition of assets or liabilities in a transaction that is not a business combination and that affects neither accounting nor taxable profit or loss at the time of the transaction;
- temporary differences related to investments in subsidiaries, associates and joint arrangements to the extent that the Company is able to control the timing of the reversal of the temporary differences and it is probable that they will not reverse in the foreseeable future; and
- taxable temporary differences arising on the initial recognition of goodwill.
Deferred tax assets are recognised to the extent that it is probable that future taxable profits will be available against which they can be used. The existence of unused tax losses is strong evidence that future taxable profit may not be available. Therefore, in case of a history of recent losses, the Company recognises a deferred tax asset only to the extent that it has sufficient taxable temporary differences
Notes to the standalone financial statements for the year ended March 31, 2021 Notes to the standalone financial statements for the year ended March 31, 2021

168 | Greenpanel Industries Limited Annual Report 2020-21 | 169
CORPORATE OVERVIEW STATUTORY STATEMENTS FINANCIAL STATEMENTS
or there is convincing other evidence that sufficient taxable profit will be available against which such deferred tax asset can be realised.Deferred tax assets – unrecognised or recognised, are reviewed at each reporting date and are recognised/ reduced to the extent that it is probable/ no longer probable respectively that the related tax benefit will be realised.Deferred tax is measured at the tax rates that are expected to apply to the period when the asset is realised or the liability is settled, based on the laws that have been enacted or substantively enacted by the reporting date.The measurement of deferred tax reflects the tax consequences that would follow from the manner in which the Company expects, at the reporting date, to recover or settle the carrying amount of its assets and liabilities.Deferred tax assets and liabilities are offset if there is a legally enforceable right to off set current tax liabilities and assets, and they relate to income taxes levied by the same tax authority on the same taxable entity, or on different tax entities, but they intend to settle current tax liabilities and assets on a net basis or their tax assets and liabilities will be realised simultaneously.In case of tax payable as Minimum Alternative Tax (‘MAT’) under the provisions of the Income-tax Act, 1961, the credit available under the Act in respect of MAT paid is recognised as an asset only when and to the extent there is convincing evidence that the Company will pay normal income tax during the period for which the MAT credit can be carried forward for set-off against the normal tax liability. MAT credit recognised as an asset is reviewed at each balance sheet date and written down to the extent the aforesaid convincing evidence no longer exists.
p. Borrowing costsBorrowing costs are interest and other costs (including exchange differences relating to foreign currency borrowings to the extent that they are regarded as an adjustment to interest costs) incurred in connection with the borrowing of funds. Borrowing costs directly attributable to acquisition or construction of an asset which necessarily take a substantial period of time to get ready for their intended use are capitalised as part of the cost of that asset. Other borrowing costs are recognised as an expense in the period in which they are incurred.Where there is an unrealised exchange loss which is treated as an adjustment to interest and subsequently there is a realised or unrealised gain in respect of the settlement or translation of the same borrowing, the gain to the extent of the loss previously recognised as an adjustment is recognised as an adjustment to interest.
q. Share capitalOrdinary shares are classified as equity. Incremental costs directly attributable to the issue of ordinary shares are recognised as a deduction from equity, net of any tax effects.
r. DividendsFinal dividends on shares are recorded as a liability on the date of approval by the shareholders and interim dividends are recorded as a liability on the date of declaration by the Board of Directors of the Company.
s. Cash and cash equivalentsCash and cash equivalents include cash and cash-on-deposit with banks. The Company considers all highly liquid investments with a remaining maturity at the date of purchase of three months or less and that are readily convertible to known amounts of cash to be cash equivalents.
t. Cash flow statementCash flows are reported using the indirect method, whereby profit for the period is adjusted for the effects of transactions of a non-cash nature, any deferrals or accruals of past or future operating cash receipts or payments and item of income or expenses associated with investing or financing cash flows. The cash flows from operating, investing and financing activities of the Company are segregated.
u. Earnings per shareBasic earnings per share is calculated by dividing the net profit or loss for the period attributable to equity shareholders by the weighted average number of equity shares outstanding during the period. For the purpose of calculating diluted earnings per share, the net profit or loss for the period attributable to equity shareholders and the weighted average number of shares outstanding during the period are adjusted for the effects of all dilutive potential equity shares.
v. Operating segmentAn operating segment is a component of the Company that engages in business activities from which it may earn revenues and incur expenses, including revenues and expenses that relate to transactions with any of the Company’s other components, and for which discrete financial information is available. All operating segments’ operating results are reviewed regularly by the Chief Operating Decision Maker (CODM) to make decisions about resources to be allocated to the segments and assess their performance. The CODM consists of the Executive Chairman, Managing Director & CEO and Chief Financial Officer.
The Company has currently two reportable segments namely:i) Plywood and allied productsii) Medium density fibreboards and allied products
w. Determination of fair valuesFair values have been determined for measurement and disclosure purposes based on the following methods. Where applicable, further information about the assumptions made in determining fair values is disclosed in the notes specific to that asset or liability.
(i) Non-derivative financial assetsNon-derivative financial assets are initially measured at fair value. If the financial asset is not subsequently accounted for at fair value through profit or loss, then the initial measurement includes directly attributable transaction costs. These are measured at amortised cost or at FVTPL. Investments in quoted equity instruments are measured at FVTPL.
(ii) Trade and other receivablesThe fair values of trade and other receivables are estimated at the present value of future cash flows, discounted at the market rate of interest at the measurement date. Short-term receivables with no stated interest rate are measured at the original invoice amount if the effect of discounting is immaterial. Fair value is determined at initial recognition and, for disclosure purposes, at each annual reporting date.
(iii) Derivative financial liabilitiesThe Company uses derivative financial instruments, such as forward currency contracts and interest rate swaps to hedge its foreign currency risks and interest rate risks. Such derivative financial instruments are initially recognised at fair value on the date on which a derivative contract is entered into and are subsequently re-measured at fair value.
(iv) Other non-derivative financial liabilitiesOther non-derivative financial liabilities are measured at fair value, at initial recognition and for disclosure purposes, at each annual reporting date. Fair value is calculated based on the present value of future principal and interest cash flows, discounted at the market rate of interest at the measurement date.
Notes to the standalone financial statements for the year ended March 31, 2021 Notes to the standalone financial statements for the year ended March 31, 2021

170 | Greenpanel Industries Limited Annual Report 2020-21 | 171
CORPORATE OVERVIEW STATUTORY STATEMENTS FINANCIAL STATEMENTS
Notes to the standalone financial statements for the year ended March 31, 2021H in lacs
Notes to the standalone financial statements for the year ended March 31, 2021H in lacs
4. Property, plant and equipmentSee accounting policy in note 3(d) and (g)
(a) Reconciliation of carrying amount Freehold
land Buildings Plant and
equipment Furniture
and fixtures Vehicles Office
equipment Total
Cost (Gross carrying amount)
Balance at April 1, 2019 5,533.89 12,292.72 1,13,926.45 2,319.32 2,321.65 1,222.56 1,37,616.59
Additions 1.57 289.89 338.10 197.41 27.79 70.63 925.39
Disposals/ discard - - (31.24) (46.28) (374.90) (6.65) (459.07)
Balance at March 31, 2020 5,535.46 12,582.61 1,14,233.31 2,470.45 1,974.54 1,286.54 1,38,082.91
Balance at April 1, 2020 5,535.46 12,582.61 1,14,233.31 2,470.45 1,974.54 1,286.54 1,38,082.91
Additions - 682.26 154.39 502.71 79.32 284.57 1,703.25
Disposals/ discard - (9.56) (90.93) (42.40) (254.31) (227.91) (625.11)
Balance at March 31, 2021 5,535.46 13,255.31 1,14,296.77 2,930.76 1,799.55 1,343.20 1,39,161.05
Accumulated depreciation
Balance at April 1, 2019 - 2,259.47 21,469.94 644.76 905.23 652.85 25,932.25
Depreciation for the year - 587.56 4,886.85 228.06 234.21 190.34 6,127.02
Adjustments/ disposals - - (19.94) (38.07) (204.52) (6.21) (268.74)
Balance at March 31, 2020 - 2,847.03 26,336.85 834.75 934.92 836.98 31,790.53
Balance at April 1 , 2020 - 2,847.03 26,336.85 834.75 934.92 836.98 31,790.53
Depreciation for the year - 562.78 4,823.05 232.68 193.99 180.65 5,993.15
Adjustments/ disposals - (9.30) (63.89) (36.91) (165.12) (213.37) (488.59)
Balance at March 31, 2021 - 3,400.51 31,096.01 1,030.52 963.79 804.26 37,295.09
Carrying amounts (net)
At April 1, 2019 5,533.89 10,033.25 92,456.51 1,674.56 1,416.42 569.71 1,11,684.34
At March 31, 2020 5,535.46 9,735.58 87,896.46 1,635.70 1,039.62 449.56 1,06,292.38
At March 31, 2021 5,535.46 9,854.80 83,200.76 1,900.24 835.76 538.94 1,01,865.96
(b) SecurityAs at March 31, 2021, properties with a carrying amount of H1,01,647.05 lacs (March 31, 2020: H1,06,069.99 lacs) are subject to first charge to secured borrowings (see Note 19).
5. Capital work-in-progressSee accounting policy in note 3(d) and (g)
March 31, 2021 March 31, 2020At the beginning of the year 568.84 379.33 Additions during the year 357.30 211.94 Capitalised during the year 567.74 22.43 At the end of the year 358.40 568.84
Notes: (a) As at March 31, 2021, general borrowing costs capitalised during the year amounted to HNil (March 31, 2020: H
Nil)(b) As at March 31 , 2021, properties under capital work-in-progress with a carrying amount of H358.40 lacs (March
31, 2020: H568.84 lacs) are subject to first charge to secured borrowings (see Note 19).
6. Other intangible assetsSee accounting policy in note 3(e) and (g)
(a) Reconciliation of carrying amount Software
Cost (Gross carrying amount)Balance at April 1, 2019 222.01 Additions 10.00 Disposals/write-off (0.42)Balance at March 31, 2020 231.59 Balance at April 1, 2020 231.59 Additions - Disposals/write-off (179.84)Balance at March 31, 2021 51.75 Accumulated amortisationBalance at April 1, 2019 149.63 Amortisation for the year 38.85 Adjustments/ disposals (0.42)Balance at March 31, 2020 188.06 Balance at April 1, 2020 188.06 Amortisation for the year 22.14 Adjustments/ disposals (175.93)Balance at March 31, 2021 34.27 Carrying amounts (net)At April 1 , 2019 72.38 At March 31, 2020 43.53 At March 31, 2021 17.48
7. InvestmentsSee accounting policy in note 3(c) and (g)
March 31, 2021 March 31, 2020Non-current investmentsUnquotedEquity instruments in subsidiaries carried at cost 7,750,000 (March 31, 2020: 7,750,000) equity shares of Greenpanel Singapore Pte. Ltd. (face value USD 1 each, fully paid-up)
5,244.62 5,244.62
5,244.62 5,244.62 Aggregate book value of quoted investments - -Aggregate market value of quoted investments - -Aggregate book value of unquoted investments 5,244.62 5,244.62

172 | Greenpanel Industries Limited Annual Report 2020-21 | 173
CORPORATE OVERVIEW STATUTORY STATEMENTS FINANCIAL STATEMENTS
Notes to the standalone financial statements for the year ended March 31, 2021H in lacs
Notes to the standalone financial statements for the year ended March 31, 2021H in lacs
8. Loans(Unsecured, considered good)
March 31, 2021 March 31, 2020Non-currentSecurity deposits 1,423.79 1,409.87 Loan to employees - 1.60
1,423.79 1,411.47 CurrentLoan to employees 42.53 38.23 Security deposits 34.31 58.49
76.84 96.72 1,500.63 1,508.19
9. Non-current tax assetsSee accounting policy in note 3(o)
March 31, 2021 March 31, 2020Income tax refund (net of provisions) 255.92 261.39
255.92 261.39
Current tax liabilitiesSee accounting policy in note 3(o)
March 31, 2021 March 31, 2020Income tax liabilities (net of provisions) 262.03 -
262.03 -
10. Inventories(Valued at the lower of cost and net realisable value)
See accounting policy in note 3(f) March 31, 2021 March 31, 2020
Raw materials 6,389.37 4,740.47 Work-in-progress 1,735.16 2,587.41 Finished goods 4,259.01 5,943.94 [including in transit H1,451.11 lacs (March 31, 2020 H623.46 lacs)]Stock in trade 54.93 32.10 Stores and spares 2,497.33 2,084.75
14,935.80 15,388.67
Total carrying amount of inventories is pledged as securities against borrowings, refer note 19.
The write-down of inventories to net realisable value during the year amounting to H118.41 lacs (March 31, 2020: H161.44 lacs). These are recognised as expenses during the respective period and included in changes in inventories of stock in trade.
11. Trade receivablesMarch 31, 2021 March 31, 2020
Current Unsecured - Considered good 7,775.98 7,052.11 - Credit Impaired 426.57 426.57
8,202.55 7,478.68 Less: Loss for allowances
- Credit Impaired 426.57 426.57 Net trade receivables 7,775.98 7,052.11 Of the aboveTrade receivables from related parties 130.53 43.64
Notes:
(a) No trade or other receivables are due from directors or other officers of the Company either severally or jointly with any other person. Nor any trade or other receivables are due from firms or private companies respectively in which any director is a partner, a director or a member.
(b) Information about the Company’s exposure to credit and currency risks, and loss allowances related to trade receivables are disclosed in note 42. Provision as disclosed above is on case to case basis as identified by the management.
(c) For terms and conditions of trade receivables owing from related parties, see note 39.(d) For receivables secured against borrowings, see note 19.
12. Cash and cash equivalentsSee accounting policy in note 3(s)
March 31, 2021 March 31, 2020Cash on hand 25.45 22.19 Balances with banks- On current accounts 1,241.03 414.87 - On deposit accounts (with original maturities up to 3 months) - 500.00
1,266.48 937.06
13. Other bank balancesMarch 31, 2021 March 31, 2020
Bank deposits due to mature after 3 months of original maturities but within 12 months of the reporting date*
5,891.16 28.93
5,891.16 28.93
* Pledged/lodged with various government authorities as security [H50.16 lacs (March 31, 2020 H28.93 lacs)]

174 | Greenpanel Industries Limited Annual Report 2020-21 | 175
CORPORATE OVERVIEW STATUTORY STATEMENTS FINANCIAL STATEMENTS
Notes to the standalone financial statements for the year ended March 31, 2021H in lacs
Notes to the standalone financial statements for the year ended March 31, 2021H in lacs
14. Other non-current assets(Unsecured, considered good)
March 31, 2021 March 31, 2020Capital advances 407.23 104.86 OthersUnmatured finance charges 52.34 77.01 Prepaid expenses 10.18 17.51 Balances with banks on deposit accounts - 1,200.00 Deposits against demand under appeal and/or under dispute 14.70 14.70 Amount due from sales tax authorities 17.74 75.85
502.19 1,489.93
15. Other financial assetsMarch 31, 2021 March 31, 2020
CurrentGovernment grants receivable 4,131.11 3,947.87 Export incentive receivable 31.62 48.69 Insurance claim receivable 10.65 4.12 Interest Receivable 52.78 15.76
4,226.16 4,016.44
16. Other current assets(Unsecured, considered good)
March 31, 2021 March 31, 2020To parties other than related partiesAdvances for supplies 363.58 363.48 Advances to employees 8.80 27.72 OthersPrepaid expenses 523.64 514.11 Unmatured finance charges 36.60 51.04 Balance with goods and service tax authorities 323.47 2,454.40
1,256.09 3,410.75
17. Equity share capitalSee accounting policy in note 3(q)
March 31, 2021 March 31, 2020Authorised150,000,000 (March 31,2020: 150,000,000) equity shares of H1 each 1,500.00 1,500.00 Issued, subscribed and fully paid-up122,627,395 (March 31,2020: 122,627,395) equity shares of H1 each 1,226.27 1,226.27
17. Equity share capital (contd)
(a) Reconciliation of equity shares outstanding at the beginning and at the end of the reporting yearMarch 31, 2021 March 31, 2020
Number Amount Number AmountAt the commencement of the year 12,26,27,395 1,226.27 12,26,27,395 1,226.27 Changes during the year - - - - At the end of the year 12,26,27,395 1,226.27 12,26,27,395 1,226.27
(b) Rights, preferences and restrictions attached to equity shares The Company has a single class of equity shares with par value of H1 per share. Accordingly, all equity shares rank equally with regard to dividends and share in the Company’s residual assets on winding up. The equity shareholders are entitled to receive dividend as declared by the Company from time to time. The voting rights of an equity shareholder on a poll (not on show of hands) are in proportion to its share of the paid-up equity capital of the Company. Voting rights cannot be exercised in respect of shares on which any call or other sums presently payable has not been paid. Failure to pay any amount called up on shares may lead to their forfeiture.
On winding up of the Company, the holders of equity shares will be entitled to receive the residual assets of the Company, remaining after distribution of all preferential amounts, in proportion to the number of equity shares held.
(c) Particulars of shareholders holding more than 5% shares of fully paid up equity sharesEquity shares of H1 each March 31, 2021 March 31, 2020
Number % Number %S. M. Management Pvt. Ltd. 3,16,26,965 25.79% 3,16,26,965 25.79%Prime Holdings Pvt. Ltd. 1,33,32,800 10.87% 1,33,32,800 10.87%Jwalamukhi Investment Holdings - - 1,17,87,720 9.61%Shobhan Mittal 1,05,88,380 8.63% 1,05,88,380 8.63%HDFC Trustee Company Ltd. 71,32,580 5.82% 77,12,011 6.29%
(d) The Company has not reserved any shares for issue under options and contracts/commitments for the sale of shares/ disinvestment.
(e) The Company for the period of five years immediately preceding the reporting date has not:
(i) Allotted any class of shares as fully paid pursuant to contract(s) without payment being received in cash.(ii) Allotted fully paid up shares by way of bonus shares.(iii) Bought back any class of shares.
18. Other equityMarch 31, 2021 March 31, 2020
Capital reserveAt the commencement of the year 62,380.34 62,380.34
62,380.34 62,380.34 Retained earningsAt the commencement of the year 6,027.48 4,407.56 Add: Profit for the year 7,616.92 1,619.92
13,644.40 6,027.48

176 | Greenpanel Industries Limited Annual Report 2020-21 | 177
CORPORATE OVERVIEW STATUTORY STATEMENTS FINANCIAL STATEMENTS
Notes to the standalone financial statements for the year ended March 31, 2021H in lacs
Notes to the standalone financial statements for the year ended March 31, 2021H in lacs
March 31, 2021 March 31, 2020
Other comprehensive income (OCI)At the commencement of the year 55.25 22.66 Remeasurements of the net defined benefit plans 39.38 32.59
94.63 55.25 76,119.37 68,463.07
(a) Description, nature and purpose of reserve:(i) Capital reserve: The capital reserve is created on account of the net assets transferred pursuant to the
scheme of arrangement(ii) Retained earnings: It comprises of accumulated profit/ (loss) of the Company.(iii) Other comprehensive income (OCI): It comprises of remeasurements of the net defined benefit plans on
actuarial valuation of gratuity.
(b) Disaggregation of changes in items of OCIMarch 31, 2021 March 31, 2020
Retained earningsRemeasurements of defined benefit liability/ (asset) 94.63 55.25
19. BorrowingsMarch 31, 2021 March 31, 2020
Non-current borrowingsSecuredTerm loans From banks Foreign currency loans 29,541.80 38,187.09 Rupee loans 12,924.41 9,216.99
42,466.21 47,404.08 Less: Current maturities of long term borrowings (refer note 20) 7,271.30 4,911.22
35,194.91 42,492.86 Loan against vehicles 622.89 804.23 Less: Current maturities of loan against vehicles (refer note 20) 193.96 216.35
428.93 587.88 35,623.84 43,080.74
Current borrowingsSecured From banks Foreign currency loan - buyers credit 474.62 487.15 Foreign currency loan - Packing Credit - 509.06 Rupee loans - repayable on demand 746.26 5,886.50
1,220.88 6,882.71 Unsecured From banks Channel finance assurance facility 377.93 302.10
18. Other equity (contd)
March 31, 2021 March 31, 2020 Foreign currency loan - bill discounting - 85.83
377.93 387.93 1,598.81 7,270.64
Information about the Company’s exposure to credit and currency risks, and loss allowances related to borrowings are disclosed in note 42
(A) Terms of repaymentName of the lender Interest rate Repayment
scheduleYear of
maturityMarch 31,
2021March 31,
2020(i) Foreign currency term loans
Landesbank Baden-Wurttenberg [EUR 356.37 lacs (March 31, 2020: EUR 378.64 lacs)]
6 month Euribor +0.50%
Repayable at half yearly rest: 16 of
EUR 22.27 lacs
2028-29 30,559.52 31,552.49
Standard Chartered Bank [USD Nil (March 31, 2020: USD 104.50 lacs)]
- - - - 7,899.16
30,559.52 39,451.65 Unamortised processing fees (1,017.72) (1,264.56)
29,541.80 38,187.09
(ii) Rupee term loansHDFC Bank Limited 6 month
MCLR + 1.50%
Repayable at quarterly rest: 8
of H400 lacs & 8 of H325 lacs
2024-25 5,800.00 7,200.00
State Bank of India 6 month MCLR + 1.50%
Repayable at quarterly rest: 15
of H375 lacs
2024-25 5,625.00 -
Axis Bank Limited 6 month MCLR +
1.35%
Repayable at quarterly rest: 10
of H156.25 lacs
2023-24 1,562.50 2,031.25
12,987.50 9,231.25 Unamortised processing fees (63.09) (14.26)
12,924.41 9,216.99 Total 42,466.21 47,404.08
(B) Details of security(a) Term loan from Landesbank Baden-Wurttenberg (LBBW) of H30,559.52 lacs (March 31, 2020: H31,552.49 lacs)
is secured by exclusive charge on Main Press Line of MDF plant at Chittoor, Andhra Pradesh along with any other movable fixed assets financed by Landesbank Baden-Wurttenberg. Vide letter dated June 14, 2019, the loan is to be further secured by:
i) Exclusive charge over main press line of MDF plant at Pantnagar (Uttarakhand)ii) Corporate guarantee from Greenply Industries Limited in favor of LBBW of EURO 12.5 million;iii) Debt Service Reserve Account in INR for one repayment instalment plus interest, pledged to LBBW
19. Borrowings (contd)
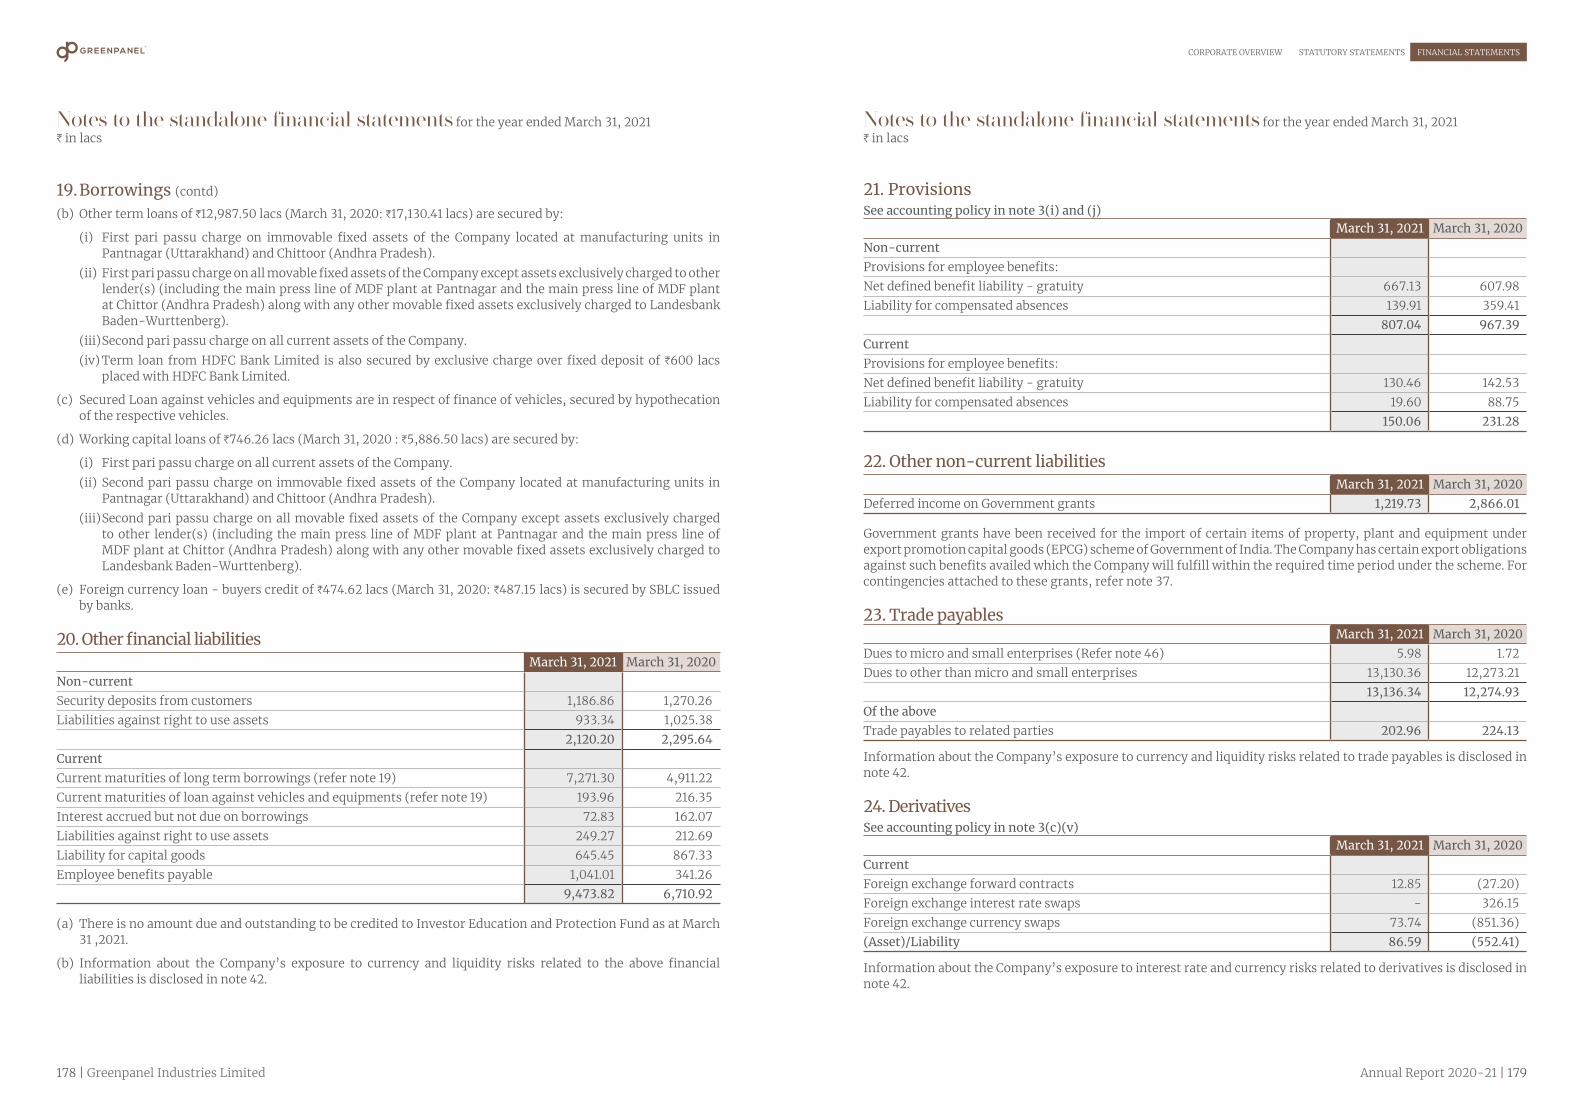
178 | Greenpanel Industries Limited Annual Report 2020-21 | 179
CORPORATE OVERVIEW STATUTORY STATEMENTS FINANCIAL STATEMENTS
Notes to the standalone financial statements for the year ended March 31, 2021H in lacs
Notes to the standalone financial statements for the year ended March 31, 2021H in lacs
(b) Other term loans of H12,987.50 lacs (March 31, 2020: H17,130.41 lacs) are secured by:
(i) First pari passu charge on immovable fixed assets of the Company located at manufacturing units in Pantnagar (Uttarakhand) and Chittoor (Andhra Pradesh).
(ii) First pari passu charge on all movable fixed assets of the Company except assets exclusively charged to other lender(s) (including the main press line of MDF plant at Pantnagar and the main press line of MDF plant at Chittor (Andhra Pradesh) along with any other movable fixed assets exclusively charged to Landesbank Baden-Wurttenberg).
(iii) Second pari passu charge on all current assets of the Company.(iv) Term loan from HDFC Bank Limited is also secured by exclusive charge over fixed deposit of H600 lacs
placed with HDFC Bank Limited.
(c) Secured Loan against vehicles and equipments are in respect of finance of vehicles, secured by hypothecation of the respective vehicles.
(d) Working capital loans of H746.26 lacs (March 31, 2020 : H5,886.50 lacs) are secured by:
(i) First pari passu charge on all current assets of the Company.(ii) Second pari passu charge on immovable fixed assets of the Company located at manufacturing units in
Pantnagar (Uttarakhand) and Chittoor (Andhra Pradesh).(iii) Second pari passu charge on all movable fixed assets of the Company except assets exclusively charged
to other lender(s) (including the main press line of MDF plant at Pantnagar and the main press line of MDF plant at Chittor (Andhra Pradesh) along with any other movable fixed assets exclusively charged to Landesbank Baden-Wurttenberg).
(e) Foreign currency loan - buyers credit of H474.62 lacs (March 31, 2020: H487.15 lacs) is secured by SBLC issued by banks.
20. Other financial liabilitiesMarch 31, 2021 March 31, 2020
Non-currentSecurity deposits from customers 1,186.86 1,270.26 Liabilities against right to use assets 933.34 1,025.38
2,120.20 2,295.64 CurrentCurrent maturities of long term borrowings (refer note 19) 7,271.30 4,911.22 Current maturities of loan against vehicles and equipments (refer note 19) 193.96 216.35 Interest accrued but not due on borrowings 72.83 162.07 Liabilities against right to use assets 249.27 212.69 Liability for capital goods 645.45 867.33 Employee benefits payable 1,041.01 341.26
9,473.82 6,710.92
(a) There is no amount due and outstanding to be credited to Investor Education and Protection Fund as at March 31 ,2021.
(b) Information about the Company’s exposure to currency and liquidity risks related to the above financial liabilities is disclosed in note 42.
19. Borrowings (contd) 21. ProvisionsSee accounting policy in note 3(i) and (j)
March 31, 2021 March 31, 2020Non-currentProvisions for employee benefits:Net defined benefit liability - gratuity 667.13 607.98 Liability for compensated absences 139.91 359.41
807.04 967.39 CurrentProvisions for employee benefits:Net defined benefit liability - gratuity 130.46 142.53 Liability for compensated absences 19.60 88.75
150.06 231.28
22. Other non-current liabilitiesMarch 31, 2021 March 31, 2020
Deferred income on Government grants 1,219.73 2,866.01
Government grants have been received for the import of certain items of property, plant and equipment under export promotion capital goods (EPCG) scheme of Government of India. The Company has certain export obligations against such benefits availed which the Company will fulfill within the required time period under the scheme. For contingencies attached to these grants, refer note 37.
23. Trade payablesMarch 31, 2021 March 31, 2020
Dues to micro and small enterprises (Refer note 46) 5.98 1.72 Dues to other than micro and small enterprises 13,130.36 12,273.21
13,136.34 12,274.93 Of the aboveTrade payables to related parties 202.96 224.13
Information about the Company’s exposure to currency and liquidity risks related to trade payables is disclosed in note 42.
24. DerivativesSee accounting policy in note 3(c)(v)
March 31, 2021 March 31, 2020CurrentForeign exchange forward contracts 12.85 (27.20)Foreign exchange interest rate swaps - 326.15 Foreign exchange currency swaps 73.74 (851.36)(Asset)/Liability 86.59 (552.41)
Information about the Company’s exposure to interest rate and currency risks related to derivatives is disclosed in note 42.

180 | Greenpanel Industries Limited Annual Report 2020-21 | 181
CORPORATE OVERVIEW STATUTORY STATEMENTS FINANCIAL STATEMENTS
Notes to the standalone financial statements for the year ended March 31, 2021H in lacs
Notes to the standalone financial statements for the year ended March 31, 2021H in lacs
25. Other current liabilitiesMarch 31, 2021 March 31, 2020
Statutory dues 832.31 332.15 Deferred income on Government grants 2,160.00 2,210.00 Advance from customers 670.15 633.84
3,662.46 3,175.99
26. Revenue from operationsSee accounting policy in note 3(k) and (l)
Year ended March 31, 2021
Year ended March 31, 2020
Sale of products Finished goods 98,742.80 82,697.62 Stock-in-trade 1,278.74 335.04
1,00,021.54 83,032.66 Other operating revenueGovernment grants - Refund of goods and service tax and excise duty (refer note 47) - 731.72 - Government grants - EPCG scheme (refer note 22) 1,696.28 1,853.94 Export incentives 145.29 189.21 Miscellaneous income 134.29 171.86
1,975.86 2,946.73 1,01,997.40 85,979.39
Reconciliation of revenue from sale of products with the contracted priceContracted price 1,06,108.77 88,811.47 Less : Trade discounts, volume rebates etc. (6,087.23) (5,778.81)Sale of products 1,00,021.54 83,032.66
Disaggregated revenue information
The disaggregation of the Company’s revenue from contracts with customers as under:
Segment Year ended March 31, 2021Plywood and
allied productsMedium Density
Fibre Board and allied products
Total
Type of GoodsFinished goods 20,431.49 78,311.31 98,742.80 Stock-in-trade 1,278.74 - 1,278.74
Sale of products 21,710.23 78,311.31 1,00,021.54 Revenue by geography- India 21,710.23 66,325.19 88,035.42 - Outside India - 11,986.12 11,986.12 Total revenue from contracts with customers 21,710.23 78,311.31 1,00,021.54
26. Revenue from operations (contd)
Segment Year ended March 31, 2020Plywood and
allied productsMedium Density
Fibre Board and allied products
Total
Type of GoodsFinished goods 21,210.73 61,486.89 82,697.62 Stock-in-trade 335.04 - 335.04
Sale of products 21,545.77 61,486.89 83,032.66 Revenue by geography- India 21,545.77 47,853.01 69,398.78 - Outside India - 13,633.88 13,633.88 Total revenue from contracts with customers 21,545.77 61,486.89 83,032.66
The reconciliation of the revenue from contracts with customers and other operating revenue is given below :
Segment Year ended March 31, 2021Plywood and
allied productsMedium Density
Fibre Board and allied products
Total
Sale of goods- External customers 21,710.23 78,311.31 1,00,021.54 - Inter-segment - - - Other Operating Revenue 28.08 1,947.78 1,975.86
21,738.31 80,259.09 1,01,997.40 Inter-segment elimination - - - Less: Other Operating Revenue (28.08) (1,947.78) (1,975.86)Total revenue from contracts with customers 21,710.23 78,311.31 1,00,021.54
Segment Year ended March 31, 2020Plywood and
allied productsMedium Density
Fibre Board and allied products
Total
Sale of goods- External customers 21,545.77 61,486.89 83,032.66 - Inter-segment - - - Other Operating Revenue 48.13 2,898.60 2,946.73
21,593.90 64,385.49 85,979.39 Inter-segment elimination - - - Less: Other Operating Revenue (48.13) (2,898.60) (2,946.73)Total revenue from contracts with customers 21,545.77 61,486.89 83,032.66

182 | Greenpanel Industries Limited Annual Report 2020-21 | 183
CORPORATE OVERVIEW STATUTORY STATEMENTS FINANCIAL STATEMENTS
Notes to the standalone financial statements for the year ended March 31, 2021H in lacs
Notes to the standalone financial statements for the year ended March 31, 2021H in lacs
26. Revenue from operations (contd)
a) The Company presented disaggregated revenue based on the type of goods sold to customers and location of customers. The Company’s revenue is recognised for goods transferred at a point in time. The Company believes that the above disaggregation the best depicts how the nature, amount, timing and uncertainty of revenues and cash flows are effected by industry, market and other economic factors. Segment wise nature, amount, timing and uncertainty of revenues and cash flows are described below:
Nature of goods or services
The Company manufactures and sales, plywood and other plywood-related allied products such as veneer, doors, etc, Medium Density Fibre Board and allied products such as fibre board, plank, etc.
When revenue is recognised
For Domestic Customer : Revenue is typically recognised when the goods are delivered to the customer's warehouses. For Export Customer : Revenue is typically recognised on the receipt of bill of lading.
Significant payment terms
Payment is received as per the agreed payment terms with customer.
Obligations for returns and refunds, if any
Customers have the right to return the goods to the company, if the customers are dissatisfied with the quality of product which is determined on a case to case basis by the company.
b) For contract balances i.e. trade receivables refer Note 11.
c) The amount of revenue from contracts with customers recognised in the statement of profit and loss is the contracted price.
27. Other incomeYear ended
March 31, 2021Year ended
March 31, 2020Interest on fixed deposits with banks and others 222.96 202.82 Rental Income 1.20 0.87 Foreign exchange fluctuations 34.12 -
258.28 203.69
28. Cost of materials consumedYear ended
March 31, 2021Year ended
March 31, 2020Inventory of raw materials at the beginning of the year 4,740.47 3,695.02 Add: Purchases 44,287.19 39,915.78 Less: Inventory of raw materials at the end of the year (6,389.37) (4,740.47)
42,638.29 38,870.33
29. Purchase of stock in trade Year ended
March 31, 2021Year ended
March 31, 2020Purchase of traded goods 1,000.66 401.11
1,000.66 401.11
30. Changes in inventories of finished goods, work-in-progress and stock in trade See accounting policy in note 3(f)
Year ended March 31, 2021
Year ended March 31, 2020
Opening inventoriesWork-in-progress 2,587.41 2,423.13 Stock in trade 32.10 - Finished goods 5,943.94 5,053.59
8,563.45 7,476.72 Closing inventoriesWork-in-progress 1,735.16 2,587.41 Stock in trade 54.93 32.10 Finished goods 4,259.01 5,943.94
6,049.10 8,563.45 2,514.35 (1,086.73)
31. Employees benefits expenseSee accounting policy in note 3(i)
Year ended March 31, 2021
Year ended March 31, 2020
Salaries, wages, bonus, etc. 8,302.20 8,290.46 Contribution to provident and other funds 508.73 535.71 Expenses related to post-employment defined benefit plan 191.51 181.44 Expenses related to compensated absences 199.26 138.66 Staff welfare expenses 74.75 131.46
9,276.45 9,277.73
Salaries, wages, bonus, etc. includes H602.31 lacs (March 31, 2020 H619.94 lacs) relating to outsource manpower cost.
Notes:
(a) Defined contribution plan: Employee benefits in the form of provident fund is considered as defined contribution plan and the contributions to Employees’ Provident Fund Organisation established under The Employees’ Provident Fund and Miscellaneous Provisions Act 1952 is charged to the Statement of Profit and Loss of the year when the contributions to the respective funds are due.
(b) Defined benefit plan: Retirement benefits in the form of gratuity is considered as defined benefit obligations and is provided for on the basis of third party actuarial valuation, using the projected unit credit method, as at the date of the Balance Sheet. Every Employee who has completed five years or more of service is entitled to gratuity on terms not less favourable than the provisions of The Payment of Gratuity Act, 1972.

184 | Greenpanel Industries Limited Annual Report 2020-21 | 185
CORPORATE OVERVIEW STATUTORY STATEMENTS FINANCIAL STATEMENTS
Notes to the standalone financial statements for the year ended March 31, 2021H in lacs
Notes to the standalone financial statements for the year ended March 31, 2021H in lacs
31. Employees benefits expense (contd)
(c) Actuarial valuation of gratuity liability
Year ended March 31, 2021
Year ended March 31, 2020
Defined benefit costCurrent service cost 138.98 135.80 Interest expense on defined benefit obligation 52.54 45.64 Defined benefit cost in Statement of Profit and Loss 191.52 181.44 Remeasurements from financial assumptions 13.15 60.85 Remeasurements from experience adjustments (73.69) (110.95)Defined benefit cost in Other Comprehensive Income (OCI) (60.54) (50.10)Total defined benefit cost in Statement of Profit and Loss and OCI 130.98 131.34 Movement in defined benefit obligationBalance at the beginning of the year 750.51 684.88 Current service cost 138.98 135.80 Interest cost 52.54 45.64 Actuarial (gains)/ losses recognised in other comprehensive income (60.54) (50.10)Benefits paid (83.90) (65.71)Balance at the end of the year 797.59 750.51 Sensitivity analysisSalary escalation - Increase by 1% 878.60 822.43 Salary escalation - Decrease by 1% 727.93 688.60 Withdrawal rates - Increase by 1% 798.38 751.80 Withdrawal rates - Decrease by 1% 796.10 748.53 Discount rates - Increase by 1% 730.48 690.63 Discount rates - Decrease by 1% 876.60 820.87 Actuarial assumptionsMortality table IALM 2012-
2014IALM 2006-
2008Discount rate (per annum) 6.90% 7.00%Rate of escalation in salary (per annum) 6.00% 6.00%Withdrawal rate 1% - 8% 1% - 8%Weighted average duration of defined benefit obligation (in years) 5.72 4.80
(d) Amount incurred as expense for defined contribution to Provident Fund is H436.77 lacs (March 31, 2020 H455.44 lacs)
32. Finance costsSee accounting policy in note 3(p)
Year ended March 31, 2021
Year ended March 31, 2020
Interest expense on financial liabilities measured at amortised cost 1,820.99 2,504.59 Interest expense on right to use asset 104.42 110.83 Interest expense on mark to market valuation of IRS contracts and principal hedging
598.95 (502.09)
Exchange difference regarded as an adjustment to borrowing cost 649.87 2,312.39 Other borrowing cost 345.85 341.02
3,520.08 4,766.74
33. Depreciation and amortisation expense See accounting policy in note 3(d)(iii) and (e)(iii)
Year ended March 31, 2021
Year ended March 31, 2020
Depreciation of property, plant and equipment 5,993.15 6,127.02 Depreciation of right to use asset 371.32 371.99 Amortisation of intangible assets 22.14 38.85
6,386.61 6,537.86
34. Other expensesYear ended
March 31, 2021Year ended
March 31, 2020Consumption of stores and spares 1,151.38 1,177.91 Power and fuel 9,922.87 10,086.67 Rent 214.78 155.57 Repairs to:
- buildings 36.99 91.86 - plant and equipment 907.32 831.28 - others 501.42 528.21
Insurance 610.68 266.35 Rates and taxes 49.65 22.48 Travelling expenses 487.63 1,158.88 Freight and delivery expenses 5,520.39 4,186.32 Export expenses 2,358.11 1,997.20 Advertisement and sales promotion 1,065.75 884.91 Commission 1,224.87 863.02 Directors sitting fees 23.60 19.58 Payment to auditors [refer note 34 (i) below] 31.83 25.96 Expenditure on corporate social responsibility 18.63 34.53 Loss on sale/discard of property, plant and equipment 26.97 32.47

186 | Greenpanel Industries Limited Annual Report 2020-21 | 187
CORPORATE OVERVIEW STATUTORY STATEMENTS FINANCIAL STATEMENTS
Notes to the standalone financial statements for the year ended March 31, 2021H in lacs
Notes to the standalone financial statements for the year ended March 31, 2021H in lacs
Year ended March 31, 2021
Year ended March 31, 2020
Provision for doubtful debts - 100.19 Foreign exchange fluctuations - 373.14 Miscellaneous expenses 1,933.15 2,150.87
26,086.02 24,987.40
34 (i) Payment to auditorsYear ended
March 31, 2021Year ended
March 31, 2020As auditors:
- Statutory audit 27.50 21.00 - Tax audit - - - Limited review of quarterly results 3.90 3.90
In other capacity - Certification fees 0.43 0.73 - Other services - -
Reimbursement of expenses - 0.33 31.83 25.96
35. Income taxSee accounting policy in note 3(o)
Year ended March 31, 2021
Year ended March 31, 2020
(a) Amount recognised in Profit and LossCurrent tax 1,909.09 258.85 Earlier years tax - - Income tax 1,909.09 258.85 Deferred tax 3,216.30 (275.02)Mat credit (1,909.09) (258.85)Deferred tax 1,307.21 (533.87)Tax expense in Statement of Profit and Loss 3,216.30 (275.02)Deferred tax in other comprehensive income 21.16 17.51 Tax expense in Total Comprehensive Income 3,237.46 (257.51)
(b) Reconciliation of effective tax rate for the yearProfit before Tax 10,833.22 1,344.90 Applicable Income Tax rate 34.944% 34.944%Computed tax expense 3,785.56 469.96 Additional deduction as per income tax - (15.44)Non-deductible expenses for tax purposes 6.51 12.07 Permanent difference on account of EPCG income (592.75) (647.84)Other temporary differences 16.98 (93.77)Tax expense in Statement of Profit and Loss 3,216.30 (275.02)
34. Other expenses (contd)
Year ended March 31, 2021
Year ended March 31, 2020
(c) Recognised deferred tax assets and liabilities:Property, plant and equipment and intangible assets 15,295.59 15,434.77 Provisions for employee benefits (355.84) (483.02)Provision for doubtful debts (163.46) (151.99)Foreign exchange differences on account of mark to market valuation (794.14) (936.41)Other temporary differences (475.13) (252.99)Unabsorbed depreciation carried forward (8,822.36) (12,163.16)Minimum Alternate Tax (MAT) credit (2,667.35) (758.26)Deferred tax liabilities 2,017.31 688.94
(d) Reconciliation of Deferred Tax Liability:Temporary difference on account of:Property, plant and equipment and intangible assets (139.18) 700.83 Provisions for employee benefits 106.02 (32.18)Provision for doubtful debts (11.47) (30.23)Foreign exchange differences on account of mark to market valuation 142.27 (936.41)Other temporary differences (222.14) (243.30)Unabsorbed depreciation carried forward 3,340.80 266.27 Minimum Alternate Tax (MAT) credit entitlement (1,909.09) (258.85)Deferred tax in Statement of Profit and Loss 1,307.21 (533.87)Temporary difference of liabilities in other comprehensive income 21.16 17.51 Deferred tax in Total Comprehensive Income 1,328.37 (516.36)MAT credit utilisation in income tax for earlier years - - Total Deferred tax 1,328.37 (516.36)
36. Earnings per shareYear ended
March 31, 2021Year ended
March 31, 2020Basic and diluted earnings per share(i) Profit for the year, attributable to the equity shareholders 7,616.92 1,619.92 (ii) Weighted average number of equity shares
- Number of equity shares at the beginning of the year 12,26,27,395 12,26,27,395 - Number of equity shares at the end of the year 12,26,27,395 12,26,27,395
Weighted average number of equity shares 12,26,27,395 12,26,27,395 Basic and diluted earnings per share (H) [(i)/(ii)] 6.21 1.32
35. Income tax (contd)
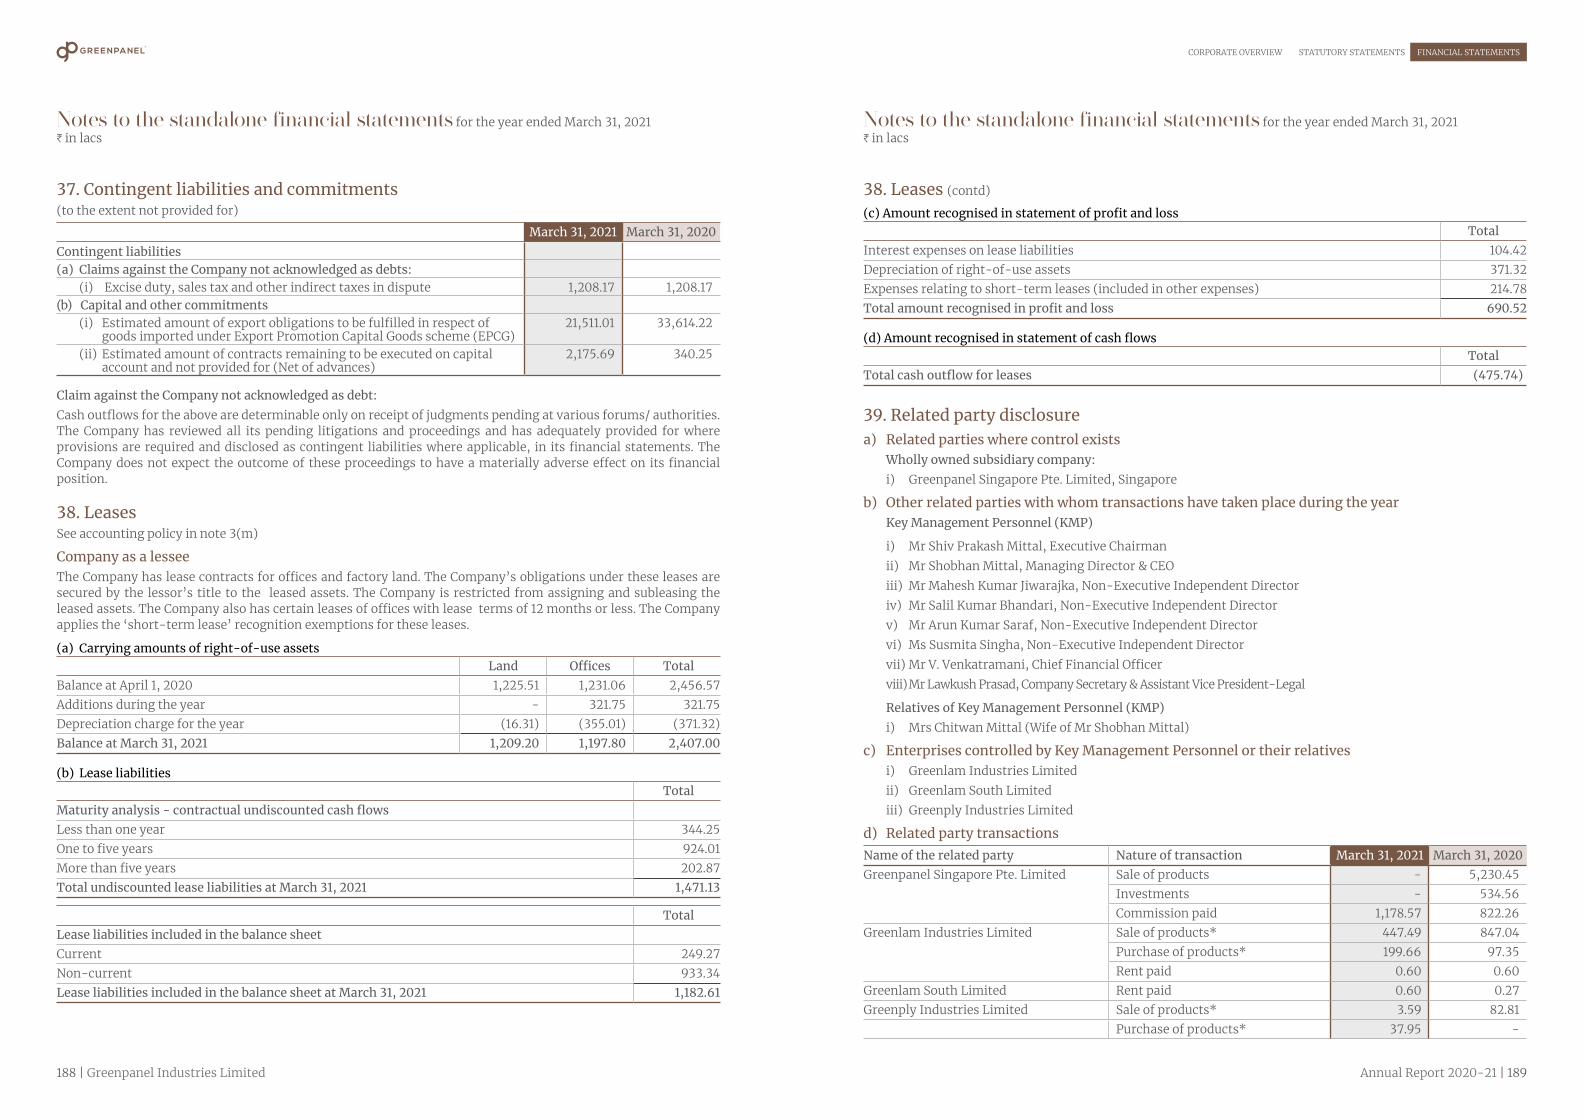
188 | Greenpanel Industries Limited Annual Report 2020-21 | 189
CORPORATE OVERVIEW STATUTORY STATEMENTS FINANCIAL STATEMENTS
Notes to the standalone financial statements for the year ended March 31, 2021H in lacs
Notes to the standalone financial statements for the year ended March 31, 2021H in lacs
37. Contingent liabilities and commitments (to the extent not provided for)
March 31, 2021 March 31, 2020Contingent liabilities(a) Claims against the Company not acknowledged as debts:
(i) Excise duty, sales tax and other indirect taxes in dispute 1,208.17 1,208.17 (b) Capital and other commitments (i) Estimated amount of export obligations to be fulfilled in respect of
goods imported under Export Promotion Capital Goods scheme (EPCG) 21,511.01 33,614.22
(ii) Estimated amount of contracts remaining to be executed on capital account and not provided for (Net of advances)
2,175.69 340.25
Claim against the Company not acknowledged as debt:Cash outflows for the above are determinable only on receipt of judgments pending at various forums/ authorities. The Company has reviewed all its pending litigations and proceedings and has adequately provided for where provisions are required and disclosed as contingent liabilities where applicable, in its financial statements. The Company does not expect the outcome of these proceedings to have a materially adverse effect on its financial position.
38. LeasesSee accounting policy in note 3(m)
Company as a lesseeThe Company has lease contracts for offices and factory land. The Company’s obligations under these leases are secured by the lessor’s title to the leased assets. The Company is restricted from assigning and subleasing the leased assets. The Company also has certain leases of offices with lease terms of 12 months or less. The Company applies the ‘short-term lease’ recognition exemptions for these leases.
(a) Carrying amounts of right-of-use assets Land Offices Total
Balance at April 1, 2020 1,225.51 1,231.06 2,456.57 Additions during the year - 321.75 321.75 Depreciation charge for the year (16.31) (355.01) (371.32)Balance at March 31, 2021 1,209.20 1,197.80 2,407.00
(b) Lease liabilitiesTotal
Maturity analysis - contractual undiscounted cash flowsLess than one year 344.25 One to five years 924.01 More than five years 202.87 Total undiscounted lease liabilities at March 31, 2021 1,471.13
TotalLease liabilities included in the balance sheetCurrent 249.27 Non-current 933.34 Lease liabilities included in the balance sheet at March 31, 2021 1,182.61
38. Leases (contd)
(c) Amount recognised in statement of profit and loss Total
Interest expenses on lease liabilities 104.42 Depreciation of right-of-use assets 371.32 Expenses relating to short-term leases (included in other expenses) 214.78 Total amount recognised in profit and loss 690.52
(d) Amount recognised in statement of cash flows Total
Total cash outflow for leases (475.74)
39. Related party disclosurea) Related parties where control exists Wholly owned subsidiary company: i) Greenpanel Singapore Pte. Limited, Singapore
b) Other related parties with whom transactions have taken place during the year Key Management Personnel (KMP)
i) Mr Shiv Prakash Mittal, Executive Chairmanii) Mr Shobhan Mittal, Managing Director & CEOiii) Mr Mahesh Kumar Jiwarajka, Non-Executive Independent Directoriv) Mr Salil Kumar Bhandari, Non-Executive Independent Directorv) Mr Arun Kumar Saraf, Non-Executive Independent Directorvi) Ms Susmita Singha, Non-Executive Independent Directorvii) Mr V. Venkatramani, Chief Financial Officerviii) Mr Lawkush Prasad, Company Secretary & Assistant Vice President-Legal
Relatives of Key Management Personnel (KMP) i) Mrs Chitwan Mittal (Wife of Mr Shobhan Mittal)
c) Enterprises controlled by Key Management Personnel or their relativesi) Greenlam Industries Limitedii) Greenlam South Limitediii) Greenply Industries Limited
d) Related party transactionsName of the related party Nature of transaction March 31, 2021 March 31, 2020Greenpanel Singapore Pte. Limited Sale of products - 5,230.45
Investments - 534.56 Commission paid 1,178.57 822.26
Greenlam Industries Limited Sale of products* 447.49 847.04 Purchase of products* 199.66 97.35 Rent paid 0.60 0.60
Greenlam South Limited Rent paid 0.60 0.27 Greenply Industries Limited Sale of products* 3.59 82.81
Purchase of products* 37.95 -
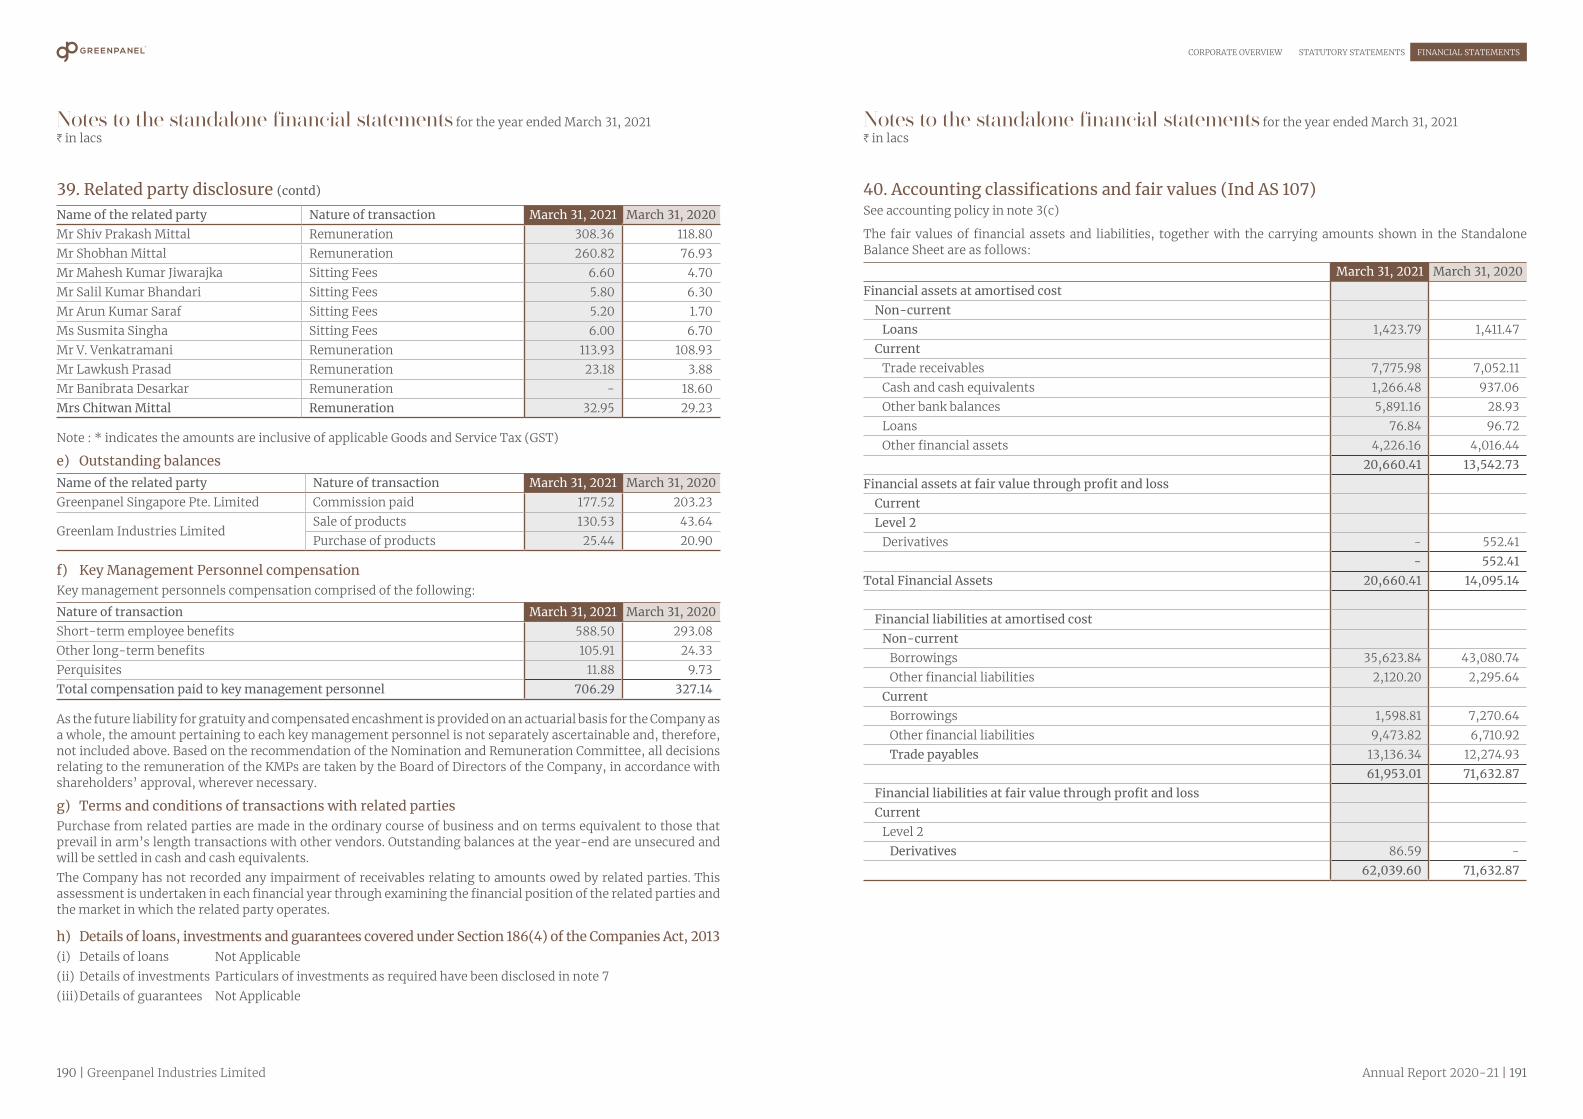
190 | Greenpanel Industries Limited Annual Report 2020-21 | 191
CORPORATE OVERVIEW STATUTORY STATEMENTS FINANCIAL STATEMENTS
Notes to the standalone financial statements for the year ended March 31, 2021H in lacs
Notes to the standalone financial statements for the year ended March 31, 2021H in lacs
Name of the related party Nature of transaction March 31, 2021 March 31, 2020Mr Shiv Prakash Mittal Remuneration 308.36 118.80 Mr Shobhan Mittal Remuneration 260.82 76.93 Mr Mahesh Kumar Jiwarajka Sitting Fees 6.60 4.70 Mr Salil Kumar Bhandari Sitting Fees 5.80 6.30 Mr Arun Kumar Saraf Sitting Fees 5.20 1.70 Ms Susmita Singha Sitting Fees 6.00 6.70 Mr V. Venkatramani Remuneration 113.93 108.93 Mr Lawkush Prasad Remuneration 23.18 3.88 Mr Banibrata Desarkar Remuneration - 18.60 Mrs Chitwan Mittal Remuneration 32.95 29.23
Note : * indicates the amounts are inclusive of applicable Goods and Service Tax (GST)
e) Outstanding balancesName of the related party Nature of transaction March 31, 2021 March 31, 2020Greenpanel Singapore Pte. Limited Commission paid 177.52 203.23
Greenlam Industries LimitedSale of products 130.53 43.64 Purchase of products 25.44 20.90
f) Key Management Personnel compensation Key management personnels compensation comprised of the following:
Nature of transaction March 31, 2021 March 31, 2020Short-term employee benefits 588.50 293.08 Other long-term benefits 105.91 24.33 Perquisites 11.88 9.73 Total compensation paid to key management personnel 706.29 327.14
As the future liability for gratuity and compensated encashment is provided on an actuarial basis for the Company as a whole, the amount pertaining to each key management personnel is not separately ascertainable and, therefore, not included above. Based on the recommendation of the Nomination and Remuneration Committee, all decisions relating to the remuneration of the KMPs are taken by the Board of Directors of the Company, in accordance with shareholders’ approval, wherever necessary.
g) Terms and conditions of transactions with related partiesPurchase from related parties are made in the ordinary course of business and on terms equivalent to those that prevail in arm’s length transactions with other vendors. Outstanding balances at the year-end are unsecured and will be settled in cash and cash equivalents.The Company has not recorded any impairment of receivables relating to amounts owed by related parties. This assessment is undertaken in each financial year through examining the financial position of the related parties and the market in which the related party operates.
h) Details of loans, investments and guarantees covered under Section 186(4) of the Companies Act, 2013(i) Details of loans Not Applicable(ii) Details of investments Particulars of investments as required have been disclosed in note 7(iii) Details of guarantees Not Applicable
39. Related party disclosure (contd) 40. Accounting classifications and fair values (Ind AS 107) See accounting policy in note 3(c)
The fair values of financial assets and liabilities, together with the carrying amounts shown in the Standalone Balance Sheet are as follows:
March 31, 2021 March 31, 2020Financial assets at amortised cost
Non-currentLoans 1,423.79 1,411.47
CurrentTrade receivables 7,775.98 7,052.11 Cash and cash equivalents 1,266.48 937.06 Other bank balances 5,891.16 28.93 Loans 76.84 96.72 Other financial assets 4,226.16 4,016.44
20,660.41 13,542.73 Financial assets at fair value through profit and loss
CurrentLevel 2
Derivatives - 552.41 - 552.41
Total Financial Assets 20,660.41 14,095.14
Financial liabilities at amortised costNon-current
Borrowings 35,623.84 43,080.74 Other financial liabilities 2,120.20 2,295.64
CurrentBorrowings 1,598.81 7,270.64 Other financial liabilities 9,473.82 6,710.92 Trade payables 13,136.34 12,274.93
61,953.01 71,632.87 Financial liabilities at fair value through profit and lossCurrent
Level 2Derivatives 86.59 -
62,039.60 71,632.87

192 | Greenpanel Industries Limited Annual Report 2020-21 | 193
CORPORATE OVERVIEW STATUTORY STATEMENTS FINANCIAL STATEMENTS
Notes to the standalone financial statements for the year ended March 31, 2021H in lacs
Notes to the standalone financial statements for the year ended March 31, 2021H in lacs
41. Fair value measurementThe fair values of the financial assets and liabilities are included at the amount at which the instrument could be exchanged in a current transaction between willing parties, other than in forced or liquidation sale.
The Company has established the following fair value hierarchy that categories the value into 3 levels. The inputs to valuation techniques used to measure fair value of financial instruments are:
Level 1: The hierarchy uses quoted prices in active markets for identical assets or liabilities. The fair value of all bonds which are traded in the stock exchanges is valued using the closing price or dealer quotations as at the reporting date.
Level 2: The fair value of financial instruments that are not traded in an active market (for example traded bonds, over the counter derivatives) is determined using valuation techniques which maximise the use of observable market data and rely as little as possible on company specific estimates. If all significant inputs required to fair value an instrument are observable, the instrument is included in Level 2.
Level 3: If one or more of the significant inputs is not based on observable market data, the instrument is included in Level 3.
Financial assets and liabilities measured at fair value - recurring fair value measurements are as follows:
March 31, 2021 March 31, 2020Financial assets - Level 2 Derivatives - 552.41 Financial liabilities - Level 2 Derivatives 86.59 -
The management assessed that trade receivables, cash and cash equivalent, other bank balances, trade payable, cash credits, borrowings and other financial assets and liabilities approximate their carrying amounts largely due to the short term maturities of these instruments.
The following methods and assumptions were used to estimate the fair values:
(a) The fair value of the quoted investments are based on market price at the respective reporting date.
(b) The fair value of interest rate swaps is calculated as the present value of the estimated future cash flows based on observable yield curves based on report obtained from banking partners.
(c) The fair value of forward foreign exchange contracts is calculated as the present value determined using forward exchange rates and interest rate curve of the respective currencies based on report obtained from banking partners.
42. Financial risk managementThe Company has exposure to the following risks arising from financial instruments:(i) Credit risk(ii) Liquidity risk(iii) Market risk
Risk management framework The Company’s principal financial liabilities, other than derivatives, comprises of borrowings, trade and other payables. The main purpose of these financial liabilities is to finance the Company operations. The Company’s principal financial assets, other than derivatives include trade and other receivables, investments and cash and cash equivalents that derive directly from its operations.
The Company’s activities expose it to a variety of financial risks, including market risk, credit risk and liquidity risk. The Company’s primary risk management focus is to minimise potential adverse effects of market risk on its financial performance. The Company uses derivative financial instruments to mitigate foreign exchange related risk exposures. Foreign currency options contract are entered to hedge certain foreign currency risk exposures and
interest rate swaps to hedge variable interest rate exposures. The Company’s exposure to credit risk is influenced mainly by the individual characteristic of each customer and the concentration of risk from the top few customers. The Company’s risk management assessment and policies and processes are established to identify and analyse the risks faced by the Company, to set appropriate risk limits and controls, and to monitor such risks and compliance with the same. Risk assessment and management policies and processes are reviewed regularly to reflect changes in market conditions and the Company’s activities.
This note presents information about the Company’s exposure to each of the above risks, the Company’s objectives, policies and processes for measuring and managing risk, and the Company’s management of capital. The sources of risks which the Company is exposed to and their management is given below:
Risk Exposure Arising from Measurement ManagementCredit risk Trade receivables, Investments,
Derivative financial instruments, LoansAgeing analysis, Credit rating
Diversification of mutual fund investments, Credit limit and credit worthiness monitoring, credit based approval process.
Liquidity risk Borrowings and Other liabilities Rolling cash flow forecasts
Adequate unused credit lines and borrowing facilities.
Market risk Foreign exchange risk
Committed commercial transaction, Financial asset and liabilities not denominated in H
Cash flow forecasting Sensitivity analysis
Forward foreign exchange contracts.
Interest rate Long term borrowings at variable rates
Sensitivity analysis Interest rate movements
Interest rate swaps
(i) Credit riskCredit risk is the risk of financial loss of the Company if a customer or counterparty to a financial instrument fails to meet its contractual obligations, and arises principally from the Company receivables from customers and loans. The Company is exposed to credit risk from its operating activities (primarily trade receivables) and from its financing/investing activities, including deposits with bank, foreign exchange transactions and financial guarantees. The Company has no significant concentration of credit risk with any counterparty. The carrying amount of financial assets represent the maximum credit risk exposure.
Trade receivableThe management has established a credit policy under which each new customer is analysed individually for creditworthiness before the Company’s standard payment and delivery terms and conditions are offered. The Company’s review includes external ratings, if they are available, financial statements, credit agency information, industry information and in some cases bank references.
Exposure to credit risksThe Company’s exposure to credit risk is influenced mainly by the individual characteristics of each customer. However management also considers the factors that may influence the credit risk of its customer base, including the default risk associated with the industry. Details of concentration percentage of revenue generated from top customer and top five customers are stated below:
Particulars March 31, 2021 March 31, 2020Revenue from a top customer 3.76% 6.29%Revenue from top five customers 9.64% 16.02%
Trade receivables are primarily unsecured and are derived from revenue earned from customers. Credit risk is managed through credit approvals, establishing credit limits and by continuously monitoring the creditworthiness of customers to which the Company grants credit terms in the normal course of business. As per simplified approach,
42. Financial risk management (contd)

194 | Greenpanel Industries Limited Annual Report 2020-21 | 195
CORPORATE OVERVIEW STATUTORY STATEMENTS FINANCIAL STATEMENTS
Notes to the standalone financial statements for the year ended March 31, 2021H in lacs
Notes to the standalone financial statements for the year ended March 31, 2021H in lacs
the Company makes provision of expected credit loss on trade receivables using a provision matrix to mitigate the risk of default payments and makes appropriate provisions at each reporting date whenever is for longer period and involves higher risk. On account of adoption of Ind AS 109, the Company uses expected credit loss model to assess the impairment loss or gain. The Company uses a provision matrix to compute the credit loss allowance for trade receivables. The said provision has been netted off under trade receivables.
Particulars March 31, 2021 March 31, 2020Balance at the beginning 426.57 326.38 Impairment loss recognised - 100.19 Balance at the end 426.57 426.57
The ageing analysis of the trade receivables (gross of provision) has been considered from the final due date of the invoice:
Ageing Not Due Less than 6 months
6-12 months More than 1 year Total
As at March 31, 2021Gross carrying amount 4,433.92 3,332.30 80.25 356.08 8,202.55 Expected credit loss (Provision for Bad Debts)
9.32 9.56 51.61 356.08 426.57
Carrying amount (net of impairment) 4,424.60 3,322.74 28.64 - 7,775.98
(ii) Liquidity riskLiquidity risk is defined as the risk that the Company will not be able to settle or meet its obligations on time or at reasonable price. Prudent liquidity risk management implies maintaining sufficient cash and marketable securities and the availability of funding through an adequate amount of credit facilities to meet obligations when due. The Company’s finance team is responsible for liquidity, finding as well as settlement management. In addition, processes and policies related to such risks are overseen by senior management. Management monitors the Company’s liquidity position through rolling forecasts on the basis of expected cash flows.
The Company’s approach to managing liquidity is to ensure, as far as possible, that it will have sufficient liquidity to meet its liabilities when they are due, under both normal and stressed conditions, without incurring unacceptable losses or risking damage to the Company’s reputation.
Exposure to liquidity riskThe table below provides details regarding the remaining contractual maturities of financial liabilities at the reporting date based on contractual undiscounted payments.
March 31, 2021 < 1 year 1 - 5 years > 5 years TotalBorrowings (including current maturities)* 10,278.39 25,900.91 11,436.65 47,615.95 Trade payables 13,136.34 - - 13,136.34 Other financial liabilities 2,022.32 1,934.05 186.15 4,142.52
25,437.05 27,834.96 11,622.80 64,894.81
March 31, 2020 < 1 year 1 - 5 years > 5 years TotalBorrowings (including current maturities)* 14,034.23 31,090.95 14,786.37 59,911.55 Trade payables 12,274.93 - - 12,274.93 Other financial liabilities 1,421.28 2,028.41 267.23 3,716.92
27,730.44 33,119.36 15,053.60 75,903.40
* including estimated interest
42. Financial risk management (contd) 42. Financial risk management (contd)
(iii) Market riskMarket risk is the risk of loss of future earnings, fair value or future cash flows that may result from a change in the price of a financial instrument . The value of a financial instrument may change as a result of changes in the interest rates, foreign currency exchange rates, commodity prices, equity prices and other market changes that effect market risk sensitive instruments. Market risk is attributable to all market risk sensitive financial instruments including investments and deposits, foreign currency receivables, payables and borrowings. The Company uses derivatives to manage market risks. All such transactions are carried out within the guidelines set by the management.
(a) Currency riskForeign currency risk is the risk impact related to fair value or future cash flows of an exposure in foreign currency, which fluctuate due to changes in foreign exchange rates. The Company’s exposure to the risk of changes in foreign exchange rates relates primarily to the foreign currency borrowings, import of raw materials and spare parts, capital expenditure, exports of finished goods. The Company evaluates exchange rate exposure arising from foreign currency transactions. The Company follows established risk management policies and standard operating procedures. It uses derivative instruments like foreign currency swaps and forwards to hedge exposure to foreign currency risk.
Exposure to currency riskThe Company’s exposure to foreign currency at the end of the reporting period are as follows:
Particulars Currency March 31, 2021 March 31, 2020Amount
in Foreign currency
I in lacs Amount in Foreign currency
I in lacs
Hedged exposuresBorrowings EURO 44,54,626 3,819.94 - -
USD - - 1,04,50,000 7,899.16 3,819.94 7,899.16
Borrowings - Buyers credit USD 6,49,235 474.62 6,44,464 487.15 Trade payables EURO 91,344 78.33 88,056 73.38
USD 3,89,488 284.74 1,98,103 149.75 363.07 223.13
Unhedged exposuresBorrowings EURO 3,11,82,383 26,739.58 3,78,64,322 31,552.49 Borrowings - Packing credit USD - - 6,73,446 509.06 Borrowings - Foreign bill discounting EURO - - 1,03,000 85.83 Trade payables EURO 87,727 75.23 41,391 34.49
USD 2,46,754 180.39 2,94,783 222.83 255.62 257.32
Liability for Capital Goods EURO 3,43,597 294.64 4,43,667 369.71 Interest accrued but not due on borrowings
EURO 82,658 70.88 88,876 74.06
USD 2,669 1.95 39,188 29.62 72.83 103.68
Trade receivables USD 11,72,986 857.51 15,27,500 1,154.64
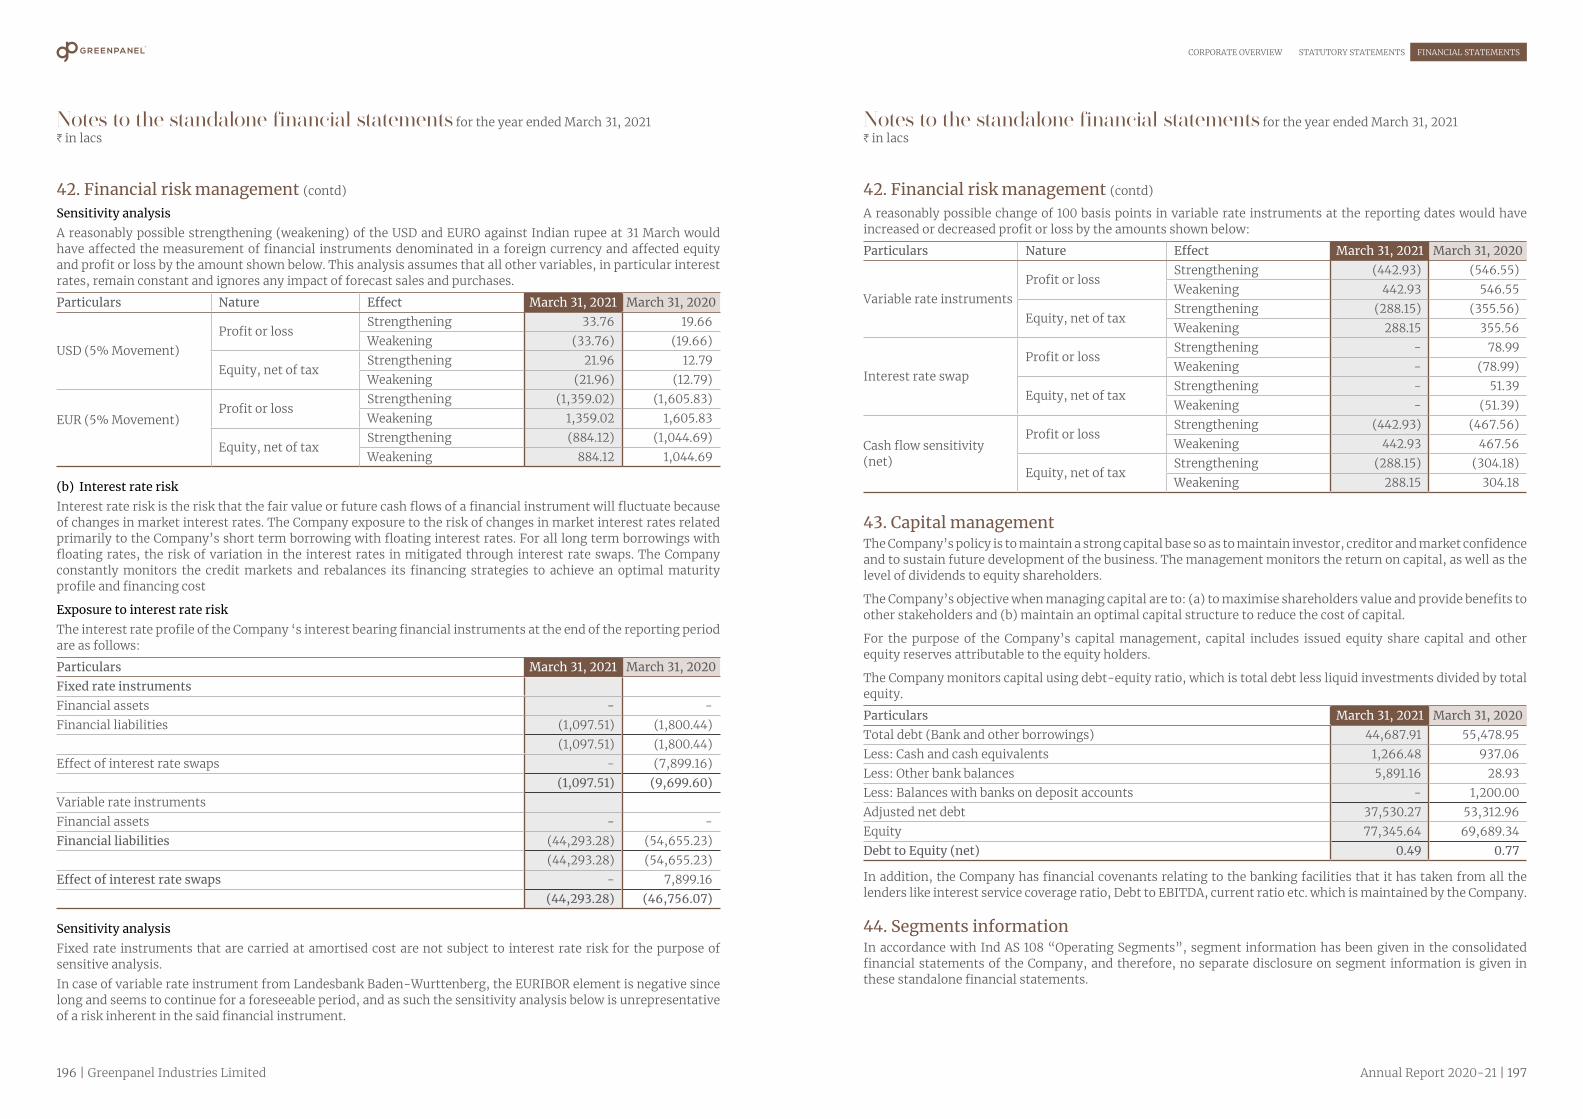
196 | Greenpanel Industries Limited Annual Report 2020-21 | 197
CORPORATE OVERVIEW STATUTORY STATEMENTS FINANCIAL STATEMENTS
Notes to the standalone financial statements for the year ended March 31, 2021H in lacs
Notes to the standalone financial statements for the year ended March 31, 2021H in lacs
Sensitivity analysisA reasonably possible strengthening (weakening) of the USD and EURO against Indian rupee at 31 March would have affected the measurement of financial instruments denominated in a foreign currency and affected equity and profit or loss by the amount shown below. This analysis assumes that all other variables, in particular interest rates, remain constant and ignores any impact of forecast sales and purchases.
Particulars Nature Effect March 31, 2021 March 31, 2020
USD (5% Movement)Profit or loss
Strengthening 33.76 19.66Weakening (33.76) (19.66)
Equity, net of taxStrengthening 21.96 12.79Weakening (21.96) (12.79)
EUR (5% Movement)Profit or loss
Strengthening (1,359.02) (1,605.83)Weakening 1,359.02 1,605.83
Equity, net of taxStrengthening (884.12) (1,044.69)Weakening 884.12 1,044.69
(b) Interest rate risk Interest rate risk is the risk that the fair value or future cash flows of a financial instrument will fluctuate because of changes in market interest rates. The Company exposure to the risk of changes in market interest rates related primarily to the Company’s short term borrowing with floating interest rates. For all long term borrowings with floating rates, the risk of variation in the interest rates in mitigated through interest rate swaps. The Company constantly monitors the credit markets and rebalances its financing strategies to achieve an optimal maturity profile and financing cost
Exposure to interest rate riskThe interest rate profile of the Company ‘s interest bearing financial instruments at the end of the reporting period are as follows:
Particulars March 31, 2021 March 31, 2020Fixed rate instrumentsFinancial assets - - Financial liabilities (1,097.51) (1,800.44)
(1,097.51) (1,800.44)Effect of interest rate swaps - (7,899.16)
(1,097.51) (9,699.60)Variable rate instrumentsFinancial assets - - Financial liabilities (44,293.28) (54,655.23)
(44,293.28) (54,655.23)Effect of interest rate swaps - 7,899.16
(44,293.28) (46,756.07)
Sensitivity analysisFixed rate instruments that are carried at amortised cost are not subject to interest rate risk for the purpose of sensitive analysis.In case of variable rate instrument from Landesbank Baden-Wurttenberg, the EURIBOR element is negative since long and seems to continue for a foreseeable period, and as such the sensitivity analysis below is unrepresentative of a risk inherent in the said financial instrument.
42. Financial risk management (contd) 42. Financial risk management (contd)
A reasonably possible change of 100 basis points in variable rate instruments at the reporting dates would have increased or decreased profit or loss by the amounts shown below:
Particulars Nature Effect March 31, 2021 March 31, 2020
Variable rate instrumentsProfit or loss
Strengthening (442.93) (546.55)Weakening 442.93 546.55
Equity, net of taxStrengthening (288.15) (355.56)Weakening 288.15 355.56
Interest rate swapProfit or loss
Strengthening - 78.99 Weakening - (78.99)
Equity, net of taxStrengthening - 51.39 Weakening - (51.39)
Cash flow sensitivity (net)
Profit or lossStrengthening (442.93) (467.56)Weakening 442.93 467.56
Equity, net of taxStrengthening (288.15) (304.18)Weakening 288.15 304.18
43. Capital managementThe Company’s policy is to maintain a strong capital base so as to maintain investor, creditor and market confidence and to sustain future development of the business. The management monitors the return on capital, as well as the level of dividends to equity shareholders.
The Company’s objective when managing capital are to: (a) to maximise shareholders value and provide benefits to other stakeholders and (b) maintain an optimal capital structure to reduce the cost of capital.
For the purpose of the Company’s capital management, capital includes issued equity share capital and other equity reserves attributable to the equity holders.
The Company monitors capital using debt-equity ratio, which is total debt less liquid investments divided by total equity.
Particulars March 31, 2021 March 31, 2020Total debt (Bank and other borrowings) 44,687.91 55,478.95 Less: Cash and cash equivalents 1,266.48 937.06 Less: Other bank balances 5,891.16 28.93 Less: Balances with banks on deposit accounts - 1,200.00 Adjusted net debt 37,530.27 53,312.96 Equity 77,345.64 69,689.34 Debt to Equity (net) 0.49 0.77
In addition, the Company has financial covenants relating to the banking facilities that it has taken from all the lenders like interest service coverage ratio, Debt to EBITDA, current ratio etc. which is maintained by the Company.
44. Segments informationIn accordance with Ind AS 108 “Operating Segments”, segment information has been given in the consolidated financial statements of the Company, and therefore, no separate disclosure on segment information is given in these standalone financial statements.

198 | Greenpanel Industries Limited Annual Report 2020-21 | 199
CORPORATE OVERVIEW STATUTORY STATEMENTS FINANCIAL STATEMENTS
Notes to the standalone financial statements for the year ended March 31, 2021H in lacs
Notes to the standalone financial statements for the year ended March 31, 2021H in lacs
45. TaxationThe Company has established a comprehensive system of maintenance of information and documents as required by the transfer pricing regulations under Sections 92-92F of the Income-Tax Act, 1961. Since the law requires existence of such information and documentation to be contemporaneous in nature, the Company continuously updates its documents for the international transactions entered into with the associated enterprises during the financial year. The management is of the opinion that its international transactions are at arm’s length so that the aforesaid legislation will not have any impact on the financial statements, particularly on the amount of tax expense for the year and that of provision for taxation.
46. Dues to Micro enterprises and small enterprises March 31, 2021 March 31, 2020
(a) The amounts remaining unpaid to Micro and Small suppliers as at the end of each accounting year- Principal 5.98 1.72 - Interest - -
(b) The amount of interest paid by the buyer in terms of Section 16 of the Micro, Small and Medium Enterprises Development Act, 2006 (MSMED Act, 2006) along with the amount of the payment made to the supplier beyond the appointed day during each accounting year.
- -
(c) The amount of interest due and payable for the period of delay in making payment (which have been paid but beyond the appointed day during the year) but without adding the interest specified under MSMED Act, 2006.
- -
(d) The amount of interest accrued and remaining unpaid at the end of each accounting year
- -
(e) The amount of further interest remaining due and payable even in the succeeding years, until such date when the interest dues as above are actually paid to the small enterprise, for the purpose of disallowance as a deductible expenditure under Section 23 of the MSMED Act, 2006.
- -
Note: The above information regarding Micro Small & Medium Enterprises has been determined to the extent such parties have been identified on the basis of the information available with the Company. The same has been relied upon by the auditors.
47. Government grant (Ind AS 20): Other operating revenue includes incentives against scheme of budgetary support under Goods and Services Tax Regime for the unit set-up in Rudrapur, Uttarakhand of H Nil (March 31 ,2020 H731.72 lacs)
Government grants receivable as on March 31, 2021 includes capital incentive subsidy of H1,477.50 lacs, power cost reimbursement subsidy of H1,541.89 lacs, and refund of goods and service tax on exports of H514.38 lacs for the unit set-up in Chittor, Andhra Pradesh. It also includes incentive receivable against scheme of budgetary support under Goods and Services Tax Regime of H597.34 lacs for the unit set-up in Rudrapur, Uttarakhand. Few of these grants are pending to be sanctioned/approved at various levels of government departments, balance are pending for disbursement by government authorities..
48. Exceptional ItemsMarch 31, 2021 March 31, 2020
Liability for repayment of central excise refund - 1,083.74
The Hon’ble Supreme Court of India vide its Order dated April 22, 2020 upheld the Special Leave Petition filed by the Union of India & Others in Civil Appeal Nos.2256-2263 of 2020 arising out of S.L.P. (C) Nos. 28194-28201/2010 in respect of availing of area based exemption under Central Excise in respect of manufacturing unit of Greenply Industries Limited (Greenply) at Tizit, Nagaland. Greenply may have to refund maximum principal amount upto H2,709.36 lacs in respect of excess refund received from the Excise Department for the period from April 1, 2008 to June 30, 2017. There is no penalty in this matter. The Excise Act does not contain any provision requiring payment of interest on amount erroneously refunded.However, as per Clause No. 4.3.6 of the Composite Scheme of Arrangement between Greenply and the Company duly approved by the Hon’ble National Company Law Tribunal, Guwahati Bench on 28 June 2019, the above principal amount of H2,709.36 lacs along with interest, if any, shall be shared by Greenply and the Company. The Company has, as a matter of abundant precaution, considered the possible outflow of H1,083.74 lacs i.e. 40% of H2,709.36 lacs as liability, based on the legal opinion and facts of present circumstances, and accordingly recognised the same as an exceptional expense in the Standalone Statement of Profit and Loss for the year eneded March 31, 2020.
49. Disclosure of Covid-19 impact on the Company Due to outbreak of COVID-19 which has been declared as a Pandemic by World Health Organization and subsequent lock down ordered by the Central and State Government(s) in India, the manufacturing facility of the Company at Rudrapur, Uttarakhand remained suspended from March 24, 2020 till May 26, 2020, and at Chittor, Andhra Pradesh from March 26, 2020 till May 21, 2020. In adherence to the safety norms prescribed by Government of India, the operations had been resumed as per Government guidelines in manufacturing units and offices. The same was scaled up in accordance with the guidelines being issued by the respective States and due consideration for safety of employees. This situation had disturbed the economic activity through interruption in manufacturing activities. The lockdown was gradually lifted and economic activity resumed to its normal levels, the Company was able to achieve normalcy in operations by end of FY2020-21. In order to maintain adequate liquidity, the Company had availed moratorium on some of the payments falling due between March 2020 and August 2020. During the fourth quarter ended March 31, 2021, revenues and profitability of the Company have seen significant improvement backed by increase in demand post lockdown.
50. Distribution made and proposed dividend (Ind AS 1) Proposed dividends on equity shares are subject to approval at the annual general meeting and are not recognised as a liability (including dividend distribution tax thereon) as at March 31, 2021. Since no dividend has been proposed in the current and previous year, financial figures with respect to the same has not been given.
51. The figures for the previous year are re-classified/ re-arranged / re -grouped, wherever necessary so as to be in conformity with the figures of the current year’s classification/disclosure.
As per our report of even date attachedFor S.S. Kothari Mehta & Company For and on behalf of Board of Directors ofChartered Accountants Greenpanel Industries LimitedFirm Registration number: 000756N CIN: L20100AS2017PLC018272
Sunil Wahal Shiv Prakash Mittal Shobhan MittalPartner Executive Chairman Managing Director & CEOMembership No: 087294 (DIN : 00237242) (DIN : 00347517)
V. Venkatramani Lawkush Prasad ChiefFinancialOfficer CompanySecretary&AVP-Legal
Place : New Delhi Place : KolkataDated : May 14, 2021 Dated : May 14, 2021
48. Exceptional Items (contd)

200 | Greenpanel Industries Limited Annual Report 2020-21 | 201
CORPORATE OVERVIEW STATUTORY STATEMENTS FINANCIAL STATEMENTS
INDEPENDENT AUDITORS’ REPORT
To The Members ofGreenpanel Industries Limited
Report on the Audit of the Consolidated Financial StatementsOpinionWe have audited the accompanying consolidated financial statements of GREENPANEL INDUSTRIES LIMITED (here in after referred as the “Parent Company”) and its subsidiary (the company and its subsidiary together referred to as “the Group”), which comprise the consolidated balance sheet as at March 31,2021, the consolidated statement of profit and loss (including other comprehensive income), the consolidated statement of changes in equity and the consolidated statement of cash flows for the year ended on that date, and notes to consolidated financial statements including a summary of the significant accounting policies (here in after referred to as “the consolidated financial statements”).
In our opinion and to the best of our information and according to the explanations given to us and based on the consideration of reports of the other auditors on separate financial statements of the subsidiary referred to in the other matters section below, the aforesaid consolidated financial statements give the information required by the Companies Act, 2013(“the Act”) in the manner so required and give a true and fair view in conformity with theIndian Accounting Standards prescribed under section 133 of the Act read with there levant rules made thereunder, as amended, and other accounting principles generally accepted in India, of the consolidated state of affairs of the Group as at March 31,2021,the consolidated total comprehensive income, consolidated changes in equity and its consolidated cashflows for the year then ended.
Basis for OpinionWe conducted our audit of the consolidated financial statements in accordance with the Standards on Auditing specified under section 143(10) of the Act(SAs). Our responsibilities under those Standards are further described in the Auditor’s Responsibilities for the Audit of the Consolidated Financial Statements section of our report. We are independent of the Group in accordance with the Code of Ethics issued by the Institute of Chartered Accountants of India (ICAI) together with the independence requirements that
are relevant to our audit of the consolidated financial statements under the provisions of the Act and the Rules made thereunder,and we have fulfilled our other ethical responsibilities in accordance with the Act and the ICAI’s Code of Ethics. We believe that the audit evidence we have obtained and the audit evidence obtained by the other auditors in terms of their reports referred to in paragraph (a) of “Other Matters” below is sufficient and appropriate to provide a basis for our audit opinion on the consolidated financial statements.
Emphasis of MatterWe draw attention to Note 49 to the consolidated financial statements, which describes in detail the uncertainties and the impact of Covid-19 pandemic on the Company’s operations and results as assessed by the management. Due to outbreak of COVID-19 pandemic, the economic activity is disturbed which may impact revenues, profitability and liquidity of the Company. The exact impact is not determinable as on date. Our opinion is not modified in respect of this matter.
Key Audit MattersKey audit matters are those matters that, in our professional judgment, were of most significance in our audit of the consolidated financial statements for the financial year ended March 31, 2021. These matters were addressed in the context of our audit of the consolidated financial statements as a whole, and in forming our opinion thereon, and we do not provide a separate opinion on these matters. For each matter below, our description of how our audit addressed the matter is provided in that context.
We have determined the matters described below to be the key audit matters to be communicated in our report. We have fulfilled the responsibilities described in the Auditor’s Responsibilities for the audit of the consolidated financial statements section of our report, including in relation to these matters. Accordingly, our audit included the performance of procedures designed to respond to our assessment of the risks of material misstatement of the consolidated financial statements. The results of our audit procedures, including the procedures performed to address the matters below, provide the basis for our audit opinion on the accompanying consolidated financial statements.
Consolidated Consolidated Financial Financial
StatementsStatements
202 | Greenpanel Industries Limited Annual Report 2020-21 | 203
CORPORATE OVERVIEW STATUTORY STATEMENTS FINANCIAL STATEMENTS
Key audit matters How our audit addressed the key audit mattersRevenue recognition on sale of goods and impairment loss allowance on trade receivables Revenue is measured based on the transaction price, which is the consideration, adjusted for volume discounts, rebates, scheme allowances, price concessions, incentives and returns, if any, (‘variable consideration’) as specified in the contracts with the customers.
An estimate of variable consideration payable to the customers is recorded as at the year-end. Such estimation is done based on the terms of contracts, rebates and discounts schemes and historical experience.
In accordance with Ind AS 109 – Financial Instruments, the Parent Company follows ‘simplified approach’ for recognition of impairment loss allowance on trade receivables. In calculating the impairment loss allowance, the Parent Company has considered its credit assessment and other related credit information for its customers to estimate the probability of default in future and has considered estimates of possible effect from increased uncertainties in economic environment. We identified estimation of variable consideration and impairment loss allowance on trade receivables as a key audit matter because the Parent Company’s management exercises significant judgments and estimates in calculating the said variable consideration and impairment loss allowance.
Our audit procedures included, amongst others: a. We read and evaluated the Parent Company’s policies
for revenue recognition and impairment loss allowance and assessed its compliance with Ind AS 115 – Revenue from contracts with customers’ and Ind AS 109 ‘Financial Instruments’ respectively.
b. We assessed the design and tested the operating effectiveness of internal controls related to sales including variable consideration and impairment loss allowance on trade receivables.
c. We performed the following tests for a sample of transactions relating to variable consideration:
• Read the terms of contract including rebates and discounts schemes as approved by authorized personnel.
• Evaluated the assumptions used in estimation of variable consideration by comparing with the past trends and understand the reasons for deviation.
• Performed retrospective review to identify and evaluate variances.
d. We evaluated management’s assessment of the assumptions used in the calculation of impairment loss allowance on trade receivables, including consideration of the current and estimated future uncertain economic conditions.
e. For sample customers, we tested past collection history, customer’s credit assessment and probability of default assessment performed by the management.
f. We tested the mathematical accuracy and computation of the allowances.
g. We read and assessed the relevant disclosures made within the consolidated Ind AS financial statements.
Accounting of Government grantsThe Parent Company has various grants and subsidies receivable from the state governments of respective plant locations.
These grants and subsidies are both capital and revenue in nature
Our audit procedures included, amongst others:a. We checked that the recognition of grants / subsidies is in
accordance with IND AS 20 by making a reference to the conditions for such grants in the scheme documents of the respective state Governments and checking the due evidence of fulfillment of such conditions by the Parent Company
b. We have also gone through the correspondence between the Parent Company and relevant Government authorities to assess the recoverability of grants / subsidies already recognized
c. We reviewed the legal experts’ opinions obtained by the Parent Company and/or the Managements’ Representation in cases where such grants have been outstanding for more than a year.
Information Other than the Consolidated Financial Statements and Auditor’s Report ThereonThe Parent Company’s Board of Directors is responsible for the other information. The other information comprises the information included in the Annual report but does not include the consolidated financial statements and our auditor’s report thereon. The Annual Report is expected to be made available to us after the date of this Auditor’s Report.
Our opinion on the consolidated financial statements does not cover the other information and we do not express any form of assurance conclusions thereon.
In connection with our audit of the consolidated financial statements, our responsibility is to read the other information and, in doing so, consider whether the other information is materially inconsistent with consolidated the financial statements or our knowledge obtained during the course of our audit or otherwise appears to be materially misstated.
If, based on the work we have performed, we conclude that there is a material misstatement of this other information, we are required to report that fact. We have nothing to report in this regard.
Responsibility of Management and Those charged with Governance for the ConsolidatedFinancial StatementsThe Parent Company’s Board of Directors is responsible for the matters stated in section 134(5) of the Act with respect to the preparation of these consolidated financial statements that give a true and fair view of the consolidated financial position, financial performance, consolidated total comprehensive Income, consolidated changes in equity and consolidated cash flows of the Group in accordance with the Ind AS and other accounting principles generally accepted in India. The respective Board of Directors of the Companies included in the Group are responsible for maintenance of adequate accounting records in accordance with the provisions of the Act for safeguarding the assets of the Group and for preventing and detecting frauds and other irregularities; selection and application of appropriate accounting policies; making judgments and estimates that are reasonable and prudent; and design, implementation and maintenance of adequate internal financial controls, that were operating effectively for ensuring the accuracy and completeness of the accounting records, relevant to the preparation and presentation of the consolidated financial statements that give a true and fair view and are free from material misstatement, whether due to fraud or error.
In preparing the consolidated financial statements, the respective Board of Directors of the companies included in the Group are responsible for assessing the ability of
the Group to continue as a going concern, disclosing, as applicable, matters related to going concern and using the going concern basis of accounting unless management either intends to liquidate the Company or to cease operations, or has no realistic alternative but to do so.
The respective Board of Directors of the Companies included in the Group are responsible for overseeing the financial reporting process of the Group.
Auditor’s Responsibilities for the Audit of the Consolidated Financial StatementsOur objectives are to obtain reasonable assurance about whether the consolidated financial statements as a whole are free from material misstatement, whether due to fraud or error, and to issue an auditor’s report that includes our opinion. Reasonable assurance is a high level of assurance, but is not a guarantee that an audit conducted in accordance with SAs will always detect a material misstatement when it exists. Misstatements can arise from fraud or error and are considered material if, individually or in the aggregate, they could reasonably be expected to influence the economic decisions of users taken on the basis of these consolidated financial statements.
As part of an audit in accordance with SAs, we exercise professional judgment and maintain professional scepticism through out the audit.We also:
• Identify and assess the risks of material misstatement of the consolidated financial statements, whether due to fraud or error, design and perform audit procedures responsive to those risks, and obtain audit evidence that is sufficient and appropriate to provide a basis for our opinion. The risk of not detecting a material misstatement resulting from fraud is higher than for one resulting from error, as fraud may involve collusion, forgery, intentional omission, misrepresentations, or the override of internal control.
• Obtain an understanding of internal financial controls relevant to the audit in order to design audit procedures that are appropriate in the circumstances. Under section 143(3)(i) of the Act, we are also responsible for expressing our opinion on whether the Company and its subsidiaries including the step down subsidiaries which are companies incorporated in India has adequate internal financial controls system in place and the operating effectiveness of such controls.
• Evaluate the appropriateness of accounting policies used and the reasonableness of accounting estimates and related disclosures made by management.
• Conclude on the appropriateness of management’s use of the going concern basis of accounting and,

204 | Greenpanel Industries Limited Annual Report 2020-21 | 205
CORPORATE OVERVIEW STATUTORY STATEMENTS FINANCIAL STATEMENTS
based on the audit evidence obtained, whether a material uncertainty exists related to events or conditions that may cast significant doubt on the ability of the Group to continue as a going concern. If we conclude that a material uncertainty exists, we are required to draw attention in our auditor’s report to the related disclosures in the consolidated financial statements or, if such disclosures are inadequate, to modify our opinion. Our conclusions are based on the audit evidence obtained up to the date of our auditor’s report. However, future events or conditions may cause the Group to cease to continue as a going concern.
• Evaluate the overall presentation, structure and content of the consolidated financial statements, including the disclosures, and whether the consolidated financial statements represent the underlying transactions and events in a manner that achieves fair presentation.
• Obtain sufficient appropriate audit evidence regarding the financial information of the entities or business activities within the Group to express as opinion on the consolidated financial statements. We are responsible for the direction, supervision and performance of the audit of the standalone/consolidated financial statements of such entities included in the consolidated financial statements of which we are the independent auditors. For the subsidiary included in the consolidated financial statements, which has been audited by the other auditor, such other auditor remains responsible for the direction, supervision and performance of the audit carried out by him. We remain solely responsible for our audit opinion.
We communicate with those charged with governance of the Parent Company and such other entities included in the consolidated financial statements of which we are the independent auditors regarding, among other matters, the planned scope and timing of the audit and significant audit findings, including any significant deficiencies in internal control that we identify during our audit.
We also provide those charged with governance with a statement that we have complied with relevant ethical requirements regarding independence, and to communicate with them all relationships and other matters that may reasonably be thought to bear on our independence, and where applicable, related safeguards.
Other MattersWe did not audit the financial statements and other financial information in respect of Greenpanel Singapore Pte. Limited subsidiary of Company whose financial statements results includes total assets of H3,382.95 lacs as at March 31, 2021, total revenues of H1267.18 lacs, total comprehensive loss of H736.08 lacs for the year ended on that date respectively, and net cash outflows of H147.77 lacs for the year ended March 31, 2021. These financial statements and other information have been audited by other auditors, whose financial statements, other financial information and auditor’s reports have been furnished to us by the management and our opinion on the consolidated financial statements, in so far as it relates to the amount and disclosure included in respect of these subsidiary and our report in terms of sub section 3 of section 143 of the Act, is based solely on the reports of the other auditors.
Our opinion on the Consolidated financial statements is not modified in respect of the above matters with respect to our reliance on the work done and the reports of the other auditors.
Report on Other Legal and Regulatory RequirementsAs required by Section 143(3) of the Act, based on our audit and on the considerations of the reports of the other auditors on separate financial statements of the subsidiary Company referred to in the Other Matters paragraph above we report, to the extent applicable, that:
a) We have sought and obtained all the information and explanations which to the best of our knowledge and belief were necessary for the purposes of our audit of the aforesaid consolidated financial statements.
b) In our opinion, proper books of account as required by law relating to the preparation of the aforesaid consolidated financial statements have been kept so far as it appears from our examination of those books and the reports of other auditors.
c) The consolidated balance sheet, the consolidated statement of profit and loss including (including statement of other comprehensive Income), consolidated statement of changes in equity and the consolidated statement of cash flows dealt with by this report are in agreement with the relevant books of account maintained for the purpose of preparation of the consolidated financial statements.
d) In our opinion, the aforesaid consolidated financial statements comply with the Ind AS specified under Section 133 of the Act read with the relevant rules made thereunder,as amended,and other accounting principles generally accepted in India.
e) On the basis of the written representations received from the directors of the company as on March 31,2021 taken on record by the Board of Directors of the Company and its subsidiary incorporated in India and the reports of the statutory auditors of its subsidiary company incorporated in India, none of the directors of the Group is disqualified as on March 31,2021 from being appointed as a director in terms of Section 164(2) of the Act.
f) With respect to the adequacy of the internal financial controls over financial reporting of the Parent Company and its subsidiaries incorporated in India, refer to our separate Report in “Annexure A” to this report.
g) With respect to the Other Matters to be included in the Auditors Report in accordance with the requirements of Section 197(16) of the Act, as amended
In our opinion and to the best of our information and according to the explanation given to us, the remuneration paid by the Parent company to its directors during the year is in accordance with the provisions of Section 197 of the Act.
h) With respect to the other matters to be included in the Auditor’s Report in accordance with Rule 11 of the Companies (Audit and Auditors) Rules, 2014, as amended in in our opinion and to the best of our information and according to the explanations given to us and based on the considerations of the
reports of the other auditors on separate financial statements:
i. The consolidated financial statements disclose the impact of pending litigations as at March 31, 2021 on the consolidated financial position of the Group- Refer note 37 (a) to the consolidated financial statements.
ii. Provision has been made in the consolidated financial statements, as required under the applicable law or accounting standards, for material foreseeable losses, if any, on long-term contracts including derivative contracts during the year ended March 31, 2021.
iii. There was no amount required to be transferred, to the Investor Education and Protection Fund by the Parent Company and its subsidiary incorporated in India during the year ended March 31, 2021.
For S. S. Kothari Mehta & CompanyChartered Accountants Firm Registration No. 000756N
Sunil WahalPartnerMembership No: - 087294
Place: New DelhiDate: May 14, 2021UDIN: 21087294AAAAHC9936

206 | Greenpanel Industries Limited Annual Report 2020-21 | 207
CORPORATE OVERVIEW STATUTORY STATEMENTS FINANCIAL STATEMENTS
Annexure A to the Independent Auditor’s Report to the Members of GREENPANEL INDUSTRIES LIMITED dated May 14, 2021 on its consolidated financial statementsReport on the Internal Financial Controls under Clause (i) of Sub-section 3 of Section 143 of the Companies Act, 2013 (“the Act”) as referred to in paragraph ‘f’ of ‘Report on Other Legal and Regulatory Requirements’ section.
Our reporting on the internal financial controls over financial reporting is not applicable in respect of one audited subsidiary incorporated outside India.
In conjunction with our audit of the consolidated financial statement of GREENPANEL INDUSTRIES LIMITED as of and for the year ended March 31, 2021 we have audited the internal financial controls over financial reporting of GREENPANEL INDUSTRIES LIMITED (hereinafter referred to as the “Parent Company” or “Company”).
Management’s Responsibility for Internal Financial ControlsThe Board of Directors of the Company is responsible for establishing and maintaining internal financial controls based on “the internal control over financial reporting criteria established by the Company considering the essential components of internal control stated in the Guidance Note on Audit of Internal Financial Controls over Financial Reporting issued by the Institute of Chartered Accountants of India”. These responsibilities include the design, implementation and maintenance of adequate internal financial controls that were operating effectively for ensuring the orderly and efficient conduct of its business, including adherence to the Company’s policies, the safeguarding of its assets, the prevention and detection of frauds and errors, the accuracy and completeness of the accounting records, and the timely preparation of reliable financial information, as required under the Companies Act, 2013 (“the Act”).
Auditors’ ResponsibilityOur responsibility is to express an opinion on the internal financial controls over financial reporting based on our audit of the Company.
We conducted our audit in accordance with the Guidance Note on Audit of Internal Financial Controls Over Financial Reporting (the “Guidance Note”) and the Standards on Auditing, issued by ICAI and deemed to be prescribed under section 143(10) of the Act, to the extent applicable to an audit of internal financial controls, and, both issued by the Institute of Chartered Accountants of India. Those Standards and the Guidance Note require that we comply with ethical requirements and plan and perform the audit to obtain reasonable
assurance about whether adequate internal financial controls over financial reporting was established and maintained and if such controls operated effectively in all material respects.
Our audit involves performing procedures to obtain audit evidence about the adequacy of the internal financial controls system over financial reporting and their operating effectiveness. Our audit of internal financial controls over financial reporting included obtaining an understanding of internal financial controls over financial reporting, assessing the risk that a material weakness exists, and testing and evaluating the design and operating effectiveness of internal control based on the assessed risk. The procedures selected depend on the auditor’s judgement, including the assessment of the risks of material misstatement of the consolidated financial statements, whether due to fraud or error.
We believe that the audit evidence we have obtained and the audit evidence obtained by the other auditors in terms of their reports referred to in the Other Matters paragraph below, is sufficient and appropriate to provide a basis for our audit opinion on the Company’s internal financial controls system over financial reporting.
Meaning of Internal Financial Controls over Financial ReportingA company’s internal financial control over financial reporting is a process designed to provide reasonable assurance regarding the reliability of financial reporting and the preparation of consolidated financial statements for external purposes in accordance with generally accepted accounting principles. A company’s internal financial control over financial reporting includes those policies and procedures that:
a) pertain to the maintenance of records that, in reasonable detail, accurately and fairly reflect the transactions and dispositions of the assets of the company;
b) provide reasonable assurance that transactions are recorded as necessary to permit preparation of
financial statements in accordance with generally accepted accounting principles, and that receipts and expenditures of the company are being made only in accordance with authorizations of management and directors of the company; and
c) provide reasonable assurance regarding prevention or timely detection of unauthorized acquisition, use, or disposition of the company’s assets that could have a material effect on the financial statements.
Inherent Limitations of Internal Financial Controls over Financial ReportingBecause of the inherent limitations of internal financial controls over financial reporting, including the possibility of collusion or improper management override of controls, material misstatements due to error or fraud may occur and not be detected. Also, projections of any evaluation of the internal financial controls over financial reporting to future periods are subject to the risk that the internal financial control over financial reporting may become inadequate because of changes in conditions, or that the degree of compliance with the policies or procedures may deteriorate.
OpinionIn our opinion, to the best of our information and according to the explanations, given to us the Parent Company has, in all material respects, an adequate internal financial controls system over financial
reporting and such internal financial controls over financial reporting were operating effectively as at March 31, 2021, based on the internal control over financial reporting criteria established by the Parent Company considering the essential components of internal control stated in the Guidance Note on Audit of Internal Financial Controls Over Financial Reporting issued by the Institute of Chartered Accountants of India.
Other MattersOur aforesaid report under Section 143(3) (i) of the Act on the adequacy and operating effectiveness of the internal financial controls over financial reporting, does not consider the subsidiary of the Company as it is not incorporated in India.
Our audit report is not qualified in respect of above matter.
For S. S. Kothari Mehta & CompanyChartered Accountants Firm Registration No. 000756N
Sunil WahalPartnerMembership No: - 087294
Place: New DelhiDate: May 14, 2021UDIN: 21087294AAAAHC9936

208 | Greenpanel Industries Limited Annual Report 2020-21 | 209
CORPORATE OVERVIEW STATUTORY STATEMENTS FINANCIAL STATEMENTS
Consolidated Balance Sheet as at March 31, 2021H in lacs
Note March 31 ,2021 March 31, 2020Assets(1) Non-current assets
(a) Property, plant and equipment 4 1,02,565.29 1,08,180.18 (b) Capital work-in-progress 5 358.40 568.84 (c) Other intangible assets 6 17.48 43.53 (d) Right of use assets 4,841.82 2,886.18 (e) Financial assets
(i) Loans 8 1,456.43 1,443.73 (f) Non-current tax assets (net) 9 255.92 261.39 (g) Other non-current assets 14 502.19 1,506.56
Total non-current assets 1,09,997.53 1,14,890.41 (2) Current assets
(a) Inventories 10 14,935.80 15,388.67 (b) Financial assets
(i) Trade receivables 11 7,775.98 7,052.11 (ii) Cash and cash equivalents 12 1,307.43 1,125.79 (iii) Other bank balances 13 5,891.16 28.93 (iv) Loans 8 76.84 96.72 (v) Derivatives 24 - 552.41 (vi) Other financial assets 15 4,226.16 4,016.44
(c) Other current assets 16 1,311.94 3,430.42 Total current assets 35,525.31 31,691.49 Total assets 1,45,522.84 1,46,581.90 Equity and liabilitiesEquity
(a) Equity share capital 17 1,226.27 1,226.27 (b) Other equity 18 71,811.53 64,938.06
Total equity 73,037.80 66,164.33 Liabilities(1) Non-current liabilities
(a) Financial liabilities(i) Borrowings 19 35,623.84 43,511.90 (ii) Other financial liabilities 20 4,216.03 2,627.68
(b) Provisions 21 807.04 967.39 (c) Deferred tax liabilities (net) 35 2,017.31 688.94 (d) Other non-current liabilities 22 1,219.73 2,866.01
Total non-current liabilities 43,883.95 50,661.92 (2) Current liabilities
(a) Financial liabilities(i) Borrowings 19 1,598.81 7,270.64 (ii) Trade payables 23
total outstanding dues of micro enterprises and small enterprises 5.98 1.72 total outstanding dues of creditors other than micro enterprises and small enterprises
12,959.91 12,065.14
(iii) Derivatives 24 86.59 - (iv) Other financial liabilities 20 9,875.25 7,010.88
(b) Other current liabilities 25 3,662.46 3,175.99 (c) Provisions 21 150.06 231.28 (d) Current tax liabilities (net) 9 262.03 -
Total current liabilities 28,601.09 29,755.65 Total liabilities 72,485.04 80,417.57 Total equity and liabilities 1,45,522.84 1,46,581.90 Significant accounting policies 3
The accompanying notes form an integral part of the consolidated financial statements
As per our report of even date attachedFor S.S. Kothari Mehta & Company For and on behalf of Board of Directors ofChartered Accountants Greenpanel Industries LimitedFirm Registration number: 000756N CIN: L20100AS2017PLC018272
Sunil Wahal Shiv Prakash Mittal Shobhan MittalPartner Executive Chairman Managing Director & CEOMembership No: 087294 (DIN : 00237242) (DIN : 00347517)
V. Venkatramani Lawkush Prasad ChiefFinancialOfficer CompanySecretary&AVP-Legal
Place : New Delhi Place : KolkataDated : 14 May 2021 Dated : 14 May 2021
The accompanying notes form an integral part of the consolidated financial statements
As per our report of even date attachedFor S.S. Kothari Mehta & Company For and on behalf of Board of Directors ofChartered Accountants Greenpanel Industries LimitedFirm Registration number: 000756N CIN: L20100AS2017PLC018272
Sunil Wahal Shiv Prakash Mittal Shobhan MittalPartner Executive Chairman Managing Director & CEOMembership No: 087294 (DIN : 00237242) (DIN : 00347517)
V. Venkatramani Lawkush Prasad ChiefFinancialOfficer CompanySecretary&AVP-Legal
Place : New Delhi Place : KolkataDated : May 14,2021 Dated : May 14,2021
Consolidated Statement of Profit and Loss for the year ended March 31,2021H in lacs
Note Year ended March 31 ,2021
Year ended March 31 ,2020
I. Revenue from operations 26 1,02,075.54 87,656.62
II. Other income 27 344.75 223.40
III Total income (I+II) 1,02,420.29 87,880.02
IV. Expenses
Cost of materials consumed 28 42,638.29 38,870.33
Purchase of stock in trade 29 1,135.02 1,030.82
Changes in inventories of finished goods, work-in-progress and stock in trade 30 2,514.35 (711.38)
Employees benefits expense 31 9,790.30 9,888.74
Finance costs 32 3,721.00 4,828.94
Depreciation and amortisation expense 33 6,863.17 6,916.54
Other expenses 34 25,661.02 24,801.25
Total expenses (IV) 92,323.15 85,625.24
V. Profit before exceptional items and tax (III-IV) 10,097.14 2,254.78
VI. Exceptional items 48 - 1,083.74
VII. Profit before tax (V-VI) 10,097.14 1,171.04
Current tax (1,909.09) (258.85)
Deferred tax (1,307.21) 533.87
VIII. Tax expense 35 (3,216.30) 275.02
IX. Profit for the year (VII+VIII) 6,880.84 1,446.06
X. Other comprehensive income
Items that will not be reclassified subsequently to profit or loss:
Remeasurements of defined benefit liability/(asset) 60.54 50.10
Income tax relating to items that will not be reclassified to profit or loss (21.16) (17.51)
Net other comprehensive income not to be reclassified subsequently to profit or loss
39.38 32.59
Items that will be reclassified subsequently to profit or loss:
Exchange differences in translating financial statements of foreign operations (46.75) 135.88
Net other comprehensive income to be reclassified subsequently to profit or loss (46.75) 135.88
Other comprehensive income for the year (net of tax) (7.37) 168.47
XI. Total comprehensive income for the year (IX+X) 6,873.47 1,614.53
XII. Earnings per equity share 36
[Face value of equity share H1 each (previous year H1 each)]
- Basic (H) 5.61 1.18
- Diluted (H) 5.61 1.18
Significant accounting policies 3
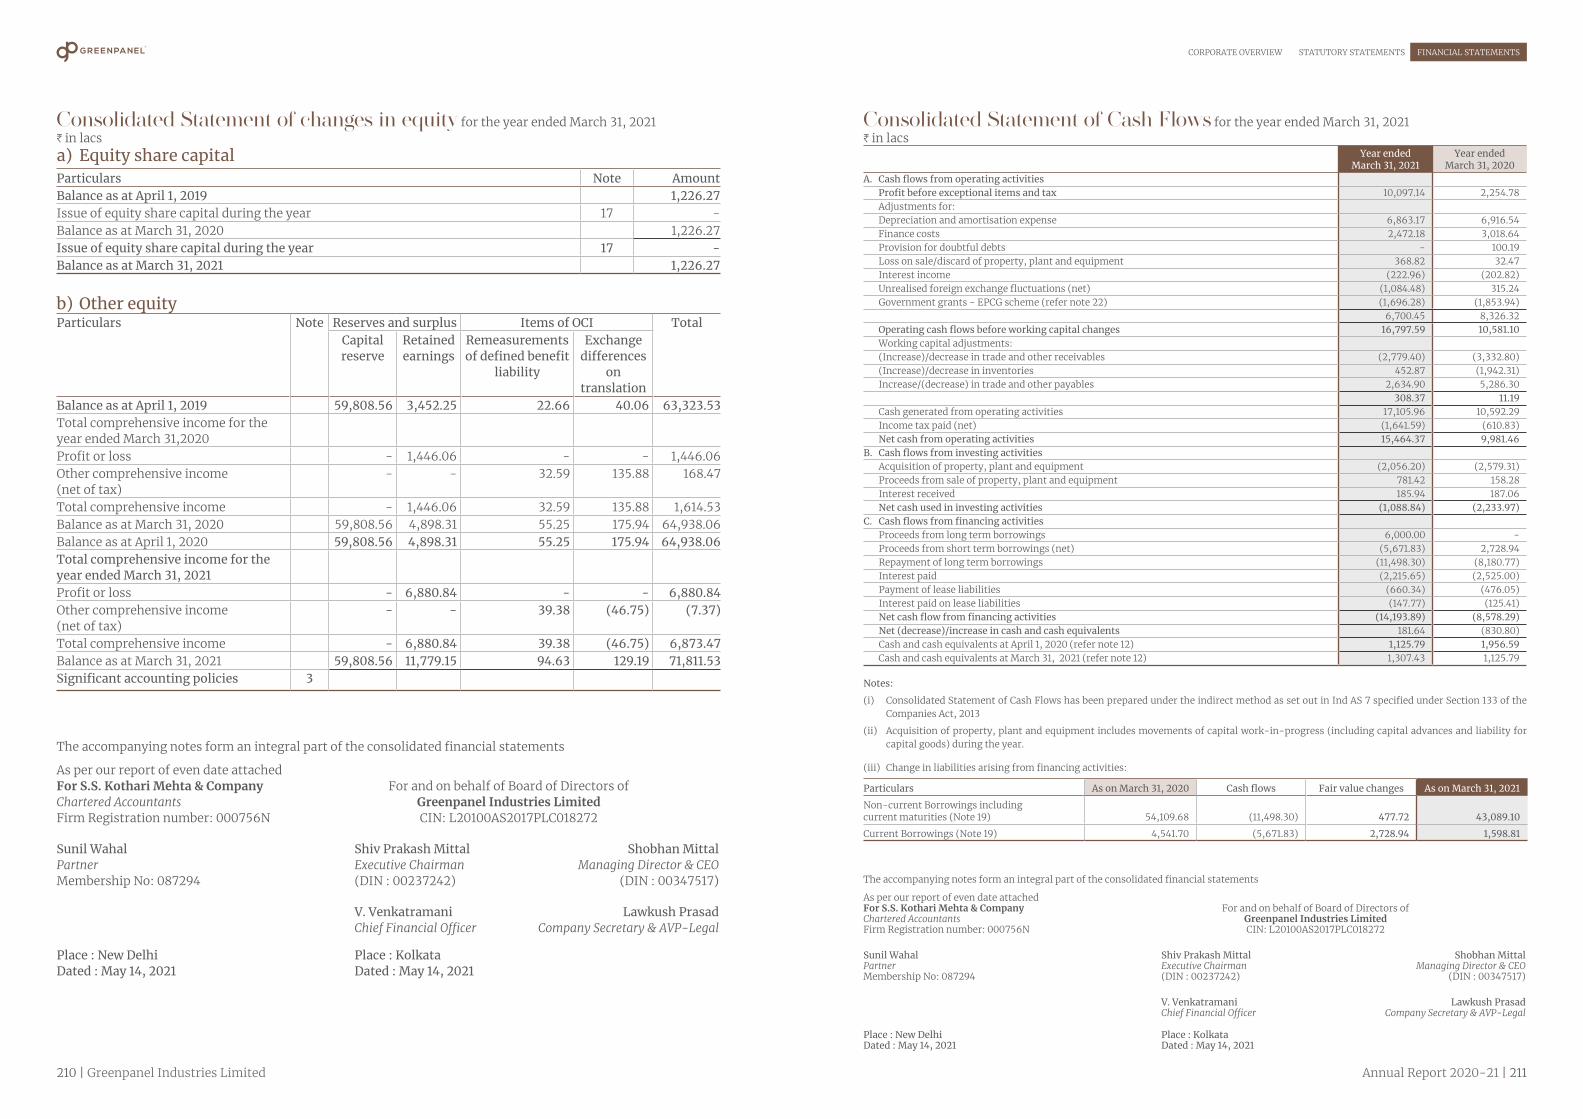
210 | Greenpanel Industries Limited Annual Report 2020-21 | 211
CORPORATE OVERVIEW STATUTORY STATEMENTS FINANCIAL STATEMENTS
Consolidated Statement of changes in equity for the year ended March 31, 2021H in lacs
Consolidated Statement of Cash Flows for the year ended March 31, 2021H in lacs
a) Equity share capitalParticulars Note AmountBalance as at April 1, 2019 1,226.27 Issue of equity share capital during the year 17 - Balance as at March 31, 2020 1,226.27 Issue of equity share capital during the year 17 - Balance as at March 31, 2021 1,226.27
b) Other equityParticulars Note Reserves and surplus Items of OCI Total
Capital reserve
Retained earnings
Remeasurements of defined benefit
liability
Exchange differences
on translation
Balance as at April 1, 2019 59,808.56 3,452.25 22.66 40.06 63,323.53 Total comprehensive income for the year ended March 31,2020Profit or loss - 1,446.06 - - 1,446.06 Other comprehensive income (net of tax)
- - 32.59 135.88 168.47
Total comprehensive income - 1,446.06 32.59 135.88 1,614.53 Balance as at March 31, 2020 59,808.56 4,898.31 55.25 175.94 64,938.06 Balance as at April 1, 2020 59,808.56 4,898.31 55.25 175.94 64,938.06 Total comprehensive income for the year ended March 31, 2021Profit or loss - 6,880.84 - - 6,880.84 Other comprehensive income (net of tax)
- - 39.38 (46.75) (7.37)
Total comprehensive income - 6,880.84 39.38 (46.75) 6,873.47 Balance as at March 31, 2021 59,808.56 11,779.15 94.63 129.19 71,811.53 Significant accounting policies 3
The accompanying notes form an integral part of the consolidated financial statements
As per our report of even date attachedFor S.S. Kothari Mehta & Company For and on behalf of Board of Directors ofChartered Accountants Greenpanel Industries LimitedFirm Registration number: 000756N CIN: L20100AS2017PLC018272
Sunil Wahal Shiv Prakash Mittal Shobhan MittalPartner Executive Chairman Managing Director & CEOMembership No: 087294 (DIN : 00237242) (DIN : 00347517)
V. Venkatramani Lawkush Prasad ChiefFinancialOfficer CompanySecretary&AVP-Legal
Place : New Delhi Place : KolkataDated : May 14, 2021 Dated : May 14, 2021
Year ended March 31, 2021
Year ended March 31, 2020
A. Cash flows from operating activitiesProfit before exceptional items and tax 10,097.14 2,254.78 Adjustments for:Depreciation and amortisation expense 6,863.17 6,916.54 Finance costs 2,472.18 3,018.64 Provision for doubtful debts - 100.19 Loss on sale/discard of property, plant and equipment 368.82 32.47 Interest income (222.96) (202.82)Unrealised foreign exchange fluctuations (net) (1,084.48) 315.24 Government grants - EPCG scheme (refer note 22) (1,696.28) (1,853.94)
6,700.45 8,326.32 Operating cash flows before working capital changes 16,797.59 10,581.10 Working capital adjustments:(Increase)/decrease in trade and other receivables (2,779.40) (3,332.80)(Increase)/decrease in inventories 452.87 (1,942.31)Increase/(decrease) in trade and other payables 2,634.90 5,286.30
308.37 11.19 Cash generated from operating activities 17,105.96 10,592.29 Income tax paid (net) (1,641.59) (610.83)Net cash from operating activities 15,464.37 9,981.46
B. Cash flows from investing activitiesAcquisition of property, plant and equipment (2,056.20) (2,579.31)Proceeds from sale of property, plant and equipment 781.42 158.28 Interest received 185.94 187.06 Net cash used in investing activities (1,088.84) (2,233.97)
C. Cash flows from financing activitiesProceeds from long term borrowings 6,000.00 - Proceeds from short term borrowings (net) (5,671.83) 2,728.94 Repayment of long term borrowings (11,498.30) (8,180.77)Interest paid (2,215.65) (2,525.00)Payment of lease liabilities (660.34) (476.05)Interest paid on lease liabilities (147.77) (125.41)Net cash flow from financing activities (14,193.89) (8,578.29)Net (decrease)/increase in cash and cash equivalents 181.64 (830.80)Cash and cash equivalents at April 1, 2020 (refer note 12) 1,125.79 1,956.59 Cash and cash equivalents at March 31, 2021 (refer note 12) 1,307.43 1,125.79
Notes:
(i) Consolidated Statement of Cash Flows has been prepared under the indirect method as set out in Ind AS 7 specified under Section 133 of the Companies Act, 2013
(ii) Acquisition of property, plant and equipment includes movements of capital work-in-progress (including capital advances and liability for capital goods) during the year.
(iii) Change in liabilities arising from financing activities:
Particulars As on March 31, 2020 Cash flows Fair value changes As on March 31, 2021
Non-current Borrowings including current maturities (Note 19) 54,109.68 (11,498.30) 477.72 43,089.10
Current Borrowings (Note 19) 4,541.70 (5,671.83) 2,728.94 1,598.81
The accompanying notes form an integral part of the consolidated financial statements
As per our report of even date attachedFor S.S. Kothari Mehta & Company For and on behalf of Board of Directors ofChartered Accountants Greenpanel Industries LimitedFirm Registration number: 000756N CIN: L20100AS2017PLC018272
Sunil Wahal Shiv Prakash Mittal Shobhan MittalPartner Executive Chairman Managing Director & CEOMembership No: 087294 (DIN : 00237242) (DIN : 00347517)
V. Venkatramani Lawkush Prasad ChiefFinancialOfficer CompanySecretary&AVP-Legal
Place : New Delhi Place : KolkataDated : May 14, 2021 Dated : May 14, 2021

212 | Greenpanel Industries Limited Annual Report 2020-21 | 213
CORPORATE OVERVIEW STATUTORY STATEMENTS FINANCIAL STATEMENTS
Notes to the consolidated financial statements for the year ended March 31, 2021 Notes to the consolidated financial statements for the year ended March 31, 2021
1. Reporting entityGreenpanel Industries Limited (‘the Holding Company’ or the ‘Company’) is a public company domiciled in India having its registered office situated at Makum Road, P.O. Tinsukia, Assam-786125, India. The Holding Company has been incorporated under the provisions of the Indian Companies Act. The Holding Company is primarily involved in manufacturing of plywood, medium density fibre boards (MDF) and allied products.
The Holding Company has an overseas wholly owned subsidiary company Greenpanel Singapore Pte. Limited, incorporated in Singapore, is engaged into trading of Medium Density Fibreboards and allied products, collectively referred to as “the Group”.
2. Basis of preparation a. Statement of compliance
These consolidated financial statements are prepared in accordance with Indian Accounting Standards (Ind AS) as per the Companies (Indian Accounting Standards) Rules, 2015 as amended, notified under Section 133 of the Companies Act, 2013 (‘Act’) and other relevant provisions of the Act.The consolidated financial statements are authorised for issue by the Board of Directors of the Holding Company at their meeting held on May 14, 2021.The details of the Company’s accounting policies are included in note 3
b. Functional and presentation currencyThese consolidated financial statements are presented in Indian Rupees (H), which is also the Holding Company’s functional currency. All amounts have been rounded off to the nearest lacs, unless otherwise indicated.
c. Basis of measurementThe consolidated financial statements have been prepared on historical cost basis, except for the following items:Items MeasurementDerivative financial instruments Fair valueCertain financial assets and financial liabilities Fair valueNet defined benefit (asset)/ liability Present value of defined benefit obligations
d. Use of estimates and judgementsIn preparing these consolidated financial statements, management has made judgements, estimates and assumptions that affect the application of accounting policies and the reported amounts of assets, liabilities, income and expenses. Management believes that the estimates used in the preparation of the consolidated financial statements are prudent and reasonable. Actual results may differ from these estimates.Estimates and underlying assumptions are reviewed on an ongoing basis. Revisions to accounting estimates are recognised prospectively.
JudgementsInformation about judgements made in applying accounting policies that have the most significant effects on the amounts recognised in the consolidated financial statements is included in note 38 - lease classification.
Assumptions and estimation uncertaintiesInformation about assumptions and estimation uncertainties that have a significant risk of resulting in a material adjustment in the consolidated financial statements for the every period ended is included in the following notes:
- Note 4 – useful life and residual value of property, plant and equipment;- Note 31 – measurement of defined benefit obligations: key actuarial assumptions;- Note 35 – recognition of deferred tax assets;
- Note 37 – recognition and measurement of provisions and contingencies: key assumptions about the likelihood and magnitude of an outflow of resources;
- Note 42 – impairment of financial assets: key assumptions used in estimating recoverable cash flows
e. Measurement of fair valuesA number of the Group’s accounting policies and disclosures require the measurement of fair values, for both financial and non-financial assets and liabilities.The Group has an established control framework with respect to the measurement of fair values. The management has overall responsibility for overseeing all significant fair value measurements and it regularly reviews significant unobservable inputs and valuation adjustments. If third party information, such as broker quotes or pricing services, is used to measure fair values, then the management assesses the evidence obtained from the third parties to support the conclusion that these valuations meet the requirements of Ind AS, including the level in the fair value hierarchy in which the valuations should be classified.Significant valuation issues are reported to the Holding Company’s audit committee.
Fair values are categorised into different levels in a fair value hierarchy based on the inputs used in the valuation techniques as follows:
- Level 1: quoted prices (unadjusted) in active markets for identical assets or liabilities.- Level 2: inputs other than quoted prices included in Level 1 that are observable for the asset or liability,
either directly (i.e. as prices) or indirectly (i.e. derived from prices).- Level 3: inputs for the asset or liability that are not based on observable market data
(unobservable inputs).
When measuring the fair value of an asset or a liability, the Group uses observable market data as far as possible. If the inputs used to measure the fair value of an asset or a liability fall into different levels of the fair value hierarchy, then the fair value measurement is categorised in its entirety in the same level of the fair value hierarchy as the lowest level input that is significant to the entire measurement.The Group recognises transfers between levels of the fair value hierarchy at the end of the reporting period during which the change has occurred.Further information about the assumptions made in measuring fair values is included in note 41.
f. Basis of consolidation (i) Subsidiaries
These Consolidated financial statements are prepared on the following basis in accordance with Ind AS on “Consolidated Financial Statements”(Ind AS - 110), specified under Section 133 of the Companies Act, 2013.Subsidiaries are entities controlled by the Group. The Group controls an entity when it is exposed to, or has rights to, variable returns from its involvement with the entity and has the ability to affect those returns through its power over the entity. The financial statements of subsidiary are included in the Consolidated financial statements from the date on which control commences until the date on which control ceases. Subsidiaries considered in the Consolidated financial statements are:
Name of the Company Country of Incorporation Percentage of HoldingCurrent year Previous year
Greenpanel Singapore Pte. Limited
Singapore 100% 100%
214 | Greenpanel Industries Limited Annual Report 2020-21 | 215
CORPORATE OVERVIEW STATUTORY STATEMENTS FINANCIAL STATEMENTS
Notes to the consolidated financial statements for the year ended March 31, 2021 Notes to the consolidated financial statements for the year ended March 31, 2021
(ii) Loss of controlWhen the Group losses control over a subsidiary, it derecognises the assets and liabilities of the subsidiary, and other components of equity. Any interest retained in the former subsidiary is measured at fair value at the date the control is lost. Any resulting gain or loss is recognised in consolidated statement of profit or loss.
(iii) Transactions eliminated on consolidationThe financial statements of the Holding Company and its subsidiaries used in the consolidation procedures are drawn upto the same reporting date i.e March 31, 2021.The financial statements of the Holding Company and its subsidiary companies are combined on a line-by-line basis by adding together the book values of like items of assets, liabilities, income and expenses.Intra-group balances and transactions, and any unrealised income and expenses arising from intragroup transactions, are eliminated. Unrealised gains arising from transactions with subsidiaries are eliminated against the investment to the extent of the Group’s interest in the investee. Unrealised losses are eliminated in the same way as unrealised gains, but only to the extent that there is no evidence of impairment.
3. Significant accounting policies a. Current and non-current classification
All assets and liabilities are classified as current or non-current as per the Group’s normal operating cycle and other criteria set out in the Schedule III to the Act.
AssetsAn asset is classified as current when it satisfies any of the following criteria:(i) it is expected to be realised in, or is intended for sale or consumption in the Group’s normal operating
cycle;(ii) it is held primarily for the purpose of being traded;(iii) it is expected to be realised within 12 months after the reporting date; or(iv) it is cash or cash equivalent unless it is restricted from being exchanged or used to settle a liability for
at least 12 months after the reporting date.Current assets include current portion of non-current financial assets.All other assets are classified as non-current.
LiabilitiesA liability is classified as current when it satisfies any of the following criteria:(i) it is expected to be settled in the Group’s normal operating cycle;(ii) it is held primarily for the purpose of being traded;(iii) it is due to be settled within 12 months after the reporting date; or(iv) the Company does not have an unconditional right to defer settlement of the liability for at least 12
months after the reporting date. Terms of a liability that could, at the option of the counterparty, result in its settlement by the issue of equity instruments do not affect its classification.
Current liabilities include current portion of non-current financial liabilities.All other liabilities are classified as non-current.Deferred tax assets and liabilities are classified as non-current assets and liabilities.
Operating cycleFor the purpose of current/non-current classification of assets and liabilities, the Group has ascertained its normal operating cycle as twelve months. This is based on the nature of business and the time between the acquisition of assets for processing and their realisation in cash and cash equivalents.
b. (i) Foreign currency transactions
Transactions in foreign currencies are translated into the respective functional currency of the Group at the exchange rates prevailing at the dates of the transactions.
Monetary assets and liabilities denominated in foreign currencies are translated into the functional currency at the exchange rate at the reporting date. Non-monetary assets and liabilities that are measured at fair value in a foreign currency are translated into the functional currency at the exchange rate when the fair value was determined. Non-monetary assets and liabilities that are measured based on historical cost in a foreign currency are translated at the exchange rate at the date of the transaction.
Exchange differences are recognised in the Consolidated Statement of Profit and Loss in the period in which they arise, except exchange differences on long term foreign currency monetary items accounted for in accordance with exemption availed by the Company under Ind AS 101.
The Group has exercised the option available to it under Para 46A of the Companies (Accounting Standards) (Second Amendment) Rules, 2011 in respect of accounting for fluctuations in foreign exchange relating to “Long Term Foreign Currency Monetary Items”. On transition to Ind AS, aforesaid option is not available for loans availed after 1st April 2016.
(ii) Foreign operationsThe assets and liabilities of foreign operations (subsidiaries) like fair value adjustments arising on acquisition, are translated into INR, the functional currency of the Group, at the exchange rates at the reporting date. The income and expenses of foreign operations are translated into INR at an average rate.The Group has elected not to apply Ind AS 103-Business Combinations retrospectively to past business combinations that occurred before the transition date of April 1, 2015. Consequently, the Group has kept the same classification for the past business combinations as in its previous GAAP financial statements.
When a foreign operation is disposed off in its entirety or partially such that control, significant influence or joint control is lost, the cumulative amount of exchange differences related to that foreign operation recognized in Other Comprehensive Income (OCI) is reclassified to profit or loss as part of the gain or loss on disposal. If the Group disposes of part of its interest in a subsidiary but retains control, then the relevant proportion of the cumulative amount is re-allocated to Non-controlling Interest (NCI).
c. Financial instruments (i) Recognition and initial measurement
Trade Receivables are initially recognised when they are originated. All financial assets and financial liabilities are initially recognised when the Group becomes a party to the contractual provisions of the instrument. Trade receivables are initially measured at transaction price.
A financial asset or financial liability is initially measured at fair value plus, for an item not at fair value through profit and loss (FVTPL), transaction costs that are directly attributable to its acquisition or issue.
(ii) Classification and subsequent measurement Financial assets
On initial recognition, a financial asset is classified and measured at:- Amortised cost; or- Fair value through Profit or Loss (FVTPL); or- Fair value through Other Comprehensive Income (FVTOCI).Financial assets are not reclassified subsequent to their initial recognition, except if and in the period the Group changes its business model for managing financial assets.

216 | Greenpanel Industries Limited Annual Report 2020-21 | 217
CORPORATE OVERVIEW STATUTORY STATEMENTS FINANCIAL STATEMENTS
Notes to the consolidated financial statements for the year ended March 31, 2021 Notes to the consolidated financial statements for the year ended March 31, 2021
Financial assets at amortised costA financial asset is measured at amortised cost if it meets both of the following conditions and is not designated as at FVTPL:(a) the asset is held within a business model whose objective is to hold assets to collect contractual cash
flows; and(b) the contractual terms of the financial asset give rise on specified dates to cash flows that are solely
payments of principal and interest (SPPI) on the principal amount outstanding.The effective interest rate (EIR) method of amortisation is included in finance income in the Consolidated Statement of Profit and Loss. This category generally applies to long-term deposits and long-term trade receivables.
Financial assets at FVTPLAll financial assets which are not classified and measured at amortised cost or Fair value through other comprehensive income (FVOCI) as described above are measured at FVTPL. On initial recognition, the Group may irrevocably designate a financial asset that otherwise meets the requirements to be measured at amortised cost or at FVOCI as at FVTPL if doing so eliminates or significantly reduces an accounting mismatch that would otherwise arise.Financial assets: Assessment whether contractual cash flows are solely payments of principal and interest (SPPI).For the purposes of this assessment, ‘principal’ is defined as the fair value of the financial asset on initial recognition. ‘Interest’ is defined as consideration for the time value of money and for the credit risk associated with the principal amount outstanding during a particular period of time and for other basic lending risks and costs (e.g. liquidity risk and administrative costs), as well as a profit margin.In assessing whether the contractual cash flows are solely payments of principal and interest, the Group considers the contractual terms of the instrument. This includes assessing whether the financial asset contains a contractual term that could change the timing or amount of contractual cash flows such that it would not meet this condition.
In making this assessment, the Group considers:- contingent events that would change the amount or timing of cash flows;- terms that may adjust the contractual coupon rate, including variable interest rate features;- prepayment and extension features; and- terms that limit the Group’s claim to cash flows from specified assets (e.g. non-recourse features).
A prepayment feature is consistent with the solely payments of principal and interest criterion if the prepayment amount substantially represents unpaid amounts of principal and interest on the principal amount outstanding, which may include reasonable additional compensation for early termination of the contract. Additionally, for a financial asset acquired at a significant discount or premium to its contractual paramount, a feature that permits or requires prepayment at an amount that substantially represents the contractual par amount plus accrued (but unpaid) contractual interest (which may also include reasonable additional compensation for early termination) is treated as consistent with this criterion if the fair value of the prepayment feature is insignificant at initial recognition.
Financial assets: Subsequent measurementFinancial assets at FVTPL: These assets are subsequently measured at fair value. Net gains and losses, including any interest or dividend income, are recognised in Consolidated Statement of Profit and Loss.
Financial assets at amortised cost: These assets are subsequently measured at amortised cost using the effective interest rate (EIR) method. The amortised cost is reduced by impairment losses, if any. Interest income, foreign exchange gains and losses and impairment are recognised in Consolidated Statement of Profit and Loss. Any gain or loss on derecognition is recognised in Consolidated Statement of Profit and Loss.Investments in subsidiaries are carried at cost in standalone financial statements
Financial liabilities: Classification, subsequent measurement and gains and lossesFinancial liabilities are classified as measured at amortised cost or FVTPL.
Financial liabilities through FVTPLA financial liability is classified as at FVTPL if it is classified as held-for-trading, or it is a derivative or it is designated as such on initial recognition. Financial liabilities at FVTPL are measured at fair value and net gains and losses, including any interest expense, are recognised in Consolidated Statement of Profit and Loss. This category also includes derivative financial instruments entered into by the Group that are not designated as hedging instruments in hedge relationships as defined by Ind AS 109.
Financial liabilities at amortised costOther financial liabilities are subsequently measured at amortised cost using the effective interest rate (EIR) method. Interest expense and foreign exchange gains and losses are recognised in Consolidated Statement of Profit and Loss. Any gain or loss on derecognition is also recognised in Consolidated Statement of Profit and Loss. Interest bearing loans and borrowings are subsequently measured at amortised cost using the EIR method. Gains and losses are recognised in Consolidated Statement of Profit and Loss when the liabilities are derecognised as well as through the EIR amortisation process. For trade and other payables maturing within one year from the balance sheet date, the carrying amounts approximates fair value due to the short maturity of these instruments.
Financial guarantee liabilitiesFinancial guarantees issued by the Group are those contracts that require payment to be made to reimburse the holder for a loss it incurs because the specified debtor fails to make a payment when due in accordance with the terms of a debt instrument. Financial guarantee contracts are recognised initially as a liability at fair value net off transaction costs that are directly attributable to the issuance of the guarantee. Subsequently, the liability is measured at the higher of the amount of loss allowance determined as per impairment requirements of Ind AS 109 and the amount recognised less cumulative amortisation.
(iii) Derecognition Financial assets
The Group derecognises a financial asset:- when the contractual rights to the cash flows from the financial asset expire, or- it transfers the rights to receive the contractual cash flows in a transaction in which substantially
all of the risks and rewards of ownership of the financial asset are transferred or in which the Group neither transfers nor retains substantially all of the risks and rewards of ownership and does not retain control of the financial asset.
Financial liabilitiesThe Group derecognises a financial liability when its contractual obligations are discharged or cancelled, or expire. The Group also derecognises a financial liability when its terms are modified and the cash flows under the modified terms are substantially different. In this case, a new financial liability based on the modified terms is recognised at fair value. The difference between the carrying amount of the financial liability extinguished and the new financial liability with modified terms is recognised in Consolidated Statement of Profit and Loss.
(iv) OffsettingFinancial assets and financial liabilities are offset and the net amount presented in the balance sheet when and only when, the Group currently has a legally enforceable right to set off the amounts and it intends either to settle them on a net basis or to realise the asset and settle the liability simultaneously.
(v) Derivative financial instrumentsThe Group holds derivative financial instruments, such as foreign currency forward contracts, interest rate swaps, to hedge its foreign currency and interest rate risk exposures.

218 | Greenpanel Industries Limited Annual Report 2020-21 | 219
CORPORATE OVERVIEW STATUTORY STATEMENTS FINANCIAL STATEMENTS
Notes to the consolidated financial statements for the year ended March 31, 2021 Notes to the consolidated financial statements for the year ended March 31, 2021
Derivatives are initially measured at fair value. Subsequent to initial recognition, derivatives are measured at fair value, and changes therein are recognised in Consolidated Statement of Profit and Loss. Derivatives are carried as financial assets when the fair value is positive and as financial liabilities when the fair value is negative.
d. Property, plant and equipment (i) Recognition and measurement
Items of property, plant and equipment are measured at cost, which includes capitalised borrowing costs, less accumulated depreciation and accumulated impairment losses, if any.The cost of an item of property, plant and equipment comprises its purchase price, including import duties and non-refundable purchase taxes, after deducting trade discounts and rebates, any directly attributable cost of bringing the item to its working condition for its intended use and estimated costs of dismantling and removing the item and restoring the site on which it is located.The cost of a self-constructed item of property, plant and equipment comprises the cost of materials and direct labour, any other costs directly attributable to bringing the item to working condition for its intended use, and estimated costs of dismantling and removing the item and restoring the site on which it is located.Borrowing costs directly attributable to the acquisition or construction of those qualifying property, plant and equipment, which necessarily take a substantial period of time to get ready for their intended use, are capitalised. If significant parts of an item of property, plant and equipment have different useful lives, then they are accounted for as separate components of property, plant and equipment.A fixed asset is eliminated from the financial statements on disposal or when no further benefit is expected from its use. Any gain or loss on disposal of an item of property, plant and equipment is recognised in Consolidated Statement of Profit and Loss. Property, plant and equipment under construction are disclosed as Capital work-in-progress. Assets retired from active use and held for disposal are stated at the lower of their net book value and fair value less cost to sell and shown under ‘Current assets’.Foreign currency exchange differences on loans used for purchases of property, plant and equipment prior to April 1,2016, are continued to be capitalised as per policy stated in note 3(b) above.
(ii) Subsequent expenditureSubsequent expenditure is capitalised only if it is probable that the future economic benefits associated with the expenditure will flow to the Group. Ongoing repairs and maintenance are expensed as incurred.
(iii) Depreciation and amortisationDepreciation and amortisation for the year is recognised in the Consolidated Statement of Profit and Loss. Depreciation is calculated on cost of items of property, plant and equipment less their estimated residual values over their estimated useful lives using the straight line method over the useful lives of assets, in the manner specified in Part C of Schedule II of the Act.Assets acquired under finance lease are depreciated over the shorter of the lease term and their useful life unless it is reasonably certain that the Group will obtain ownership by the end of the lease term.Freehold land is not depreciated.Leasehold land (includes development cost) is amortised on a straight line basis over the period of respective lease, except leasehold land acquired on perpetual lease. Depreciation methods, useful lives and residual values are reviewed at each financial year end and adjusted as appropriate.
The estimated useful lives of items of property, plant and equipment are as follows:
Asset Useful life as per Schedule IIBuildings 3 to 60 yearsPlant and equipments 15 to 25 yearsFurniture and fixtures 10 yearsVehicles 8 to 10 yearsOffice equipments 3 to 10 years
Depreciation method, useful lives and residual values are reviewed at each financial year-end and adjusted if appropriate. Depreciation on additions (discard/disposals) is provided on a pro-rata basis i.e. from (upto) the date on which asset is ready for use (discarded/disposed off ).
e. Intangible assets (i) Recognition and measurement
Intangible assets are initially measured at cost and subsequently measured at cost less accumulated amortisation and any accumulated impairment losses.
(ii) Subsequent expenditureSubsequent expenditure is capitalised only when it increases the future economic benefits embodied in the specific asset to which it relates. All other expenditure, including expenditure on internally generated goodwill and brands, is recognised in profit or loss as incurred.
(iii) AmortisationAmortisation is calculated to write off the cost of intangible assets less their estimated residual values over their estimated useful lives using the straight-line method, and is included in depreciation and amortisation in Consolidated Statement of Profit and Loss.
The estimated useful lives are as follows:- Computer software 5 years
Amortisation method, useful lives and residual values are reviewed at the end of each financial year and adjusted if appropriate.
f. InventoriesInventories which comprise raw materials, work-in-progress, finished goods, packing materials, stores and spares are measured at the lower of cost and net realisable value.
The cost of inventories is ascertained on the ‘weighted average’ basis, and includes expenditure incurred in acquiring the inventories, production or conversion costs and other costs incurred in bringing them to their present location and condition. Excise duty was included in the valuation of closing inventory of finished goods, till the implementation of Goods and Services Tax.
Raw materials, components and other supplies held for use in the production of finished products are not written down below cost except in cases where material prices have declined and it is estimated that the cost of the finished products will exceed their net realisable value. The comparison of cost and net realisable value is made on an item-by-item basis.
The net realisable value of work-in-progress is determined with reference to the selling prices of related finished products.
In the case of manufactured inventories and work-in-progress, cost includes an appropriate share of fixed production overheads based on normal operating capacity.
Net realisable value is the estimated selling price in the ordinary course of business, less the estimated costs of completion and the estimated costs necessary to make the sale.

220 | Greenpanel Industries Limited Annual Report 2020-21 | 221
CORPORATE OVERVIEW STATUTORY STATEMENTS FINANCIAL STATEMENTS
Notes to the consolidated financial statements for the year ended March 31, 2021 Notes to the consolidated financial statements for the year ended March 31, 2021
Assessment of net realisable value is made at each subsequent reporting date. When the circumstances that previously caused inventories to be written down below cost no longer exist or when there is clear evidence of an increase in net realisable value because of changed economic circumstances, the amount of the write-down is reversed.
g. Impairment (i) Impairment of financial instruments: financial assets
Financial assets, other than those at FVTPL, are assessed for indicators of impairment at the end of each reporting period. A financial asset is ‘credit- impaired’ when one or more events that have a detrimental impact on the estimated future cash flows of the financial asset have occurred.
The Group recognises loss allowances using the expected credit loss (ECL) model for the financial assets which are not fair valued through profit or loss. Loss allowance for trade receivable with no significant financing component is measured at an amount equal to lifetime of the ECL. For all other financial assets, expected credit losses are measured unless there has been a significant increase in credit risk from initial recognition in which case those are measured at lifetime of the ECL. The amount of expected credit losses (or reversal) that is required to adjust the loss allowance at the reporting date to the amount that is required to be recognised is recognised as an impairment gain or loss in Consolidated Statement of Profit and Loss.
In case of trade receivables, the Group follows the simplified approach permitted by Ind AS 109 Financial Instruments for recognition of impairment loss allowance. The application of simplified approach does not require the Group to track changes in credit risk. The Group calculates the expected credit losses on trade receivables using a provision matrix on the basis of its historical credit loss experience.
When determining whether the credit risk of a financial asset has increased significantly since initial recognition and when estimating expected credit losses, the Group considers reasonable and supportable information that is relevant and available without undue cost or effort. This includes both quantitative and qualitative information and analysis, based on the Group’s historical experience and informed credit assessment and including subsequent information. Loss allowances for financial assets measured at amortised cost are deducted from the gross carrying amount of the assets.
The gross carrying amount of a financial asset is written off (either partially or in full) to the extent that there is no realistic prospect of recovery. This is generally the case when the Group determines that the debtor does not have assets or sources of income that could generate sufficient cash flows to repay the amounts subject to the write-off. However, financial assets that are written off could still be subject to enforcement activities in order to comply with the Group’s procedures for recovery of amounts due.
(ii) Impairment of non-financial assetsThe Group’s non-financial assets, other than inventories and deferred tax assets, are reviewed at each reporting date to determine whether there is any indication of impairment. If any such indication exists, then the asset’s recoverable amount is estimated.
For impairment testing, assets that do not generate independent cash inflows are grouped together into cash-generating units (CGUs). Each CGU represents the smallest group of assets that generates cash inflows that are largely independent of the cash inflows of other assets or CGUs.
The recoverable amount of a CGU (or an individual asset) is the higher of its value in use and its fair value less costs to sell. Value in use is based on the estimated future cash flows, discounted to their present value using a pre-tax discount rate that reflects current market assessments of the time value of money and the risks specific to the CGU (or the asset).
The Group’s corporate assets (e.g. corporate office for providing support to various CGUs) do not generate independent cash inflows. To determine impairment of a corporate asset, recoverable amount is determined for the CGUs to which the corporate asset belongs. An impairment loss is recognised if the carrying amount of an asset or CGU exceeds its estimated recoverable amount. Impairment losses are recognised in the Consolidated Statement of Profit and Loss.
Impairment loss recognised in respect of a CGU is allocated first to reduce the carrying amount of any goodwill allocated to the CGU, and then to reduce the carrying amounts of the other assets of the CGU (or group of CGUs) on a pro rata basis.
An impairment loss in respect of other assets for which impairment loss has been recognised in prior periods, the Group reviews at each reporting date whether there is any indication that the loss has decreased or no longer exists. An impairment loss is reversed if there has been a change in the estimates used to determine the recoverable amount. Such a reversal is made only to the extent that the asset’s carrying amount does not exceed the carrying amount that would have been determined, net of depreciation or amortisation, if no impairment loss had been recognised.
Intangible assets with indefinite useful lives and intangible assets not yet available for use are tested for impairment at least annually, and whenever there is an indication that the asset may be impaired.
h. Non-current assets or disposal group held for saleNon-current assets, or disposal groups comprising assets and liabilities are classified as held for sale if it is highly probable that they will be recovered primarily through sale rather than through continuing use.
Such assets, or disposal groups, are generally measured at the lower of their carrying amount and fair value less costs to sell. Any resultant loss on a disposal group is allocated first to goodwill, and then to remaining assets and liabilities on pro rata basis, except that no loss is allocated to inventories, financial assets, deferred tax assets, employee benefit assets, and biological assets, which continue to be measured in accordance with the Group’s other accounting policies. Losses on initial classification as held for sale and subsequent gains and losses on re-measurement are recognised in profit or loss.
Once classified as held-for-sale, intangible assets and property, plant and equipment are no longer amortised or depreciated.
i. Employee benefits (i) Short-term employee benefits
Short-term employee benefit obligations are measured on an undiscounted basis and are expensed as the related service is provided. A liability is recognised for the amount expected to be paid e.g., under short-term cash bonus, if the Group has a present legal or constructive obligation to pay this amount as a result of past service provided by the employee, and the amount of obligation can be estimated reliably.
(ii) Defined contribution plansA defined contribution plan is a post-employment benefit plan under which an entity pays fixed contributions into Employees’ Provident Fund established under The Employees’ Provident Fund and Miscellaneous Provisions Act 1952 and will have no legal or constructive obligation to pay further amounts. The Group makes specified monthly contributions under employee provident fund to Government administered provident fund scheme. Obligations for contributions to defined contribution plans are recognised as an employee benefit expense in Consolidated Statement of Profit and Loss in the periods during which the related services are rendered by employeesPrepaid contributions are recognised as an asset to the extent that a cash refund or a reduction in future payments is available.

222 | Greenpanel Industries Limited Annual Report 2020-21 | 223
CORPORATE OVERVIEW STATUTORY STATEMENTS FINANCIAL STATEMENTS
Notes to the consolidated financial statements for the year ended March 31, 2021 Notes to the consolidated financial statements for the year ended March 31, 2021
(iii) Defined benefit plansA defined benefit plan is a post-employment benefit plan other than a defined contribution plan. The Group’s gratuity benefit scheme is a defined benefit plan. The Group’s net obligation in respect of defined benefit plans is calculated by estimating the amount of future benefit that employees have earned in the current and prior periods, discounting that amount and deducting the fair value of any plan assets.The calculation of defined benefit obligation is performed quarterly by an independent qualified actuary using the projected unit credit method. When the calculation results in a potential asset for the Group, the recognised asset is limited to the present value of economic benefits available in the form of any future refunds from the plan or reductions in future contributions to the plan (‘the asset ceiling’). In order to calculate the present value of economic benefits, consideration is given to any minimum funding requirements. The Group recognises all actuarial gains and losses arising from defined benefit plan immediately in the Consolidated Statement of Profit and Loss.
Remeasurements of the net defined benefit liability, which comprise actuarial gains and losses, the return on plan assets (excluding interest) and the effect of the asset ceiling (if any, excluding interest), are recognised in Other comprehensive income (OCI). The Group determines the net interest expense (income) on the net defined benefit liability (asset) for the period by applying the discount rate used to measure the defined benefit obligation at the beginning of the annual period to the then-net defined benefit liability (asset), taking into account any changes in the net defined benefit liability (asset) during the period as a result of contributions and benefit payments. Net interest expense and other expenses related to defined benefit plans are recognised in Consolidated Statement of Profit and Loss.
When the benefits of a plan are changed or when a plan is curtailed, the resulting change in benefit that relates to past service (‘past service cost’ or ‘past service gain’) or the gain or loss on curtailment is recognised immediately in Consolidated Statement of Profit and Loss. The Group recognises gains and losses on the settlement of a defined benefit plan when the settlement occurs.
(iv) Other long-term employee benefitsThe Group’s net obligation in respect of long-term employee benefits other than post-employment benefits is the amount of future benefit that employees have earned in return for their service in the current and prior periods; that benefit is discounted to determine its present value. Such benefits are in form of leave encashment that accrue to employees in return of their service. The calculation of other long term employee benefits is performed quarterly by an independent qualified actuary using the projected unit credit method. Remeasurements of the net defined benefit liability, which comprise actuarial gains and losses, the return on plan assets (excluding interest) and the effect of the asset ceiling (if any, excluding interest), are recognised in Other comprehensive income (OCI). Net interest expense and other expenses related to defined benefit plans are recognised in Consolidated Statement of Profit and Loss.
(v) Termination benefitsTermination benefits are expensed at the earlier of when the Group can no longer withdraw the offer of those benefits and when the Group recognises costs for a restructuring. If benefits are not expected to be settled wholly within 12 months of the reporting date, then they are discounted.
j. Provisions (other than for employee benefits)A provision is recognised if, as a result of a past event, the Group has a present legal or constructive obligation that can be estimated reliably, and it is probable that an outflow of economic benefits will be required to settle the obligation.Provisions are determined by discounting the expected future cash flows (representing the best estimate of the expenditure required to settle the present obligation at the balance sheet date) at a pre-tax rate that reflects current market assessments of the time value of money and the risks specific to the liability.
The unwinding of the discount is recognised as finance cost. Expected future operating losses are not provided for.The amount recognised as a provision is the best estimate of the consideration required to settle the present obligation at the end of the reporting period, taking into account the risks and uncertainties surrounding the obligation.
k. Revenue (i) Sale of goods
The Group follows Ind AS 115 “Revenue from Contracts with Customers”.The Group manufactures and sells in plywood and allied products, medium density fibreboard and allied products. Sales are recognised when control of the products has transferred, being when the products are delivered to the dealer, the dealer has full discretion over the channel and price to sell the products, and there is no unfulfilled obligation that could affect the dealer’s acceptance of the products. Delivery occurs when the products have been shipped to the specific location, the risk of obsolescence and loss have been transferred to the dealer, and either the dealer has accepted the products in accordance with the sales contract, the acceptance provisions have lapsed, or the Group has objective evidence that all criteria for acceptance have been satisfied.
The products are often sold with retrospective volume discounts based on aggregate sales over a 12 months period, cash discount on payment within specified period, promotional gift on achieving specific targets, quality claims if claims made in the specified period and other promotional expenses such as tours and travel packages to dealer, etc. Revenue from these sales is recognised based on the price specified in the contract, net of the estimated volume discounts, cash discounts, quality claims and promotional expenses. Accumulated experience is used to estimate and provide for the discounts/claims/provisions, using the expected value method, and revenue is only recognised to the extent that it is highly probable that a significant reversal will not occur. A refund liability (netted off with trade receivables) is recognised for expected volume discount payables, expected cash discount payables and expected quality claims to dealers in relation to sale made until the end of reporting period. Provision (included in other current liabilities) is recognised for expected sales promotional expenses against the sales made until the end of reporting period. No element of financing is deemed present as the sales are made with a credit term of 30-90 days, which is consistent with market practice.
(ii) Rental incomeRental income is recognised as part of other income on a straight-line basis over the term of the lease except where the rentals are structured to increase in line with expected general inflation.
(iii) Insurance claim Insurance claim due to uncertainty in realisation are accounted for on acceptance basis.
l. Government GrantsGrants from Government are recognised at their fair value where there is reasonable assurance that the grant will be received and the Company will comply with the conditions attached thereto.
Government grants related to revenue are recognised in the Consolidated Statement of Profit and Loss on a systematic and rational basis in the periods in which the Company recognises the related costs for which the grants are intended to compensate and are netted off with the related expenditure. If not related to a specific expenditure, it is taken as income and presented under “Other Income”.

224 | Greenpanel Industries Limited Annual Report 2020-21 | 225
CORPORATE OVERVIEW STATUTORY STATEMENTS FINANCIAL STATEMENTS
Notes to the consolidated financial statements for the year ended March 31, 2021 Notes to the consolidated financial statements for the year ended March 31, 2021
Government grants relating to property, plant and equipment are treated as deferred income and are credited to the statement of profit and loss on a systematic basis over the expected useful life of the related asset to match them with the costs for which they are intended to compensate and presented within other income.
m. Leases (i) Determining whether an arrangement contains a lease
At inception of an arrangement, it is determined whether the arrangement is or contains a lease. The arrangement is, or contains, a lease if fulfilment of the arrangement is dependent on the use of a specific asset or assets and the arrangement conveys a right to use the asset or assets, even if that right is not explicitly specified in an arrangement.At inception or on reassessment of the arrangement that contains a lease, the payments and other consideration required by such an arrangement are separated into those for the lease and those for other elements on the basis of their relative fair values. If it is concluded for a finance lease that it is impracticable to separate the payments reliably, then an asset and a liability are recognised at an amount equal to the fair value of the underlying asset. The liability is reduced as payments are made and an imputed finance cost on the liability is recognised using the incremental borrowing rate.
(ii) Assets held under leasesLeases of property, plant and equipment that transfer to the Group substantially all the risks and rewards of ownership are classified as finance leases. The leased assets are measured initially at an amount equal to the lower of their fair value and the present value of the minimum lease payments. Subsequent to initial recognition, the assets are accounted for in accordance with the accounting policy applicable to similar owned assets.Assets held under leases that do not transfer to the Group substantially all the risks and rewards of ownership (i.e. operating leases) are not recognised in the Group’s Balance Sheet.The Group has adopted Ind AS 116, Leases from April 1, 2019. Ind AS 116 is a single, on-balance sheet lease accounting model for lessees. A lessee recognises a right-of-use asset representing its right to use the underlying asset and a lease liability representing its obligation to make lease payments. There are recognition exemptions for short-term leases and leases of low-value items. Lessor accounting remains similar to the current standard – i.e. lessors continue to classify leases as finance or operating leases. It replaces existing leases guidance, Ind AS 17, Leases.The Group has recognised new assets and liabilities for its operating leases of land and office premises facilities. The nature of expenses related to those leases has now changed because the Group has recognised a depreciation charge for right-of-use assets and interest expense on lease liabilities.Previously, the Group recognised operating lease expense on a straight-line basis over the term of the lease, and recognised assets and liabilities only to the extent that there was a timing difference between actual lease payments and the expense recognised.
(iii) Lease paymentsPayments made under operating leases are generally recognised in Consolidated Statement of Profit and Loss on a straight-line basis over the term of the lease unless such payments are structured to increase in line with expected general inflation to compensate for the lessor’s expected inflationary cost increases.Lease incentives received are recognised as an integral part of the total lease expense over the term of the lease. Minimum lease payments made under finance leases are apportioned between the finance
charge and the reduction of the outstanding liability. The finance charge is allocated to each period during the lease term so as to produce a constant periodic rate of interest on the remaining balance of the liability.
n. Recognition of dividend income, interest income or expenseDividend income is recognised in Consolidated Statement of Profit and Loss on the date on which the Group’s right to receive payment is established.Interest income or expense is recognised using the effective interest method. The ‘effective interest rate’ is the rate that exactly discounts estimated future cash payments or receipts through the expected life of the financial instrument to:- the gross carrying amount of the financial asset; or- the amortised cost of the financial liability.In calculating interest income and expense, the effective interest rate is applied to the gross carrying amount of the asset (when the asset is not credit-impaired) or to the amortised cost of the liability. However, for financial assets that have become credit-impaired subsequent to initial recognition, interest income is calculated by applying the effective interest rate to the amortised cost of the financial asset. If the asset is no longer credit-impaired, then the calculation of interest income reverts to the gross basis.
o. Income taxIncome tax expense comprises of current tax and deferred tax. Current tax and deferred tax is recognised in the Consolidated Statement of Profit and Loss except to the extent that it relates to a business combination, or items recognised directly in equity or in OCI.
(i) Current taxCurrent tax comprises the expected tax payable or receivable on the taxable income or loss for the year and any adjustment to the tax payable or receivable in respect of previous years. The amount of current tax reflects the best estimate of the tax amount expected to be paid or received after considering the uncertainty, if any, related to income taxes. It is measured using tax rates (and tax laws) enacted or substantively enacted by the reporting date.Current tax assets and current tax liabilities are off set only if there is a legally enforceable right to set off the recognised amounts, and it is intended to realise the asset and settle the liability on a net basis or simultaneously.
(ii) Deferred taxDeferred tax is recognised in respect of temporary differences between the carrying amounts of assets and liabilities for financial reporting purposes and the corresponding amounts used for taxation purposes (tax base). Deferred tax is also recognised in respect of carried forward tax losses and tax credits. Deferred tax is not recognised for:- temporary differences arising on the initial recognition of assets or liabilities in a transaction that
is not a business combination and that affects neither accounting nor taxable profit or loss at the time of the transaction;
- temporary differences related to investments in subsidiaries, associates and joint arrangements to the extent that the Group is able to control the timing of the reversal of the temporary differences and it is probable that they will not reverse in the foreseeable future; and
- taxable temporary differences arising on the initial recognition of goodwill.Deferred tax assets are recognised to the extent that it is probable that future taxable profits will be available against which they can be used. The existence of unused tax losses is strong evidence that future taxable profit may not be available. Therefore, in case of a history of recent losses, the Group recognises a deferred tax asset only to the extent that it has sufficient taxable temporary differences or there is convincing other evidence that sufficient taxable profit will be available against which such deferred tax asset can be realised.

226 | Greenpanel Industries Limited Annual Report 2020-21 | 227
CORPORATE OVERVIEW STATUTORY STATEMENTS FINANCIAL STATEMENTS
Notes to the consolidated financial statements for the year ended March 31, 2021 Notes to the consolidated financial statements for the year ended March 31, 2021
Deferred tax assets – unrecognised or recognised, are reviewed at each reporting date and are recognised/ reduced to the extent that it is probable/ no longer probable respectively that the related tax benefit will be realised.Deferred tax is measured at the tax rates that are expected to apply to the period when the asset is realised or the liability is settled, based on the laws that have been enacted or substantively enacted by the reporting date.The measurement of deferred tax reflects the tax consequences that would follow from the manner in which the Group expects, at the reporting date, to recover or settle the carrying amount of its assets and liabilities.Deferred tax assets and liabilities are offset if there is a legally enforceable right to off set current tax liabilities and assets, and they relate to income taxes levied by the same tax authority on the same taxable entity, or on different tax entities, but they intend to settle current tax liabilities and assets on a net basis or their tax assets and liabilities will be realised simultaneously.In case of tax payable as Minimum Alternative Tax (‘MAT’) under the provisions of the Income-tax Act, 1961, the credit available under the Act in respect of MAT paid is recognised as an asset only when and to the extent there is convincing evidence that the Group will pay normal income tax during the period for which the MAT credit can be carried forward for set-off against the normal tax liability. MAT credit recognised as an asset is reviewed at each balance sheet date and written down to the extent the aforesaid convincing evidence no longer exists.
p. Borrowing costsBorrowing costs are interest and other costs (including exchange differences relating to foreign currency borrowings to the extent that they are regarded as an adjustment to interest costs) incurred in connection with the borrowing of funds. Borrowing costs directly attributable to acquisition or construction of an asset which necessarily take a substantial period of time to get ready for their intended use are capitalised as part of the cost of that asset. Other borrowing costs are recognised as an expense in the period in which they are incurred. Where there is an unrealised exchange loss which is treated as an adjustment to interest and subsequently there is a realised or unrealised gain in respect of the settlement or translation of the same borrowing, the gain to the extent of the loss previously recognised as an adjustment is recognised as an adjustment to interest.
q. Share capitalOrdinary shares are classified as equity. Incremental costs directly attributable to the issue of ordinary shares are recognised as a deduction from equity, net of any tax effects.
r. DividendsFinal dividends on shares are recorded as a liability on the date of approval by the shareholders and interim dividends are recorded as a liability on the date of declaration by the Board of Directors of the Group.
s. Cash and cash equivalentsCash and cash equivalents include cash and cash-on-deposit with banks. The Group considers all highly liquid investments with a remaining maturity at the date of purchase of three months or less and that are readily convertible to known amounts of cash to be cash equivalents.
t. Cash flow statementCash flows are reported using the indirect method, whereby profit for the period is adjusted for the effects of transactions of a non-cash nature, any deferrals or accruals of past or future operating cash receipts or payments and item of income or expenses associated with investing or financing cash flows. The cash flows from operating, investing and financing activities of the Group are segregated.
u. Earnings per shareBasic earnings per share is calculated by dividing the net profit or loss for the period attributable to equity shareholders by the weighted average number of equity shares outstanding during the period.
For the purpose of calculating diluted earnings per share, the net profit or loss for the period attributable to equity shareholders and the weighted average number of shares outstanding during the period are adjusted for the effects of all dilutive potential equity shares.
v. Operating segmentAn operating segment is a component of the Group that engages in business activities from which it may earn revenues and incur expenses, including revenues and expenses that relate to transactions with any of the Group’s other components, and for which discrete financial information is available. All operating segments’ operating results are reviewed regularly by the Chief Operating Decision Maker (CODM) to make decisions about resources to be allocated to the segments and assess their performance. The CODM consists of the Executive Chairman, Managing Director & CEO and Chief Financial Officer.
The Group has currently two reportable segments namely:i) Plywood and allied products, andii) Medium density fibreboards and allied products
w. Determination of fair valuesFair values have been determined for measurement and disclosure purposes based on the following methods. Where applicable, further information about the assumptions made in determining fair values is disclosed in the notes specific to that asset or liability.
(i) Non-derivative financial assetsNon-derivative financial assets are initially measured at fair value. If the financial asset is not subsequently accounted for at fair value through profit or loss, then the initial measurement includes directly attributable transaction costs. These are measured at amortised cost or at FVTPL. Investments in quoted equity instruments are measured at FVTPL.
(ii) Trade and other receivablesThe fair values of trade and other receivables are estimated at the present value of future cash flows, discounted at the market rate of interest at the measurement date. Short-term receivables with no stated interest rate are measured at the original invoice amount if the effect of discounting is immaterial. Fair value is determined at initial recognition and, for disclosure purposes, at each annual reporting date.
(iii) Derivative financial liabilitiesThe Group uses derivative financial instruments, such as forward currency contracts and interest rate swaps to hedge its foreign currency risks and interest rate risks. Such derivative financial instruments are initially recognised at fair value on the date on which a derivative contract is entered into and are subsequently re-measured at fair value.
(iv) Other non-derivative financial liabilitiesOther non-derivative financial liabilities are measured at fair value, at initial recognition and for disclosure purposes, at each annual reporting date. Fair value is calculated based on the present value of future principal and interest cash flows, discounted at the market rate of interest at the measurement date.

228 | Greenpanel Industries Limited Annual Report 2020-21 | 229
CORPORATE OVERVIEW STATUTORY STATEMENTS FINANCIAL STATEMENTS
Notes to the consolidated financial statements for the year ended March 31,2021H in lacs
Notes to the consolidated financial statements for the year ended March 31,2021H in lacs
4. Property, plant and equipmentSee accounting policy in note 3(d) and (g)
(a) Reconciliation of carrying amount Freehold
land Buildings Plant and
equipment Furniture
and fixtures Vehicles Office
equipment Total
Cost (Gross carrying amount)Balance at April 1, 2019 5,533.89 12,292.72 1,13,926.45 2,527.35 4,759.97 1,259.64 1,40,300.02 Additions 1.57 289.89 338.10 197.41 27.79 70.63 925.39 Disposals/ discard - - (31.24) (46.28) (374.90) (6.65) (459.07)Exchange differences on translation of foreign operations
- - - 19.51 228.63 3.47 251.61
Balance at March 31, 2020 5,535.46 12,582.61 1,14,233.31 2,697.99 4,641.49 1,327.09 1,41,017.95 Balance at April 1, 2020 5,535.46 12,582.61 1,14,233.31 2,697.99 4,641.49 1,327.09 1,41,017.95 Additions - 682.26 154.39 502.71 135.09 284.57 1,759.02 Disposals/ discard - (9.56) (90.93) (42.40) (1,987.87) (227.91) (2,358.67)Exchange differences on translation of foreign operations
- - - (7.48) (65.37) (1.33) (74.18)
Balance at March 31, 2021 5,535.46 13,255.31 1,14,296.77 3,150.82 2,723.34 1,382.42 1,40,344.12 Accumulated depreciationBalance at April 1, 2019 - 2,259.47 21,469.94 735.70 1,491.85 665.56 26,622.52 Depreciation for the year - 587.56 4,886.85 270.84 458.39 198.00 6,401.64 Adjustments/ disposals - - (19.94) (38.07) (204.52) (6.21) (268.74)Exchange differences on translation of foreign operations
- - - 11.27 69.40 1.68 82.35
Balance at March 31, 2020 - 2,847.03 26,336.85 979.74 1,815.12 859.03 32,837.77 Balance at April 1, 2020 - 2,847.03 26,336.85 979.74 1,815.12 859.03 32,837.77 Depreciation for the year - 562.78 4,823.05 266.92 339.81 188.13 6,180.69 Adjustments/ disposals - (9.30) (63.89) (36.91) (888.87) (213.37) (1,212.34)Exchange differences on translation of foreign operations
- - - (5.22) (21.25) (0.82) (27.29)
Balance at March 31, 2021 - 3,400.51 31,096.01 1,204.53 1,244.81 832.97 37,778.83 Carrying amounts (net)At April 1,2019 5,533.89 10,033.25 92,456.51 1,791.65 3,268.12 594.08 1,13,677.50 At March 31, 2020 5,535.46 9,735.58 87,896.46 1,718.25 2,826.37 468.06 1,08,180.18 At March 31, 2021 5,535.46 9,854.80 83,200.76 1,946.29 1,478.53 549.45 1,02,565.29
(b) SecurityAs at March 31, 2021, properties with a carrying amount of H1,01,647.05 lacs (March 31, 2020: H1,06,069.99 lacs) are subject to first charge to secured borrowings (see Note 19).
5. Capital work-in-progressSee accounting policy in note 3(d) and (g)
March 31, 2021 March 31, 2020At the beginning of the year 568.84 379.33 Additions during the year 357.30 211.94 Capitalised during the year 567.74 22.43 At the end of the year 358.40 568.84
Notes: (a) As at March 31, 2021, general borrowing costs capitalised during the year amounted to HNil (March 31, 2020: H
Nil)(b) As at March 31, 2021, properties under capital work-in-progress with a carrying amount of H358.40 lacs (March
31, 2020: H568.84 lacs) are subject to first charge to secured borrowings (see Note 19).
6. Other intangible assetsSee accounting policy in note 3(e) and (g)
(a) Reconciliation of carrying amountSoftware
Cost (Gross carrying amount)Balance at April 1, 2019 222.01 Additions 10.00 Disposals/write-off (0.42)Balance at March 31, 2020 231.59 Balance at April 1, 2020 231.59 Additions - Disposals/write-off (179.84)Balance at March 31, 2021 51.75 Accumulated amortisationBalance at April 1, 2019 149.63 Amortisation for the year 38.85 Adjustments/ disposals (0.42)Balance at March 31, 2020 188.06 Balance at April 1, 2020 188.06 Amortisation for the year 22.14 Adjustments/ disposals (175.93)Balance at March 31, 2021 34.27 Carrying amounts (net)At April 1, 2019 72.38 At March 31, 2020 43.53 At March 31, 2021 17.48

230 | Greenpanel Industries Limited Annual Report 2020-21 | 231
CORPORATE OVERVIEW STATUTORY STATEMENTS FINANCIAL STATEMENTS
Notes to the consolidated financial statements for the year ended March 31,2021H in lacs
Notes to the consolidated financial statements for the year ended March 31,2021H in lacs
8. Loans(Unsecured, considered good)
March 31, 2021 March 31, 2020Non-currentSecurity deposits 1,456.43 1,442.13 Loan to employees - 1.60
1,456.43 1,443.73 CurrentLoan to employees 42.53 38.23 Security deposits 34.31 58.49
76.84 96.72 1,533.27 1,540.45
9. Non-current tax assetsSee accounting policy in note 3(o)
March 31, 2021 March 31, 2020Income tax refund due (net of provisions) 255.92 261.39
255.92 261.39
Current tax liabilitiesSee accounting policy in note 3(o)
March 31, 2021 March 31, 2020Income tax liabilities 262.03 -
262.03 -
10. Inventories(Valued at the lower of cost and net realisable value)See accounting policy in note 3(f)
March 31, 2021 March 31, 2020Raw materials 6,389.37 4,740.47 Work-in-progress 1,735.16 2,587.41 Finished goods 4,259.01 5,943.94 [including in transit H1,451.11 lacs (March 31, 2020 H623.46 lacs)]Stock in trade 54.93 32.10 Stores and spares 2,497.33 2,084.75
14,935.80 15,388.67
Total carrying amount of inventories is pledged as securities against borrowings, refer note 19.
The write-down of inventories to net realisable value during the year amounting to H118.41 lacs (March 31, 2020: H161.44 lacs). These are recognised as expenses during the respective period and included in changes in inventories of stock in trade.
11. Trade receivablesMarch 31, 2021 March 31, 2020
Current Unsecured
- Considered good 7,775.98 7,052.11 - Credit Impaired 426.57 426.57
8,202.55 7,478.68 Less: Loss for allowances
- Credit Impaired 426.57 426.57 Net trade receivables 7,775.98 7,052.11 Of the aboveTrade receivables from related parties 130.53 43.64
Notes:
(a) No trade or other receivables are due from directors or other officers of the group either severally or jointly with any other person. Nor any trade or other receivables are due from firms or private companies respectively in which any director is a partner, a director or a member.
(b) Information about the group’s exposure to credit and currency risks, and loss allowances related to trade receivables are disclosed in note 42. Provision as disclosed above is on case to case basis as identified by the management.
(c) For terms and conditions of trade receivables owing from related parties, see note 39.(d) For receivables secured against borrowings, see note 19.
12. Cash and cash equivalentsSee accounting policy in note 3(s)
March 31, 2021 March 31, 2020Cash on hand 25.67 22.49 Balances with banks - On current accounts 1,281.76 603.30 - On deposit accounts (with original maturities up to 3 months) - 500.00
1,307.43 1,125.79
13. Other bank balancesMarch 31, 2021 March 31, 2020
Bank deposits due to mature after 3 months of original maturities but within 12 months of the reporting date*
5,891.16 28.93
5,891.16 28.93
*Pledged/lodged with various government authorities as security [H50.16 lacs (March 31, 2020 H28.93 lacs)]

232 | Greenpanel Industries Limited Annual Report 2020-21 | 233
CORPORATE OVERVIEW STATUTORY STATEMENTS FINANCIAL STATEMENTS
Notes to the consolidated financial statements for the year ended March 31,2021H in lacs
Notes to the consolidated financial statements for the year ended March 31,2021H in lacs
14. Other non-current assets(Unsecured, considered good)
March 31, 2021 March 31, 2020Capital advances 407.23 121.49 OthersUnmatured finance charges 52.34 77.01 Prepaid expenses 10.18 17.51 Balances with banks on deposit accounts - 1,200.00 Deposits against demand under appeal and/or under dispute 14.70 14.70 Amount due from sales tax authorities 17.74 75.85
502.19 1,506.56
15. Other financial assetsMarch 31, 2021 March 31, 2020
CurrentGovernment grants receivable 4,131.11 3,947.87 Export incentive receivable 31.62 48.69 Insurance claim receivable 10.65 4.12 Interest Receivable 52.78 15.76
4,226.16 4,016.44
16. Other current assets(Unsecured, considered good)
March 31, 2021 March 31, 2020To parties other than related partiesAdvances for supplies 394.15 363.48 Advances to employees 9.16 28.20 OthersPrepaid expenses 548.56 533.30 Unmatured finance charges 36.60 51.04 Balance with goods and service tax authorities 323.47 2,454.40
1,311.94 3,430.42
17. Equity share capitalSee accounting policy in note 3(q)
March 31, 2021 March 31, 2020Authorised150,000,000 (March 31, 2020: 150,000,000) equity shares of H1 each 1,500.00 1,500.00 Issued, subscribed and fully paid-up122,627,395 (March 31, 2020: 122,627,395) equity shares of H1 each 1,226.27 1,226.27
(a) Reconciliation of equity shares outstanding at the beginning and at the end of the reporting yearMarch 31, 2021 March 31, 2020
Number Amount Number AmountAt the commencement of the year 12,26,27,395 1,226.27 12,26,27,395 1,226.27 Changes during the year - - - - At the end of the year 12,26,27,395 1,226.27 12,26,27,395 1,226.27
(b) Rights, preferences and restrictions attached to equity sharesThe Holding Company has a single class of equity shares with par value of H1 per share. Accordingly, all equity shares rank equally with regard to dividends and share in the Holding Company’s residual assets on winding up. The equity shareholders are entitled to receive dividend as declared by the Holding Company from time to time. The voting rights of an equity shareholder on a poll (not on show of hands) are in proportion to its share of the paid-up equity capital of the Holding Company. Voting rights cannot be exercised in respect of shares on which any call or other sums presently payable has not been paid. Failure to pay any amount called up on shares may lead to their forfeiture.
On winding up of the Holding Company, the holders of equity shares will be entitled to receive the residual assets of the Holding Company, remaining after distribution of all preferential amounts, in proportion to the number of equity shares held.
(c) Particulars of shareholders holding more than 5% shares of fully paid up equity sharesEquity shares of H1 each March 31, 2021 March 31, 2020
Number % Number %S. M. Management Pvt. Ltd. 3,16,26,965 25.79% 3,16,26,965 25.79%Prime Holdings Pvt. Ltd. 1,33,32,800 10.87% 1,33,32,800 10.87%Jwalamukhi Investment Holdings - - 1,17,87,720 9.61%Shobhan Mittal 1,05,88,380 8.63% 1,05,88,380 8.63%HDFC Trustee Company Ltd. 71,32,580 5.82% 77,12,011 6.29%
(d) The Holding Company has not reserved any shares for issue under options and contracts/commitments for the sale of shares/ disinvestment.
(e) The Holding Company for the period of five years immediately preceding the reporting date has not:(i) Allotted any class of shares as fully paid pursuant to contract(s) without payment being received in cash.(ii) Allotted fully paid up shares by way of bonus shares.(iii) Bought back any class of shares.
17. Equity share capital (contd)

234 | Greenpanel Industries Limited Annual Report 2020-21 | 235
CORPORATE OVERVIEW STATUTORY STATEMENTS FINANCIAL STATEMENTS
Notes to the consolidated financial statements for the year ended March 31,2021H in lacs
Notes to the consolidated financial statements for the year ended March 31,2021H in lacs
18. Other equityMarch 31, 2021 March 31, 2020
Capital reserveAt the commencement of the year 59,808.56 59,808.56
59,808.56 59,808.56 Retained earningsAt the commencement of the year 4,898.31 3,452.25 Add: Profit for the year 6,880.84 1,446.06
11,779.15 4,898.31 Other comprehensive income (OCI)At the commencement of the year 231.19 62.72 Exchange differences in translating financial statements of foreign operations (46.75) 135.88 Remeasurements of the net defined benefit plans 39.38 32.59
223.82 231.19 71,811.53 64,938.06
(a) Description, nature and purpose of reserve:(i) Capital reserve: The capital reserve is created on account of the net assets transferred pursuant to the scheme
of arrangement(ii) Retained earnings: It comprises of accumulated profit/ (loss) of the Group.(iii) Other comprehensive income (OCI): It comprises of remeasurements of the net defined benefit plans on actuarial
valuation of gratuity and exchange differences in translating financial statements of foreign operations.
(b) Disaggregation of changes in items of OCI March 31, 2021 March 31, 2020
Retained earningsExchange differences in translating financial statements of foreign operations 129.19 175.94 Remeasurements of defined benefit liability/ (asset) 94.63 55.25
223.82 231.19
19. BorrowingsSee accounting policy in note 3(b), (c) and (p)
March 31, 2021 March 31, 2020Non-current borrowingsSecured
Term loansFrom banks
Foreign currency loans 29,541.80 38,187.09 Rupee loans 12,924.41 9,216.99
42,466.21 47,404.08 Less: Current maturities of long term borrowings (refer note 20) 7,271.30 4,911.22
35,194.91 42,492.86 Loan against vehicles 622.89 1,431.56 Less: Current maturities of loan against vehicles (refer note 20) 193.96 412.52
428.93 1,019.04 35,623.84 43,511.90
March 31, 2021 March 31, 2020Current borrowingsSecured
From banksForeign currency loan - buyers credit 474.62 487.15 Foreign currency loan - Packing Credit - 509.06 Rupee loans - repayable on demand 746.26 5,886.50
1,220.88 6,882.71 Unsecured
From banksChannel finance assurance facility 377.93 302.10 Foreign currency loan - bill discounting - 85.83
377.93 387.93 1,598.81 7,270.64
Information about the Group’s exposure to credit and currency risks, and loss allowances related to borrowings are disclosed in note 42.
(A) Terms of repaymentName of the lender Interest rate Repayment
scheduleYear of
maturityMarch 31,
2021March 31,
2020(i) Foreign currency term loans
Landesbank Baden-Wurttenberg [EUR 356.37 lacs (March 31, 2020: EUR 378.64 lacs)]
6 month Euribor +0.50%
Repayable at half yearly rest: 16 of
EUR 22.27 lacs
2028-29 30,559.52 31,552.49
Standard Chartered Bank [USD Nil (March 31, 2020: USD 104.50 lacs)]
- - - - 7,899.16
30,559.52 39,451.65 Unamortised processing fees (1,017.72) (1,264.56)
29,541.80 38,187.09
(ii) Rupee term loansHDFC Bank Limited 6 month
MCLR + 1.50%
Repayable at quarterly rest: 8
of H400 lacs & 8 of H325 lacs
2024-25 5,800.00 7,200.00
State Bank of India 6 month MCLR + 1.50%
Repayable at quarterly rest: 15
of H375 lacs
2024-25 5,625.00 -
Axis Bank Limited 6 month MCLR +
1.35%
Repayable at quarterly rest: 10
of H156.25 lacs
2023-24 1,562.50 2,031.25
12,987.50 9,231.25 Unamortised processing fees (63.09) (14.26)
12,924.41 9,216.99 Total 42,466.21 47,404.08
19. Borrowings (contd)
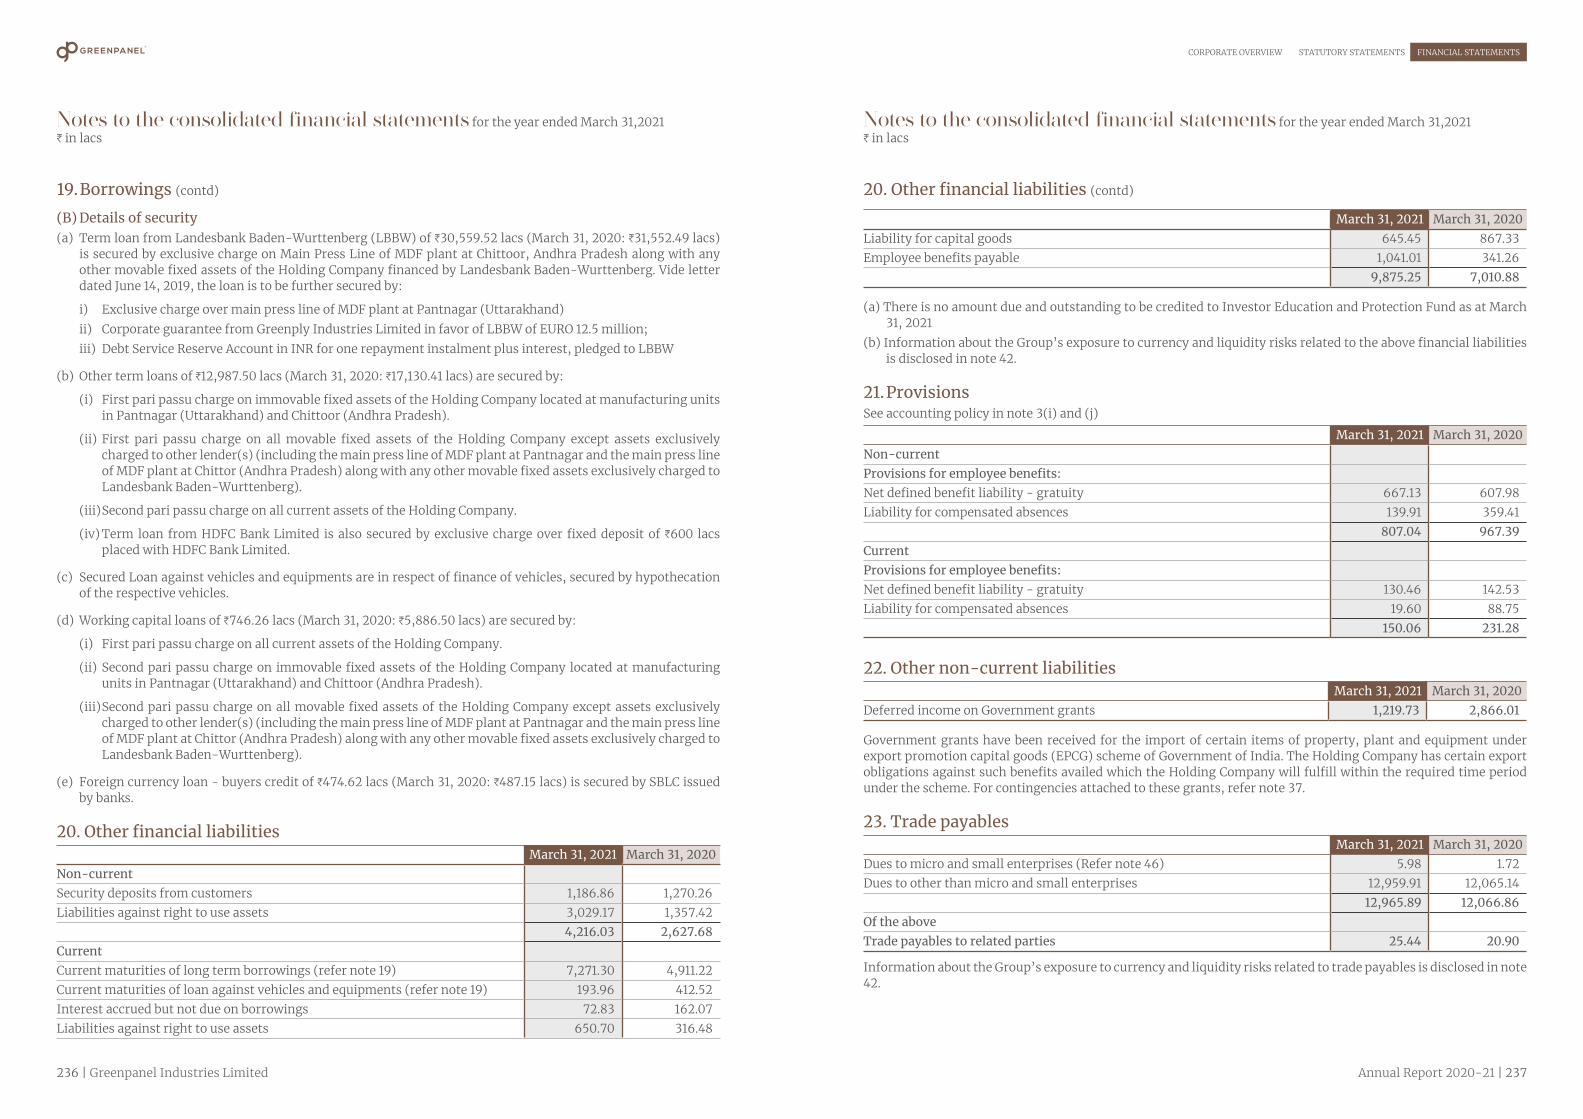
236 | Greenpanel Industries Limited Annual Report 2020-21 | 237
CORPORATE OVERVIEW STATUTORY STATEMENTS FINANCIAL STATEMENTS
Notes to the consolidated financial statements for the year ended March 31,2021H in lacs
Notes to the consolidated financial statements for the year ended March 31,2021H in lacs
(B) Details of security(a) Term loan from Landesbank Baden-Wurttenberg (LBBW) of H30,559.52 lacs (March 31, 2020: H31,552.49 lacs)
is secured by exclusive charge on Main Press Line of MDF plant at Chittoor, Andhra Pradesh along with any other movable fixed assets of the Holding Company financed by Landesbank Baden-Wurttenberg. Vide letter dated June 14, 2019, the loan is to be further secured by:
i) Exclusive charge over main press line of MDF plant at Pantnagar (Uttarakhand)ii) Corporate guarantee from Greenply Industries Limited in favor of LBBW of EURO 12.5 million;iii) Debt Service Reserve Account in INR for one repayment instalment plus interest, pledged to LBBW
(b) Other term loans of H12,987.50 lacs (March 31, 2020: H17,130.41 lacs) are secured by:
(i) First pari passu charge on immovable fixed assets of the Holding Company located at manufacturing units in Pantnagar (Uttarakhand) and Chittoor (Andhra Pradesh).
(ii) First pari passu charge on all movable fixed assets of the Holding Company except assets exclusively charged to other lender(s) (including the main press line of MDF plant at Pantnagar and the main press line of MDF plant at Chittor (Andhra Pradesh) along with any other movable fixed assets exclusively charged to Landesbank Baden-Wurttenberg).
(iii) Second pari passu charge on all current assets of the Holding Company.
(iv) Term loan from HDFC Bank Limited is also secured by exclusive charge over fixed deposit of H600 lacs placed with HDFC Bank Limited.
(c) Secured Loan against vehicles and equipments are in respect of finance of vehicles, secured by hypothecation of the respective vehicles.
(d) Working capital loans of H746.26 lacs (March 31, 2020: H5,886.50 lacs) are secured by:
(i) First pari passu charge on all current assets of the Holding Company.
(ii) Second pari passu charge on immovable fixed assets of the Holding Company located at manufacturing units in Pantnagar (Uttarakhand) and Chittoor (Andhra Pradesh).
(iii) Second pari passu charge on all movable fixed assets of the Holding Company except assets exclusively charged to other lender(s) (including the main press line of MDF plant at Pantnagar and the main press line of MDF plant at Chittor (Andhra Pradesh) along with any other movable fixed assets exclusively charged to Landesbank Baden-Wurttenberg).
(e) Foreign currency loan - buyers credit of H474.62 lacs (March 31, 2020: H487.15 lacs) is secured by SBLC issued by banks.
20. Other financial liabilitiesMarch 31, 2021 March 31, 2020
Non-currentSecurity deposits from customers 1,186.86 1,270.26 Liabilities against right to use assets 3,029.17 1,357.42
4,216.03 2,627.68 CurrentCurrent maturities of long term borrowings (refer note 19) 7,271.30 4,911.22 Current maturities of loan against vehicles and equipments (refer note 19) 193.96 412.52 Interest accrued but not due on borrowings 72.83 162.07 Liabilities against right to use assets 650.70 316.48
19. Borrowings (contd)
March 31, 2021 March 31, 2020Liability for capital goods 645.45 867.33 Employee benefits payable 1,041.01 341.26
9,875.25 7,010.88
(a) There is no amount due and outstanding to be credited to Investor Education and Protection Fund as at March 31, 2021
(b) Information about the Group’s exposure to currency and liquidity risks related to the above financial liabilities is disclosed in note 42.
21. ProvisionsSee accounting policy in note 3(i) and (j)
March 31, 2021 March 31, 2020Non-currentProvisions for employee benefits:Net defined benefit liability - gratuity 667.13 607.98 Liability for compensated absences 139.91 359.41
807.04 967.39 CurrentProvisions for employee benefits:Net defined benefit liability - gratuity 130.46 142.53 Liability for compensated absences 19.60 88.75
150.06 231.28
22. Other non-current liabilitiesMarch 31, 2021 March 31, 2020
Deferred income on Government grants 1,219.73 2,866.01
Government grants have been received for the import of certain items of property, plant and equipment under export promotion capital goods (EPCG) scheme of Government of India. The Holding Company has certain export obligations against such benefits availed which the Holding Company will fulfill within the required time period under the scheme. For contingencies attached to these grants, refer note 37.
23. Trade payablesMarch 31, 2021 March 31, 2020
Dues to micro and small enterprises (Refer note 46) 5.98 1.72 Dues to other than micro and small enterprises 12,959.91 12,065.14
12,965.89 12,066.86 Of the aboveTrade payables to related parties 25.44 20.90
Information about the Group’s exposure to currency and liquidity risks related to trade payables is disclosed in note 42.
20. Other financial liabilities (contd)

238 | Greenpanel Industries Limited Annual Report 2020-21 | 239
CORPORATE OVERVIEW STATUTORY STATEMENTS FINANCIAL STATEMENTS
Notes to the consolidated financial statements for the year ended March 31,2021H in lacs
Notes to the consolidated financial statements for the year ended March 31,2021H in lacs
24. DerivativesSee accounting policy in note 3(c)(v)
March 31, 2021 March 31, 2020CurrentForeign exchange forward contracts 12.85 (27.20)Foreign exchange interest rate swaps - 326.15 Foreign exchange currency swaps 73.74 (851.36)(Asset)/Liability 86.59 (552.41)
Information about the Group’s exposure to interest rate and currency risks related to derivatives is disclosed in note 42.
25. Other current liabilitiesMarch 31, 2021 March 31, 2020
Statutory dues 832.31 332.15 Deferred income on Government grants 2,160.00 2,210.00 Advance from customers 670.15 633.84
3,662.46 3,175.99
26. Revenue from operationsSee accounting policy in note 3(k) and (l)
Year ended March 31, 2021
Year ended March 31, 2020
Sale of products Finished goods 98,820.94 84,374.85 Stock-in-trade 1,278.74 335.04
1,00,099.68 84,709.89 Other operating revenueGovernment grants - Refund of goods and service tax and excise duty (refer note 47) - 731.72 - Government grants - EPCG scheme (refer note 22) 1,696.28 1,853.94 Export incentives 145.29 189.21 Miscellaneous income 134.29 171.86
1,975.86 2,946.73 1,02,075.54 87,656.62
Reconciliation of revenue from sale of products with the contracted priceContracted price 1,06,186.91 90,488.70 Less : Trade discounts, volume rebates etc. (6,087.23) (5,778.81)Sale of products 1,00,099.68 84,709.89
26. Revenue from operations (contd)
Disaggregated revenue informationThe disaggregation of the Group’s revenue from contracts with customers as under:
Segment Year ended March 31, 2021Plywood and
allied productsMedium Density
Fibre Board and allied products
Total
Type of GoodsFinished goods 20,431.49 78,389.45 98,820.94 Stock-in-trade 1,278.74 - 1,278.74
Sale of products 21,710.23 78,389.45 1,00,099.68 Revenue by geography- India 21,710.23 66,325.19 88,035.42 - Outside India - 12,064.26 12,064.26 Total revenue from contracts with customers 21,710.23 78,389.45 1,00,099.68
Segment Year ended March 31, 2020Plywood and
allied productsMedium Density
Fibre Board and allied products
Total
Type of GoodsFinished goods 21,210.73 63,164.12 84,374.85 Stock-in-trade 335.04 - 335.04
Sale of products 21,545.77 63,164.12 84,709.89 Revenue by geography- India 21,545.77 47,853.01 69,398.78 - Outside India - 15,311.11 15,311.11 Total revenue from contracts with customers 21,545.77 63,164.12 84,709.89
The reconciliation of the revenue from contracts with customers and other operating revenue is given below :
Segment Year ended March 31, 2021Plywood and
allied productsMedium Density
Fibre Board and allied products
Total
Sale of goods- External customers 21,710.23 78,389.45 1,00,099.68 - Inter-segment - - - Other Operating Revenue 28.08 1,947.78 1,975.86
21,738.31 80,337.23 1,02,075.54 Inter-segment elimination - - - Less: Other Operating Revenue (28.08) (1,947.78) (1,975.86)Total revenue from contracts with customers 21,710.23 78,389.45 1,00,099.68

240 | Greenpanel Industries Limited Annual Report 2020-21 | 241
CORPORATE OVERVIEW STATUTORY STATEMENTS FINANCIAL STATEMENTS
Notes to the consolidated financial statements for the year ended March 31,2021H in lacs
Notes to the consolidated financial statements for the year ended March 31,2021H in lacs
Segment Year ended March 31, 2020Plywood and
allied productsMedium Density
Fibre Board and allied products
Total
Sale of goods- External customers 21,545.77 63,164.12 84,709.89 - Inter-segment - - - Other Operating Revenue 48.13 2,898.60 2,946.73
21,593.90 66,062.72 87,656.62 Inter-segment elimination - - - Less: Other Operating Revenue (48.13) (2,898.60) (2,946.73)Total revenue from contracts with customers 21,545.77 63,164.12 84,709.89
a) The Group presented disaggregated revenue based on the type of goods sold to customers and location of customers. The Group’s revenue is recognised for goods transferred at a point in time. The Group believes that the above disaggregation the best depicts how the nature, amount, timing and uncertainty of revenues and cash flows are effected by industry, market and other economic factors. Segment wise nature, amount, timing and uncertainty of revenues and cash flows are described below:
Nature of goods or services
The Group manufactures and sales, plywood and other plywood-related allied products such as veneer, doors, etc, Medium Density Fibre Board and allied products such as fibre board, plank, etc.
When revenue is recognised
For Domestic Customer : Revenue is typically recognised when the goods are delivered to the customer’s warehouses. For Export Customer : Revenue is typically recognised on the receipt of bill of lading.
Significant payment terms
Payment is received as per the agreed payment terms with customer.
Obligations for returns and refunds, if any
Customers have the right to return the goods to the Group, if the customers are dissatisfied with the quality of product which is determined on a case to case basis by the Group.
b) For contract balances i.e. trade receivables refer Note 11.
c) The amount of revenue from contracts with customers recognised in the statement of profit and loss is the contracted price.
27. Other incomeYear ended
March 31, 2021Year ended
March 31, 2020Interest on fixed deposits with banks and others 222.96 202.82 Rental Income 1.20 0.87 Foreign exchange fluctuations 34.12 - Miscellaneous income 86.47 19.71
344.75 223.40
26. Revenue from operations (contd) 28. Cost of materials consumedYear ended
March 31, 2021Year ended
March 31, 2020Inventory of raw materials at the beginning of the year 4,740.47 3,695.02 Add: Purchases 44,287.19 39,915.78 Less: Inventory of raw materials at the end of the year (6,389.37) (4,740.47)
42,638.29 38,870.33
29. Purchase of stock in trade Year ended
March 31, 2021Year ended
March 31, 2020Purchase of traded goods 1,135.02 1,030.82
1,135.02 1,030.82
30. Changes in inventories of finished goods,work-in-progress and stock in trade See accounting policy in note 3(f)
Year ended March 31, 2021
Year ended March 31, 2020
Opening inventoriesWork-in-progress 2,587.41 2,423.13 Stock in trade 32.10 - Finished goods 5,943.94 5,418.79
8,563.45 7,841.92 Closing inventoriesWork-in-progress 1,735.16 2,587.41 Stock in trade 54.93 32.10 Finished goods 4,259.01 5,943.94
6,049.10 8,563.45 Effect of foreign exchange fluctuations - 10.15
2,514.35 (711.38)
31. Employees benefits expenseSee accounting policy in note 3(i)
Year ended March 31, 2021
Year ended March 31, 2020
Salaries, wages, bonus, etc. 8,784.38 8,869.20 Contribution to provident and other funds 535.95 564.17 Expenses related to post-employment defined benefit plan 191.51 181.44 Expenses related to compensated absences 199.26 138.66 Staff welfare expenses 79.20 135.27
9,790.30 9,888.74
Salaries, wages, bonus, etc. includes H602.31 lacs (March 31, 2020 H619.94 lacs) relating to outsource manpower cost.
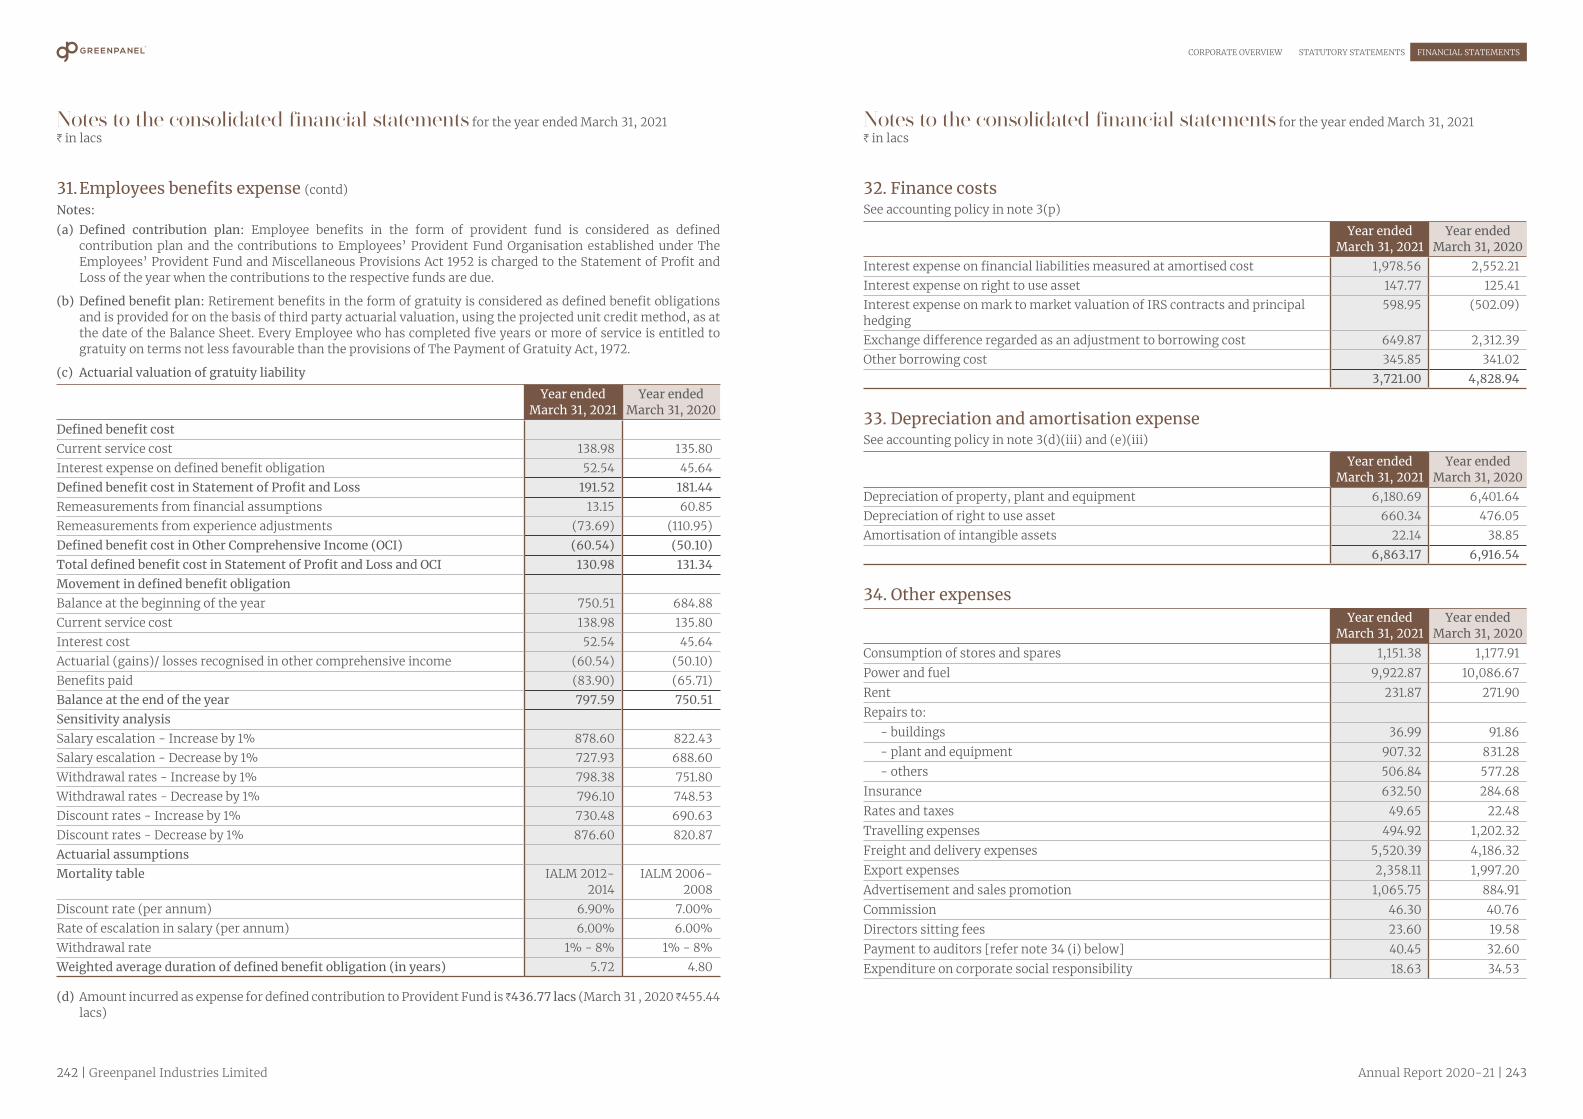
242 | Greenpanel Industries Limited Annual Report 2020-21 | 243
CORPORATE OVERVIEW STATUTORY STATEMENTS FINANCIAL STATEMENTS
Notes to the consolidated financial statements for the year ended March 31, 2021H in lacs
Notes to the consolidated financial statements for the year ended March 31, 2021H in lacs
Notes:(a) Defined contribution plan: Employee benefits in the form of provident fund is considered as defined
contribution plan and the contributions to Employees’ Provident Fund Organisation established under The Employees’ Provident Fund and Miscellaneous Provisions Act 1952 is charged to the Statement of Profit and Loss of the year when the contributions to the respective funds are due.
(b) Defined benefit plan: Retirement benefits in the form of gratuity is considered as defined benefit obligations and is provided for on the basis of third party actuarial valuation, using the projected unit credit method, as at the date of the Balance Sheet. Every Employee who has completed five years or more of service is entitled to gratuity on terms not less favourable than the provisions of The Payment of Gratuity Act, 1972.
(c) Actuarial valuation of gratuity liability
Year ended March 31, 2021
Year ended March 31, 2020
Defined benefit costCurrent service cost 138.98 135.80 Interest expense on defined benefit obligation 52.54 45.64 Defined benefit cost in Statement of Profit and Loss 191.52 181.44 Remeasurements from financial assumptions 13.15 60.85 Remeasurements from experience adjustments (73.69) (110.95)Defined benefit cost in Other Comprehensive Income (OCI) (60.54) (50.10)Total defined benefit cost in Statement of Profit and Loss and OCI 130.98 131.34 Movement in defined benefit obligationBalance at the beginning of the year 750.51 684.88 Current service cost 138.98 135.80 Interest cost 52.54 45.64 Actuarial (gains)/ losses recognised in other comprehensive income (60.54) (50.10)Benefits paid (83.90) (65.71)Balance at the end of the year 797.59 750.51 Sensitivity analysisSalary escalation - Increase by 1% 878.60 822.43 Salary escalation - Decrease by 1% 727.93 688.60 Withdrawal rates - Increase by 1% 798.38 751.80 Withdrawal rates - Decrease by 1% 796.10 748.53 Discount rates - Increase by 1% 730.48 690.63 Discount rates - Decrease by 1% 876.60 820.87 Actuarial assumptionsMortality table IALM 2012-
2014 IALM 2006-
2008 Discount rate (per annum) 6.90% 7.00%Rate of escalation in salary (per annum) 6.00% 6.00%Withdrawal rate 1% - 8% 1% - 8% Weighted average duration of defined benefit obligation (in years) 5.72 4.80
(d) Amount incurred as expense for defined contribution to Provident Fund is H436.77 lacs (March 31 , 2020 H455.44 lacs)
31. Employees benefits expense (contd) 32. Finance costsSee accounting policy in note 3(p)
Year ended March 31, 2021
Year ended March 31, 2020
Interest expense on financial liabilities measured at amortised cost 1,978.56 2,552.21 Interest expense on right to use asset 147.77 125.41 Interest expense on mark to market valuation of IRS contracts and principal hedging
598.95 (502.09)
Exchange difference regarded as an adjustment to borrowing cost 649.87 2,312.39 Other borrowing cost 345.85 341.02
3,721.00 4,828.94
33. Depreciation and amortisation expense See accounting policy in note 3(d)(iii) and (e)(iii)
Year ended March 31, 2021
Year ended March 31, 2020
Depreciation of property, plant and equipment 6,180.69 6,401.64 Depreciation of right to use asset 660.34 476.05 Amortisation of intangible assets 22.14 38.85
6,863.17 6,916.54
34. Other expensesYear ended
March 31, 2021Year ended
March 31, 2020Consumption of stores and spares 1,151.38 1,177.91 Power and fuel 9,922.87 10,086.67 Rent 231.87 271.90 Repairs to:
- buildings 36.99 91.86 - plant and equipment 907.32 831.28 - others 506.84 577.28
Insurance 632.50 284.68 Rates and taxes 49.65 22.48 Travelling expenses 494.92 1,202.32 Freight and delivery expenses 5,520.39 4,186.32 Export expenses 2,358.11 1,997.20 Advertisement and sales promotion 1,065.75 884.91 Commission 46.30 40.76 Directors sitting fees 23.60 19.58 Payment to auditors [refer note 34 (i) below] 40.45 32.60 Expenditure on corporate social responsibility 18.63 34.53

244 | Greenpanel Industries Limited Annual Report 2020-21 | 245
CORPORATE OVERVIEW STATUTORY STATEMENTS FINANCIAL STATEMENTS
Notes to the consolidated financial statements for the year ended March 31, 2021H in lacs
Notes to the consolidated financial statements for the year ended March 31, 2021H in lacs
Year ended March 31, 2021
Year ended March 31, 2020
Loss on sale/discard of property, plant and equipment 368.82 32.47 Provision for doubtful debts - 100.19 Foreign exchange fluctuations 68.67 505.88 Miscellaneous expenses 2,215.96 2,420.43
25,661.02 24,801.25
34 (i) Payment to auditorsYear ended
March 31, 2021Year ended
March 31, 2020As auditors:
- Statutory audit 36.12 27.64 - Tax audit - - - Limited review of quarterly results 3.90 3.90
In other capacity - Certification fees 0.43 0.73 - Other services - -
Reimbursement of expenses - 0.33 40.45 32.60
35. Income taxSee accounting policy in note 3(o)
Year ended March 31, 2021
Year ended March 31, 2020
(a) Amount recognised in Profit and LossCurrent tax 1,909.09 258.85 Earlier years tax - - Income tax 1,909.09 258.85 Deferred tax 3,216.30 (275.02)Mat credit (1,909.09) (258.85)Deferred tax 1,307.21 (533.87)Tax expense in Statement of Profit and Loss 3,216.30 (275.02)Deferred tax in other comprehensive income 21.16 17.51 Tax expense in Total Comprehensive Income 3,237.46 (257.51)(b) Reconciliation of effective tax rate for the yearProfit before Tax 10,097.14 1,171.04 Applicable Income Tax rate 34.944% 34.944%Computed tax expense 3,528.34 409.21 Additional deduction as per income tax - (15.44)Non-deductible expenses for tax purposes 6.51 12.07 Permanent difference on account of EPCG income (592.75) (647.84)Deferred tax asset not recognised on business losses of subsidiary 257.23 60.76 Other temporary differences 16.97 (93.78)
34. Other expenses (contd)
Year ended March 31, 2021
Year ended March 31, 2020
Tax expense in Statement of Profit and Loss 3,216.30 (275.02)(c) Recognised deferred tax assets and liabilities:Property, plant and equipment and intangible assets 15,295.59 15,434.77 Provisions for employee benefits (355.84) (483.02)Provision for doubtful debts (163.46) (151.99)Foreign exchange differences on account of mark to market valuation (794.14) (936.41)Other temporary differences (475.13) (252.99)Unabsorbed depreciation carried forward (8,822.36) (12,163.16)Minimum Alternate Tax (MAT) credit (2,667.35) (758.26)Deferred tax liabilities 2,017.31 688.94 (d) Reconciliation of Deferred Tax Liability:Temporary difference on account of:Property, plant and equipment and intangible assets (139.18) 700.83 Provisions for employee benefits 106.02 (32.18)Provision for doubtful debts (11.47) (30.23)Foreign exchange differences on account of mark to market valuation 142.27 (936.41)Other temporary differences (222.14) (243.30)Unabsorbed depreciation carried forward 3,340.80 266.27 Minimum Alternate Tax (MAT) credit entitlement (1,909.09) (258.85)Deferred tax in Statement of Profit and Loss 1,307.21 (533.87)Temporary difference of liabilities in other comprehensive income 21.16 17.51 Deferred tax in Total Comprehensive Income 1,328.37 (516.36)MAT credit utilisation in income tax for earlier years - - Total Deferred tax 1,328.37 (516.36)
36. Earnings per shareYear ended
March 31, 2021Year ended
March 31, 2020Basic and diluted earnings per share(i) Profit for the year, attributable to the equity shareholders 6,880.84 1,446.06 (ii) Weighted average number of equity shares
- Number of equity shares at the beginning of the year 12,26,27,395 12,26,27,395 - Number of equity shares at the end of the year 12,26,27,395 12,26,27,395
Weighted average number of equity shares 12,26,27,395 12,26,27,395 Basic and diluted earnings per share (H) [(i)/(ii)] 5.61 1.18
35. Income tax (contd)

246 | Greenpanel Industries Limited Annual Report 2020-21 | 247
CORPORATE OVERVIEW STATUTORY STATEMENTS FINANCIAL STATEMENTS
Notes to the consolidated financial statements for the year ended March 31, 2021H in lacs
Notes to the consolidated financial statements for the year ended March 31, 2021H in lacs
37. Contingent liabilities and commitments (to the extent not provided for)
Year ended March 31, 2021
Year ended March 31, 2020
Contingent liabilities(a)Claims against the Group not acknowledged as debts:
(i) Excise duty, sales tax and other indirect taxes in dispute 1,208.17 1,208.17 Capital and other commitments(i) Estimated amount of export obligations to be fulfilled in respect of goods
imported under Export Promotion Capital Goods scheme (EPCG) 21,511.01 33,614.22
(ii) Estimated amount of contracts remaining to be executed on capital account and not provided for (Net of advances)
2,175.69 340.25
Claim against the Group not acknowledged as debt:Cash outflows for the above are determinable only on receipt of judgments pending at various forums/ authorities. The Group has reviewed all its pending litigations and proceedings and has adequately provided for where provisions are required and disclosed as contingent liabilities where applicable, in its financial statements. The Group does not expect the outcome of these proceedings to have a materially adverse effect on its financial position.
38. LeasesSee accounting policy in note 3(m)
Group as a lesseeThe Group has lease contracts for offices and factory land. The Group’s obligations under these leases are secured by the lessor’s title to the leased assets. The Group is restricted from assigning and subleasing the leased assets. The Group also has certain leases of offices with lease terms of 12 months or less. The Group applies the ‘short-term lease’ recognition exemptions for these leases.
(a) Carrying amounts of right-of-use assetsLand Offices & Cars Total
Balance at April 1, 2020 1,225.51 1,660.67 2,886.18 Additions during the year - 2,657.30 2,657.30 Depreciation charge for the year (16.31) (644.03) (660.34)Exchange differences on translation of foreign operations - (41.32) (41.32)Balance at March 31, 2021 1,209.20 3,632.62 4,841.82
(b) Lease liabilitiesTotal
Maturity analysis - contractual undiscounted cash flowsLess than one year 800.02 One to five years 2,491.37 More than five years 879.46 Total undiscounted lease liabilities at March 31, 2021 4,170.85 Lease liabilities included in the balance sheetCurrent 650.70 Non-current 3,029.17 Lease liabilities included in the balance sheet at March 31, 2021 3,679.87
(c) Amount recognised in statement of profit and lossTotal
Interest expenses on lease liabilities 147.77 Depreciation of right-of-use assets 660.34 Expenses relating to short-term leases (included in other operating expenses) 231.87 Total amount recognised in profit and loss 1,039.98
(d) Amount recognised in statement of cash flows Total
Total cash outflow for leases (808.11)
39. Related party disclosurea) Other related parties with whom transactions have taken place during the yearKey Management Personnel (KMP)i) Mr Shiv Prakash Mittal, Executive Chairmanii) Mr Shobhan Mittal, Managing Director & CEOiii) Mr Mahesh Kumar Jiwarajka, Non-Executive Independent Directoriv) Mr Salil Kumar Bhandari, Non-Executive Independent Directorv) Mr Arun Kumar Saraf, Non-Executive Independent Directorvi) Ms. Susmita Singha, Non-Executive Independent Directorvii) Mr V. Venkatramani, Chief Financial Officerviii) Mr Lawkush Prasad, Company Secretary & Assistant Vice President-Legal
Relatives of Key Management Personnel (KMP)i) Mrs Chitwan Mittal (Wife of Mr Shobhan Mittal)
b) Enterprises controlled by Key Management Personnel or their relativesi) Greenlam Industries Limitedii) Greenlam South Limitediii) Greenply Industries Limited
c) Related party transactionsName of the related party Nature of transaction March 31, 2021 March 31, 2020Greenlam Industries Limited Sale of products* 447.49 847.04
Purchase of products* 199.66 97.35 Rent paid 0.60 0.60
Greenlam South Limited Rent paid 0.60 0.27
Greenply Industries LimitedSale of products* 3.59 82.81 Purchase of products* 37.95 -
Mr Shiv Prakash Mittal Remuneration 308.36 118.80 Mr Shobhan Mittal Remuneration 456.24 263.81 Mr Mahesh Kumar Jiwarajka Sitting Fees 6.60 4.70 Mr Salil Kumar Bhandari Sitting Fees 5.80 6.30 Mr Arun Kumar Saraf Sitting Fees 5.20 1.70 Ms Susmita Singha Sitting Fees 6.00 6.70
38. Leases (contd)

248 | Greenpanel Industries Limited Annual Report 2020-21 | 249
CORPORATE OVERVIEW STATUTORY STATEMENTS FINANCIAL STATEMENTS
Notes to the consolidated financial statements for the year ended March 31, 2021H in lacs
Notes to the consolidated financial statements for the year ended March 31, 2021H in lacs
Name of the related party Nature of transaction March 31, 2021 March 31, 2020Mr V. Venkatramani Remuneration 113.93 108.93 Mr Lawkush Prasad Remuneration 23.18 3.88 Mr Banibrata Desarkar Remuneration - 18.60 Mrs Chitwan Mittal Remuneration 32.95 29.23
Note : * indicates the amounts are inclusive of applicable Goods and Service Tax (GST)
d) Outstanding balancesName of the related party Nature of transaction March 31, 2021 March 31, 2020
Greenlam Industries LimitedSale of products 130.53 43.64 Purchase of products 25.44 20.90
e) Key Management Personnel compensation Key management personnels compensation comprised of the following:
Nature of transaction March 31, 2021 March 31, 2020Short-term employee benefits 783.92 479.96 Other long-term benefits 105.91 24.33 Perquisites 11.88 9.73 Total compensation paid to key management personnel 901.71 514.02
As the future liability for gratuity and compensated encashment is provided on an actuarial basis for the Holding Company as a whole, the amount pertaining to each key management personnel is not separately ascertainable and, therefore, not included above. Based on the recommendation of the Nomination and Remuneration Committee, all decisions relating to the remuneration of the KMPs are taken by the Board of Directors of the Holding Company, in accordance with shareholders’ approval, wherever necessary.
f) Terms and conditions of transactions with related parties Purchase from related parties are made in the ordinary course of business and on terms equivalent to those that prevail in arm’s length transactions with other vendors. Outstanding balances at the year-end are unsecured and will be settled in cash and cash equivalents.The Group has not recorded any impairment of receivables relating to amounts owed by related parties. This assessment is undertaken in each financial year through examining the financial position of the related parties and the market in which the related party operates.
h) Details of loans, investments and guarantees covered under Section 186(4) of the Companies Act, 2013(i) Details of loans Not Applicable(ii) Details of investments Not Applicable(iii) Details of guarantees Not Applicable
39. Related party disclosure (contd) 40. Accounting classifications and fair values (Ind AS 107) See accounting policy in note 3(c)
The fair values of financial assets and liabilities, together with the carrying amounts shown in the Consolidated Balance Sheet are as follows:
Nature of transaction March 31, 2021 March 31, 2020Financial assets at amortised cost
Non-currentLoans 1,456.43 1,443.73
CurrentTrade receivables 7,775.98 7,052.11 Cash and cash equivalents 1,307.43 1,125.79 Other bank balances 5,891.16 28.93 Loans 76.84 96.72 Other financial assets 4,226.16 4,016.44
20,734.00 13,763.72 Financial assets at fair value through profit and loss
CurrentLevel 2
Derivatives - 552.41 - 552.41
Total Financial Assets 20,734.00 14,316.13
Financial liabilities at amortised costNon-current
Borrowings 35,623.84 43,511.90 Other financial liabilities 4,216.03 2,627.68
CurrentBorrowings 1,598.81 7,270.64 Other financial liabilities 9,875.25 7,010.88 Trade payables 12,965.89 12,066.86
64,279.82 72,487.96 Financial liabilities at fair value through profit and loss
CurrentLevel 2Derivatives 86.59 -
64,366.41 72,487.96
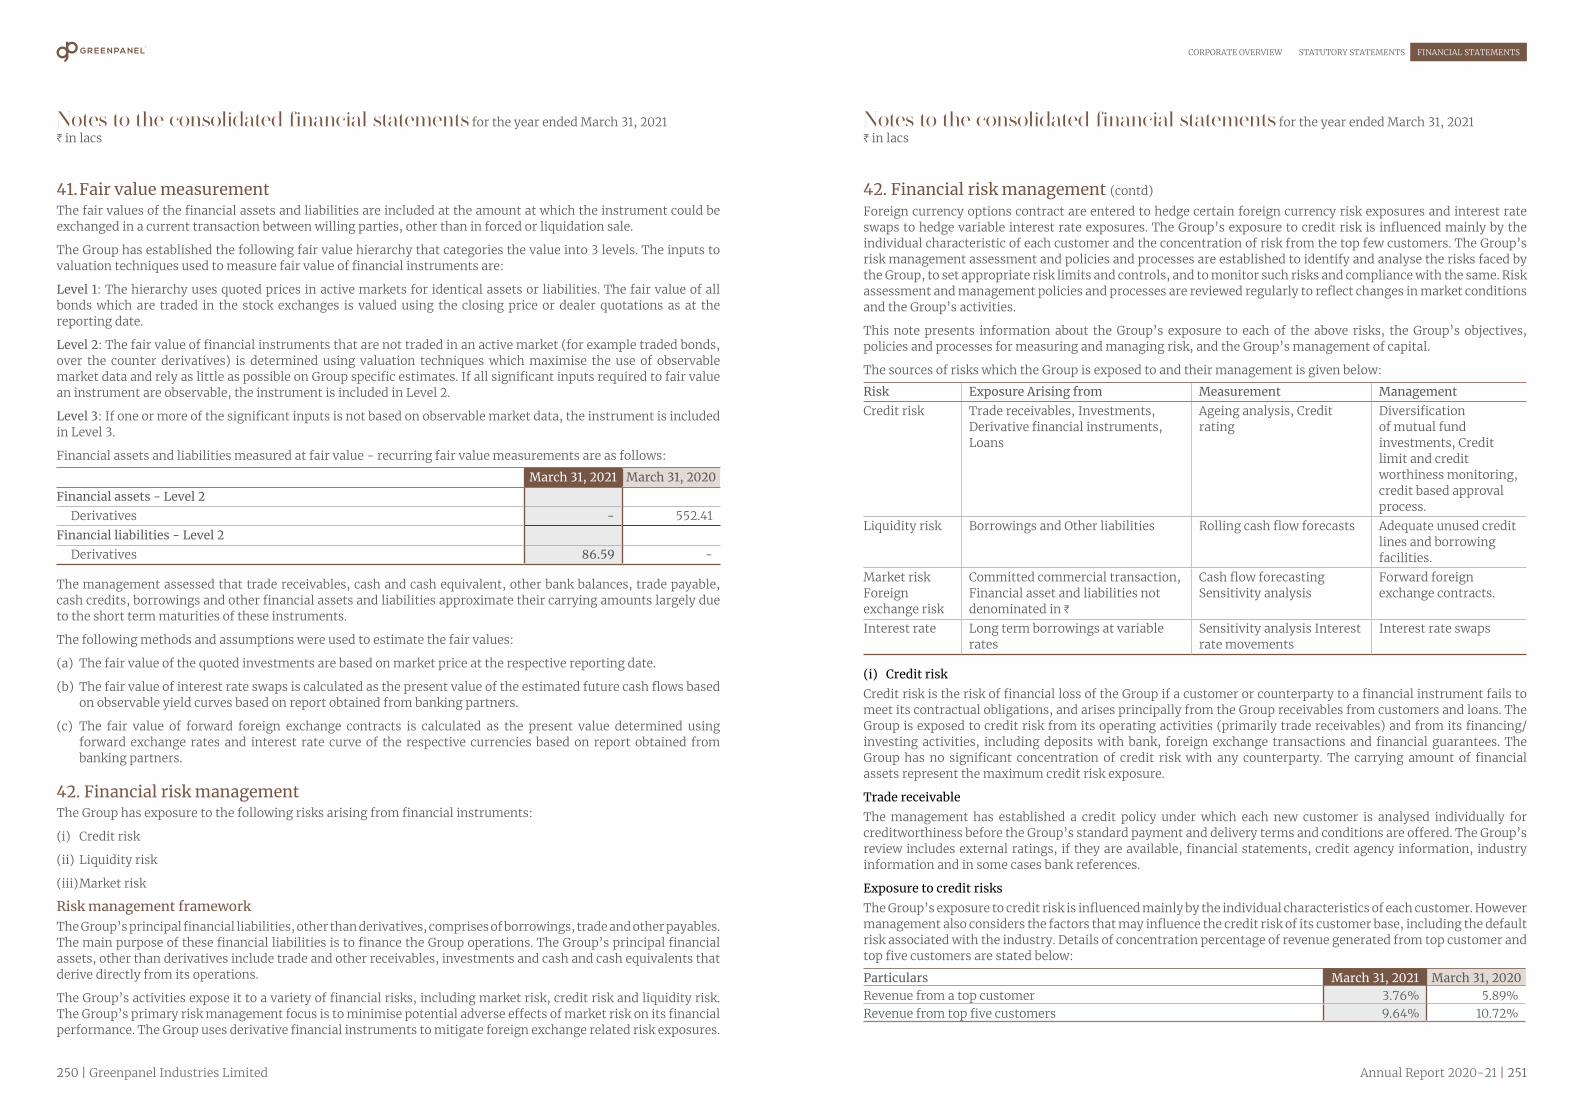
250 | Greenpanel Industries Limited Annual Report 2020-21 | 251
CORPORATE OVERVIEW STATUTORY STATEMENTS FINANCIAL STATEMENTS
Notes to the consolidated financial statements for the year ended March 31, 2021H in lacs
Notes to the consolidated financial statements for the year ended March 31, 2021H in lacs
41. Fair value measurementThe fair values of the financial assets and liabilities are included at the amount at which the instrument could be exchanged in a current transaction between willing parties, other than in forced or liquidation sale.
The Group has established the following fair value hierarchy that categories the value into 3 levels. The inputs to valuation techniques used to measure fair value of financial instruments are:
Level 1: The hierarchy uses quoted prices in active markets for identical assets or liabilities. The fair value of all bonds which are traded in the stock exchanges is valued using the closing price or dealer quotations as at the reporting date.
Level 2: The fair value of financial instruments that are not traded in an active market (for example traded bonds, over the counter derivatives) is determined using valuation techniques which maximise the use of observable market data and rely as little as possible on Group specific estimates. If all significant inputs required to fair value an instrument are observable, the instrument is included in Level 2.
Level 3: If one or more of the significant inputs is not based on observable market data, the instrument is included in Level 3.
Financial assets and liabilities measured at fair value - recurring fair value measurements are as follows:
March 31, 2021 March 31, 2020Financial assets - Level 2 Derivatives - 552.41 Financial liabilities - Level 2 Derivatives 86.59 -
The management assessed that trade receivables, cash and cash equivalent, other bank balances, trade payable, cash credits, borrowings and other financial assets and liabilities approximate their carrying amounts largely due to the short term maturities of these instruments.
The following methods and assumptions were used to estimate the fair values:
(a) The fair value of the quoted investments are based on market price at the respective reporting date.
(b) The fair value of interest rate swaps is calculated as the present value of the estimated future cash flows based on observable yield curves based on report obtained from banking partners.
(c) The fair value of forward foreign exchange contracts is calculated as the present value determined using forward exchange rates and interest rate curve of the respective currencies based on report obtained from banking partners.
42. Financial risk managementThe Group has exposure to the following risks arising from financial instruments:
(i) Credit risk
(ii) Liquidity risk
(iii) Market risk
Risk management frameworkThe Group’s principal financial liabilities, other than derivatives, comprises of borrowings, trade and other payables. The main purpose of these financial liabilities is to finance the Group operations. The Group’s principal financial assets, other than derivatives include trade and other receivables, investments and cash and cash equivalents that derive directly from its operations.
The Group’s activities expose it to a variety of financial risks, including market risk, credit risk and liquidity risk. The Group’s primary risk management focus is to minimise potential adverse effects of market risk on its financial performance. The Group uses derivative financial instruments to mitigate foreign exchange related risk exposures.
Foreign currency options contract are entered to hedge certain foreign currency risk exposures and interest rate swaps to hedge variable interest rate exposures. The Group’s exposure to credit risk is influenced mainly by the individual characteristic of each customer and the concentration of risk from the top few customers. The Group’s risk management assessment and policies and processes are established to identify and analyse the risks faced by the Group, to set appropriate risk limits and controls, and to monitor such risks and compliance with the same. Risk assessment and management policies and processes are reviewed regularly to reflect changes in market conditions and the Group’s activities.
This note presents information about the Group’s exposure to each of the above risks, the Group’s objectives, policies and processes for measuring and managing risk, and the Group’s management of capital.
The sources of risks which the Group is exposed to and their management is given below:
Risk Exposure Arising from Measurement ManagementCredit risk Trade receivables, Investments,
Derivative financial instruments, Loans
Ageing analysis, Credit rating
Diversification of mutual fund investments, Credit limit and credit worthiness monitoring, credit based approval process.
Liquidity risk Borrowings and Other liabilities Rolling cash flow forecasts Adequate unused credit lines and borrowing facilities.
Market risk Foreign exchange risk
Committed commercial transaction, Financial asset and liabilities not denominated in H
Cash flow forecasting Sensitivity analysis
Forward foreign exchange contracts.
Interest rate Long term borrowings at variable rates
Sensitivity analysis Interest rate movements
Interest rate swaps
(i) Credit riskCredit risk is the risk of financial loss of the Group if a customer or counterparty to a financial instrument fails to meet its contractual obligations, and arises principally from the Group receivables from customers and loans. The Group is exposed to credit risk from its operating activities (primarily trade receivables) and from its financing/investing activities, including deposits with bank, foreign exchange transactions and financial guarantees. The Group has no significant concentration of credit risk with any counterparty. The carrying amount of financial assets represent the maximum credit risk exposure.
Trade receivableThe management has established a credit policy under which each new customer is analysed individually for creditworthiness before the Group’s standard payment and delivery terms and conditions are offered. The Group’s review includes external ratings, if they are available, financial statements, credit agency information, industry information and in some cases bank references.
Exposure to credit risksThe Group’s exposure to credit risk is influenced mainly by the individual characteristics of each customer. However management also considers the factors that may influence the credit risk of its customer base, including the default risk associated with the industry. Details of concentration percentage of revenue generated from top customer and top five customers are stated below:
Particulars March 31, 2021 March 31, 2020Revenue from a top customer 3.76% 5.89%Revenue from top five customers 9.64% 10.72%
42. Financial risk management (contd)
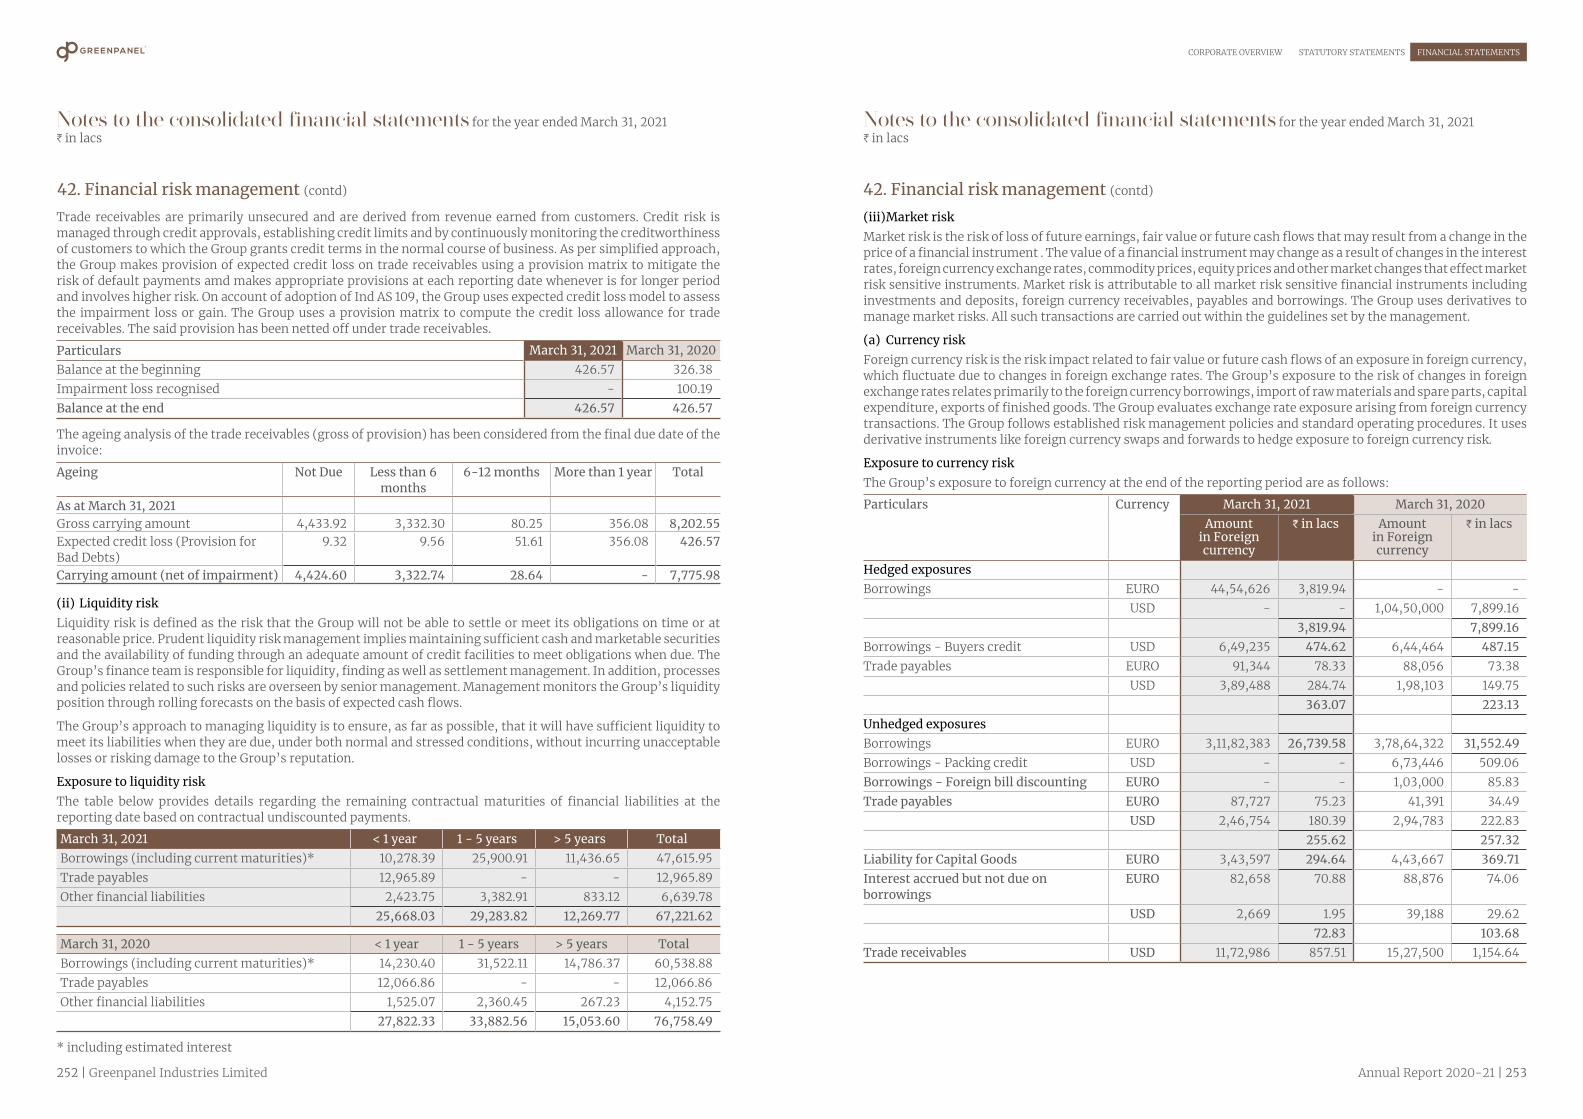
252 | Greenpanel Industries Limited Annual Report 2020-21 | 253
CORPORATE OVERVIEW STATUTORY STATEMENTS FINANCIAL STATEMENTS
Notes to the consolidated financial statements for the year ended March 31, 2021H in lacs
Notes to the consolidated financial statements for the year ended March 31, 2021H in lacs
Trade receivables are primarily unsecured and are derived from revenue earned from customers. Credit risk is managed through credit approvals, establishing credit limits and by continuously monitoring the creditworthiness of customers to which the Group grants credit terms in the normal course of business. As per simplified approach, the Group makes provision of expected credit loss on trade receivables using a provision matrix to mitigate the risk of default payments amd makes appropriate provisions at each reporting date whenever is for longer period and involves higher risk. On account of adoption of Ind AS 109, the Group uses expected credit loss model to assess the impairment loss or gain. The Group uses a provision matrix to compute the credit loss allowance for trade receivables. The said provision has been netted off under trade receivables.
Particulars March 31, 2021 March 31, 2020Balance at the beginning 426.57 326.38 Impairment loss recognised - 100.19 Balance at the end 426.57 426.57
The ageing analysis of the trade receivables (gross of provision) has been considered from the final due date of the invoice:
Ageing Not Due Less than 6 months
6-12 months More than 1 year Total
As at March 31, 2021Gross carrying amount 4,433.92 3,332.30 80.25 356.08 8,202.55 Expected credit loss (Provision for Bad Debts)
9.32 9.56 51.61 356.08 426.57
Carrying amount (net of impairment) 4,424.60 3,322.74 28.64 - 7,775.98
(ii) Liquidity riskLiquidity risk is defined as the risk that the Group will not be able to settle or meet its obligations on time or at reasonable price. Prudent liquidity risk management implies maintaining sufficient cash and marketable securities and the availability of funding through an adequate amount of credit facilities to meet obligations when due. The Group’s finance team is responsible for liquidity, finding as well as settlement management. In addition, processes and policies related to such risks are overseen by senior management. Management monitors the Group’s liquidity position through rolling forecasts on the basis of expected cash flows.
The Group’s approach to managing liquidity is to ensure, as far as possible, that it will have sufficient liquidity to meet its liabilities when they are due, under both normal and stressed conditions, without incurring unacceptable losses or risking damage to the Group’s reputation.
Exposure to liquidity riskThe table below provides details regarding the remaining contractual maturities of financial liabilities at the reporting date based on contractual undiscounted payments.
March 31, 2021 < 1 year 1 - 5 years > 5 years TotalBorrowings (including current maturities)* 10,278.39 25,900.91 11,436.65 47,615.95 Trade payables 12,965.89 - - 12,965.89 Other financial liabilities 2,423.75 3,382.91 833.12 6,639.78
25,668.03 29,283.82 12,269.77 67,221.62
March 31, 2020 < 1 year 1 - 5 years > 5 years TotalBorrowings (including current maturities)* 14,230.40 31,522.11 14,786.37 60,538.88 Trade payables 12,066.86 - - 12,066.86 Other financial liabilities 1,525.07 2,360.45 267.23 4,152.75
27,822.33 33,882.56 15,053.60 76,758.49
* including estimated interest
42. Financial risk management (contd) 42. Financial risk management (contd)
(iii) Market riskMarket risk is the risk of loss of future earnings, fair value or future cash flows that may result from a change in the price of a financial instrument . The value of a financial instrument may change as a result of changes in the interest rates, foreign currency exchange rates, commodity prices, equity prices and other market changes that effect market risk sensitive instruments. Market risk is attributable to all market risk sensitive financial instruments including investments and deposits, foreign currency receivables, payables and borrowings. The Group uses derivatives to manage market risks. All such transactions are carried out within the guidelines set by the management.
(a) Currency riskForeign currency risk is the risk impact related to fair value or future cash flows of an exposure in foreign currency, which fluctuate due to changes in foreign exchange rates. The Group’s exposure to the risk of changes in foreign exchange rates relates primarily to the foreign currency borrowings, import of raw materials and spare parts, capital expenditure, exports of finished goods. The Group evaluates exchange rate exposure arising from foreign currency transactions. The Group follows established risk management policies and standard operating procedures. It uses derivative instruments like foreign currency swaps and forwards to hedge exposure to foreign currency risk.
Exposure to currency riskThe Group’s exposure to foreign currency at the end of the reporting period are as follows:
Particulars Currency March 31, 2021 March 31, 2020Amount
in Foreign currency
I in lacs Amount in Foreign currency
I in lacs
Hedged exposuresBorrowings EURO 44,54,626 3,819.94 - -
USD - - 1,04,50,000 7,899.16 3,819.94 7,899.16
Borrowings - Buyers credit USD 6,49,235 474.62 6,44,464 487.15 Trade payables EURO 91,344 78.33 88,056 73.38
USD 3,89,488 284.74 1,98,103 149.75 363.07 223.13
Unhedged exposuresBorrowings EURO 3,11,82,383 26,739.58 3,78,64,322 31,552.49 Borrowings - Packing credit USD - - 6,73,446 509.06 Borrowings - Foreign bill discounting EURO - - 1,03,000 85.83 Trade payables EURO 87,727 75.23 41,391 34.49
USD 2,46,754 180.39 2,94,783 222.83 255.62 257.32
Liability for Capital Goods EURO 3,43,597 294.64 4,43,667 369.71 Interest accrued but not due on borrowings
EURO 82,658 70.88 88,876 74.06
USD 2,669 1.95 39,188 29.62 72.83 103.68
Trade receivables USD 11,72,986 857.51 15,27,500 1,154.64
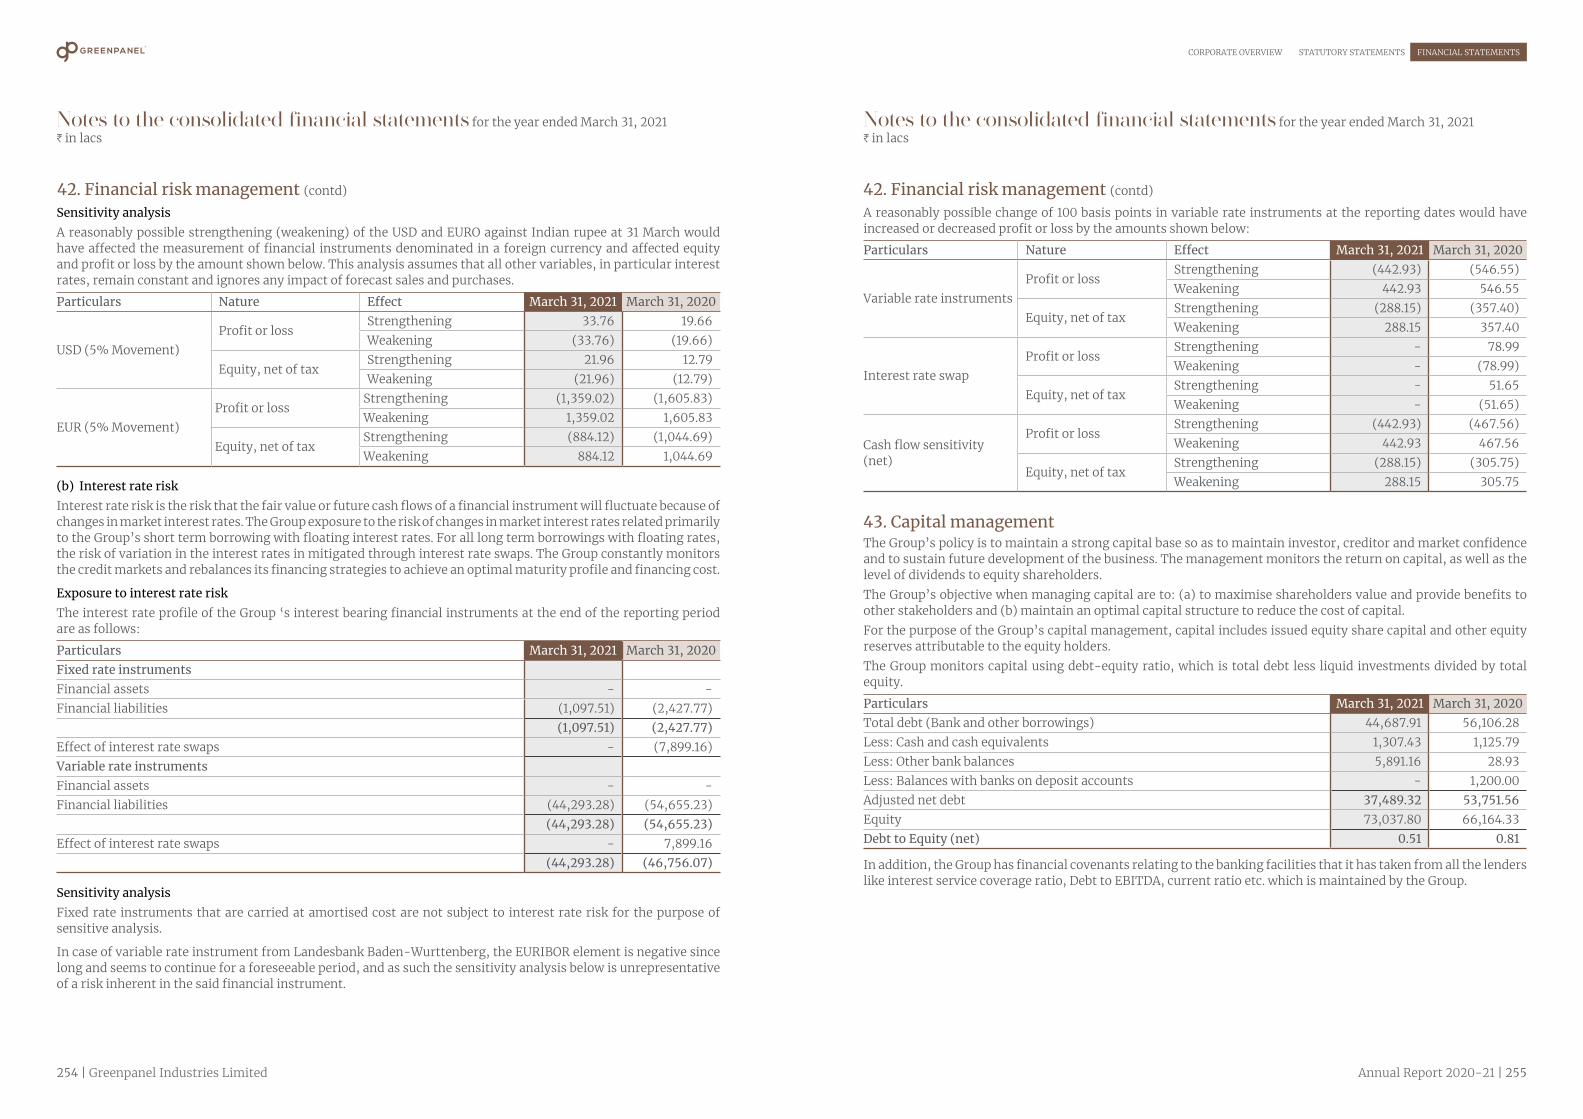
254 | Greenpanel Industries Limited Annual Report 2020-21 | 255
CORPORATE OVERVIEW STATUTORY STATEMENTS FINANCIAL STATEMENTS
Notes to the consolidated financial statements for the year ended March 31, 2021H in lacs
Notes to the consolidated financial statements for the year ended March 31, 2021H in lacs
Sensitivity analysisA reasonably possible strengthening (weakening) of the USD and EURO against Indian rupee at 31 March would have affected the measurement of financial instruments denominated in a foreign currency and affected equity and profit or loss by the amount shown below. This analysis assumes that all other variables, in particular interest rates, remain constant and ignores any impact of forecast sales and purchases.
Particulars Nature Effect March 31, 2021 March 31, 2020
USD (5% Movement)Profit or loss
Strengthening 33.76 19.66 Weakening (33.76) (19.66)
Equity, net of taxStrengthening 21.96 12.79 Weakening (21.96) (12.79)
EUR (5% Movement)Profit or loss
Strengthening (1,359.02) (1,605.83)Weakening 1,359.02 1,605.83
Equity, net of taxStrengthening (884.12) (1,044.69)Weakening 884.12 1,044.69
(b) Interest rate riskInterest rate risk is the risk that the fair value or future cash flows of a financial instrument will fluctuate because of changes in market interest rates. The Group exposure to the risk of changes in market interest rates related primarily to the Group’s short term borrowing with floating interest rates. For all long term borrowings with floating rates, the risk of variation in the interest rates in mitigated through interest rate swaps. The Group constantly monitors the credit markets and rebalances its financing strategies to achieve an optimal maturity profile and financing cost.
Exposure to interest rate riskThe interest rate profile of the Group ‘s interest bearing financial instruments at the end of the reporting period are as follows:
Particulars March 31, 2021 March 31, 2020Fixed rate instrumentsFinancial assets - - Financial liabilities (1,097.51) (2,427.77)
(1,097.51) (2,427.77)Effect of interest rate swaps - (7,899.16)Variable rate instrumentsFinancial assets - - Financial liabilities (44,293.28) (54,655.23)
(44,293.28) (54,655.23)Effect of interest rate swaps - 7,899.16
(44,293.28) (46,756.07)
Sensitivity analysisFixed rate instruments that are carried at amortised cost are not subject to interest rate risk for the purpose of sensitive analysis.
In case of variable rate instrument from Landesbank Baden-Wurttenberg, the EURIBOR element is negative since long and seems to continue for a foreseeable period, and as such the sensitivity analysis below is unrepresentative of a risk inherent in the said financial instrument.
42. Financial risk management (contd) 42. Financial risk management (contd)
A reasonably possible change of 100 basis points in variable rate instruments at the reporting dates would have increased or decreased profit or loss by the amounts shown below:
Particulars Nature Effect March 31, 2021 March 31, 2020
Variable rate instrumentsProfit or loss
Strengthening (442.93) (546.55)Weakening 442.93 546.55
Equity, net of taxStrengthening (288.15) (357.40)Weakening 288.15 357.40
Interest rate swapProfit or loss
Strengthening - 78.99 Weakening - (78.99)
Equity, net of taxStrengthening - 51.65 Weakening - (51.65)
Cash flow sensitivity (net)
Profit or lossStrengthening (442.93) (467.56)Weakening 442.93 467.56
Equity, net of taxStrengthening (288.15) (305.75)Weakening 288.15 305.75
43. Capital managementThe Group’s policy is to maintain a strong capital base so as to maintain investor, creditor and market confidence and to sustain future development of the business. The management monitors the return on capital, as well as the level of dividends to equity shareholders.The Group’s objective when managing capital are to: (a) to maximise shareholders value and provide benefits to other stakeholders and (b) maintain an optimal capital structure to reduce the cost of capital.For the purpose of the Group’s capital management, capital includes issued equity share capital and other equity reserves attributable to the equity holders.The Group monitors capital using debt-equity ratio, which is total debt less liquid investments divided by total equity.
Particulars March 31, 2021 March 31, 2020Total debt (Bank and other borrowings) 44,687.91 56,106.28 Less: Cash and cash equivalents 1,307.43 1,125.79 Less: Other bank balances 5,891.16 28.93 Less: Balances with banks on deposit accounts - 1,200.00 Adjusted net debt 37,489.32 53,751.56 Equity 73,037.80 66,164.33 Debt to Equity (net) 0.51 0.81
In addition, the Group has financial covenants relating to the banking facilities that it has taken from all the lenders like interest service coverage ratio, Debt to EBITDA, current ratio etc. which is maintained by the Group.

256 | Greenpanel Industries Limited Annual Report 2020-21 | 257
CORPORATE OVERVIEW STATUTORY STATEMENTS FINANCIAL STATEMENTS
Notes to the consolidated financial statements for the year ended March 31, 2021H in lacs
Notes to the consolidated financial statements for the year ended March 31, 2021H in lacs
44. Operating segmentsA. Basis of segmentAn operating segment is a component of the Group that engages in business activities from which it may earn revenues and incur expenses, including revenues and expenses that relate to transactions with any of the Group’ s other components, and for which discrete financial information is available. All operating segments’ operating results are reviewed regularly by the Group’s Chief operating decision maker (CODM) to make decisions about resources to be allocated to the segments and assess their performance.
The Group has two reportable segments, as described below, which is the Group’s strategic business units. These business units are managed separately because they require different technology and marketing strategies.
The following summary describes the operations in each of the Group’s reportable segments:
Reportable segment OperationsPlywood and allied products ManufacturingMedium Density Fibre Boards and allied products Manufacturing
B. Information about reportable segmentsInformation regarding the results of each reportable segment is included below. Performance is measured based on segment profit (before tax), as included in the internal management reports that are reviewed by the Group’s CEO. Segment profit is used to measure performance as management believes that such information is the most relevant in evaluating the results of certain segments relative to other entities that operate within these industries. Inter-segment pricing is determined on an arm’s length basis.
Year ended March 31, 2021 Reportable segments All other segments
TotalPlywood
and allied products
Medium Density Fibre
Boards and allied products
Total Reportable segments
Segment revenue:- External revenues
a) Sales 21,710.23 78,389.45 1,00,099.68 - 1,00,099.68 b) Other operating income 28.08 1,947.78 1,975.86 - 1,975.86
- Inter-segment revenue - - - - - Total segment revenue 21,738.31 80,337.23 1,02,075.54 - 1,02,075.54 Segment profit/(loss) before income tax 2,965.62 14,830.72 17,796.34 - 17,796.34 Segment profit/(loss) before income tax includes:Interest revenue - - - - - Interest expense - - - - - Depreciation and amortisation 418.55 5,609.54 6,028.09 - 6,028.09 Tax expense - - - - - Other material non cash item (if any) - - - - - Segment assets 9,707.45 1,19,186.86 1,28,894.31 - 1,28,894.31 Segment liabilities 4,406.69 61,005.32 65,412.01 - 65,412.01
44. Operating segments (contd)
Year ended March 31, 2020 Reportable segments All other segments
TotalPlywood
and allied products
Medium Density Fibre
Boards and allied products
Total Reportable segments
Segment revenue:- External revenues
a) Sales 21,545.77 63,164.12 84,709.89 - 84,709.89 b) Other operating income 48.13 2,898.60 2,946.73 - 2,946.73
- Inter-segment revenue - - - - - Total segment revenue 21,593.90 66,062.72 87,656.62 - 87,656.62 Segment profit/(loss) before income tax 2,869.36 8,052.45 10,921.81 - 10,921.81 Segment profit/(loss) before income tax includes:Interest revenue - - - - - Interest expense - - - - - Depreciation and amortisation 446.98 4,383.94 4,830.92 - 4,830.92 Tax expense - - - - - Other material non cash item (if any) - - - - - Segment assets 10,903.33 1,23,651.53 1,34,554.86 - 1,34,554.86 Segment liabilities 3,624.68 66,085.42 69,710.10 - 69,710.10
Property, plant and equipment are allocated based on location of the assets.
C. Reconciliations of information on reportable segments to Ind AS measures Year ended
March 31, 2021Year ended
March 31, 2020i. Revenues
Total revenue for reportable segments 1,02,075.54 87,656.62 Revenue for other segments - - Elimination of inter-segment revenue - - Elimination of revenue of discontinued operation - - Consolidated revenue 1,02,075.54 87,656.62
ii. Profit before taxTotal profit before tax for reportable segments 17,796.34 10,921.81 Profit before tax for other segments - - Elimination of inter-segment profits - - Elimination of profit of discontinued operation - - Unallocated amounts:Corporate expenses (7,699.20) (8,667.03)Consolidated profit before tax 10,097.14 2,254.78
iii. AssetsTotal assets for reportable segments 1,28,894.31 1,34,554.86 Assets for other segments - - Unallocated amounts 16,628.53 12,027.04 Consolidated total assets 1,45,522.84 1,46,581.90

258 | Greenpanel Industries Limited Annual Report 2020-21 | 259
CORPORATE OVERVIEW STATUTORY STATEMENTS FINANCIAL STATEMENTS
Notes to the consolidated financial statements for the year ended March 31, 2021H in lacs
Notes to the consolidated financial statements for the year ended March 31, 2021H in lacs
Year ended March 31, 2021
Year ended March 31, 2020
iv. LiabilitiesTotal liabilities for reportable segments 65,412.01 69,710.10 Liabilities for other segments - - Unallocated amounts 7,073.03 10,707.47 Consolidated total liabilities 72,485.04 80,417.57
v. Other material items
Particulars Year ended March 31, 2021 Year ended March 31, 2020Reportable
segment total
Adjustments Consolidated totals
Reportable segment
total
Adjustments Consolidated totals
Interest revenue - - - - - - Interest expense - 3,721.00 3,721.00 - 4,828.94 4,828.94 Depreciation and amortisation expense
6,028.09 835.08 6,863.17 4,830.92 2,085.62 6,916.54
D. Geographical informationParticulars Within India Outside India Total
March 31, 2021
March 31, 2020
March 31, 2021
March 31, 2020
March 31, 2021
March 31, 2020
External revenue by location of customers
90,011.28 72,345.51 12,064.26 15,311.11 1,02,075.54 87,656.62
Carrying amount of segment assets by location of assets
1,42,259.25 1,44,007.20 3,263.59 2,574.70 1,45,522.84 1,46,581.90
E. Major customerThe Group does not receive 10% or more of its revenues from transactions with any single external customer.
45. TaxationThe Group has established a comprehensive system of maintenance of information and documents as required by the transfer pricing regulations under Sections 92-92F of the Income-Tax Act, 1961. Since the law requires existence of such information and documentation to be contemporaneous in nature, the Group continuously updates its documents for the international transactions entered into with the associated enterprises during the financial year. The management is of the opinion that its international transactions are at arm’s length so that the aforesaid legislation will not have any impact on the financial statements, particularly on the amount of tax expense for the year and that of provision for taxation.
44. Operating segments (contd) 46. Dues to Micro enterprises and small enterprises March 31, 2021 March 31, 2020
(a) The amounts remaining unpaid to Micro and Small suppliers as at the end of each accounting year- Principal 5.98 1.72 - Interest - -
(b) The amount of interest paid by the buyer in terms of Section 16 of the Micro, Small and Medium Enterprises Development Act, 2006 (MSMED Act, 2006) along with the amount of the payment made to the supplier beyond the appointed day during each accounting year.
- -
(c) The amount of interest due and payable for the period of delay in making payment (which have been paid but beyond the appointed day during the year) but without adding the interest specified under MSMED Act, 2006.
- -
(d) The amount of interest accrued and remaining unpaid at the end of each accounting year
- -
(e) The amount of further interest remaining due and payable even in the succeeding years, until such date when the interest dues as above are actually paid to the small enterprise, for the purpose of disallowance as a deductible expenditure under Section 23 of the MSMED Act, 2006.
- -
Note: The above information regarding Micro Small & Medium Enterprises has been determined to the extent such parties have been identified on the basis of the information available with the Group. The same has been relied upon by the auditors.
47. Government grant (Ind AS 20): Other operating revenue includes incentives against scheme of budgetary support under Goods and Services Tax Regime for the unit set-up in Rudrapur, Uttarakhand of H Nil (March 31 ,2020 H731.72 lacs)Government grants receivable as on March 31, 2021 includes capital incentive subsidy of H1,477.50 lacs, power cost reimbursement subsidy of H1,541.89 lacs, and refund of goods and service tax on exports of H514.38 lacs for the unit set-up in Chittor, Andhra Pradesh. It also includes incentive receivable against scheme of budgetary support under Goods and Services Tax Regime of H597.34 lacs for the unit set-up in Rudrapur, Uttarakhand. Few of these grants are pending to be sanctioned/approved at various levels of government departments, balance are pending for disbursement by government authorities.
48. Exceptional Items March 31, 2021 March 31, 2020
Liability for repayment of central excise refund - 1,083.74
The Hon’ble Supreme Court of India vide its Order dated April 22, 2020 upheld the Special Leave Petition filed by the Union of India & Others in Civil Appeal Nos.2256-2263 of 2020 arising out of S.L.P. (C) Nos. 28194-28201/2010 in respect of availing of area based exemption under Central Excise in respect of manufacturing unit of Greenply Industries Limited (Greenply) at Tizit, Nagaland. Greenply may have to refund maximum principal amount upto H2,709.36 lacs in respect of excess refund received from the Excise Department for the period from April 1, 2008 to June 30, 2017. There is no penalty in this matter. The Excise Act does not contain any provision requiring payment of interest on amount erroneously refunded.
However, as per Clause No. 4.3.6 of the Composite Scheme of Arrangement between Greenply and the Holding Company duly approved by the Hon’ble National Company Law Tribunal, Guwahati Bench on June 28, 2019, the above principal amount of H2,709.36 lacs along with interest, if any, shall be shared by Greenply and the Holding Company. The Holding Company has, as a matter of abundant precaution, considered the probable outflow of H1,083.74 lacs i.e. 40% of H2,709.36 lacs as liability, based on the legal opinion and facts of present circumstances, and accordingly recognised the same as an exceptional expense in the Consolidated Statement of Profit and Loss for the year ended March 31, 2020.

260 | Greenpanel Industries Limited
Notes to the consolidated financial statements for the year ended March 31, 2021H in lacs
49. Disclosure of Covid-19 impact on the Group Due to outbreak of COVID-19 which has been declared as a Pandemic by World Health Organization and subsequent lock down ordered by the Central and State Government(s) in India, the manufacturing facility of the Holding Company at Rudrapur, Uttarakhand remained suspended from March 24, 2020 till May 26, 2020, and at Chittor, Andhra Pradesh from March 26, 2020 till May 21, 2020. In adherence to the safety norms prescribed by Government of India, the operations had been resumed as per Government guidelines in manufacturing units and offices. The same was scaled up in accordance with the guidelines being issued by the respective States and due consideration for safety of employees.
This situation had disturbed the economic activity through interruption in manufacturing activities. The lockdown was gradually lifted and economic activity resumed to its normal levels, the Group was able to achieve normalcy in operations by end of FY2020-21. In order to maintain adequate liquidity, the Holding Company had availed moratorium on some of the payments falling due between March 2020 and August 2020. During the fourth quarter ended March 31, 2021, revenues and profitability of the Group have seen significant improvement backed by increase in demand post lockdown.
50. Distribution made and proposed dividend (Ind AS 1) Proposed dividends on equity shares are subject to approval at the annual general meeting and are not recognised as a liability (including dividend distribution tax thereon) as at March 31, 2021. Since no dividend has been proposed in the current and previous year, financial figures with respect to the same has not been given.
51. The figures for the previous year are re-classified/ re-arranged / re -grouped, wherever necessary so as to be in conformity with the figures of the current year’s classification/disclosure.
The accompanying notes form an integral part of the consolidated financial statements
As per our report of even date attachedFor S.S. Kothari Mehta & Company For and on behalf of Board of Directors ofChartered Accountants Greenpanel Industries LimitedFirm Registration number: 000756N CIN: L20100AS2017PLC018272
Sunil Wahal Shiv Prakash Mittal Shobhan MittalPartner Executive Chairman Managing Director & CEOMembership No: 087294 (DIN : 00237242) (DIN : 00347517)
V. Venkatramani Lawkush Prasad ChiefFinancialOfficer CompanySecretary&AVP-Legal
Place : New Delhi Place : KolkataDated : May 14, 2021 Dated : May 14, 2021
Corporate InformationCorporate Information
Board of DirectorsMr. Shiv Prakash Mittal, Executive Chairman
Mr. Shobhan Mittal, Managing Director & CEOMr. Salil Kumar Bhandari, Independent Director
Mr. Mahesh Kumar Jiwrajka, Independent DirectorMs. Sushmita Singha, Independent Director
Mr. Arun Kumar Saraf, Independent Director
Audit CommitteeMr. Salil Kumar Bhandari, ChairmanMr. Shiv Prakash MittalMr. Mahesh Kumar JiwrajkaMs. Sushmita SinghaMr. Arun Kumar Saraf
Stakeholders Relationship CommitteeMr. Mahesh Kumar Jiwrajka, ChairmanMr. Shiv Prakash MittalMr. Shobhan Mittal
Nomination & Remuneration CommitteeMr. Salil Kumar Bhandari, ChairmanMr. Mahesh Kumar JiwrajkaMs. Sushmita Singha
Corporate Social Responsibility CommitteeMs. Sushmita Singha, ChairpersonMr. Shiv Prakash MittalMr. Shobhan Mittal
Operational CommitteeMr. Shiv Prakash Mittal, ChairmanMr. Shobhan MittalMr. Arun Kumar Saraf
Chief Financial OfficerMr. Vishwanathan Venkatramani
Chief Investor Relations OfficerMr. Vishwanathan Venkatramani, CFO
Company Secretary & AVP-LegalMr. Lawkush Prasad
Bankers/financial institutionsAxis Bank Ltd.HDFC Bank Ltd.Landesbank Baden-WurttembergRBL Bank LimitedState Bank of IndiaIndusind Bank Ltd.
Statutory AuditorsM/s. S. S. Kothari Mehta & Co (FRN: 000756N)Plot No. 68, Okhla Industrial Area, Phase – III, New Delhi – 110020
Registrar & Share Transfer AgentM/S Maheshwari Datamatics Private Limited23, R N Mukherjee Road, 5th Floor, Kolkata – 700001Phone: (033) 2248-2248, 2243-5029
Registered Office:Makum Road, P.O. Tinsukia, Assam - 786125
CIN:L20100AS2017PLC018272
Corporate Office:Thapar House, 2nd Floor163, S. P. Mukherjee Road, Kolkata - 700 026Phone: (033)-4084-0600Fax: (033)-2464-5525Email: [email protected]: www.greenpanel.com
Manufacturing Facilities1. Pantnagar, Rudrapur, Uttarakhand2. Chittoor, Andhra Pradesh