25
Opinion Paper Broadband Everywhere ‒ Assessment of Broadband Access Strategy based on Market and Cost Modeling 2013 / 02 We make ICT strategies work

Opinion Paper
Broadband Everywhere ‒ Assessment of Broadband Access Strategy based on Market and Cost Modeling
2013 / 02
We make ICT strategies work
Broadband Everywhere
Opinion Paper 2 Detecon International GmbH
Table of Contents
1 Executive Summary ............................................................................................. 3
2 Motivation and Challenges within a Joint Venture Portfolio ................................. 4
3 Detecon Approach and Methodology .................................................................. 2
4 Project Introduction .............................................................................................. 3
4.1 Phase I –Access Strategy for 6 integrated operators .................................. 3
4.1.1 Model Design ............................................................................................... 3
4.1.2 Process ........................................................................................................ 6
4.1.3 Data and Definitions .................................................................................... 6
4.1.4 How to deal with Black Box Perception and achieve buy in? ...................... 7
4.1.5 Results ......................................................................................................... 7
4.2 Phase II – SARA for 5 integrated operators .............................................. 11
4.2.1 The re run which was more than just re fresh-run ..................................... 11
4.2.2 Improvements ............................................................................................ 12
4.2.3 Model design ............................................................................................. 12
4.2.4 Process ...................................................................................................... 15
4.2.5 Input data guidance and reconciliation ...................................................... 15
4.2.6 Results ....................................................................................................... 16
5 Lessons learned ................................................................................................ 19
5.1 Process set up ........................................................................................... 19
5.2 Alignment steps ......................................................................................... 19
5.3 Data filling Guidelines ................................................................................ 19
6 Outlook .............................................................................................................. 20
7 Authors .............................................................................................................. 21
8 The Company .................................................................................................... 22
Broadband Everywhere
Opinion Paper 3 Detecon International GmbH
1 Executive Summary
Detecon was chosen by a big European integrated network operator to execute two projects
to support resource allocation in its Joint Ventures (JV). The main focuses were to develop a
consistent generalized methodology and assess the NPV (Net Present Value) of broadband
access technologies for six integrated Joint Ventures in Europe. The existing and future local
marketing data and network infrastructure were taken into account, while supporting
strategic decision and the optimization of CAPEX allocation. The project was planned in two
main phases from 2010 to 2012 and successfully performed with a number of
comprehensive deliverables.
Detecon took advantage of a professional planning tool „NetWorks‟ and developed the
technical cost models for HSPA+, LTE, xDSL and GPON to calculate CAPEX and OPEX for
broadband access network rollout over five years. In addition, an Excel-based commercial
model was implemented to transfer the marketing input and evaluate the NPV for different
rollout areas, both for the short/middle term planning (year 1-5) and the long term planning
(year 6-20).
Although centrally (headquarters) driven, the project required international data collection
and alignment. The results had to be discussed not just with the customer but also to be
explained in front of the participating Joint Ventures – at expert level as well as at
management level.
In our opinion the project delivered value for investment transparency and efficiency within
Joint Ventures:
Due to the centralized approach the shareholder benefits from a transparent
investment within a joint venture portfolio, based on the optimized CAPEX
allocation and a subsidiary independent generalized cost model. The
deliverables from the project give a clear feedback to support network design,
cost comparisons for network elements and the centralized technology
strategy. The positive business case can be introduced to all subsidiaries.
The Joint Ventures are able to review or establish their own broadband access
strategy from marketing, technical and financial point of view. The network
modeling is based on real network dimensioning rules provided by the JV
operator. The recommendations from the project can support the local
technical and marketing development.
The technical and marketing input from all Joint Ventures provides an explicit
overview of different devices/links/locations and ARPA/ARPU/Market share,
etc., which support both, shareholder and subsidiaries to reach the similar
price level, i.e. saving costs or increase revenues.
We believe that the proposed methodologies can be applied to other network operators as
well and support the financial investment and strategic decision of broadband access
strategy.

Broadband Everywhere
Opinion Paper 4 Detecon International GmbH
2 Motivation and Challenges within a Joint Venture Portfolio
It is not a surprise that a parent company having a number of Joint Ventures in different
countries operating fix and mobile networks has some difficulties in assessing the justified
needs for investments.
Revenues and EBITDA-margins under competitive pressure are strong arguments to meet
CAPEX-Sales ratios according to international bench marks for fixed and mobile
technologies. Recent examples have demonstrated that especially Chief Financial Officers
and Invest Committees lag of detailed information about investment programs and their
earning potentials of subsidiaries often apply a ´hair cut´ while trying to optimize Cash Flow
of the group.
Beside this, subsidiaries tend to highlight their specific setup, if it comes to a comparison.
Such local constraints must be taken into account, to save investments. The global view of
the parent company has to be standardized – to support comparability – and needs to be
customized – to handle local constraints.
Since significant investments are channeled into broadband network rollout – both fixed line
and mobile – efforts for transparency are needed. Transparency is especially required in
market ambitions and correlating to this for the value of technology rollout. Furthermore the
shareholder is highly interested in the optimized mix of broadband technologies and the
profitability ranking of the different technological options.
In those cases of missing relevant information about the invest programs our method
´Strategic Access Technology Resource Allocation´ based on a standardized modeling
approach helps the parent company to perform educated discussions about invest direction
and volume with the subsidiaries when it comes to broadband rollout strategies. Those
discussions in general lead to significant investment savings in the right areas -
geographical- and technology-wise.
To be as realistic as possible in an executable project time a reasonable standardized spatial
distribution within a country has to be established in order to distinguish different demand
and competitive situations as well as different architecture and cost levels for technologies.
As a welcomed side effect, by applying equal spatial distribution the shareholder was able to
do a comparison of technology values along different countries.
Broadband Everywhere
Opinion Paper 2 Detecon International GmbH
3 Detecon Approach and Methodology
Detecon developed the technical cost models for HSPA+, LTE, xDSL and GPON to calculate
CAPEX and OPEX for network rollout over five years, based on a professional planning tool
„NetWorks‟. An Excel-based commercial model is developed to transfer the marketing input
and evaluate the NPV for different rollout areas, both the short/middle term planning (year 1-
5) and the long term planning (year 6-20).
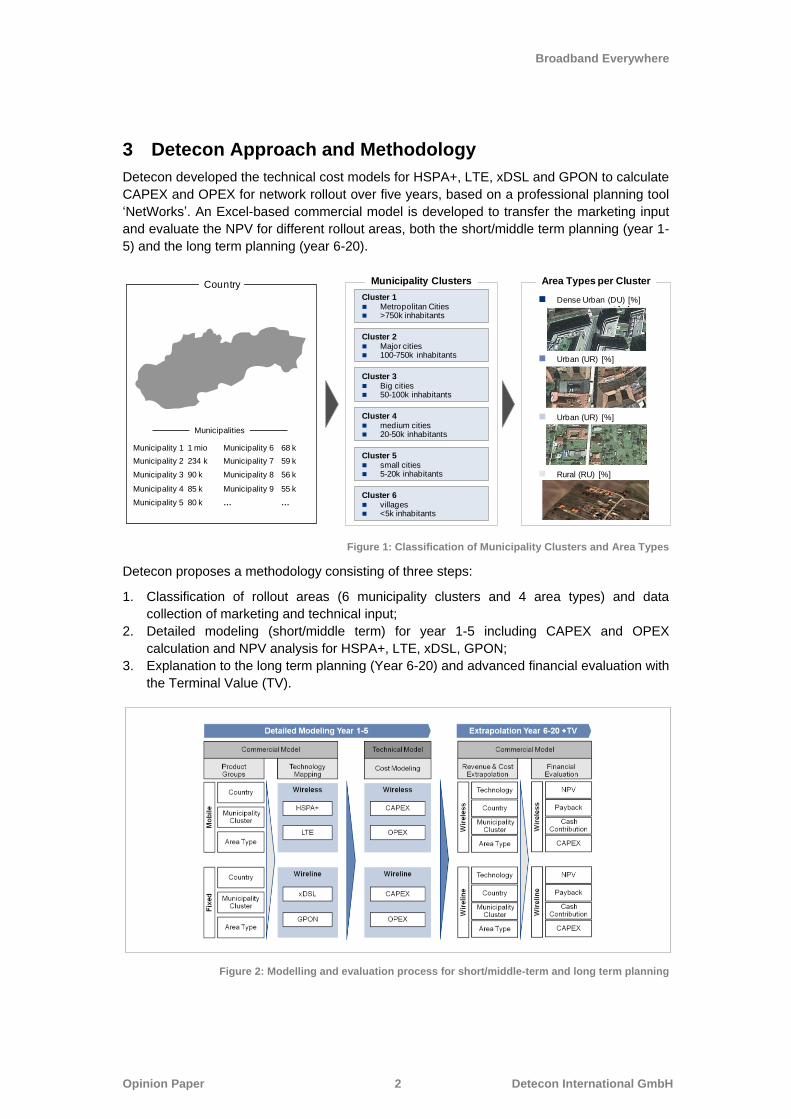
Figure 1: Classification of Municipality Clusters and Area Types
Detecon proposes a methodology consisting of three steps:
1. Classification of rollout areas (6 municipality clusters and 4 area types) and data
collection of marketing and technical input;
2. Detailed modeling (short/middle term) for year 1-5 including CAPEX and OPEX
calculation and NPV analysis for HSPA+, LTE, xDSL, GPON;
3. Explanation to the long term planning (Year 6-20) and advanced financial evaluation with
the Terminal Value (TV).
Figure 2: Modelling and evaluation process for short/middle-term and long term planning
Municipality Clusters Area Types per Cluster
Cluster 1 Metropolitan Cities >750k inhabitants
Cluster 2 Major cities 100-750k inhabitants
Cluster 3 Big cities 50-100k inhabitants
Cluster 4 medium cities 20-50k inhabitants
Cluster 5 small cities 5-20k inhabitants
Cluster 6 villages <5k inhabitants
Dense Urban (DU) [%]
Urban (UR) [%]
Urban (UR) [%]
Rural (RU) [%]
Municipality 1 1 mio
Municipality 2 234 k
Municipality 3 90 k
Municipality 4 85 k
Municipality 5 80 k
Municipality 6 68 k
Municipality 7 59 k
Municipality 8 56 k
Municipality 9 55 k
… …
Municipalities
Country
Broadband Everywhere
Opinion Paper 3 Detecon International GmbH
4 Project Introduction
4.1 Phase I –Access Strategy for 6 integrated operators
We endorse the customer´s opinion that the modeling exercise truly unfolds its value by
making it a recurring project – building upon earlier inputs, ambitions and results and
improving the model and the process by applying lessons learned.
4.1.1 Model Design
The model is designed as an incremental broadband demand driven approach, calculating
the CAPEX and OPEX needs on the basis of new broadband demand according to an equal
average spatial distribution within one country. The method can be qualified as a leveraged
model since existing infrastructure of earlier investments – justified or not – contribute to the
value.
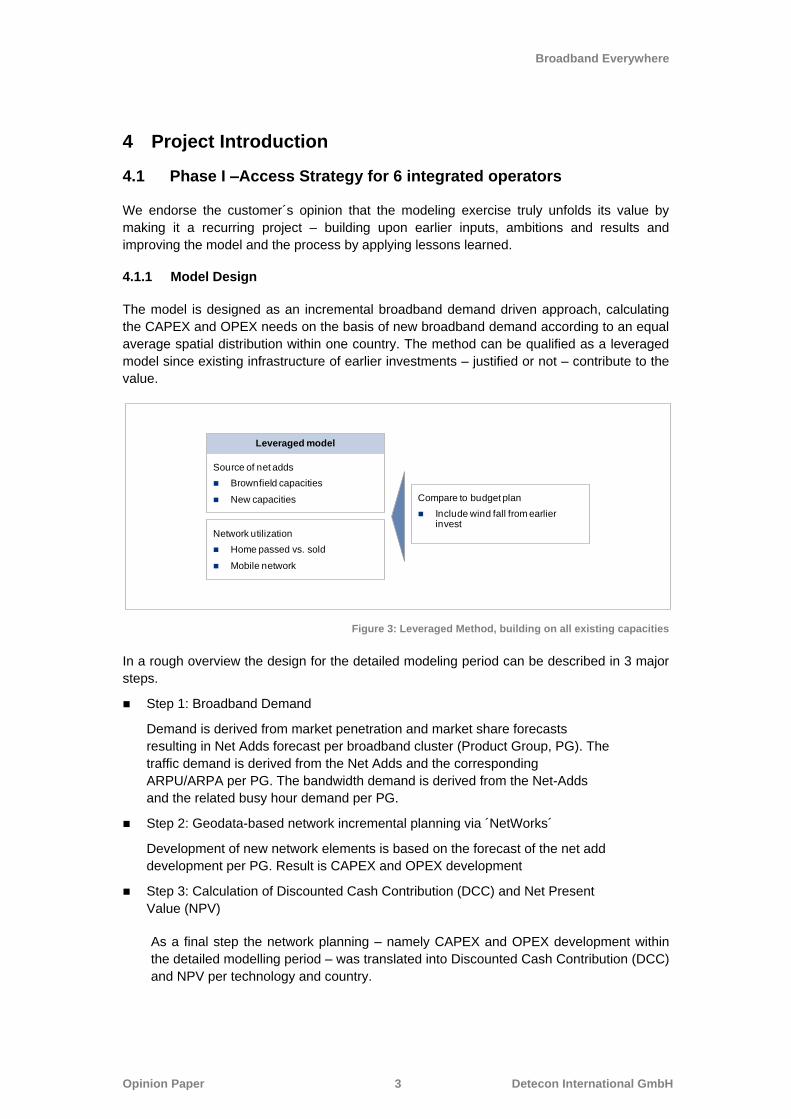
Figure 3: Leveraged Method, building on all existing capacities
In a rough overview the design for the detailed modeling period can be described in 3 major
steps.
Step 1: Broadband Demand
Demand is derived from market penetration and market share forecasts
resulting in Net Adds forecast per broadband cluster (Product Group, PG). The
traffic demand is derived from the Net Adds and the corresponding
ARPU/ARPA per PG. The bandwidth demand is derived from the Net-Adds
and the related busy hour demand per PG.
Step 2: Geodata-based network incremental planning via ´NetWorks´
Development of new network elements is based on the forecast of the net add
development per PG. Result is CAPEX and OPEX development
Step 3: Calculation of Discounted Cash Contribution (DCC) and Net Present
Value (NPV)
As a final step the network planning – namely CAPEX and OPEX development within
the detailed modelling period – was translated into Discounted Cash Contribution (DCC)
and NPV per technology and country.
Source of net adds
Brownfield capacities
New capacities
Leveraged model
Network utilization
Home passed vs. sold
Mobile network
Compare to budget plan
Include wind fall from earlier invest
Broadband Everywhere
Opinion Paper 4 Detecon International GmbH
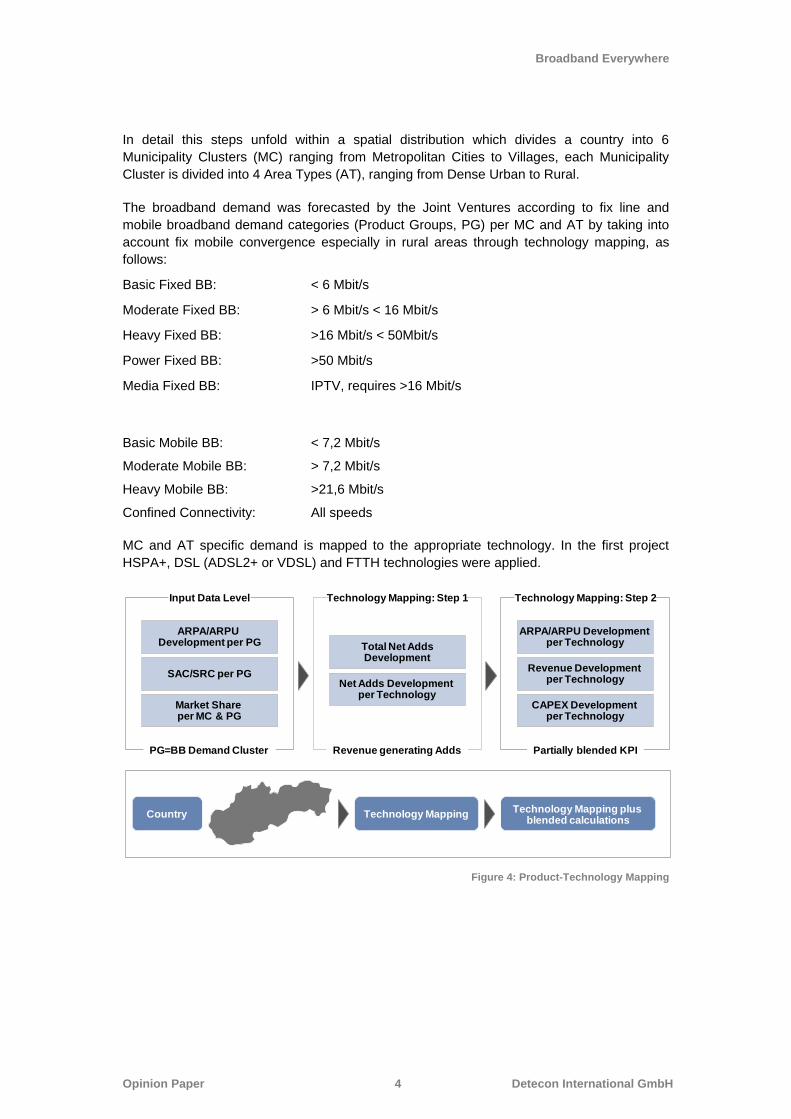
In detail this steps unfold within a spatial distribution which divides a country into 6
Municipality Clusters (MC) ranging from Metropolitan Cities to Villages, each Municipality
Cluster is divided into 4 Area Types (AT), ranging from Dense Urban to Rural.
The broadband demand was forecasted by the Joint Ventures according to fix line and
mobile broadband demand categories (Product Groups, PG) per MC and AT by taking into
account fix mobile convergence especially in rural areas through technology mapping, as
follows:
Basic Fixed BB: < 6 Mbit/s
Moderate Fixed BB: > 6 Mbit/s < 16 Mbit/s
Heavy Fixed BB: >16 Mbit/s < 50Mbit/s
Power Fixed BB: >50 Mbit/s
Media Fixed BB: IPTV, requires >16 Mbit/s
Basic Mobile BB: < 7,2 Mbit/s
Moderate Mobile BB: > 7,2 Mbit/s
Heavy Mobile BB: >21,6 Mbit/s
Confined Connectivity: All speeds
MC and AT specific demand is mapped to the appropriate technology. In the first project
HSPA+, DSL (ADSL2+ or VDSL) and FTTH technologies were applied.
Figure 4: Product-Technology Mapping
ARPA/ARPU Development per PG
SAC/SRC per PG
Market Share per MC & PG
ARPA/ARPU Development per Technology
Revenue Development per Technology
CAPEX Development per Technology
Total Net AddsDevelopment
Net Adds Development per Technology
Input Data Level Technology Mapping: Step 1 Technology Mapping: Step 2
PG=BB Demand Cluster Revenue generating Adds Partially blended KPI
Technology Mapping plus blended calculations
Technology MappingCountry
Broadband Everywhere
Opinion Paper 5 Detecon International GmbH
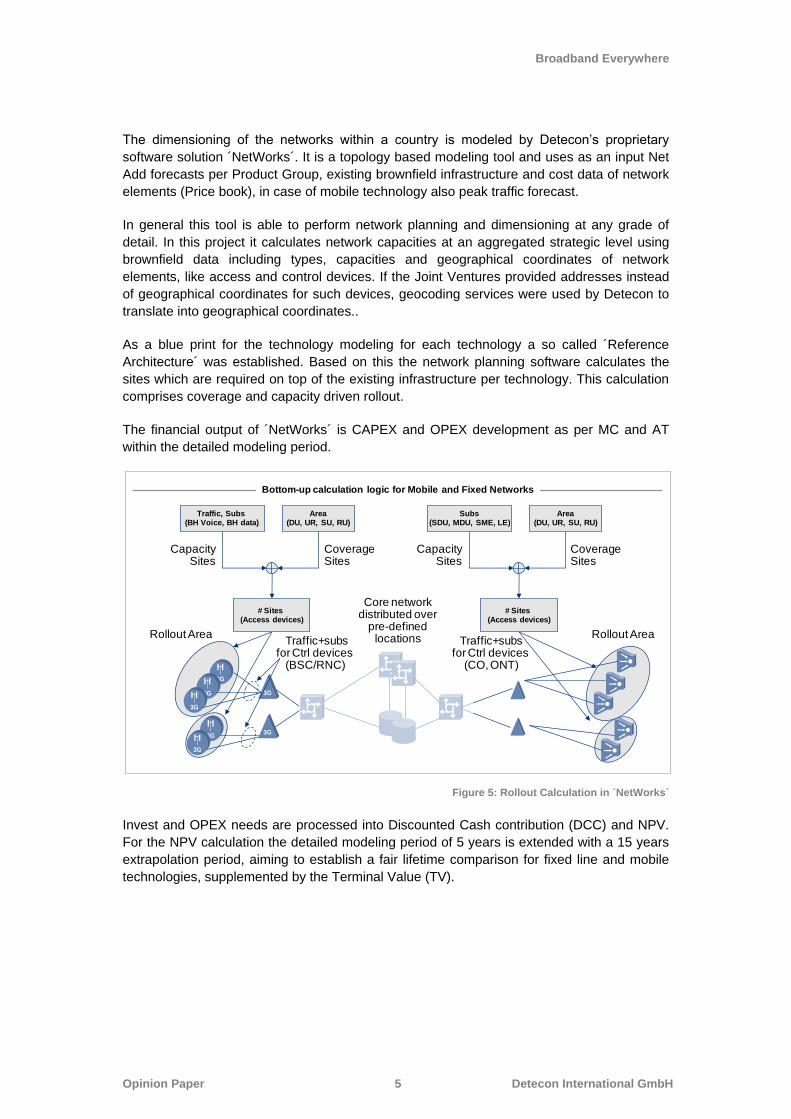
The dimensioning of the networks within a country is modeled by Detecon‟s proprietary
software solution ´NetWorks´. It is a topology based modeling tool and uses as an input Net
Add forecasts per Product Group, existing brownfield infrastructure and cost data of network
elements (Price book), in case of mobile technology also peak traffic forecast.
In general this tool is able to perform network planning and dimensioning at any grade of
detail. In this project it calculates network capacities at an aggregated strategic level using
brownfield data including types, capacities and geographical coordinates of network
elements, like access and control devices. If the Joint Ventures provided addresses instead
of geographical coordinates for such devices, geocoding services were used by Detecon to
translate into geographical coordinates..
As a blue print for the technology modeling for each technology a so called ´Reference
Architecture´ was established. Based on this the network planning software calculates the
sites which are required on top of the existing infrastructure per technology. This calculation
comprises coverage and capacity driven rollout.
The financial output of ´NetWorks´ is CAPEX and OPEX development as per MC and AT
within the detailed modeling period.
Figure 5: Rollout Calculation in ´NetWorks´
Invest and OPEX needs are processed into Discounted Cash contribution (DCC) and NPV.
For the NPV calculation the detailed modeling period of 5 years is extended with a 15 years
extrapolation period, aiming to establish a fair lifetime comparison for fixed line and mobile
technologies, supplemented by the Terminal Value (TV).
Bottom-up calculation logic for Mobile and Fixed Networks
Rollout Area
Traffic, Subs (BH Voice, BH data)
Area(DU, UR, SU, RU)
3G
3G
3G
3G
3G
3G
3G
Subs(SDU, MDU, SME, LE)
Area(DU, UR, SU, RU)
# Sites (Access devices)
CapacitySites
CoverageSites
CapacitySites
CoverageSites
Rollout Area
# Sites (Access devices)
Core network distributed over
pre-defined locations Traffic+subs
for Ctrl devices (CO, ONT)
Traffic+subsfor Ctrl devices
(BSC/RNC)
Broadband Everywhere
Opinion Paper 6 Detecon International GmbH
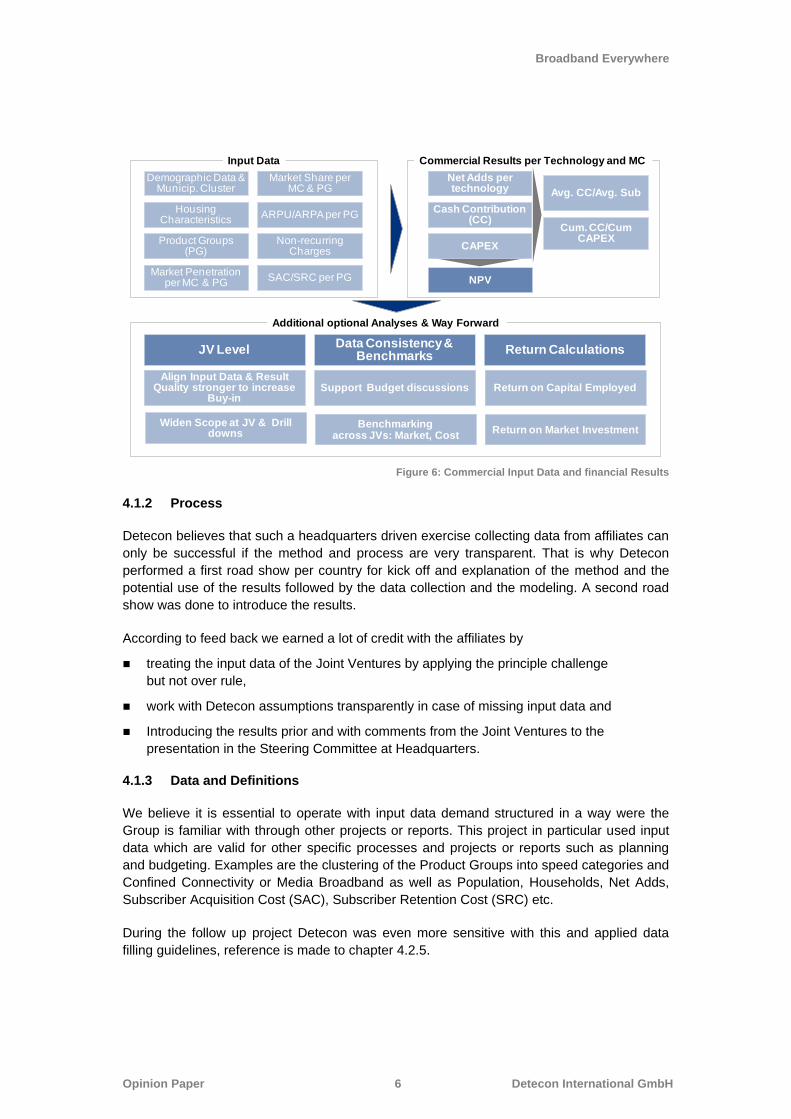
Figure 6: Commercial Input Data and financial Results
4.1.2 Process
Detecon believes that such a headquarters driven exercise collecting data from affiliates can
only be successful if the method and process are very transparent. That is why Detecon
performed a first road show per country for kick off and explanation of the method and the
potential use of the results followed by the data collection and the modeling. A second road
show was done to introduce the results.
According to feed back we earned a lot of credit with the affiliates by
treating the input data of the Joint Ventures by applying the principle challenge
but not over rule,
work with Detecon assumptions transparently in case of missing input data and
Introducing the results prior and with comments from the Joint Ventures to the
presentation in the Steering Committee at Headquarters.
4.1.3 Data and Definitions
We believe it is essential to operate with input data demand structured in a way were the
Group is familiar with through other projects or reports. This project in particular used input
data which are valid for other specific processes and projects or reports such as planning
and budgeting. Examples are the clustering of the Product Groups into speed categories and
Confined Connectivity or Media Broadband as well as Population, Households, Net Adds,
Subscriber Acquisition Cost (SAC), Subscriber Retention Cost (SRC) etc.
During the follow up project Detecon was even more sensitive with this and applied data
filling guidelines, reference is made to chapter 4.2.5.
Input Data Commercial Results per Technology and MC
Additional optional Analyses & Way Forward
Demographic Data & Municip. Cluster
Housing Characteristics
Product Groups (PG)
Market Penetration per MC & PG
Market Share per MC & PG
ARPU/ARPA per PG
Non-recurring Charges
SAC/SRC per PG
Net Adds per technology
Cash Contribution (CC)
CAPEX
Avg. CC/Avg. Sub
Cum. CC/Cum CAPEX
NPV
Align Input Data & Result Quality stronger to increase
Buy-inSupport Budget discussions
Benchmarkingacross JVs: Market, Cost
JV Level
Return on Market Investment
Return on Capital Employed
Widen Scope at JV & Drill downs
Data Consistency & Benchmarks
Return Calculations
Broadband Everywhere
Opinion Paper 7 Detecon International GmbH
4.1.4 How to deal with Black Box Perception and achieve buy in?
We should not be silent about the fact that despite a lot of efforts made to open up the
method and process the perception of a Black Box could not be eliminated totally. Especially
the mechanics within the planning software ´NetWorks´ by nature cannot be made available
to a broad audience. First as a result of a two decade development it is simply too complex,
second it belongs to the intellectual property of Detecon.
To meet remaining concerns we believe there is one promising route.
Be honest with the method, the data and with the communication towards
Headquarters and Joint Ventures especially when it comes to strength and
weaknesses of the model and the potential utilization of the results.
Address what can and should be done with the results and what not. Be aware
that any model only can serve as a proxy of the reality. In our case it means
that calculated investment cannot substitute detailed rollout planning but rather
establish a detailed country technology and investment pattern.
Perform ´NetWorks´ workshops with the client with detailed demonstrations of
model mechanics.
Take up improvement proposals and try to implement them in the coming
release.
In a subsequent phase of the project we established another effective method to increase
buy in by performing sensitivity analysis, reference is made to chapter 4.2.6.2.
4.1.5 Results
The results prepared numeric as well as graphical reflect the necessary network rollout by
showing existing and new network elements and NPV per technology and MC and AT on a
country level. This provides sufficient granularity for detailed decisions.
On cross country level an NPV ranking per technology and MC and AT was established,
showing were the highest NPV can be realized with which technology.
4.1.5.1 Network Dimensioning/Elements
Based on the brownfield data and the demand driven planning ´NetWorks´ plots a picture of
technology rollout per country by showing existing and newly to establish nodes for all
technologies considered.
Broadband Everywhere
Opinion Paper 8 Detecon International GmbH
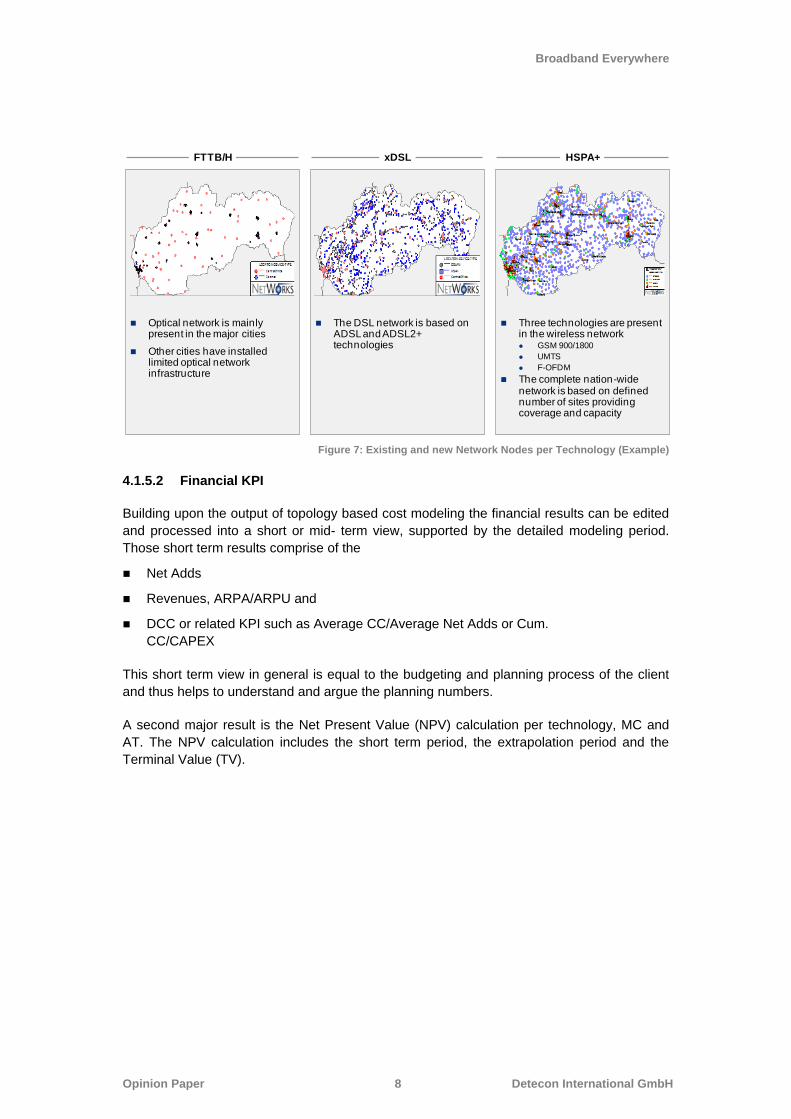
Figure 7: Existing and new Network Nodes per Technology (Example)
4.1.5.2 Financial KPI
Building upon the output of topology based cost modeling the financial results can be edited
and processed into a short or mid- term view, supported by the detailed modeling period.
Those short term results comprise of the
Net Adds
Revenues, ARPA/ARPU and
DCC or related KPI such as Average CC/Average Net Adds or Cum.
CC/CAPEX
This short term view in general is equal to the budgeting and planning process of the client
and thus helps to understand and argue the planning numbers.
A second major result is the Net Present Value (NPV) calculation per technology, MC and
AT. The NPV calculation includes the short term period, the extrapolation period and the
Terminal Value (TV).
Optical network is mainly present in the major cities
Other cities have installed limited optical network infrastructure
FTTB/H
The DSL network is based on ADSL and ADSL2+ technologies
xDSL
Three technologies are present in the wireless network GSM 900/1800
UMTS
F-OFDM
The complete nation-wide network is based on defined number of sites providing coverage and capacity
HSPA+
Broadband Everywhere
Opinion Paper 9 Detecon International GmbH
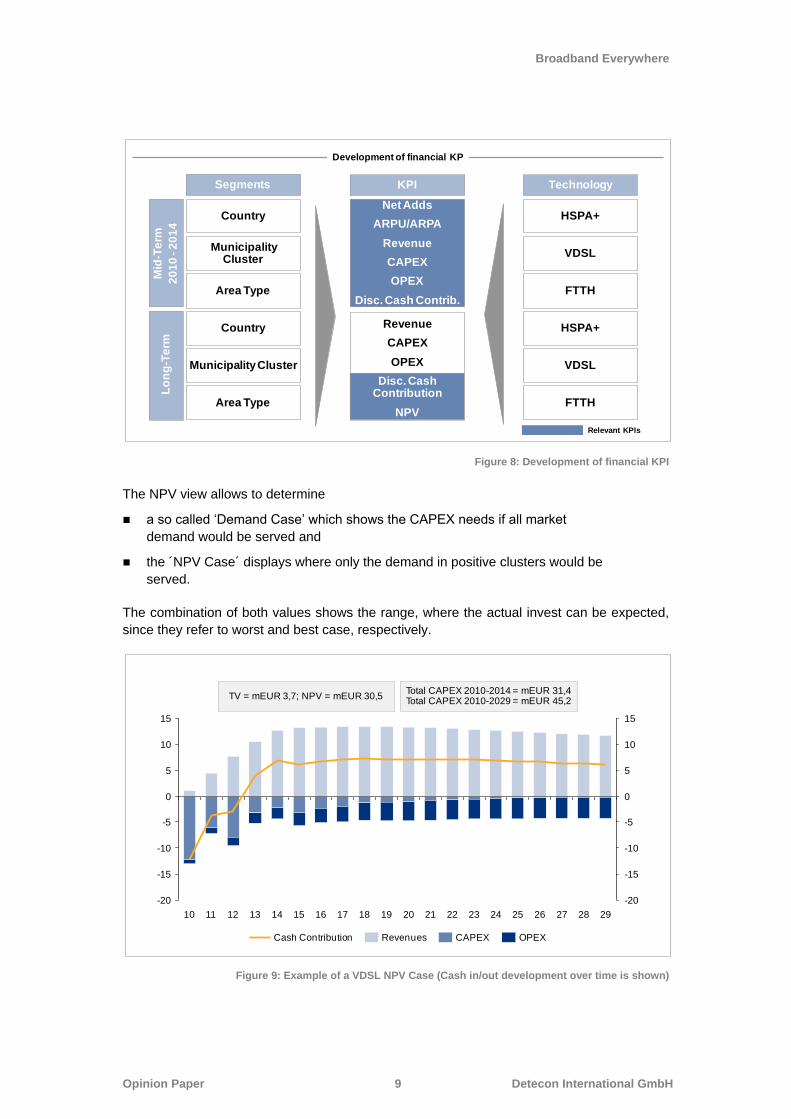
Figure 8: Development of financial KPI
The NPV view allows to determine
a so called „Demand Case‟ which shows the CAPEX needs if all market
demand would be served and
the ´NPV Case´ displays where only the demand in positive clusters would be
served.
The combination of both values shows the range, where the actual invest can be expected,
since they refer to worst and best case, respectively.
Figure 9: Example of a VDSL NPV Case (Cash in/out development over time is shown)
Development of financial KPM
id-T
erm
20
10
-2
01
4
Country
KPI
Net Adds
ARPU/ARPA
Revenue
CAPEX
OPEX
Disc. Cash Contrib.
Technology
HSPA+
Municipality Cluster
VDSL
Area Type FTTH
Lo
ng
-Te
rm
Country HSPA+
Municipality Cluster VDSL
Area Type FTTH
Segments
Revenue
CAPEX
OPEX
Disc. Cash Contribution
NPV
Relevant KPIs
10
5
0
-5
-10
-15
-20
15
10
5
0
-5
-10
-15
-20
2928272625
15
242322212019181716151413121110
CAPEXRevenuesCash Contribution OPEX
Total CAPEX 2010-2014 = mEUR 31,4Total CAPEX 2010-2029 = mEUR 45,2
TV = mEUR 3,7; NPV = mEUR 30,5
Broadband Everywhere
Opinion Paper 10 Detecon International GmbH
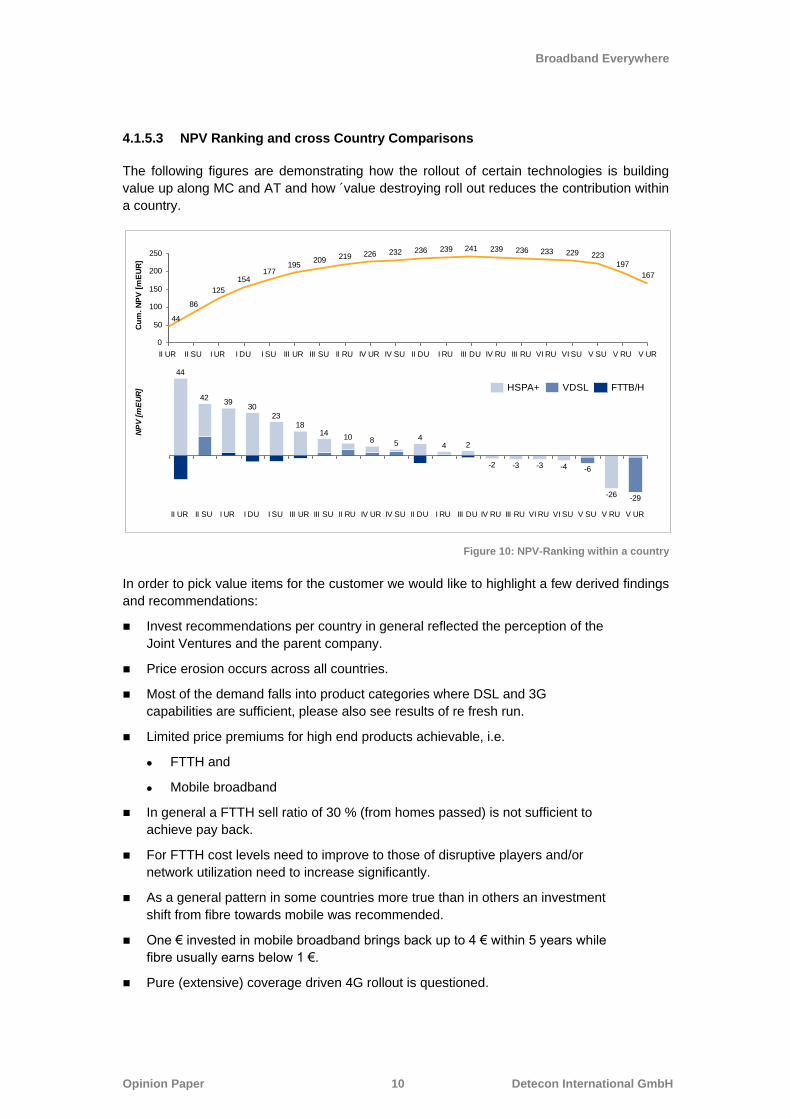
4.1.5.3 NPV Ranking and cross Country Comparisons
The following figures are demonstrating how the rollout of certain technologies is building
value up along MC and AT and how ´value destroying roll out reduces the contribution within
a country.
Figure 10: NPV-Ranking within a country
In order to pick value items for the customer we would like to highlight a few derived findings
and recommendations:
Invest recommendations per country in general reflected the perception of the
Joint Ventures and the parent company.
Price erosion occurs across all countries.
Most of the demand falls into product categories where DSL and 3G
capabilities are sufficient, please also see results of re fresh run.
Limited price premiums for high end products achievable, i.e.
FTTH and
Mobile broadband
In general a FTTH sell ratio of 30 % (from homes passed) is not sufficient to
achieve pay back.
For FTTH cost levels need to improve to those of disruptive players and/or
network utilization need to increase significantly.
As a general pattern in some countries more true than in others an investment
shift from fibre towards mobile was recommended.
One € invested in mobile broadband brings back up to 4 € within 5 years while
fibre usually earns below 1 €.
Pure (extensive) coverage driven 4G rollout is questioned.
V UR
-29
V RU
-26
V SU
-6
VI SU
-4
VI RU
-3
III RU
-3
IV RU
-2
III DU
2
I RU
4
II DU
4
IV SU
5
IV UR
8
II RU
10
III SU
14
III UR
18
I SU
23
I DU
30
I UR
39
II SU
42
II UR
44
200
150
100
50
250
0
V UR
167
V RU
197
V SU
223
VI SU
229
VI RU
233
III RU
236
IV RU
239
III DU
241
I RU
239
II DU
236
IV SU
232
IV UR
226
II RU
219
III SU
209
III UR
195
I SU
177
I DU
154
I UR
125
II SU
86
II UR
44
FTTB/HVDSLHSPA+
Cu
m. N
PV
[m
EU
R]
NP
V [m
EU
R]
Broadband Everywhere
Opinion Paper 11 Detecon International GmbH
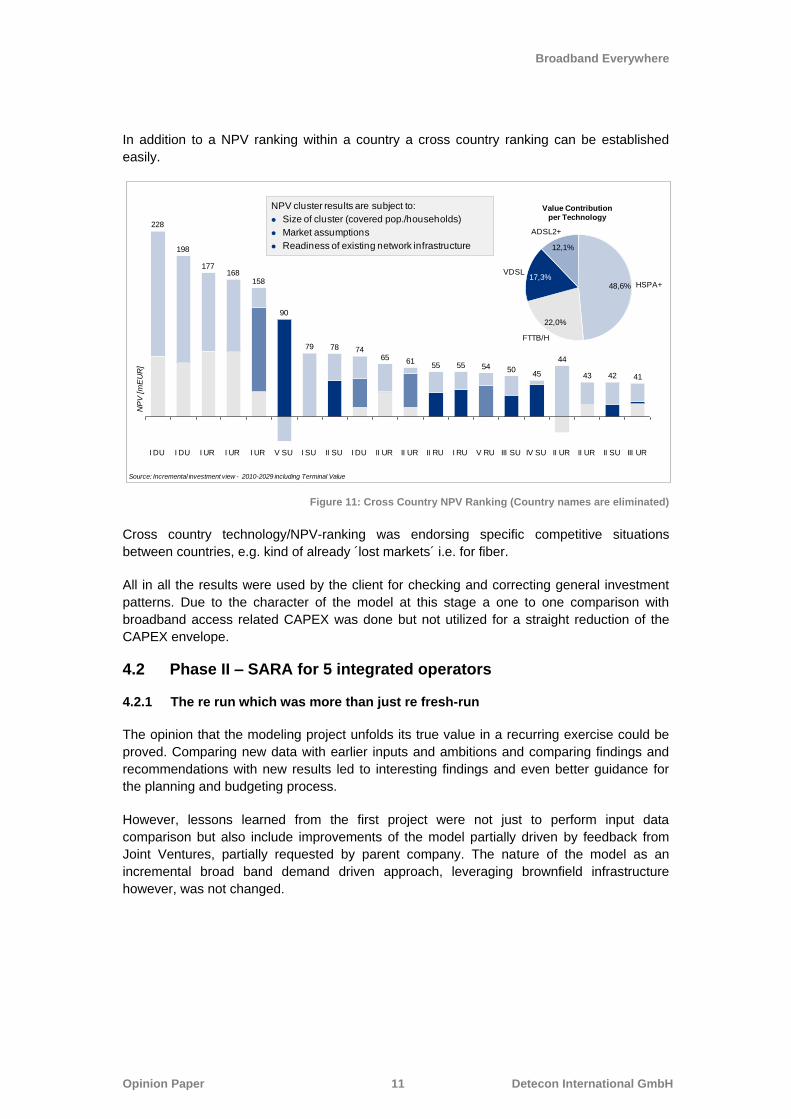
In addition to a NPV ranking within a country a cross country ranking can be established
easily.
Figure 11: Cross Country NPV Ranking (Country names are eliminated)
Cross country technology/NPV-ranking was endorsing specific competitive situations
between countries, e.g. kind of already ´lost markets´ i.e. for fiber.
All in all the results were used by the client for checking and correcting general investment
patterns. Due to the character of the model at this stage a one to one comparison with
broadband access related CAPEX was done but not utilized for a straight reduction of the
CAPEX envelope.
4.2 Phase II – SARA for 5 integrated operators
4.2.1 The re run which was more than just re fresh-run
The opinion that the modeling project unfolds its true value in a recurring exercise could be
proved. Comparing new data with earlier inputs and ambitions and comparing findings and
recommendations with new results led to interesting findings and even better guidance for
the planning and budgeting process.
However, lessons learned from the first project were not just to perform input data
comparison but also include improvements of the model partially driven by feedback from
Joint Ventures, partially requested by parent company. The nature of the model as an
incremental broad band demand driven approach, leveraging brownfield infrastructure
however, was not changed.
43
II UR
44
III UR
41
II SU
42
II URII UR
65
I DU
74
II SU
78
I SU
79
V SU
90
I UR
158
I UR
168
I UR
177
I DU
198
I DU
228
IV SU
45
III SU
50
V RU
54
I RU
55
II RU
55
II UR
61
ADSL2+
12,1%
VDSL17,3%
FTTB/H
22,0%
HSPA+48,6%
Value Contributionper Technology
NP
V [m
EU
R]
NPV cluster results are subject to:
Size of cluster (covered pop./households)
Market assumptions
Readiness of existing network infrastructure
Source: Incremental investment view - 2010-2029 including Terminal Value
Broadband Everywhere
Opinion Paper 12 Detecon International GmbH
4.2.2 Improvements
The detailed modeling period remained to be 5 years - now two years ahead. Also the
extrapolation period and the structure of Product Groups were not changed. However, some
improvements reflecting feedback and requests were implemented. The most important ones
are listed below.
Considering fix mobile substitution in the technology mapping according to
judgement of the Joint Ventures.
Inclusion of wholesale as it contributes to the efficient utilization of investments
as time-variant portion of retail-subscriber and revenue at MC-level.
Support time-variant utilization ratios homes-passed to homes-connected for
the detailed modelling period.
Time-variant Wifi off-load at MC-level of mobile traffic
Taking into account fix-network Next Generation Access Regulation by
additional capacity/investment requirements.
Inclusion of mobile spectrum one time and annual fee in addition.
TV channel license fee for IPTV services.
CATV ED3 proxy modelling ED3
Output and reports were improved also.
In order to meet the increased demand for output additional reports were created and all
results were handed over as Excel files as well. Examples
Coverage numbers
New and co-location site number 3G and LTE respectively
Existing and new Street cabinets
Homes passed, homes connected FTTH respectively (FTTC is applicable for
VDSL)
Traffic volume (TB per year or busy hour network traffic GB/s or busy hour
traffic per customer 3G and LTE respectively),
The major portion of further development however, lies in the adjusted design of the model,
i.e. ´NetWorks´.
4.2.3 Model design
Taken into account technology evolution and the new requirements the model was developed further.
Broadband Everywhere
Opinion Paper 13 Detecon International GmbH
Major steps were taken with respect to technologies considered and reference architecture
developed.
GPON/FTTH
3 DSL options
ADSL2+, DSLAM in Central Office (CO)
VDSL, SDLAM in Central Office
VDSL, DSLAM in Street Cabinet (SC), FTTC-solution
HSPA+
LTE
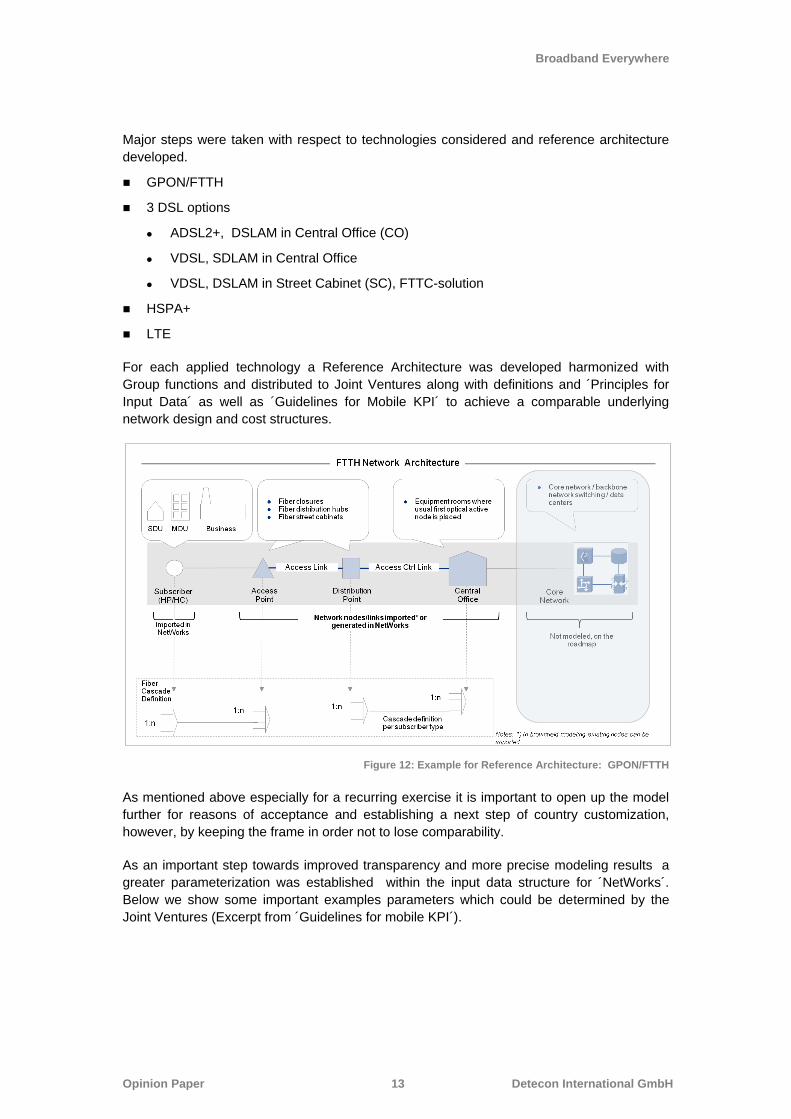
For each applied technology a Reference Architecture was developed harmonized with
Group functions and distributed to Joint Ventures along with definitions and ´Principles for
Input Data´ as well as ´Guidelines for Mobile KPI´ to achieve a comparable underlying
network design and cost structures.
Figure 12: Example for Reference Architecture: GPON/FTTH
As mentioned above especially for a recurring exercise it is important to open up the model
further for reasons of acceptance and establishing a next step of country customization,
however, by keeping the frame in order not to lose comparability.
As an important step towards improved transparency and more precise modeling results a
greater parameterization was established within the input data structure for ´NetWorks´.
Below we show some important examples parameters which could be determined by the
Joint Ventures (Excerpt from ´Guidelines for mobile KPI´).
Broadband Everywhere
Opinion Paper 14 Detecon International GmbH
Site Area and Scaling Factor
The site area and the site area scaling factors can be used to calculate a maximum area per
site so that the minimum number of sites needed to cover a certain area can be determined.
By applying specific factors for HSPA+ and LTE frequencies in most of the case the
combined value of the site area and site area scaling factor is representative of the network
being modelled.
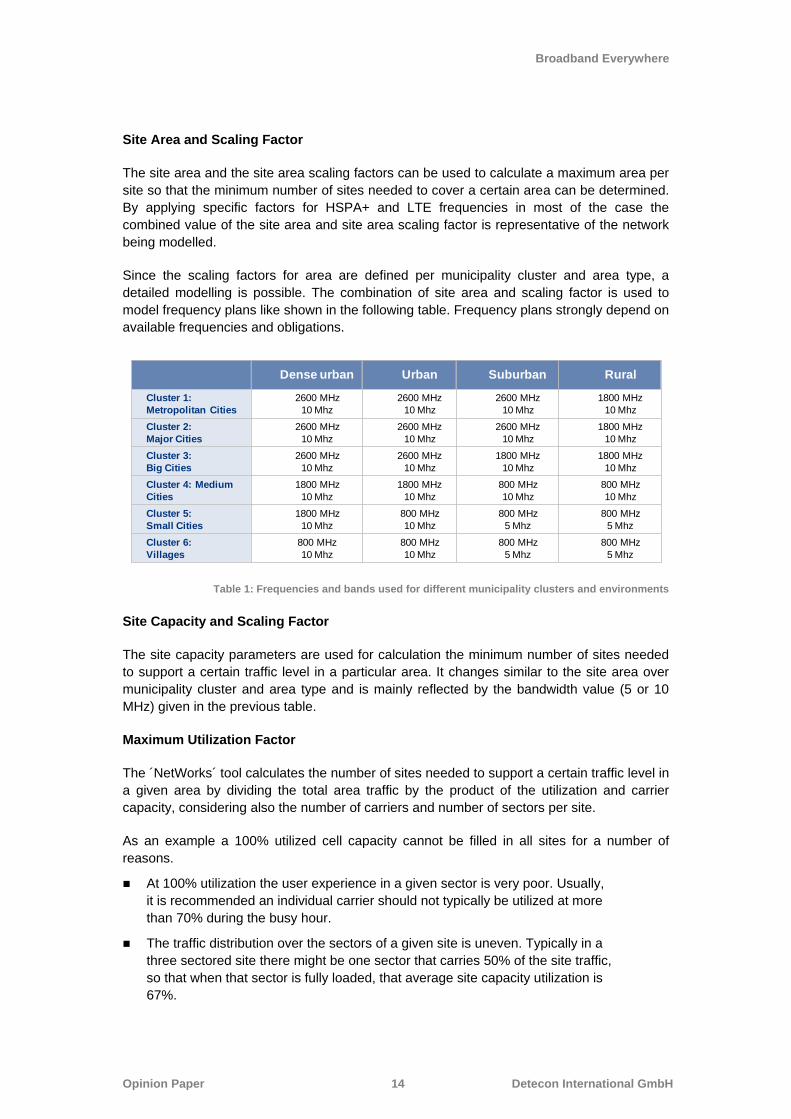
Since the scaling factors for area are defined per municipality cluster and area type, a
detailed modelling is possible. The combination of site area and scaling factor is used to
model frequency plans like shown in the following table. Frequency plans strongly depend on
available frequencies and obligations.
Table 1: Frequencies and bands used for different municipality clusters and environments
Site Capacity and Scaling Factor
The site capacity parameters are used for calculation the minimum number of sites needed
to support a certain traffic level in a particular area. It changes similar to the site area over
municipality cluster and area type and is mainly reflected by the bandwidth value (5 or 10
MHz) given in the previous table.
Maximum Utilization Factor
The ´NetWorks´ tool calculates the number of sites needed to support a certain traffic level in
a given area by dividing the total area traffic by the product of the utilization and carrier
capacity, considering also the number of carriers and number of sectors per site.
As an example a 100% utilized cell capacity cannot be filled in all sites for a number of
reasons.
At 100% utilization the user experience in a given sector is very poor. Usually,
it is recommended an individual carrier should not typically be utilized at more
than 70% during the busy hour.
The traffic distribution over the sectors of a given site is uneven. Typically in a
three sectored site there might be one sector that carries 50% of the site traffic,
so that when that sector is fully loaded, that average site capacity utilization is
67%.
Dense urban Urban Suburban Rural
Cluster 1:
Metropolitan Cities
2600 MHz
10 Mhz
2600 MHz
10 Mhz
2600 MHz
10 Mhz
1800 MHz
10 Mhz
Cluster 2:
Major Cities
2600 MHz
10 Mhz
2600 MHz
10 Mhz
2600 MHz
10 Mhz
1800 MHz
10 Mhz
Cluster 3:
Big Cities
2600 MHz
10 Mhz
2600 MHz
10 Mhz
1800 MHz
10 Mhz
1800 MHz
10 Mhz
Cluster 4: Medium
Cities
1800 MHz
10 Mhz
1800 MHz
10 Mhz
800 MHz
10 Mhz
800 MHz
10 Mhz
Cluster 5:
Small Cities
1800 MHz
10 Mhz
800 MHz
10 Mhz
800 MHz
5 Mhz
800 MHz
5 Mhz
Cluster 6:
Villages
800 MHz
10 Mhz
800 MHz
10 Mhz
800 MHz
5 Mhz
800 MHz
5 Mhz
Broadband Everywhere
Opinion Paper 15 Detecon International GmbH
The traffic distribution over the sites in a given area is uneven. Some site
maybe approaching their capacity limit, while other sites might have reached
their capacity limit recently, and cell splits or carrier expansions might have
been deployed. To account for this variability from site to site, a further
utilization factor of 75% can be considered.
Individual sectors have different busy hours to the overall network busy hour so
that the summed cell BH traffic exceeds the core network BH traffic.
The Maximum Utilization Factor should consider the combination of the above effects. As a
result an utilization value exceeding 50% was not recommended by experts. However, it is
advisable to give these numbers only as a guidance and leave it to the Joint Ventures to fill it
with their own planning assumptions. During the modeling we found utilization assumptions
ranging from 25 % to 50%.
On the NPV judgment side we believe it was important to take into account that the results of
a model always will be a proxy of the reality. Therefore we calculated the results for an
´Optimized Scenario´ instead of a sharp separation of NPV=0 per area type, by developing a
sound ratio of a negative NPV to the investment volume. A NPV to CAPEX ratio (NPV
divided by total cumulative CAPEX) of above -10 percentage was applied as hurdle for the
NPV case.
4.2.4 Process
In such a recurring project it is important to always aim for improvement of the data collection
and harmonization process as well. This time Detecon conducted one ´ramp up´ and
alignment visit per Joint Venture prior to commercial and technical input data fill. Fitting to
the central model but allowing more customization the tasks listed below were performed:
Communication of central modelling parameter to all participants ,
Find out country specific specifications and
Develop and discuss and data filling guidelines
4.2.5 Input data guidance and reconciliation
Next to the definitions in the input sheets ´Principles for Input Data´ and ´Guidelines for
mobile KPI´ were designed to give guidance for the input data. Typical examples from the
input principles are
Source of commercial input data, i.e. Forecast 2012
Comparison with Planning data 2011 and 2012
Handling of CPE expenses
Utilization definitions for fixed network architecture
More choice usually opens up for more interpretations and even misunderstandings which
only partially could be offset by definitions and guidelines provided. Therefore the input data
reconciliation, including reconciliation with relevant group functions resulted in numerous
teleconferences and required significant more time than expected.
Broadband Everywhere
Opinion Paper 16 Detecon International GmbH
4.2.6 Results
Due to the fact that the technology portfolio was more up to date, 3 DSL options were
offered, LTE technology was in scope and more modeling parameters were offered the
results improved compared to the first project significantly. The results were accepted by the
Steering Committee and the next phase was envisaged.
In a subsequent work Detecon prepared the comparison of technical and marketing input
parameters. Price information for network elements and value drivers such as ARPU/ARPA
puts the shareholder into the position to compare the effectiveness and the value of the
operations. The JVs are able to compare themselves with other operations.
In particular the following results were acknowledged by the Steering Committee:
NPV improvement throughout
Re-visited cost levels and revenue forecasts in some JVs
Re-modelling with updated inputs based on the results created transparent
way of iteration
Risk and opportunity review
The model showed exposure due to volatility, regulatory environment
(including license fee, unbundling) and operational risks
The model showed opportunities like Fixed Mobile Substitution (FMS), cost
benchmark, project profitability ranking including mobile spectrum costs and
wholesale, NPV improvement and advantages of vectoring in a strong copper
environment
CAPEX driven by business demand
Better aligned projects to maximize broadband customer reach and profitability
Improved cost levels and incremental revenue enabled more NPV positive
CAPEX
4.2.6.1 Financials
Similar to the first project the financial results can be edited and processed into a short or
mid- term view by technology applied, supported by the detailed modeling period. Those
short term results comprise of the
Net Adds
Revenues, ARPA/ARPU and
DCC or related KPI such as Average Cash Contribution (CC)/Average Net
Adds or Cum. CC/CAPEX
This view in general is equal to the budgeting and planning process of the client and thus helps to understand and argue the planning numbers. The long term view - the NPV calculation was done per technology, MC and AT. As mentioned above the deciding NPV-trigger is not zero anymore but following a ratio of a negative NPV to related revenue. As examples we refer to results of mobile technology.
Broadband Everywhere
Opinion Paper 17 Detecon International GmbH
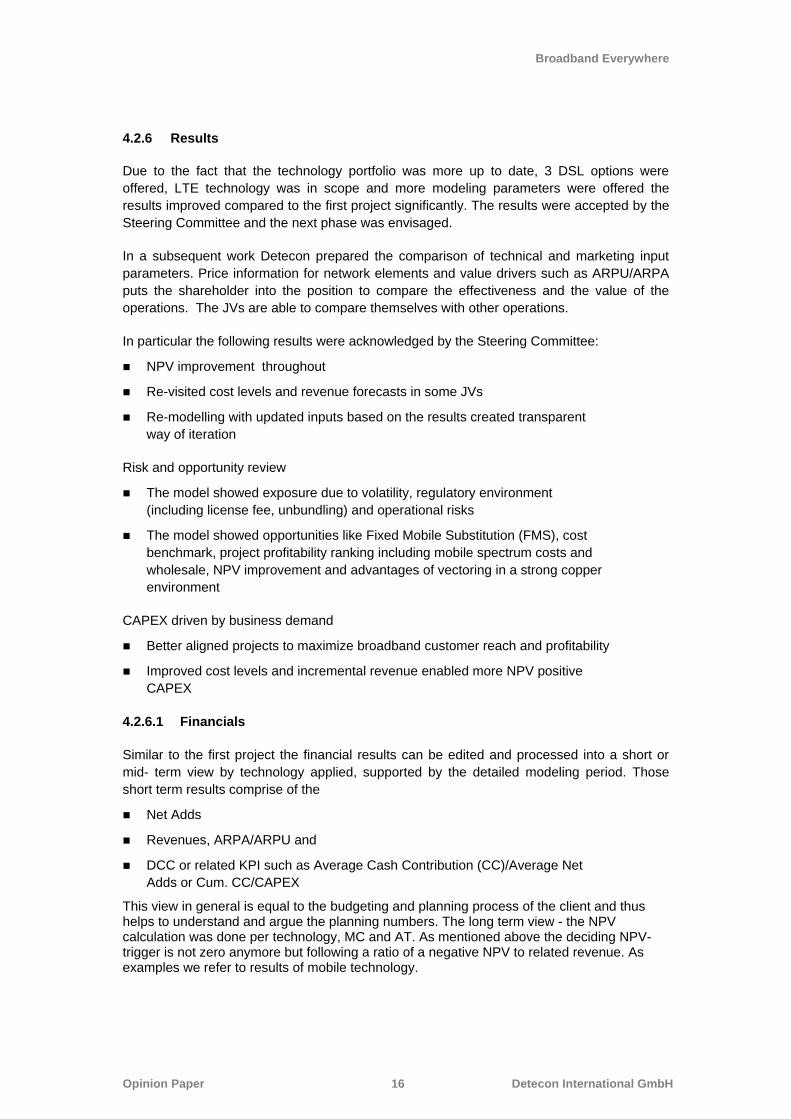
By applying investment for spectrum were able to show both characteristics, HSPA+ or LTE
CAPEX and NPV development with and without spectrum cost.
Figure 14: LTE Development including License CAPEX
Findings
Low CAPEX per net-add driven by :
Reuse of existing sites
Reasonable backhaul cost due to microwave connections
Mixed tower and rooftop solution for rural areas
Target Penetration for confined connectivity is ~85%
Low SAC-/SRC for confined connectivity ~5%
Figure 15: LTE Development excluding License CAPEX
NPV Case Optimized
1,800
1,600
1,400
1,200
1,000
800
600
400
200
0
-200
31302928272625
2,000
2423222120191817161514
-89
1312
OPEXCAPEXRevenuesCumulated Cash Contribution
All Municipality ClustersmEUR
TV
NPV
330
99
12
-’16
CAPEX (’12-’31)
299
129
Including ~77m
license CAPEX
Positive cum. cash contribution
LTE
NPV Case Optimized (excl. License costs)
2,400
2,200
2,000
1,800
1,600
1,400
1,200
1,000
800
600
400
200
0
-200
3130292827262524232221201918171615141312
OPEXCAPEXRevenuesCumulated Cash ContributionTV
NPV
470
110
12
-‟1
6
CAPEX (’12-’31)
210
39
Positive cum. cash contribution
All Municipality ClustersmEURLTE
Broadband Everywhere
Opinion Paper 18 Detecon International GmbH
The ´old truth´ applies here as well. CAPEX not spent for spectrum can be allocated for the
coverage of areas.
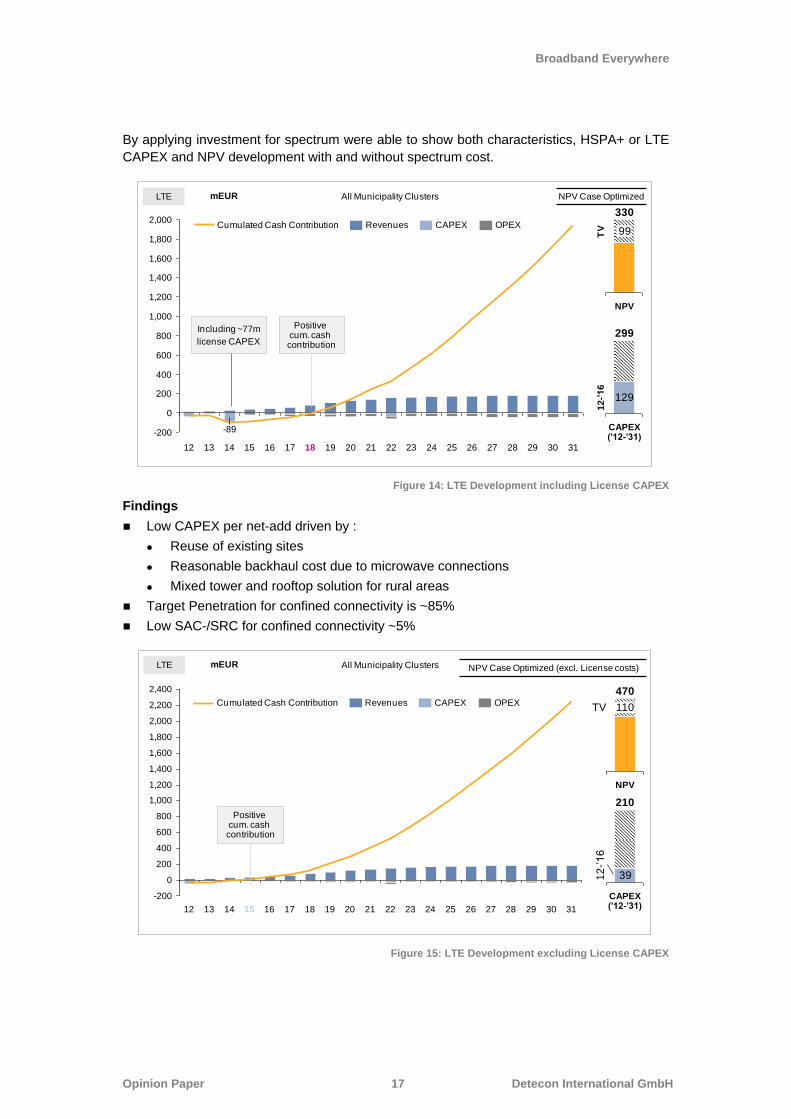
4.2.6.2 Sensitivity Analysis
In addition to country results Detecon conducted various sensitivity analysis. In the mobile
technology for example the forecast of the split of HSPA+ vs. LTE-handsets was sensitive
for the NPV-results of both technologies.
Figure 16: Sum of positive NPVs in TSD for HSPA+ and LTE for different LTE handset portion.
Findings
An aggressive shifting of confined connectivity subscribers from HSPA to LTE causes a
positive effect on LTE NPV. The 50% case shows the highest value creation, however it
ignores cannibalization of own existing (HSPA) network infrastructure investments
Supported by 2 studies (´Strategic Analytics´ and ´Infotechnics´) Detecon applied a handset
technology split for confined connectivity based on the expected speed for the migration
speed of mobile handsets 80% HSPA+ and 20% LTE in 2016.
Another sensitivity analysis demonstrates how dependent expected CAPEX spend and NPV
values are in the mobile business from the applied cell utilization.
Table 2: CAPEX Sensitivity for HSPA+ Cell Utilization
Conservative mobile KPI´s (max. utilization and low capacity scaling for UMTS900) are main
cost drivers. Applying a more aggressive KPI (50% max. utilization) reduces significantly the
cost. Therefore respective guidance from Group technology was applied in the ´Guidelines
for Mobile KPI´.
41,9123
2,884
25% LTE
63,336
4,019
50% LTE10% LTE
1,634
42,219
46.238
66.220
43.557
Sum of positive NPV LTE Sum of porsitve NPV HSPA
Scenario 2 Aggressive 50% max. utilization
Capex Opex
Cluster 1: 1.005.770 513.884
Cluster 2: 1.430.691 848.007
Cluster 3: 998.897 391.144
Cluster 4: 8.275.055 1.313.932
Cluster 5: 18.541.379 3.822.206
Cluster 6: 54.887.691 11.356.414
Total: 85.139.483 18.245.586
Scenario 1 30% and 25 %
Conservative utilization
Capex Opex
Cluster 1: 1.114.862 529.008
Cluster 2: 2.418.332 1.068.557
Cluster 3: 1.521.843 458.724
Cluster 4: .17.681.094 2.427.526
Cluster 5: 37.250.787 6.440.968
Cluster 6: 89.977.594 17.351.835
Total: 149.964.512 28.276.616

Broadband Everywhere
Opinion Paper 19 Detecon International GmbH
5 Lessons learned
5.1 Process set up
This project was initiated by financial department, but requires input from marketing and
technology. A clear definition of process and responsibilities will improve the project
performance. An earlier alignment with central marketing and technology functions will
speed up preparation of the data filling guidelines.
5.2 Alignment steps
It was proven that the opening of the modeling parameter was beneficial, however, at the
same time it became clear that this phase is essential for the success of the project.
Therefore more time must be considered for data collection and alignment.
An effective cooperation and alignment with marketing and technology departments supports
to save the data collection time and increase the input quality, while avoiding additional
discussions or reruns after the result presentation.
5.3 Data filling Guidelines
To avoid the misunderstanding with the input data template, it is proven that a guideline for
data filling is very helpful. It is even better if the head-quarter (shareholder) prepares a
centralized guideline especially for technical parameters by giving space for parameters
reflecting the local situation.
Broadband Everywhere
Opinion Paper 20 Detecon International GmbH
6 Outlook
Since SARA is established as a recurring tool for investments pattern, CAPEX allocation and
efficiency in JVs operations related to broadband roll out it is important to further develop the
model and improve the data mining and modeling process mainly along the lessons learned
so far without increasing complexity too much.
In our opinion the already discussed stronger involvement of central and technology
functions of the HQ will further increase the benefits through better guidelines for critical
parameters. With respect to the clustering of the countries into 6 MCs an addition of
additional 3 Clusters for Metropolitan, Major and Big Cities with intense CATV competition
need to be checked in order to respond to specific competitive challenges on the fixed line
side.
At the marketing side in particular an improvement of the market modeling and a stronger
coupling with SARA would decrease the effort at the JV side.
At the technology side we consider it as an ideal solution if central technology group would
take ownership for the technical data filling guidelines.
Model design
Based on project feed backs some further model adjustments seem to be justified. Next to
some minor adjustments and prior to the next run a few options need to be evaluated such
as.
For polygon instead of radial planning, especially for fixed line a switch to geo
based clutter seems to be necessary to reflect density specifics of cities. If
input data can be made available for the respective countries, Detecon
considers the use of the ArcGIS tool to improve the regionalization.
Enter into a multi technology modeling per area; consider a second technology
for non profitable first technology choices.
Improve CATV modeling while shifting it from a proxy calculation towards a
´NetWorks´ modeling.
Integrated aggregation network planning, if the benefit is tangible.
Check the possibility of devise driven input on the mobile side such as new add numbers for Confined Connectivity/Smart phone penetration.
Broadband Everywhere
Opinion Paper 21 Detecon International GmbH
7 Authors
Horst Hermann, now independent telecommunications expert, used to work as Principal
with Detecon in Cologne. His background ranges from Telecommunications Strategies,
Regulatory, Finance, M&A, Post Merger Integration and Corporate Governance. Within
Detecon his main focus was acquisition and broadband access modeling. Horst Hermann
continues to stay in close contact with Detecon.
He can be reached +49 151 14805360 or [email protected]
Dr. Rong Zhao joined in Detecon International GmbH in Germany in 2008, with focus on
fixed access, transport networks and cost modeling. His expertise covers FTTx strategic
planning and optimization, migration to FTTH, fixed and mobile cost modeling, and network
rollout. He is involved in a number of projects in Europe, MENA and Asia. Since 2012, he
has been the Vice Chair of Deployment & Operations Committee by FTTH Council Europe.
He is also the member of VDE/ITG Expert Group 5.2.5 – “Access and Home Networks” in
Germany.
He can be reached +49 170 2276103 or [email protected]
Dr. Mathias Schweigel works as a managing consultant in the group Network Optimization
and Tools and joined Detecon after finishing his PhD in telecommunications in 2004. In
addition to the specification of functions and the training of users in Detecon‟s network
planning and optimization software ´NetWorks´, he supported many Detecon projects that
required the application of planning software for operational as well as strategic questions.
He can be reached at: +49 351 8734 1508 or [email protected].

Broadband Everywhere
Opinion Paper 22 Detecon International GmbH
8 The Company
We make ICT strategies work
Detecon is a consulting company which unites classic management consulting with a high
level of technology expertise.
Our company's history is proof of this: Detecon International is the product of the merger of
the management and IT consulting company Diebold, founded in 1954, and the
telecommunications consultancy Detecon, founded in 1977. Our services focus on
consulting and implementation solutions which are derived from the use of information and
communications technology (ICT). All around the globe, clients from virtually all industries
profit from our holistic know-how in questions of strategy and organizational design and in
the use of state-of-the-art technologies.
Detecon‟s know-how bundles the knowledge from the successful conclusion of management
and ICT projects in more than 160 countries. We are represented globally by subsidiaries,
affiliates, and project offices. Detecon is a subsidiary of T-Systems International, the
business customer brand of Deutsche Telekom. In our capacity as consultants, we are able
to benefit from the infrastructure of a global player spanning our planet.
Know-how and hands-on expertise
The rapid development of information and telecommunications technologies has an
increasingly significant influence on the strategies of companies as well as on the processes
within an organization. The subsequent complex adaptations affect business models and
corporate structures, not only technological applications.
Our services for ICT management encompass classic strategy and organization consulting
as well as the planning and implementation of highly complex, technological ICT
architectures and applications. We are independent of manufacturers and obligated solely to
our client's success.
Detecon International GmbH
Sternengasse 14 - 16
50676 Cologne
Phone: +49 221 9161 0
E-Mail: [email protected]
Internet: www.detecon.com


