67

Broadkill Watershed Wetland Report i
The citation for this document is:
Rogerson,A.B., M.A. Jennette, and A.M. Howard. 2013. Condition of wetlands in the
Broadkill River Watershed, Delaware. Delaware Department of Natural Resources and
Environmental Control, Watershed Assessment and Management Section, Dover, USA.
59p.
Broadkill Watershed Wetland Report ii
ACKNOWLEDGMENTS
Funding for this project was provided by EPA REMAP and Region III
Wetland Program Development Grant Assistance # CD-96312201-0, and the
Delaware Department of Natural Resources and Environmental Control. This
research and report were made possible by many who contributed their time and
expertise. Tom Kincaid and Tony Olsen with the EPA Office of Research and
Development Lab, Corvallis, Oregon provided technical support with the developing
the data frame and statistical weights. Many individuals dedicated their time and
hard work to collecting out assessment data, including seasonal hires Jocelyn
Robinson and Megan Pulver and multiple volunteers. In addition, we thank the
Environmental Lab Section for use of their biomass storage and oven space and the
DNERR St. Jones Reserve for use of their boat.

Broadkill Watershed Wetland Report iii
Contents
EXECUTIVE SUMMARY ........................................................................................................ 1
INTRODUCTION ..................................................................................................................... 4
WATERSHED OVERVIEW ..................................................................................................... 6
2.1 Geologic History ............................................................................................................... 6
2.2 Watershed Hydrogeomorphology ...................................................................................... 6
2.3 Wetlands ........................................................................................................................... 8
2.4 Land Use Changes and Wetland Issues ........................................................................... 9
METHODS ...............................................................................................................................13
3.1 Site Selection .................................................................................................................. 13
3.2 Changes in Wetland Acreage .......................................................................................... 13
3.3 Data Collection ............................................................................................................... 14
3.3.1. Assessing Tidal Wetlands ....................................................................................... 14
3.3.1.a Rapid Sampling of Tidal Wetlands ...................................................................... 14
3.3.1.b Intensive Vegetative Biomass Sampling in Tidal Wetlands ............................... 17
3.3.2 Assessing Nontidal Wetlands .................................................................................. 18
3.3.2.a Rapid Sampling in Nontidal Wetlands ................................................................ 18
3.3.2.b Comprehensive Sampling in Nontidal Wetlands ................................................. 20
3.4 Presenting Wetland Condition ....................................................................................... 20
RESULTS ................................................................................................................................23
4.1 Changes in Wetland Acreage .......................................................................................... 23
4.2 Landowner Contact and Site Access .............................................................................. 24
4.3 Wetland Condition ......................................................................................................... 25
4.3.1 Tidal Wetland Condition ............................................................................................ 25
4.3.1.a. Intensive Biomass Data ....................................................................................... 28

Broadkill Watershed Wetland Report iv
4.3.2 Nontidal Wetland Condition ....................................................................................... 29
4.3.2.a Flats ...................................................................................................................... 29
4.3.2.b Riverine ................................................................................................................. 31
4.3.2.c Depressions ............................................................................................................ 33
4.4 Overall Condition and Watershed Comparison ............................................................. 34
MANAGEMENT RECOMMENDATIONS ............................................................................. 35
LITERATURE CITED .............................................................................................................38
APPENDIX A: Qualitative Disturbance Rating (QDR) Category Descriptions .....................41
APPENDIX B: Nontidal Rapid Assessment Stressor Codes and Definitions ........................42
APPENDIX C: Nontidal Rapid Assessment IWC Stressors and Weights .............................44
APPENDIX D: Tidal Wetland Raw Data and Scored Metrics from MidTRAM for Broadkill
River Sites ...............................................................................................................................46
APPENDIX E: Vegetative Biomass Data for Broadkill River Tidal Sites 2010 ....................50
APPENDIX F: Nontidal Flat Wetland Rapid Assessment Stressors for Sites in the Broadkill
River watershed in 2010 ..........................................................................................................51
APPENDIX G: Nontidal Riverine Wetland Rapid Assessment Stressors for Sites in the
Broadkill River watershed in 2010 .........................................................................................54
APPENDIX H: Nontidal Riverine Comprehensive Metric and Variable Data from
Murderkill River watershed sites ...........................................................................................57
APPENDIX I: Nontidal Depression Wetland Rapid Assessment Stressors for Sites in the
Broadkill River watershed in 2010 .........................................................................................58
Broadkill Watershed Wetland Report v
Maps
Map 1. Location of the Broadkill River watershed and the major basins of Delaware. ......... 6
Map 2. Key habitats and public lands in the Broadkill River watershed, Delaware ............. 7
Map 3. Distribution of tidal and nontidal wetland across the Broadkill River watershed,
Delaware based on 2007 mapping............................................................................................ 8
Map 4. Land cover for the Broadkill River watershed in 1997 and 2007 based on NLCD land
use categories. ..........................................................................................................................10
Map 5. Distribution of impoundments, natural waterways, and artificial or altered
waterways in the Broadkill River watershed. ........................................................................11
Map 6. Past and present wetland coverage in the Broadkill River watershed, Delaware. ...23
Tables
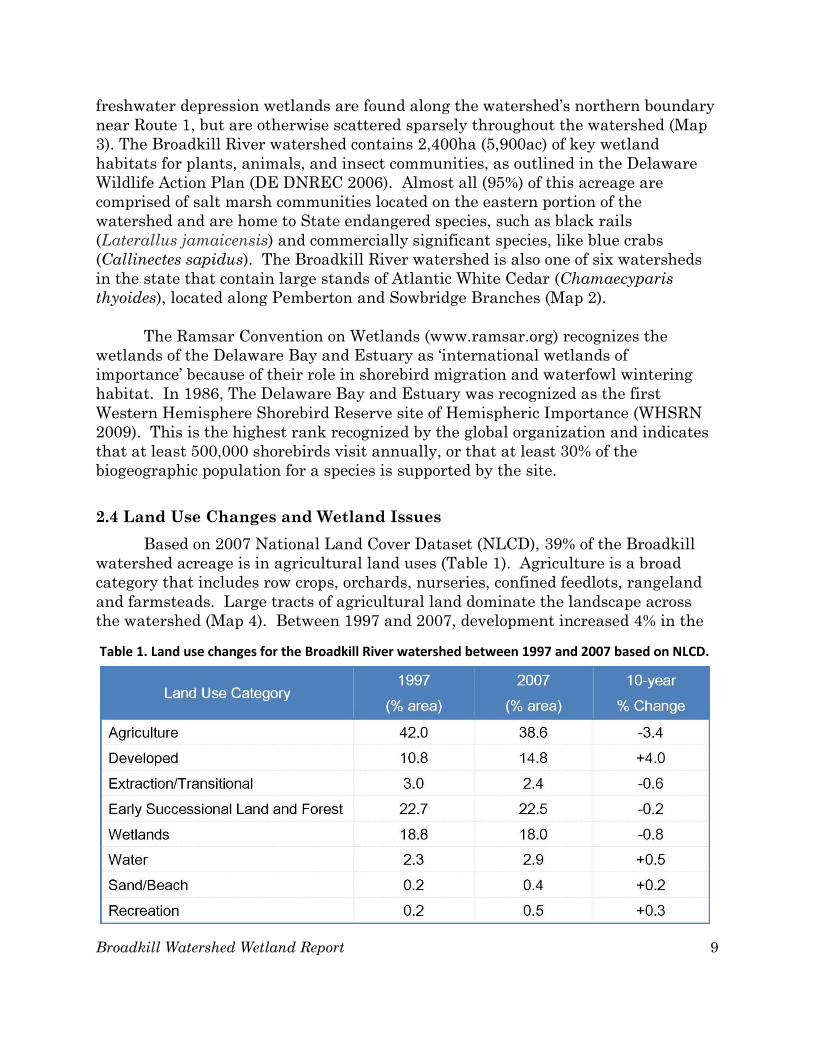
Table 1. Land use changes for the Broadkill River watershed between 1997 and 2007 based
on NLCD. .................................................................................................................................. 9
Table 2. 14 metrics comprising the MidAtlantic Tidal Rapid Assessment Method. .............15
Table 3. Stressors evaluated using the Delaware Rapid Assessment Procedure. .................19
Table 4. Condition categories and breakpoint values for tidal, and nontidal flats and
riverine wetlands in the Broadkill River watershed as determined by wetland condition
scores. .......................................................................................................................................21
Table 5. Correlation values between MidTRAM condition scores and biomass values for 29
tidal wetland sites in the Broadkill River, St. Jones River, Murderkill River, and Inland
Bays watersheds, Delaware. ...................................................................................................28

Broadkill Watershed Wetland Report vi
Figures
Figure 1. Wetland proportions and area by wetland type for the Broadkill River watershed,
Delaware.. ................................................................................................................................. 8
Figure 2. Assessment area and subplots used to collect data for the MidAtlantic Tidal
Rapid Assessment Method. .....................................................................................................14
Figure 3. Assessment area and buffer used to collect data for nontidal rapid and
comprehensive assessments. ...................................................................................................19
Figure 4. An example CDF showing wetland condition. The red line is the population
estimate. The orange and green dashed lines show the breakpoints between condition
categories. ................................................................................................................................22
Figure 5. Ownership of sampled wetland sites in the Broadkill River watershed, Delaware
in 2010. ....................................................................................................................................25
Figure 6. Success rates for privately owned wetland sites in the Broadkill River watershed
Delaware in 2010 by wetland subclass. ..................................................................................25
Figure 7. The Cumulative Distribution Function for tidal wetland condition based on the
MidTRAM in the Broadkill River watershed, Delaware in 2010. The orange and green
dashed lines designate the condition category breakpoints. The gray dashed lines represent
the 95% confidence intervals. ..................................................................................................26
Figure 8. Tidal wetland condition proportions (left) and stressor prevalence (right) for the
Broadkill River watershed, Delaware in 2010. .......................................................................27
Figure 9. Mean attribute group values and standard deviations for tidal wetlands in the
Broadkill River watershed, Delaware. ....................................................................................28
Figure 10. Relationship between below-ground dead biomass and soil bearing capacity in
Broadkill River, St. Jones River, Murderkill River, and Inland Bays watersheds, Delaware.
.................................................................................................................................................29
Figure 11. Cumulative Distribution Function for nontidal flat wetlands in the Broadkill
River watershed, Delaware in 2010. The orange and green dashed lines signify condition
category breakpoints dividing severely, moderately and minimally stressed portions of the
flats wetland population. The gray dashed lines represent the 95% confidence intervals. ...30
Figure 12. Condition proportions (left) and stressor occurrence (right) for the flat wetlands
population in the Broadkill River watershed, Delaware in 2010. ..........................................31

Broadkill Watershed Wetland Report vii
Figure 13. Cumulative Distribution Function for nontidal riverine wetlands in the
Broadkill River watershed, Delaware in 2010. The orange and green dashed lines signify
the condition category breakpoints dividing severely, moderately and minimally stressed
portions of the riverine wetland population. The gray dashed lines represent the 95%
confidence intervals. ................................................................................................................32
Figure 14. Condition proportions (left) and stressor occurrence (right) for riverine wetlands
in the Broadkill River watershed, Delaware in 2010. ............................................................33
Figure 15. Combined condition of tidal, flat, riverine and depression wetlands in the
Broadkill River watershed, Delaware in 2010 and its comparison to wetland condition of the
St. Jones River, Murderkill River, and Inland Bays watersheds, Delaware in 2005-2009,
based on the DERAP and MidTRAM. .....................................................................................34
Broadkill Watershed Wetland Report 1
EXECUTIVE SUMMARY
The Delaware Department of Natural Resources and Environmental Control
(DE DNREC) assessed the status and condition of wetlands in the Broadkill River
watershed in 2010. The goal of this project was to determine the condition of both
tidal and nontidal wetlands throughout the Watershed, changes in wetland acreage,
and identify prevalent wetland stressors. We will use wetland condition, stressor
information, and watershed wide trends to guide and improve future protection and
restoration activities, education, and effective planning to ensure the conservation
of Delaware’s wetland resources.
Located in Sussex County, Delaware, the Broadkill watershed encompasses
27,500ha (68,500ac) within the Delaware Bay and Estuary Basin. The Broadkill
River runs 40km (25mi) to meet the Delaware Bay at the Roosevelt Inlet. Twenty
percent of the watershed is covered in wetlands. Flat wetlands, usually forested,
form the headwaters of the Broadkill River in the western portion of the watershed.
Riverine wetlands follow tributaries and streams throughout the central portion of
the watershed, and expansive brackish to tidal wetlands run along the Broadkill
River until it reaches the Delaware Bay. Pockets of depressions, including rare
coastal plain ponds, are scattered throughout the watershed.
To assess the condition of wetlands and identify the prominent stressors
affecting wetland health, we applied a rapid assessment method to random sites
across the watershed in nontidal flat, riverine, and depressions, and in tidal
wetlands. Sites were located on both private and public lands and selected utilizing
a probabilistic sampling design developed by the EPA Ecological Monitoring and
Assessment Program (EMAP) that allowed us to extrapolate sample results to
represent the entire wetland population in the watershed.
We also evaluated changes in wetland acreage for major wetland subclasses
by comparing historic wetland acreage based on hydric soils to the 1992 and 2007
state wetland inventories. Our comparison indicated 11% (2000ac) of the wetland
acreage originally in the Broadkill River watershed at the time of settlement was
lost by 1992. Between 1992 and 2007 the watershed lost 75ac of palustrine
wetlands to development and agriculture. Concurrently there was a 170ac gain in
palustrine wetlands in the Broadkill River watershed, almost exclusively as
stormwater ponds. The loss of nontidal wetlands has been the greatest overall, due
largely to conversion to agriculture. Tidal wetland loss has historically occurred
due to conversion to open water and coastal development in Prime Hook and
Broadkill Beaches.
Broadkill Watershed Wetland Report 2
We completed rapid condition assessments on 32 flats, 30 riverine, 3
depressions, and 29 estuarine tidal wetland sites. Each assessment evaluated
indicators of condition and wetland stressors related to plant community, hydrology
and wetland buffers. We also collected more comprehensive data from a subsample
of sites, including detailed vegetation measurements, soil characterizations, and
quantification of vegetative biomass.
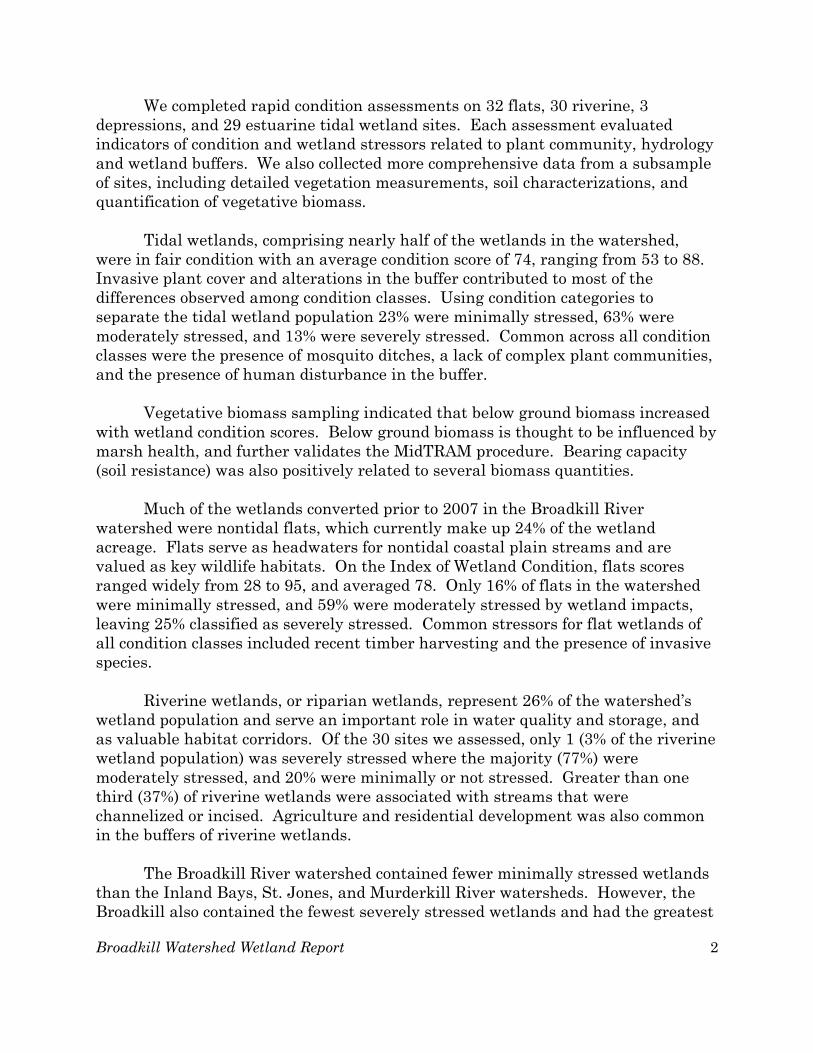
Tidal wetlands, comprising nearly half of the wetlands in the watershed,
were in fair condition with an average condition score of 74, ranging from 53 to 88.
Invasive plant cover and alterations in the buffer contributed to most of the
differences observed among condition classes. Using condition categories to
separate the tidal wetland population 23% were minimally stressed, 63% were
moderately stressed, and 13% were severely stressed. Common across all condition
classes were the presence of mosquito ditches, a lack of complex plant communities,
and the presence of human disturbance in the buffer.
Vegetative biomass sampling indicated that below ground biomass increased
with wetland condition scores. Below ground biomass is thought to be influenced by
marsh health, and further validates the MidTRAM procedure. Bearing capacity
(soil resistance) was also positively related to several biomass quantities.
Much of the wetlands converted prior to 2007 in the Broadkill River
watershed were nontidal flats, which currently make up 24% of the wetland
acreage. Flats serve as headwaters for nontidal coastal plain streams and are
valued as key wildlife habitats. On the Index of Wetland Condition, flats scores
ranged widely from 28 to 95, and averaged 78. Only 16% of flats in the watershed
were minimally stressed, and 59% were moderately stressed by wetland impacts,
leaving 25% classified as severely stressed. Common stressors for flat wetlands of
all condition classes included recent timber harvesting and the presence of invasive
species.
Riverine wetlands, or riparian wetlands, represent 26% of the watershed’s
wetland population and serve an important role in water quality and storage, and
as valuable habitat corridors. Of the 30 sites we assessed, only 1 (3% of the riverine
wetland population) was severely stressed where the majority (77%) were
moderately stressed, and 20% were minimally or not stressed. Greater than one
third (37%) of riverine wetlands were associated with streams that were
channelized or incised. Agriculture and residential development was also common
in the buffers of riverine wetlands.
The Broadkill River watershed contained fewer minimally stressed wetlands
than the Inland Bays, St. Jones, and Murderkill River watersheds. However, the
Broadkill also contained the fewest severely stressed wetlands and had the greatest

Broadkill Watershed Wetland Report 3
proportion of moderately stressed wetlands. Invasive plant species, ditching, and
disturbed buffers were common to all wetland types.
Based on the findings in this study we propose 9 management
recommendations and needs for further data. One, improve the protection of
headwater flat wetlands by protecting them from land use conversion and urging
the use of sustainable practices for forestry harvesting. Two, improve the protection
of nontidal wetlands by creating state legislation and supporting enforcement.
Three, improve nontidal wetland buffer regulations and codes to increase the
natural protection of property and improve the quality of life for Delawareans.
Four, update tidal wetland regulatory maps using 2007 wetland maps to increase
effective permitting. Five, develop incentives to maintain natural buffers for tidal
wetlands. Six, control the extent and spread of the non-native, invasive common
reed (Phragmites australis) through state- and federally-funded DNREC programs.
Seven, improve enforcement of wetland permitting and mitigation monitoring by
cooperating with other regulatory branches and incorporating wetland assessment
tools into the process. Eight, design a wetland restoration plan that includes the
Broadkill River watershed. Finally, following Delaware’s Bayshore Initiative,
secure funding to implement a wetland restoration plan for the Broadkill River
watershed to protect high condition wetlands and restore impacted wetlands to a
higher level.
Broadkill Watershed Wetland Report 4
INTRODUCTION
Wetlands in the Broadkill River watershed provide many benefits to people,
support natural processes, and provide habitats that are an integral part of the
landscape. Wetlands transition between terrestrial and aquatic habitats and are
one of the most productive ecosystems in the world. Wetlands minimize flooding
from storms, control erosion, and
improve water quality by removing
nutrient runoff and pollutants from
non-point sources. Wetlands remove
and retain sediment loads from
waters that can be elevated due to
agricultural practices, land clearing,
construction, and bank erosion before
they enter tidal and nontidal
waterways. They also have
substantial cultural and economic
value as a source of recreation (e.g.
hunting, fishing, birding) and
livelihood (e.g. fishing, crabbing, fur-
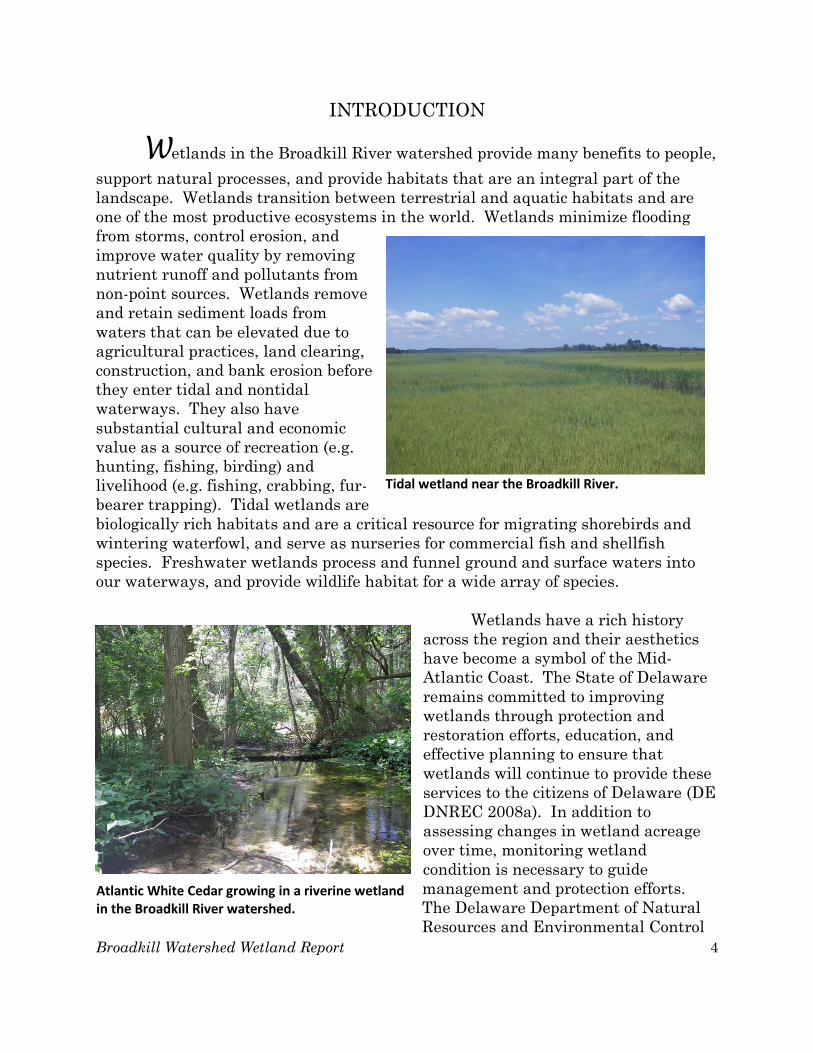
bearer trapping). Tidal wetlands are
biologically rich habitats and are a critical resource for migrating shorebirds and
wintering waterfowl, and serve as nurseries for commercial fish and shellfish
species. Freshwater wetlands process and funnel ground and surface waters into
our waterways, and provide wildlife habitat for a wide array of species.
Wetlands have a rich history
across the region and their aesthetics
have become a symbol of the Mid-
Atlantic Coast. The State of Delaware
remains committed to improving
wetlands through protection and
restoration efforts, education, and
effective planning to ensure that
wetlands will continue to provide these
services to the citizens of Delaware (DE
DNREC 2008a). In addition to
assessing changes in wetland acreage
over time, monitoring wetland
condition is necessary to guide
management and protection efforts.
The Delaware Department of Natural
Resources and Environmental Control
Atlantic White Cedar growing in a riverine wetland in the Broadkill River watershed.
Tidal wetland near the Broadkill River.
Broadkill Watershed Wetland Report 5
(DE DNREC) has developed and implemented a wetland assessment and
monitoring program to evaluate the health of wetlands. Evaluating wetland health
or condition, including the stressors that are degrading wetlands on a watershed
scale, compiles useful information that watershed organizations, state planning and
regulatory agencies, and other stakeholders can use to improve wetland restoration
and protection efforts. Protection efforts can be directed towards wetlands in good
condition, while allowing restoration efforts to target altered and degraded
wetlands to increase functions and services.
Wetland assessment information identifies
specific stressors that are commonly altering
wetlands, and can direct restoration projects
and set priorities.
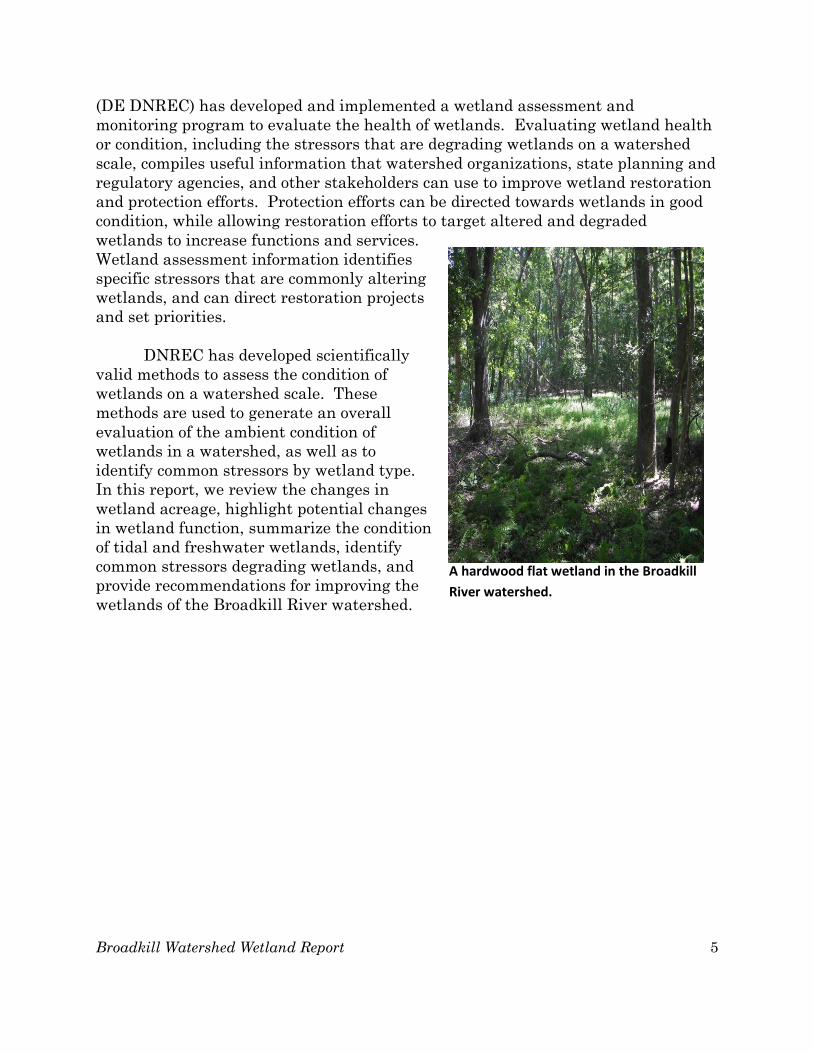
DNREC has developed scientifically
valid methods to assess the condition of
wetlands on a watershed scale. These
methods are used to generate an overall
evaluation of the ambient condition of
wetlands in a watershed, as well as to
identify common stressors by wetland type.
In this report, we review the changes in
wetland acreage, highlight potential changes
in wetland function, summarize the condition
of tidal and freshwater wetlands, identify
common stressors degrading wetlands, and
provide recommendations for improving the
wetlands of the Broadkill River watershed.
A hardwood flat wetland in the Broadkill
River watershed.

Broadkill Watershed Wetland Report 6
WATERSHED OVERVIEW
The Broadkill River watershed in
central Sussex County, Delaware is one of 16
watersheds that comprise the Delaware Bay
and Estuary Basin in the State. The Broadkill
watershed is bound by the Cedar Creek
watershed to the north. It shares its western
boundary with the Gravelly Branch and Deep
Creek watersheds in the Chesapeake Bay
Basin, and its southern boundary with the
Lewes-Rehoboth Canal, Indian River, and
Rehoboth Bay watersheds in the Inland
Bays/Atlantic Ocean Basins (Map 1). The
Broadkill River watershed covers 27,500ha
(68,500ac) and is primarily comprised of
agricultural land with urban development and
wildlife refuge. The Broadkill River
headwaters originate near the Town of Milton
and flow 40km (25mi) eastward towards
Broadkill Beach where it outlets to the
Delaware Bay through the Roosevelt Inlet.
2.1 Geologic History
The Broadkill River watershed falls
within the Atlantic Coastal Plain
Physiographic Province south of the
Appalachian Piedmont Fall Zone. The geologic formation of this area was due to a
combination of glacier activity and sediment deposition and compaction. Most of
present day Delaware was covered by ocean water before the last ice age (DE
DNREC 2005). Large amounts of sediments from the ancient Appalachians were
carried down the Delaware River, Susquehanna River and others, and settled onto
the coastal plain of Delmarva (DE DNREC 2005). These sediments compacted over
time, lowering the land surface elevation.
2.2 Watershed Hydrogeomorphology
The Broadkill River watershed contains 3 of the 4 hydrogeomorphic regions
(as defined by topography, geology, hydrogeology and soils) that are found in the
Delaware Bay and Estuary Basin: poorly-drained uplands, well-drained uplands,
Map 1. Location of the Broadkill River
watershed and the major basins of
Delaware.

Broadkill Watershed Wetland Report 7
Map 2. Key habitats and public lands in the Broadkill River watershed, Delaware.
and beaches/tidal marshes/ lagoons/barrier islands (DE DNREC 2005). Portions
along the western edge of the watershed are poorly drained uplands and contain
most of the headwater flat wetlands in the watershed. The middle of the watershed
is mostly well-drained uplands where riverine wetlands form on floodplains
adjacent to natural streams and rivers. Tidal wetlands along with beaches, lagoons
and barrier islands, are found in the eastern portion of the watershed which runs
from 5 feet above mean sea level to mean sea level as you approach the Delaware
Bay.
The Broadkill River watershed contains many key natural heritage and
wildlife habitats such as impoundments and unique wetland types. There are also
several State Natural Areas, State Wildlife Areas, and Prime Hook National
Wildlife Refuge (Prime Hook NWR; Map 2).

Broadkill Watershed Wetland Report 8
The unconfined aquifer (water table) and several deeper confined aquifers,
throughout the Delaware Bay and Estuary area, support the ground water for the
basin and are the source of potable water in the Broadkill River watershed (DE
DNREC 2005). The unconfined aquifer flows through gravelly sands and is
recharged through precipitation in areas where permeable sediments allow water to
infiltrate down to the aquifer. The water table aquifer is drawn from for
agricultural, industrial and municipal uses.
2.3 Wetlands
Wetlands comprise 20% of the land area within the watershed. Tidal
wetlands are most prevalent followed by riverine and flat wetlands (Figure 1).
Tidal wetlands associated
with salt to brackish
waters dominate the
eastern portion of the
watershed as the
Broadkill River
approaches the Delaware
Bay and are found along
the coast and upstream
past Route 1. Nontidal
freshwater wetlands, such
as riverines and flats,
dominate the western
portion of the watershed,
along the Broadkill River
and its tributaries
starting just below
Milton, and up to
headwater areas. (Map 3).
A small pocket of
Figure 1. Wetland proportions and area by wetland type for the Broadkill River watershed, Delaware.
Map 3. Distribution of tidal and nontidal wetland across the Broadkill
River watershed, Delaware based on 2007 mapping.
Broadkill Watershed Wetland Report 9
freshwater depression wetlands are found along the watershed’s northern boundary
near Route 1, but are otherwise scattered sparsely throughout the watershed (Map
3). The Broadkill River watershed contains 2,400ha (5,900ac) of key wetland
habitats for plants, animals, and insect communities, as outlined in the Delaware
Wildlife Action Plan (DE DNREC 2006). Almost all (95%) of this acreage are
comprised of salt marsh communities located on the eastern portion of the
watershed and are home to State endangered species, such as black rails
(Laterallus jamaicensis) and commercially significant species, like blue crabs
(Callinectes sapidus). The Broadkill River watershed is also one of six watersheds
in the state that contain large stands of Atlantic White Cedar (Chamaecyparis
thyoides), located along Pemberton and Sowbridge Branches (Map 2).
The Ramsar Convention on Wetlands (www.ramsar.org) recognizes the
wetlands of the Delaware Bay and Estuary as ‘international wetlands of
importance’ because of their role in shorebird migration and waterfowl wintering
habitat. In 1986, The Delaware Bay and Estuary was recognized as the first
Western Hemisphere Shorebird Reserve site of Hemispheric Importance (WHSRN
2009). This is the highest rank recognized by the global organization and indicates
that at least 500,000 shorebirds visit annually, or that at least 30% of the
biogeographic population for a species is supported by the site.
2.4 Land Use Changes and Wetland Issues
Based on 2007 National Land Cover Dataset (NLCD), 39% of the Broadkill
watershed acreage is in agricultural land uses (Table 1). Agriculture is a broad
category that includes row crops, orchards, nurseries, confined feedlots, rangeland
and farmsteads. Large tracts of agricultural land dominate the landscape across
the watershed (Map 4). Between 1997 and 2007, development increased 4% in the
Table 1. Land use changes for the Broadkill River watershed between 1997 and 2007 based on NLCD.
Broadkill Watershed Wetland Report 10
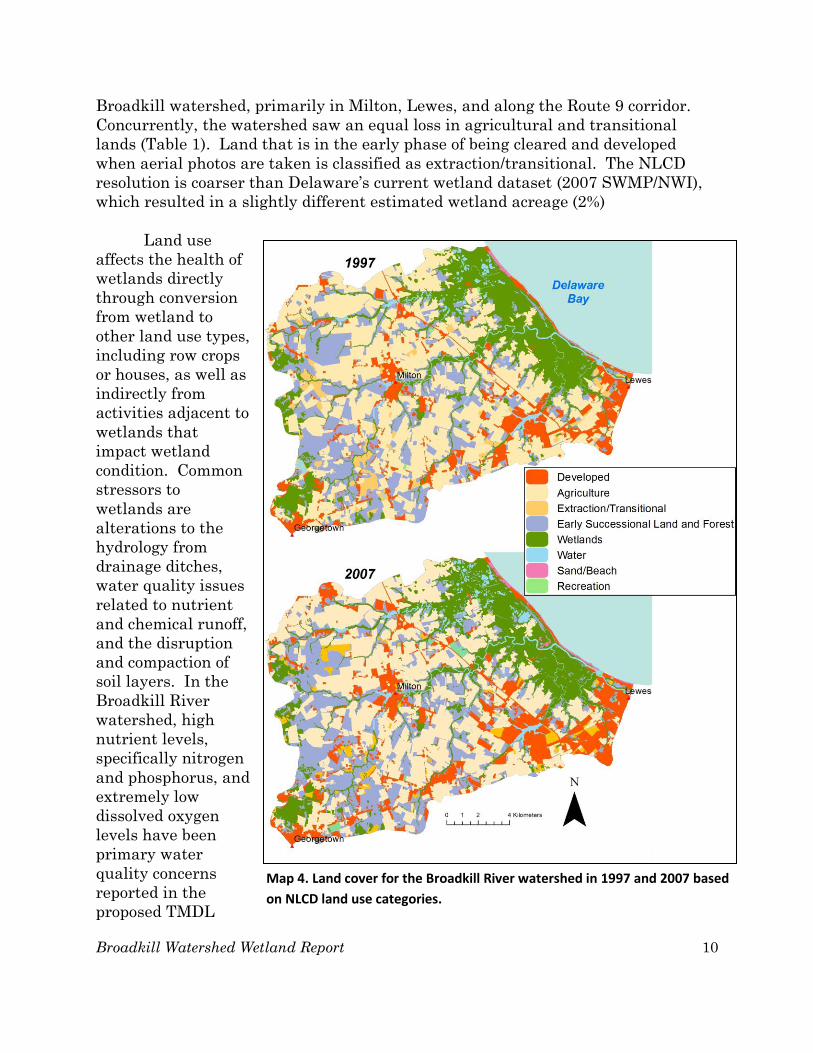
Broadkill watershed, primarily in Milton, Lewes, and along the Route 9 corridor.
Concurrently, the watershed saw an equal loss in agricultural and transitional
lands (Table 1). Land that is in the early phase of being cleared and developed
when aerial photos are taken is classified as extraction/transitional. The NLCD
resolution is coarser than Delaware’s current wetland dataset (2007 SWMP/NWI),
which resulted in a slightly different estimated wetland acreage (2%)
Land use
affects the health of
wetlands directly
through conversion
from wetland to
other land use types,
including row crops
or houses, as well as
indirectly from
activities adjacent to
wetlands that
impact wetland
condition. Common
stressors to
wetlands are
alterations to the
hydrology from
drainage ditches,
water quality issues
related to nutrient
and chemical runoff,
and the disruption
and compaction of
soil layers. In the
Broadkill River
watershed, high
nutrient levels,
specifically nitrogen
and phosphorus, and
extremely low
dissolved oxygen
levels have been
primary water
quality concerns
reported in the
proposed TMDL
Map 4. Land cover for the Broadkill River watershed in 1997 and 2007 based
on NLCD land use categories.

Broadkill Watershed Wetland Report 11
report (DE DNREC 2006). The creation of residential developments results in a
large increase in impervious surfaces causing more storm water flashes and soil
erosion, and reducing the groundwater recharge potential. Runoff pollution from
roads (e.g. oil, salt, heavy metals) as well as lawn fertilizers and pesticides also
affect water quality. TMDLs were established by DNREC in 2006 for the Broadkill
River and its tributaries to address nonpoint nutrient loading and low dissolved
oxygen levels. A DNREC pollution control strategy for the Broadkill River
watershed has been drafted and is undergoing internal review.
Extensive stream channelization and ditching for agricultural drainage and
mosquito control in both tidal and nontidal wetlands has led to changes in wetland
hydrology, the creation of deposited fill, and alterations to the natural functions of
wetlands in the watershed. (DE DNREC 2005). In addition to 135 miles of ditched
or channelized waterways across the Broadkill watershed (60% of all waterways),
the watershed contains a number of sizable impoundments created for wildlife
management and major road crossings (Map 5). Also, the spread of the invasive
common read,
Phragmites
australis,is pervasive
throughout fresh and
brackish wetlands
across the watershed.
As natural hydrology
patterns are altered
by impoundments,
dams, tidal
restrictions and fill,
Phragmites is able to
aggressively out-
compete native
species and create
large monotypic
stands that provide
poor habitat and food
resources (DE
DNREC 2005).
Sea level rise and the effects of climate change continue to be a concern for all
coastal watersheds. Assuming a modest scenario for sea level rise (0.5m), bathtub
models predict 9% of nontidal wetlands and 98% of tidal wetlands will become
inundated by the year 2100 (State of Delaware 2012). Coastal development and
Map 5. Distribution of impoundments, natural waterways, and artificial
or altered waterways in the Broadkill River watershed.
Broadkill Watershed Wetland Report 12
hardened shorelines reduce the ability of wetlands to migrate inland with
increasing sea level, restricting these systems until they convert to open water.
Shorelines without the protection of coastal wetlands are vulnerable to storm surges
and erosion. As sea level rises, salt water will intrude further upstream into
freshwater systems and disrupt natural processes. In the upcoming decades
wetlands will not only be impacted by sea level rise but also by increased storm
surges, changes in tidal amplitudes, more extreme precipitation, and altered
temperatures.
Managed wildlife habitats within Prime Hook NWR are also in flux due to
recent changes to the landscape. Established in 1963, the 10,000 acre refuge covers
much of the northeast corner of the Broadkill watershed and has three
impoundments ranging from freshwater to brackish (US FWS 2012). Overwashes
of the artificial dunes were uncommon until recent decades when more frequent and
intense coastal storms have damaged the dune line and breached impoundments
multiple times. Of particular interest are changes to the Unit II impoundment, one
managed as a shallow freshwater habitat and is used extensively by birds and other
wildlife. Saltwater from the Delaware Bay now enters the Unit II impoundment
through multiple breaches which stresses the freshwater vegetation communities
and has converted much of the impoundment to open water. Prime Hook NWR and
DNREC are currently exploring management options to meet the refuge’s goals,
outlined in its Comprehensive Conservation Plan (US FWS 2012).

Broadkill Watershed Wetland Report 13
METHODS
We assessed the condition of tidal and nontidal wetlands in the Broadkill
River Watershed in the summer of 2010. We used a probabilistic survey approach
to assess wetlands on private and public lands within the watershed. For tidal
wetlands, we used the Mid-Atlantic Tidal Rapid Assessment Method Version 3.0
(MidTRAM; Jacobs et al. 20010) and for nontidal wetlands we used the Delaware
Rapid Assessment Protocol (DERAP, Jacobs 2007) to evaluate wetland condition
and identify wetland stressors. We used comprehensive wetland data to validate
our rapid methods.
3.1 Site Selection
EPA’s Ecological Monitoring and Assessment Program (EMAP) in Corvallis,
Oregon assisted with selecting 200 potential sample sites in estuarine intertidal
emergent wetlands and 250 potential sample sites in nontidal wetlands using a
generalized random tessellation stratified (GRTS) design (Stevens and Olsen 1999,
2000). The target population was mapped wetlands from the state wetland maps
(State of Delaware 1994), which are based on 2007 aerial photography. Sampling
sites were randomly chosen points within mapped wetlands, which give each point
an equal probability of being selected and allows more than one point to fall in a
wetland polygon. Sites were selected and sampled in numeric order as dictated by
the EMAP design, lowest to highest. Sites were only excluded from sampling if
permission for access was denied, the site was inaccessible, the site was of the
wrong wetland classification, or if the site was upland. Our goal was to sample 30
tidal sites and 30 nontidal sites in each subclass (riverine, flats, and depression).
For the nontidal sites, once we sampled 30 sites of one subclass we did not sample
additional sites of that subclass but rather would continue to sites of the remaining
subclasses in order of the EMAP selection.
3.2 Changes in Wetland Acreage
To accompany our assessment of wetland condition, we used state wetland
maps to determine the distribution of wetlands across the Broadkill River
watershed, along with where wetland loss has occurred in recent decades and since
the settlement of Delaware. We determined historic wetland acreage using U.S.
Department of Agriculture Natural Resource Conservation Service soil maps. We
identified hydric soil map units from soil survey data (which are based on soil
indicators such as drainage class, landform, and water flow) as ‘historic wetlands’.
We added the historic wetland units to the 1994 wetland units to create an
estimated pre-settlement wetland layer. We used the 1994 SWMP layer to identify
recent wetland distribution (State of Delaware 1994). We identified current
wetlands using the most recent State/NWI wetland mapping based on 2007 aerial
photography (State of Delaware 2007). We determined changes in wetland acreage
Broadkill Watershed Wetland Report 14
across the watershed by comparing the acreage of existing wetlands to both recent
and historic wetlands. Mention of wetland functions are based on estimates from
landscape-level analysis using the USFWS NWIPlus (Tiner 2010).
3.3 Data Collection
3.3.1. Assessing Tidal Wetlands
3.3.1.a Rapid Sampling of Tidal Wetlands
We evaluated the condition of tidal wetlands using the MidTRAM protocol.
The MidTRAM was developed in 2007-2008 by adapting the New England Rapid
Assessment Method (NERAM; Carullo et al. 2007) and the California Rapid
Assessment Method (CRAM; Collins et al. 2008) to tidal wetlands in the
MidAtlantic Region. MidTRAM consists of 14 scored metrics that represent the
condition of the wetland buffer, hydrology, and habitat characteristics (Table 2).
MidTRAM uses a combination of qualitative evaluation and quantitative sampling
to record the presence and severity of stressors in the field or in the office using
maps and digital orthophotos.
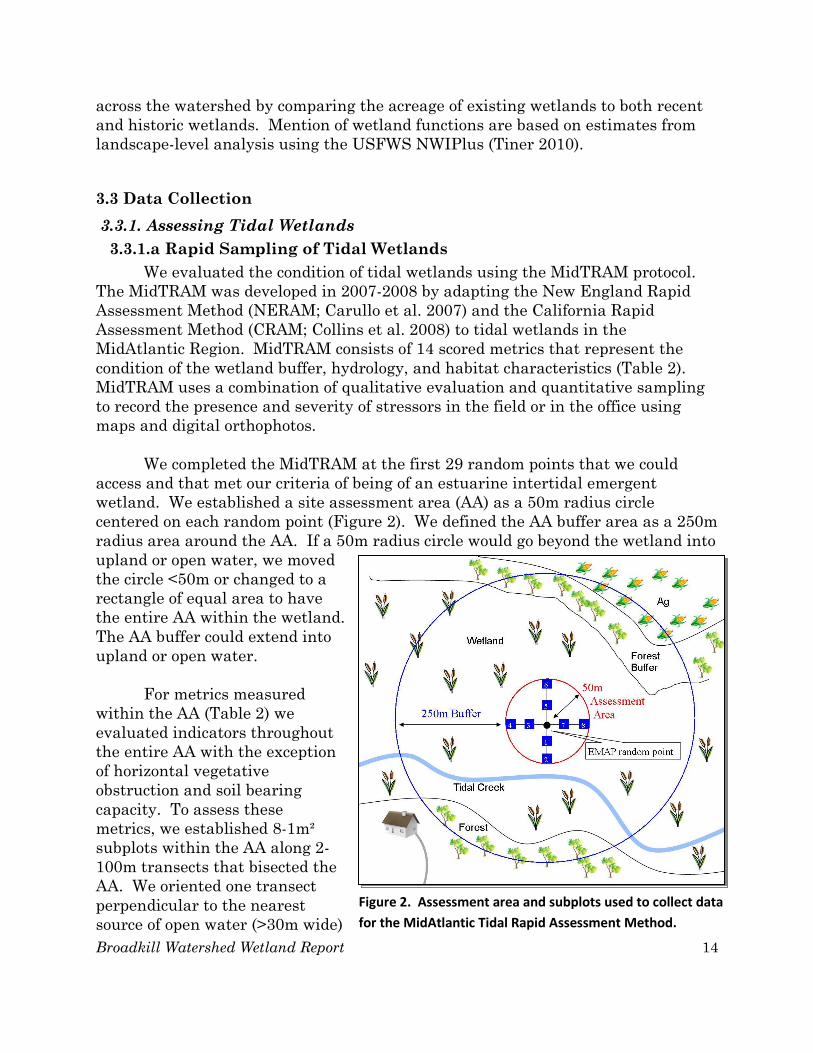
We completed the MidTRAM at the first 29 random points that we could
access and that met our criteria of being of an estuarine intertidal emergent
wetland. We established a site assessment area (AA) as a 50m radius circle
centered on each random point (Figure 2). We defined the AA buffer area as a 250m
radius area around the AA. If a 50m radius circle would go beyond the wetland into
upland or open water, we moved
the circle <50m or changed to a
rectangle of equal area to have
the entire AA within the wetland.
The AA buffer could extend into
upland or open water.
For metrics measured
within the AA (Table 2) we
evaluated indicators throughout
the entire AA with the exception
of horizontal vegetative
obstruction and soil bearing
capacity. To assess these
metrics, we established 8-1m²
subplots within the AA along 2-
100m transects that bisected the
AA. We oriented one transect
perpendicular to the nearest
source of open water (>30m wide)
Figure 2. Assessment area and subplots used to collect data
for the MidAtlantic Tidal Rapid Assessment Method.

Broadkill Watershed Wetland Report 15
and the other was perpendicular to the first. We placed subplots 25m and 50m from
the center of the AA along each transect. Subplots were numbered clockwise
starting with the 25m plot towards the open water, followed by the 50m one
towards open water (Figure 2). If a subplot fell in a habitat type or patch that was
not characteristic of the site (e.g. in a ditch) we moved it 1m along the transect.
We completed all metrics within the AA via visual inspection during the field
visit, with the exception of horizontal vegetative obstruction and soil bearing
capacity. Horizontal vegetative obstruction was quantified at subplots 1, 3, 5, and 7
with a 1m profile board, divided into decimeters. With the profile board held at
0.25m, 0.5m, and 0.75m above the wetland surface the observer stood 4m away from
the profile board, and directly counted the number of decimeter segments visible
through the vegetation at eye level with the profile board. We summed the 3 profile
board readings for each subplot and recorded the average over the 4 subplots. We
measured soil bearing capacity using a slide hammer technique on a random spot in
each subplot. To take the measurement, we raised the slide hammer and released
it 4 times to exert a consistent force on the soil surface. We subtracted the final
depth below the marsh surface of the bottom of the slide hammer from the initial
depth to get the change in depth due to the total force. Each metric was scored a 3,
6, 9, or 12, based on the narrative or numeric criteria in the protocol.
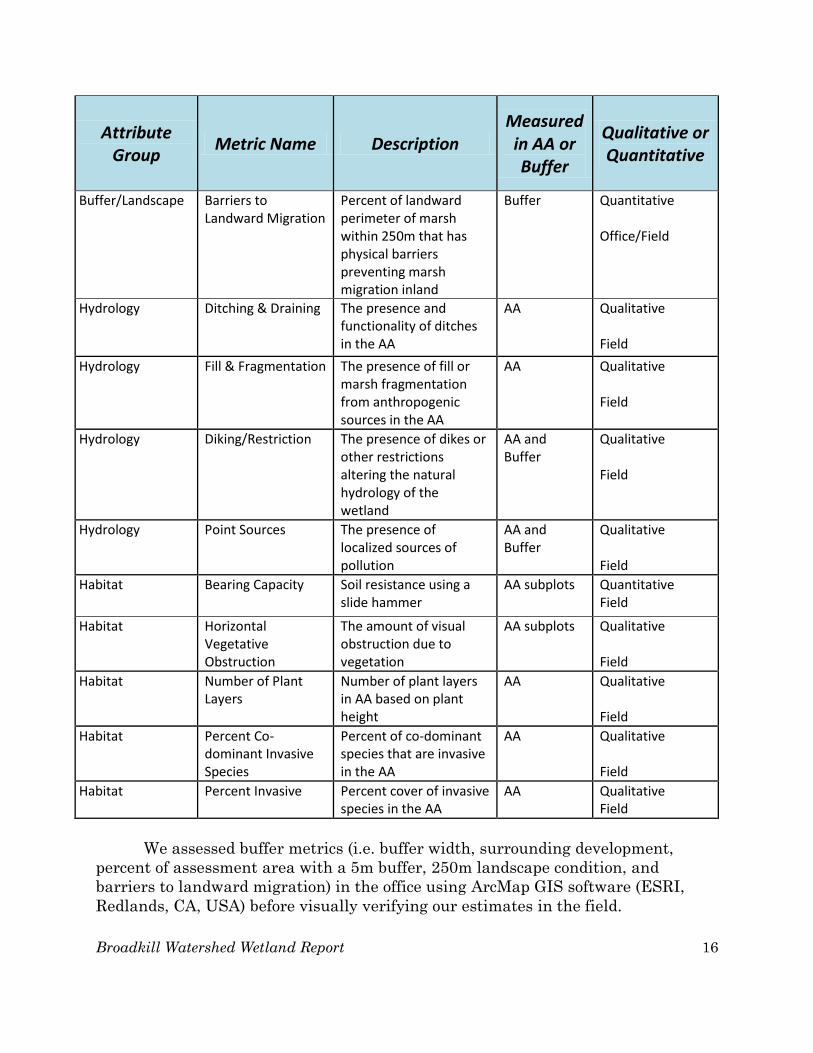
Table 2. 14 metrics comprising the MidAtlantic Tidal Rapid Assessment Method.
Attribute Group
Metric Name Description Measured in AA or Buffer
Qualitative or Quantitative
Buffer/Landscape Percent of AA Perimeter with 5m-Buffer
Percent of AA perimeter that has at least 5m of natural or semi-natural condition land cover
Buffer Quantitative Office
Buffer/Landscape Average Buffer Width
The average buffer width surrounding the AA that is in natural or semi-natural condition
Buffer Quantitative Office
Buffer/Landscape Surrounding Development
Percent of developed land within 250m from the edge of the AA
Buffer Quantitative Office/Field
Buffer/Landscape 250m Landscape Condition
Condition of surrounding landscape based on vegetation, soil compaction, and human visitation within 250m
Buffer Quantitative Office/Field
Broadkill Watershed Wetland Report 16
Attribute Group
Metric Name Description
Measured in AA or Buffer
Qualitative or Quantitative
Buffer/Landscape Barriers to Landward Migration
Percent of landward perimeter of marsh within 250m that has physical barriers preventing marsh migration inland
Buffer Quantitative Office/Field
Hydrology Ditching & Draining The presence and functionality of ditches in the AA
AA Qualitative Field
Hydrology Fill & Fragmentation The presence of fill or marsh fragmentation from anthropogenic sources in the AA
AA Qualitative Field
Hydrology Diking/Restriction The presence of dikes or other restrictions altering the natural hydrology of the wetland
AA and Buffer
Qualitative Field
Hydrology Point Sources The presence of localized sources of pollution
AA and Buffer
Qualitative Field
Habitat Bearing Capacity Soil resistance using a slide hammer
AA subplots Quantitative Field
Habitat Horizontal Vegetative Obstruction
The amount of visual obstruction due to vegetation
AA subplots Qualitative Field
Habitat Number of Plant Layers
Number of plant layers in AA based on plant height
AA Qualitative Field
Habitat Percent Co-dominant Invasive Species
Percent of co-dominant species that are invasive in the AA
AA Qualitative Field
Habitat Percent Invasive Percent cover of invasive species in the AA
AA Qualitative Field
We assessed buffer metrics (i.e. buffer width, surrounding development,
percent of assessment area with a 5m buffer, 250m landscape condition, and
barriers to landward migration) in the office using ArcMap GIS software (ESRI,
Redlands, CA, USA) before visually verifying our estimates in the field.

Broadkill Watershed Wetland Report 17
At the completion of the site visit and assessment, crew members gave each
site a Qualitative Disturbance Rating (QDR) to rank the level of anthropogenic
disturbance to the site’s natural structure and biotic community. Descriptions of
the disturbance ratings are provided in Appendix A. The average field time to
sample each site was 2h. Metrics completed in the office took up to ½ hour to
complete. Detailed instructions for using MidTRAM are provided in the protocol
(Jacobs et al. 2009a).
We calculated attribute group scores by summing the metric scores and
dividing by the total possible value. That value was adjusted to be on a 0-100 scale
since each metric can only score a minimum of 3:
Attribute Group score = ((((∑(metric1…n)/MAXa)*100)-floorx)/ceilingx
where metric1…n=metric scores for the buffer, hydrology or habitat group, MAXa=the
maximum possible attribute group score, floorx = the minimum calculated score for
each group multiplied by 100 (e.g.), and ceilingx= 100-floorx (e.g. 75). Final
MidTRAM condition scores were calculated by averaging the 3 attribute group
scores and ranged from 0-100:
MidTRAM condition score = (Buffer Attribute Score + Hydrology Attribute Score + Habitat Attribute Score)/ 3
We used Statistix (Version 9, Tallahassee, FL. USA) and Excel for all of our
statistical analyses with an alpha level of 0.10.
3.3.1.b Intensive Vegetative Biomass Sampling in Tidal Wetlands
We compared MidTRAM condition scores to more intensive measures of the
biotic community using vegetative biomass. MidTRAM was designed to give a basic
wetland condition rating based on variables and metrics that are responsive to
disturbance. Correlating MidTRAM data to more intensive measures of wetlands
validates the assessment method and increases our confidence that it is able to
distinguish and differentiate tidal wetlands based on changes in biological
communities. Vegetative biomass is a comprehensive attribute of marsh systems
Example: Site B
Buffer group score= ((((9+9+6+12+3)/60)*100)-25)/(100-25)= 0.53*100=53
Hydrology group score= ((((12+9+6+12)/48)*100)-25)/(100-25)= 0.75*100=75
Habitat group score= ((((3+3+6+12+9)/60)*100)-25)/(100-25)= 0.40*100=40
MidTRAM condition score = (53+75+40)/3 = 56

Broadkill Watershed Wetland Report 18
that has been related to marsh condition in regards to plant production, and marsh
stability and accretion (Deegan et al. 2012; Turner et al. 2004).
We collected vegetative above- and below-ground biomass samples from 5
tidal sites in the Broadkill River watershed and combined that data with 30 sites
across the Inland Bays (n=10), Murderkill (n=10) and St. Jones (n=10) watersheds.
Biomass study sites were dominated by smooth cordgrass (Spartina alterniflora)
and were selected in numeric order until we reached our desired sample of 5.
Above- and below-ground biomass samples were collected from subplots 1, 3, and 5
(see Figure 2). We sampled above-ground biomass by clipping all vegetation within
a 15.24cm radius circle randomly placed at the outside edge of the subplot and
sorted the vegetation to separate live stems from dead. We collected below-ground
biomass by extracting sediment cores to 15cm below the marsh surface. We
thoroughly rinsed the cores clean of any sediment, separated live from dead roots,
and chilled the samples until we could dry them. We dried the samples (80-85ºF)
for approximately 72h until there was no additional weight loss detected with
additional drying time. We weighed each sample to the nearest 0.01g.
Averages of the 3 subplots at each site were used for all biomass comparisons
and analyses. Outliers were identified with box plots and removed (n = 6) from the
dataset prior to final analyses. We used a nonparametric Spearman’s ranking
correlation to look for, and measure, the relationship between MidTRAM condition
scores and total above-ground (biomass), total-below ground, above-ground live,
above-ground dead, below-ground live, below-ground dead, above-ground live:below-
ground live ratio, above-ground dead:below-ground dead ratio, and total above-
ground:total below-ground ratio. Correlations between soil bearing capacity and
above- and below-ground biomass values were also measured with Spearman’s
ranking correlation.
3.3.2 Assessing Nontidal Wetlands
3.3.2.a Rapid Sampling in Nontidal Wetlands
We assessed the condition of nontidal wetlands in the Broadkill River
watershed using the DERAP. DERAP collects data on the presence and intensity of
stressors related to habitat, hydrology, and buffer features to assess the condition of
wetlands by watershed. DERAP scores are calibrated to comprehensive wetland
condition data collected using the Delaware Comprehensive Assessment Procedure
(Jacobs et al. 2008), separately for each HGM subclass.
Broadkill Watershed Wetland Report 19
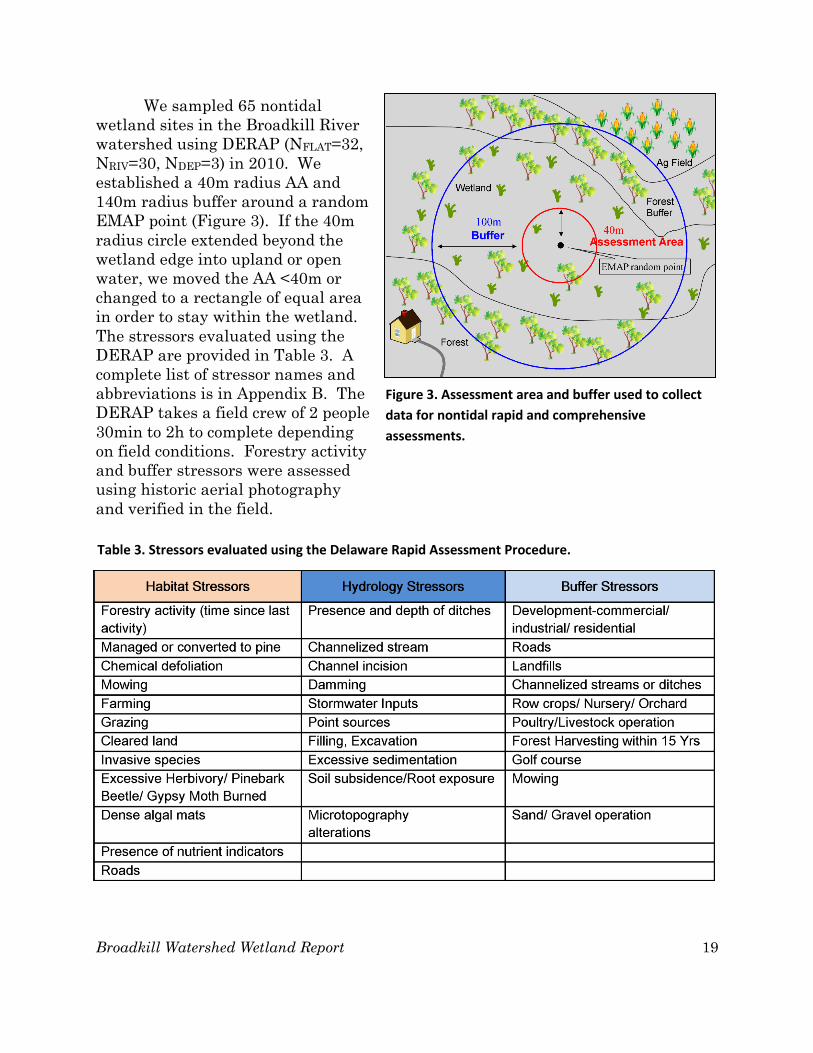
Figure 3. Assessment area and buffer used to collect
data for nontidal rapid and comprehensive
assessments.
We sampled 65 nontidal
wetland sites in the Broadkill River
watershed using DERAP (NFLAT=32,
NRIV=30, NDEP=3) in 2010. We
established a 40m radius AA and
140m radius buffer around a random
EMAP point (Figure 3). If the 40m
radius circle extended beyond the
wetland edge into upland or open
water, we moved the AA <40m or
changed to a rectangle of equal area
in order to stay within the wetland.
The stressors evaluated using the
DERAP are provided in Table 3. A
complete list of stressor names and
abbreviations is in Appendix B. The
DERAP takes a field crew of 2 people
30min to 2h to complete depending
on field conditions. Forestry activity
and buffer stressors were assessed
using historic aerial photography
and verified in the field.
Table 3. Stressors evaluated using the Delaware Rapid Assessment Procedure.
Broadkill Watershed Wetland Report 20
Scoring for the DERAP to produce one overall score of condition was
developed through a process to calibrate the presence of stressors at a site to
comprehensive wetland condition data using the DECAP Index of Wetland
Condition (IWC). We developed the DECAP IWC using a process to screen
hydrogeomorphic (HGM) variables specific to wetland subclass to select the
strongest variables that would represent the condition of the primary wetland
attributes of plant community, hydrology, and buffer (Jacobs et al. 2009). The
DERAP was then calibrated to the DECAP IWC using a data set of over 250 sites
from the Nanticoke, Inland Bays, and Delaware Bay watersheds in Delaware
(Sifneos et al. 2010).
We selected stressors using step-wise multiple regression and Akaike’s
Information Criteria (AIC) approach to develop the best model that correlated with
comprehensive assessment data without over-fitting the model to this specific
dataset. Coefficients or weights associated with each stressor were assigned using
multiple linear regression (Appendix C). We calculated the DERAP IWC score by
summing the stressor coefficients for each of the selected stressors that were
present and subtracting the sum from the linear regression intercept. For all
wetland subclasses, 23 stressors were selected to be included in the DERAP IWC
calculation: 7 habitat stressors, 6 hydrology stressors, and 10 landscape or buffer
stressors (Appendix C).
DERAP IWCFLATS = 95 - (∑stressor weights)
DERAP IWCRIVERINE = 91 - (∑stressor weights)
DERAP IWCDEPRESSION = 82 - (∑stressor weights)
The DERAP stressor dataset from 32 flats, 30 riverine and 3 depression sites
in the Broadkill watershed are provided in Appendix F, G, and I, respectively.
3.3.2.b Comprehensive Sampling in Nontidal Wetlands
We collected DECAP data from 1 riverine wetland in the Broadkill
watershed, from which DERAP was also sampled. We followed the Delaware
Comprehensive Assessment Procedure as outlined in the protocol (Jacobs et al.
2008). These data will be combined with other DECAP data from sites throughout
Delaware to continue to validate and calibrate the DERAP. Data from this riverine
site is provided in Appendix H.
3.4 Presenting Wetland Condition
We present our results at both the site and population level. We discuss site
level results by summarizing the range of scores that we found in sampled sites (e.g.
Habitat attribute scores ranged from 68 to 98). Population level results are
presented using weighted means and standard deviations (e.g. Habitat for tidal
wetlands averaged 87±13) or weighted percentages (e.g. 20% of riverine wetlands
had channelization present). Population level results have incorporated weights

Broadkill Watershed Wetland Report 21
based on the probabilistic design and correct for any bias due to sample sites that
could not be sampled and different rates of access on private and public lands to be
able to extrapolate to the total area of wetland in the watershed. The cumulative
results represent the total area of the respective wetland subclass for the entire
watershed.
Sites in each HGM subclass were placed into 3 condition categories
(Minimally or Not stressed, Moderately stressed or Severely stressed; Table 4). We
determined breakpoints by applying a percentile calculation to the QDR’s and
condition scores from sites in several watersheds. For the tidal portion we used
sites from the St. Jones, Murderkill, and Inland Bays watershed (n=136) combined
for a larger, regional sample. We used the 25th percentile of MidTRAM scores for
sites with a QDR of 1 or 2 to separate minimally or not stressed from moderately
stressed. We used the 75th percentile of MidTRAM scores from sites with a QDR of
5 or 6 to separate moderately stressed from severely stressed. Based on the 3
watersheds combined, the condition breakpoints for tidal sites are provided in Table
4. For the nontidal portion, we used assessment sites from the Nanticoke and
Inland Bays, Murderkill, and St. Jones watersheds (n=160) to determine condition
breakpoints separately for flat and riverine wetlands. Based on the three
watersheds combined, the condition breakpoints for nontidal sites that we applied
in the Broadkill watershed are provided in Table 4.
Table 4. Condition categories and breakpoint values for tidal, and nontidal flats and riverine wetlands in the Broadkill River watershed as determined by wetland condition scores.
Wetland Type Method Minimally or Not Stressed
Moderately Stressed
Severely stressed
Tidal MIDTRAM ≥81 <81 and ≥ 63 <63
Nontidal Riverine DERAP ≥85 <85 and ≥47 <47
Nontidal Flats DERAP ≥88 <88 and ≥65 <65
Nontidal Depression DERAP ≥73 <73 and ≥53 <53
Condition Breakpoint Criteria –calculated for each subclass (tidal, flats,
riverine, depression)
Minimally or not stressed –. Sites with condition scores ≥25th percentile of the
range for sites with a low disturbance QDR rating of 1 or 2.
Moderately stressed – Sites in between minimally and highly stressed.
Highly stressed –. Sites with condition scores ≤75th percentile of the range for
sites with a high disturbance QDR rating of 5 or 6.

Broadkill Watershed Wetland Report 22
We used a cumulative distribution function (CDF) to display wetland
condition on the population level. A CDF extrapolates assessment results to the
entire population and can be interpreted by drawing a horizontal line anywhere on
the graph and reading that as: ‘z’ proportion of the area of tidal wetlands in the
watershed falls above (or below) the score of ‘w’ for wetland condition. The
advantage of these types of graphs is that they can be interpreted based on
individual user goals, and break points can be placed anywhere on the graph to
determine the percent of the population that is within the selected conditions. For
example, in Figure 4 roughly 40% of the wetland area scored above an 80 for
wetland condition. A CDF also highlights clumps or platueas where either a large
or small portion of wetlands are in similar condition. In the example, there is a
condition plateau from 50 to approximately 75, illustrating that only a small portion
of the population had condition scores in this range.
Figure 4. An example CDF showing wetland condition. The red line is the population estimate. The orange and green dashed lines show the breakpoints between condition categories.

Broadkill Watershed Wetland Report 23
RESULTS
4.1 Changes in Wetland Acreage
Wetlands historically covered over 18,000 acres across the Broadkill River
watershed. Our comparison of estimated historic wetlands to 2007 wetlands
indicated that 11% of wetland acreage was lost within the watershed through
conversion between the time of settlement and 2007 (Map 6). Historic wetland
losses occurred throughout much of the watershed but were primarily located in
nontidal flats north of Georgetown. Large impoundments created at major road
crossings were also a notable source of riverine wetland loss in this watershed, with
five impoundments along State Routes 1, 5, and 30 totaling 400ac of open water
(Map 6).
Map 6. Past and present wetland coverage in the Broadkill River watershed, Delaware.

Broadkill Watershed Wetland Report 24
From 1992 to 2007, wetland maps indicated 75ac of wetlands have been lost
to conversion, with a loss of 64ac of flat wetlands, and 11ac of ponds and
depressions. There were no losses to riverine or tidal wetlands during that period.
Common to statewide trends, freshwater forested wetlands continued to sustain the
greatest losses, often in isolated and seasonally saturated wetland blocks that are
more difficult to identify and protect. From 1992 to 2007, 170ac of wetlands were
created in the Broadkill River watershed, resulting in a 0.6% net gain (95ac). The
small increase in wetland acreage was largely (98%) due to the creation of ponds
and fill borrow pits as well, as the expansion of existing mapped wetlands resulting
from refined mapping methods. Although acreage in this watershed technically
increased, a statewide wetland trends analysis reported an overall loss in acreage
and confirmed that the majority of gains were in low functioning stormwater ponds
(Tiner et al. 2011).
As a result of recent changes in wetland acreage, the wetland functions
potentially provided in the Broadkill River watershed have further been altered. A
recent landscape-level analysis of wetland function predicted that, as a result of
wetland losses between 1992 and 2007, the potential for existing wetlands to
perform nutrient transformation, sediment retention, surface water detention, and
serve as wildlife habitat were reduced (Tiner 2011). The direct replacement of
natural wetlands with stormwater retention ponds can also negatively affect
wildlife that utilize these habitats for breeding, nesting, or foraging. In developed
landscapes, unnatural hydroperiods and the accumulation of contaminants in
stormwater ponds can create ecological traps for birds, reptiles, and amphibians
(Brand et al. 2010).
Tidal wetlands are regulated through state wetland permitting in
combination with federal regulations which inhibit large losses. Despite mapping
no losses to tidal wetlands between 1992 and 2007, these habitats are threatened
today by rising sea levels and conversion to open water. Conversion of coastal
wetlands to open water is one topic being addressed as DNREC plans for adapting
to sea level rise and climate change (State of Delaware 2012). Many nontidal
riverine wetlands are also afforded some protection under federal regulations,
unlike flats and depressions in Delaware, which likely contributed to no recent
losses to riverine systems in the Broadkill River watershed.
4.2 Landowner Contact and Site Access
We obtained landowner permission prior to accessing and sampling all sites.
We identified landowners using county tax records and mailed a post card providing
a brief description of our study goals, sampling techniques, and contact information.
If a contact number was available, we followed the mailings with a phone call to
discuss the site visit and secure permission.

Broadkill Watershed Wetland Report 25
The majority of our sampled sites were privately owned (Figure 5). Across all
wetland types we were granted access from 92% from landowners of privately
owned sites (Figure 6). We were granted access to all 38 targeted tidal sites, though
site visits revealed that 9 sites were palustrine tidal and were not appropriate for
our population sample Of the 29 tidal sites we sampled, 15 (52%) were on public
lands. We attempted to gain access to 35 flat sites of which two were denied and
one proved inaccessible. Of the 32 flat sites that were sampled, 75% were privately
owned. We considered 36 riverine sites for sampling and were denied access to 3
sites, could not contact one of the landowners, and could not safely access 2 of the
sites. Of the 30 riverine sites sampled, 29 (97%) were privately owned. Depression
wetlands made up a very low proportion of sites in the Broadkill watershed and
only 3 were identified in the 250 potential points. All 3 sites were sampled, 2 (67%)
were found on private lands.
4.3 Wetland Condition
4.3.1 Tidal Wetland Condition
Tidal estuarine wetlands comprise 49% (6,566ac) of the total wetland acreage
in the Broadkill River watershed and provide coastal populations with more
ecosystem services than any other habitat. They are highly fertile and productive,
and are able to minimize flooding from storms, control erosion, and improve and
maintain water quality by sequestering and storing excess nutrients, sediments,
and toxic chemicals.
Figure 6. Success rates for privately owned wetland
sites in the Broadkill River watershed Delaware in 2010
by wetland subclass.
Figure 5. Ownership of sampled
wetland sites in the Broadkill River
watershed, Delaware in 2010.

Broadkill Watershed Wetland Report 26
Tidal wetlands in the Broadkill River watershed were in fair condition with
an average condition score of 74±9 and ranged from 53 to 88. The top 10% of the
tidal population scored >85 and were characterized as having intact hydrology, wide
buffers with minimal disturbance, and very little invasive plant cover. Conversely,
wetlands scoring in the bottom 14% had condition scores <60 with developed
landscapes, diking or otherwise restricted hydrology, and invasive species present.
Appendix D provides the raw values and scored metric data for the 29 tidal wetland
sites.
The cumulative distribution function takes the sample population and
extrapolates condition results onto the entire wetland population in the watershed.
The cumulative distribution function for the tidal wetland population in the
Broadkill showed a distribution skewed towards higher condition, with a minimum
score of just 53 (Figure 7). Throughout the total range of wetlands there was a
fairly uniform distribution of condition above 75, with a grouping of sites below that
sharing a condition score near 68.
Figure 5. The Cumulative Distribution Function for tidal wetland condition based on the MidTRAM in
the Broadkill River watershed, Delaware in 2010. The orange and green dashed lines designate the
condition category breakpoints. The gray dashed lines represent the 95% confidence intervals.
Broadkill Watershed Wetland Report 27
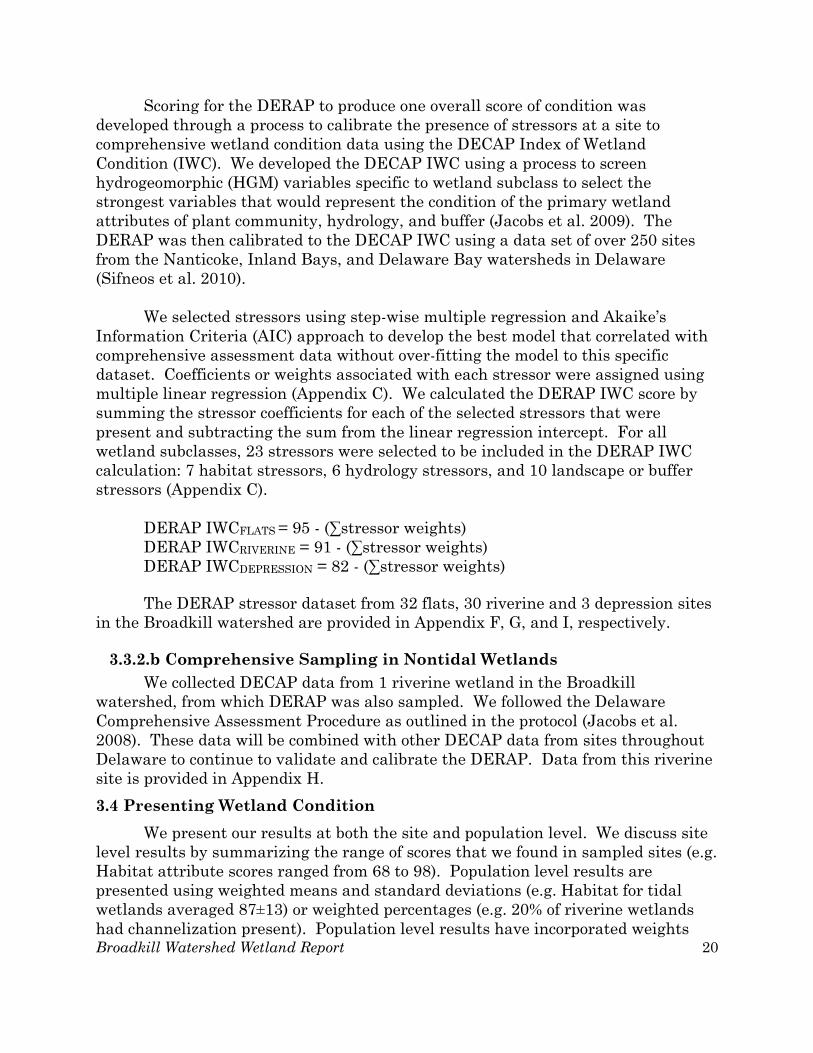
Overall, 24% of tidal wetlands in the Broadkill River watershed were
minimally or not stressed (Figure 8 left). A majority of the wetlands (62%) were
moderately stressed and 14% were severely stressed (Figure 8 left). Minimally
stressed wetlands averaged 5 stressors compared to 7 for moderately stressed and 9
for severely stressed wetlands.
In addition to the number of stressors, the intensity of several stressors
increased with decreasing condition category (Figure 8 right). Buffers to minimally
and moderately stressed wetlands were, on average, wide and largely undisturbed,
while natural buffers to severely stressed wetlands were nearly half the size.
Diking and tidal restriction was absent from minimally stressed wetlands, but
present in all of the severely stressed wetlands. While the composition and relative
cover of plants differed among sites, 90% of wetlands had 2-3 plant layers and
received a moderate score for this attribute. The presence of invasive plants also
increased with decreasing wetland condition. Ditching was pervasive throughout
the watershed and was not responsive to condition category. Wetland buffers to
every wetland had some degree of human disturbance, though the intensity of
disturbance varied greatly among sites.
Figure 6. Tidal wetland
condition proportions (left)
and stressor prevalence
(right) for the Broadkill River
watershed, Delaware in 2010.

Broadkill Watershed Wetland Report 28
After grouping the
14 tidal metric scores into
three wetland attribute
group values, the means
varied slightly (Figure 9).
The habitat attribute
group averaged the lowest
score due to a lack of plant
layers, the percent of
invasive plant cover, and
poor horizontal vegetative
cover. The hydrology
attribute score was
markedly higher due to an
absence of point source
inputs and lack of fill material, although a majority of the tidal wetlands have been
ditched. Compared to other watersheds in Delaware, the Inland Bays and Broadkill
River watersheds had more tidal wetlands with ditching (72% each) than the
nearby Murderkill River watershed (60%) and St. Jones River watershed (36%).
The buffer attribute group had the highest average score, which was influenced by
relatively expansive wetland buffers and few occurrences of residential or industrial
development, though agricultural land was found in nearly every wetland buffer.
Concurrently, the proportion of wetlands with hardened shorelines that inhibit
landward marsh migration was much lower in the Broadkill River watershed (7%)
than those in the St. Jones (30%), Inland Bays (28%), and Murderkill watersheds
(22%).
4.3.1.a. Intensive Biomass Data
Our combined rapid condition
scores were related to several
biomass parameters in Spartina-
dominated marshes across four
watersheds in Delaware. We found a
significant positive relationship
between condition scores and all
three recorded below-ground biomass
measures (Table 5). These findings
are supported by the theory that
environmental factors influence
energy partitioning, as stressed
wetland plants allocate more energy
Figure 7. Mean attribute group values and standard deviations for
tidal wetlands in the Broadkill River watershed, Delaware.
Table 5. Correlation between MidTRAM condition
scores and biomass values for 29 tidal wetland sites in
the Broadkill River, St. Jones River, Murderkill River,
and Inland Bays watersheds, Delaware.
Biomass Variable r² P Trend
Below Live 0.51 0.005 +
Below Total 0.39 0.040 +
Below Dead 0.35 0.060 +
Above Live 0.31 0.099 +

Broadkill Watershed Wetland Report 29
to above-ground shoot production and divert energy from root and rhizome
production (Turner et al. 2004). In a healthy system, plants allocate energy towards
root growth which accumulates as biomass and increases marsh stability.
Inconsistent with this theory was a marginally significant (P=0.099) correlation
between above-ground live biomass and MidTRAM condition score, though many
variables influence above-ground biomass and it is not a good predictor of marsh
condition (Turner et al. 2004).
We did not observe a significant relationship between MidTRAM condition
scores and above-ground dead biomass (P=0.500) or above-ground total biomass
(P=0.665). We also failed to observe a correlation with MidTRAM condition scores
and the ratio of above-ground live:below-ground live (P=0.596), above-ground
dead:below-ground dead (P=0.118), or above-ground total:below-ground total
(P=0.203). Consistent with literature, these variables are all influenced by above-
ground biomass values which is not directly linked with marsh health (Darby and
Turner 2008; Turner et al. 2004)
We also found that soil bearing capacity was related to vegetative biomass in
several ways. Bearing capacity was correlated with below-ground dead biomass
(r²=0.44, P=0.018; Figure 10), below-ground total (r²=0.40, P=0.031), and above-
ground live: below-ground
live ratio (r²=0.47, P=0.010).
These relationships should
be expected given that below-
ground biomass increases
marsh stability and, in turn,
soil bearing capacity. Strong
relationships between
bearing capacity and
biomass have been important
when re-evaluating and
rescoring rapid MidTRAM
metrics with intensive
indicators. Vegetative
biomass data for the 5
Broadkill River sites are
provided in APPENDIX E.
4.3.2 Nontidal Wetland Condition
4.3.2.a Flats
Flat wetlands make up 24% (3,271ac) of wetlands across the Broadkill River
watershed, occurring in areas with low, gradual slopes. Flats are typically found on
Figure 8. Relationship between below-ground dead biomass and
soil bearing capacity in Broadkill River, St. Jones River,
Murderkill River, and Inland Bays watersheds, Delaware.

Broadkill Watershed Wetland Report 30
Figure 9. Cumulative Distribution Function for nontidal flat wetlands in the Broadkill River
watershed, Delaware in 2010. The orange and green dashed lines signify condition category
breakpoints dividing severely, moderately and minimally stressed portions of the flats wetland
population. The gray dashed lines represent the 95% confidence intervals.
the periphery of the watershed in forested or fallow areas and are especially
prevalent in the poorly drained western portion of the watershed (Map 3). Flats are
valued for their ability to help store and slowly release water to prevent
downstream flooding, to improve water quality by filtering precipitation and runoff
from surrounding upland land uses, and by providing important wildlife habitat in
large forested areas.
The cumulative distribution function of the Broadkill flats population is
skewed towards higher condition, with 75% of the wetlands scoring 79 or better
(Figure 11). Roughly 20% (500ac) of the existing flat wetlands in the Broadkill
River watershed are estimated to be minimally stressed (Figure 11). The lower 10%
of population ranked below 60 and was recently clear cut or otherwise heavily
impacted. The top 10% of the population was characterized by having intact
hydrology, wide natural buffers, and mostly native plant species.
Broadkill Watershed Wetland Report 31
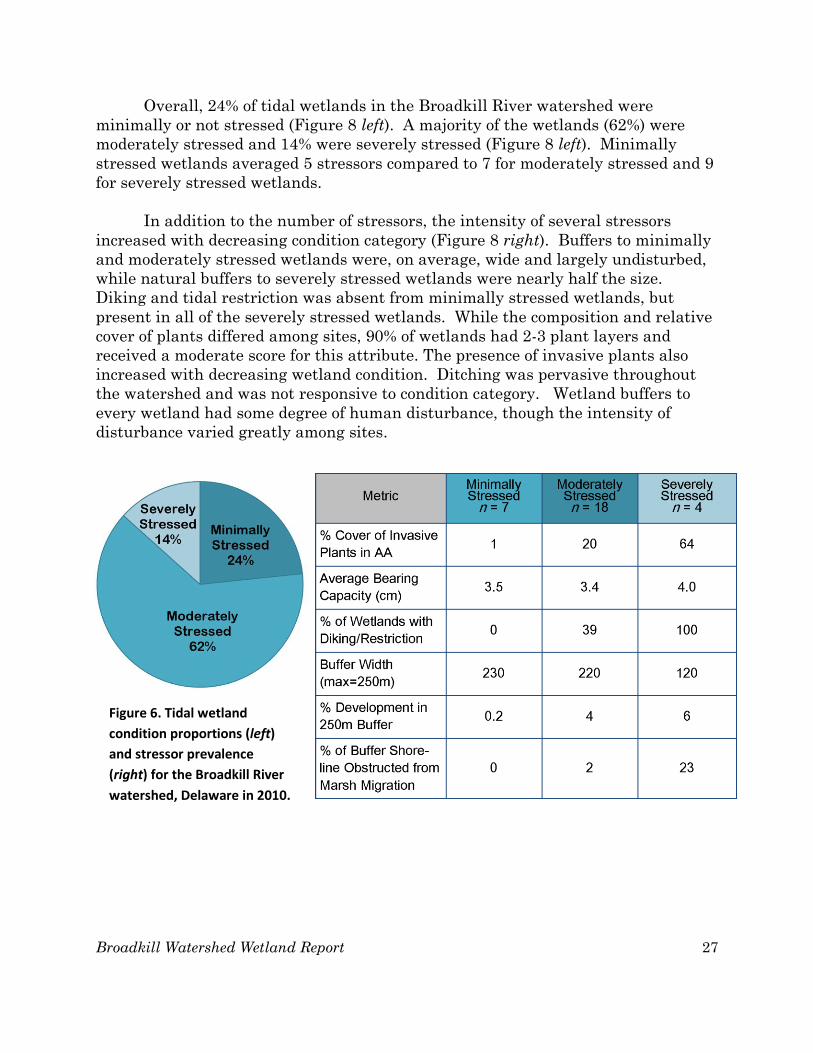
Wetland condition scores for flats ranged widely from 28 to 95 and averaged
78±16. Over one half (59%) of flats were moderately stressed, 26% were minimally
or not stressed, and 15% were severely stressed (Figure 12 left). Forestry activity
occurred throughout the Broadkill watershed (41% of flats), but each of the severely
stressed wetlands were clear cut within the last 2 years. Invasive plants were
present in flats of every condition category. Conversion from a natural forest
community to pine plantation occurred in 60% of the severely stressed wetlands and
in 13% of the overall flat wetland population. Ditching and disturbance to wetland
buffers also increased with decreasing condition (Figure 12 right). Elevated dirt or
paved roads were common (43%) in flat wetlands across the watershed.
In general, the most common habitat stressors for flats were forestry activity
and the presence of invasive species, and common hydrology stressors were ditching
and fill materials in the wetland AA. Residential or commercial development was
found in only 13% of wetland buffers, while agricultural activities occurred in 28%
of wetland buffers. Agricultural activities, along with recent forestry activity,
represented the most common buffer stressors. The rapid assessment stressor
dataset from 32 flats sites in the Broadkill River watershed are provided in
Appendix F.
4.3.2.b Riverine
Riverine wetlands, also called riparian or floodplain wetlands, occur along
downstream portions of rivers and streams and make up 26% (3,527ac) of the
Broadkill watershed’s wetlands. They are valued for their water quality
maintenance through sediment retention and nutrient uptake. They also provide
storm water storage, either holding runoff water from upland areas or allowing
overbank flood water storage. Riverine wetlands also provide rich habitat for fish,
wildlife and plants and serve as an important landscape link between surface
waters and upland habitats.
Figure 10. Condition proportions (left) and stressor occurrence (right) for the flat wetlands population
in the Broadkill River watershed, Delaware in 2010.

Broadkill Watershed Wetland Report 32
The cumulative distribution function for Broadkill riverine wetlands showed
a population with condition scores that ranged widely with some distinct groupings
of sites (Figure 13). Similar to flat wetlands in the Broadkill River watershed,
roughly 500ac of the remaining riverine wetland population is considered minimally
stressed. The largest grouping of wetlands (30%) had a condition score of 83-84.
These sites had a presence of invasive species and buffer stressors, but few
occurrences of alterations to the waterway. A smaller subset of wetlands (10%)
shared a condition score of 62 and was found to have invasive plant species, incised
channels, and developed buffers.
The wetland condition scores for riverine wetlands in the Broadkill
watershed ranged from 39 to 91 and averaged 74±14. Only one site (3% of the
population) was severely stressed, so conclusions can not accurately be drawn for
stressors common to this condition class. The majority (77%) of wetlands were
moderately stressed, and 20% were minimally or not stressed (Figure 14 left).
Invasive plants were widespread throughout the population and were found in 77%
of riverine wetlands, including 91% of moderately stressed sites (Figure 14 right).
Stream alterations were also found in nearly half (43%) of the moderately stressed
Figure 11. Cumulative Distribution Function for nontidal riverine wetlands in the Broadkill River watershed, Delaware in 2010. The orange and green dashed lines signify the condition category breakpoints dividing severely, moderately and minimally stressed portions of the riverine wetland population. The gray dashed lines represent the 95% confidence intervals.
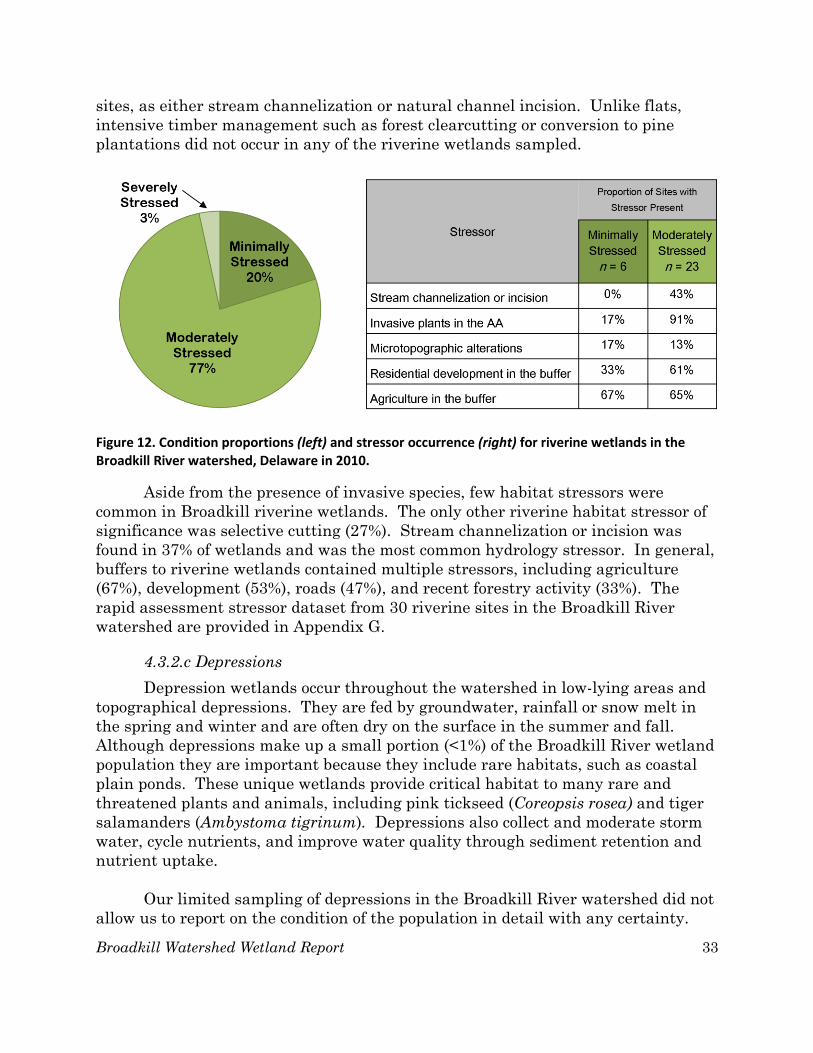
Broadkill Watershed Wetland Report 33
sites, as either stream channelization or natural channel incision. Unlike flats,
intensive timber management such as forest clearcutting or conversion to pine
plantations did not occur in any of the riverine wetlands sampled.
Aside from the presence of invasive species, few habitat stressors were
common in Broadkill riverine wetlands. The only other riverine habitat stressor of
significance was selective cutting (27%). Stream channelization or incision was
found in 37% of wetlands and was the most common hydrology stressor. In general,
buffers to riverine wetlands contained multiple stressors, including agriculture
(67%), development (53%), roads (47%), and recent forestry activity (33%). The
rapid assessment stressor dataset from 30 riverine sites in the Broadkill River
watershed are provided in Appendix G.
4.3.2.c Depressions
Depression wetlands occur throughout the watershed in low-lying areas and
topographical depressions. They are fed by groundwater, rainfall or snow melt in
the spring and winter and are often dry on the surface in the summer and fall.
Although depressions make up a small portion (<1%) of the Broadkill River wetland
population they are important because they include rare habitats, such as coastal
plain ponds. These unique wetlands provide critical habitat to many rare and
threatened plants and animals, including pink tickseed (Coreopsis rosea) and tiger
salamanders (Ambystoma tigrinum). Depressions also collect and moderate storm
water, cycle nutrients, and improve water quality through sediment retention and
nutrient uptake.
Our limited sampling of depressions in the Broadkill River watershed did not
allow us to report on the condition of the population in detail with any certainty.
Figure 12. Condition proportions (left) and stressor occurrence (right) for riverine wetlands in the Broadkill River watershed, Delaware in 2010.

Broadkill Watershed Wetland Report 34
However, combining assessment data from depressions in the Broadkill, St. Jones,
and Murderkill watersheds (n=10) revealed that 80% of the wetlands contained
invasive species, 70% had recent forestry activity, 60% had fill material deposited in
the wetland AA, and 60% of the wetland buffers contained agricultural land. The
rapid assessment data from 3 Broadkill depression sites are provided in Appendix I.
4.4 Overall Condition and Watershed Comparison
For an overall view of wetland condition in the Broadkill River watershed,
and to compare alongside three other recently assessed watersheds, we combined
the condition proportions for the major wetland types (tidal, flat, riverine and
depression) based on the acreage of each type in the watershed (Figure 15).
Moderately stressed wetlands dominated each major wetland type in the
Broadkill River watershed and made up 65% of the total population. Compared to
other watersheds in Delaware, the Broadkill River watershed contained less
minimally stressed wetlands than any other watershed (23%; Figure 15). However,
the Broadkill watershed also contained fewer severely stressed wetlands than the
other three watersheds.
Figure 13. Combined condition of tidal, flat, riverine and depression wetlands in the Broadkill River watershed, Delaware in 2010 and its comparison to wetland condition of the St. Jones River, Murderkill River, and Inland Bays watersheds, Delaware in 2005-2009, based on the DERAP and MidTRAM.

Broadkill Watershed Wetland Report 35
MANAGEMENT RECOMMENDATIONS
Based on our study, we offer the following 9 recommendations to improve wetland
management, identify additional data needs, and encourage informed and effective
decisions concerning the future of wetland resources in the Broadkill River
watershed.
1. Improve the protection of flats. The greatest historic wetland losses
occurred in headwater flats, and these habitats continue to be the most
frequently converted wetlands in the watershed. Our study found that 1/4 of
remaining flats were in high condition and our priority is to ensure that they
remain intact. Protecting the top condition portion of the population will
capitalize on their role in the watershed for improving water quality,
providing important habitat, and storing flood waters. Also, to ensure that
moderate condition flats, which were mostly impacted by forestry activities,
are being harvested using sustainable practices will allow them to regenerate
to native forest communities and retain natural wetland hydrology.
2. Improve protection of nontidal wetlands. Activities in nontidal
wetlands are not regulated by the State of Delaware. Every additional
wetland filled or destroyed contributes to a reduction of water quality,
wildlife habitat, and flood abatement services, and increases societal costs for
providing man-made alternatives to these services. Improved protection for
nontidal wetlands is needed to fill the gaps left by recent Supreme Court
decisions and to provide a comprehensive and clear means to protect
wetlands across the state. A state regulatory program in concert with county
and local programs would reduce the ambiguity surrounding which wetlands
are regulated and provide a comprehensive and clear means to protect
wetlands in the entire state. Local regulations can be incorporated into
municipal and/or county code and home owner associations to protect wetland
areas of special significance. Also, consider protecting high quality wetlands
using fee simple acquisitions and conservation easements. We can encourage
better protection at the state and local level by educating the public and
decision makers on the importance of wetlands within the watershed.
3. Improve nontidal wetland buffer regulations and codes. By allowing
generous stream and wetland buffers, nontidal wetland services including
water quality improvement, wildlife habitat, and flood water retention will be
preserved. Sussex County code1 establishes 50ft riparian buffers extending
from the ordinary high water mark of perennial streams (Article 25 § 115-
193). Under current wording, nontidal wetlands that extend >50ft from
1 http://ecode360.com/SU1223 February 2013

Broadkill Watershed Wetland Report 36
perennial streams are not protected. Recent regulations to increase buffer
widths to 100ft in Sussex County were included in the Inland Bays Pollution
Control Strategy (DE DNREC 2008b) but were challenged by the County and
found to be invalid. Establishing and enforcing wetland buffers that
specifically start at the wetland edge would strengthen protection and
improve water quality. Also, requiring wetland and riparian buffers to have
forested vegetation would maximize nutrient removal from groundwater,
surface water runoff and in-stream flow, while improving corridor habitat.
4. Update tidal wetland regulatory maps. In addition to improving the
protection of nontidal wetlands, it is prudent to maximize the authority that
already exists within DNREC. Tidal wetland impacts are regulated by the
State of Delaware and permit reviewers need accurate and recent wetland
maps to guide wetland permitting. Currently 1988 wetland maps are used,
which must be verified in person and are difficult to read. Evidence of recent
coastal development and inundation of coastal wetlands due to sea level rise
creates a greater need to adopt updated wetland maps as regulatory maps.
5. Develop incentives to maintain natural buffers of tidal wetlands. As
sea levels rise and extreme storm events bring more flooding, the importance
of wetland buffers between water and upland is taking center stage. The
need exists to inform Delawareans on the importance of allowing tidal
wetlands to migrate inland unobstructed by roads, rip-rap and bulkheads.
Barriers to landward migration do not allow marshes to keep pace with sea
level rise and when these habitats are converted to open water it prevents
them from buffering coastal storms. The low occurrence of hardened
shorelines in Broadkill River watershed is uncommon in Delaware and
should be preserved. In addition to awareness, an incentive program could
attract an interest in maintaining natural buffers between wetlands and
development.
6. Control the extent and spread of the non-native, invasive common
reed (Phragmites australis). Invasive plants such as Phragmites are
capable of spreading rapidly, outcompeting native species, reducing plant
diversity in undisturbed areas, and reducing the success of other organisms
by changing habitat structure and food availability. The DNREC Phragmites
Control Program in the Division of Fish and Wildlife has treated more than
20,000 acres on private and public property since 1986. Without continued
support from state funds and federal State Wildlife Grant funds Phragmites
will degrade more wetlands. If Phragmites was eradicated from tidal
wetlands, the average habitat scores would increase 13% from 61% to 74%
and only 3% of the tidal wetlands in the Broadkill River watershed would be
severely stressed (down from 14%).

Broadkill Watershed Wetland Report 37
7. Improve enforcement of wetland permitting and mitigation
monitoring. Enforcing wetland impact criteria and following up with
mitigation monitoring is labor intensive and can be difficult to quantify.
Delaware’s DNREC is working with the Army Corps to improve the
effectiveness and efficiency of wetland permitting by incorporating the
Delaware Rapid Assessment Procedure and develop value-added metrics to
account for non-condition related wetland features. Additional enforcement
staff and federal oversight will also improve Delaware’s wetland protection
efforts.
8. Design a wetland restoration plan for the Lower Delaware Bay Basin
that includes the Broadkill River watershed. This involves a science-
based process that uses existing data to identify restoration and protection
priority properties pertinent to forestry, agriculture, wetlands, restoration,
soils, wildlife and botany branches of state, federal and non-profit
organizations. The plan would lead to the implementation of restoration and
conservation opportunities on private and public property across the
Delaware Bay Basin and Broadkill River watershed. A basin-wide plan will
combine resources, time, and manpower. Roughly 8,700 acres of wetlands in
the Broadkill were moderately stressed which identified a need for
restoration to restore the structure and function of their biological
community. The Broadkill River watershed contains fewer high-quality
wetlands than other previously assessed watersheds, so these should be a
priority for protection. Enhancement and restoration should be a priority in
the watershed to reduce impacts to wetland resources and improve wetland
functions.
9. Support Delaware’s Bayshore Initiative by securing funding for
wetland restoration and preservation. As part of President Obama’s
America’s Great Outdoors initiative, the Delaware Bayshore Initiative was
created to preserve Delaware’s coastal heritage and increase recreation
utilizing landscape-scale conservation practices. Thirty square miles of the
Broadkill River watershed is within the targeted Bayshore region, including
most of the watershed’s tidal marshes and a number of sizable Coastal Plain
Ponds. The most proactive approach to conserving wetland resources is to
protect wetlands in high condition that have not been impacted by significant
stressors. The Delaware Bayshore Initiative will pool conservation resources
to efficiently improve coastal habitat access and preservation.

Broadkill Watershed Wetland Report 38
LITERATURE CITED
Brand, A.B, J. W. Snodgrass, M.T. Gallagher, R. E. Casey, R. Van Meter. 2010.
Lethal and sublethal effects of embryonic and larval exposure of Hyla versicolor
to stormwater pond sediments. Archives of Environmental Contamination and
Toxicology 58:325-331.
Carullo, M., B.K. Carlisle, and J.P. Smith. 2007. A New England Rapid Assessment
Method for Assessing Condition of Estuarine Marshes; A Boston Harbor, Cape
Cod and Islands Pilot Study. Massachusetts Office of Coastal Zone Management,
Boston, USA.
Collins, N.N., E.D. Stein, M. Sutula, R. Clark, A.E. Fetscher, L. Grenier, C. Grosso,
and A. Wiskind. 2008. California Rapid Assessment Method (CRAM) for
Wetlands, Version 5.0.2 <http://www.cramwetlands.org/documents/2008-09-
30_CRAM%205.0.2.pdf> Accessed 28 May 2009.
Cowardin, L.M, V. Carter, F.C. Golet, and E.T. LaRoe. 1979. Classification of
wetlands and deepwater habitats of the United States. U.S. Department of the
Interior, Fish and Wildlife Service, Washington D.C., USA.DE DNREC 2005.
Darby, F.A. and R. E. Turner. 2008. Effects of eutrophication on salt marsh root and
rhizome biomass accumulation. Marine Ecology Progress Series 363: 63-70.
DE DNREC. 2005. Delaware Bay and Estuary Whole Basin Assessment Report.
Delaware Department of Natural Resources and Environmental Control
Document Number 40-01-01/05/02/01, Dover, USA.
DE DNREC. 2006. Broadkill River Watershed Proposed TMDLs. Delaware
Department of Natural Resources and Environmental Control, Dover, USA.
DE DNREC. 2006. Delaware Wildlife Action Plan 2007-2017. Delaware Department
of Natural Resources and Environmental Control, Dover, USA.
DE DNREC. 2008a. Delaware Wetlands Conservation Strategy. Delaware
Department of Natural Resources and Environmental Control, Dover, USA.
DE DNREC. 2008b. Regulations governing the pollution control strategy for the
Indian River, Indian River Bay, Rehoboth Bay and Little Assawoman Bay
watersheds. Delaware Department of Natural Resources and Environmental
Control, Dover, USA.

Broadkill Watershed Wetland Report 39
Deegan, L.A., D.S. Johnson, R.S. Warren, B.J. Peterson, J.W. Fleeger, S.
Fagherazzi, and W.M. Wollheim. 2012. Coastal eutrophication as a driver of salt
marsh loss. Nature 480: 388-392.
Jacobs, A.D. 2007. Delaware Rapid Assessment Procedure Version 5.1. Delaware
Department of Natural Resources and Environmental Control, Dover, Delaware,
USA.
Jacobs, A.D., D. Whigham, D. Fillis, E. Rehm, and A. Howard. 2008. Delaware
Comprehensive Assessment Procedure Version 5.1. Delaware Department of
Natural Resources and Environmental Control, Dover, Delaware, USA.
Jacobs, A.D., M.E. Kentula, and A.T. Herlihy. 2009. Developing an index of wetland
condition from ecological data: an example using HGM functional variables from
the Nanticoke watershed, USA. Ecological Indicators.
Jacobs, A.D., A.M. Howard, and A.B. Rogerson. 2010. Mid-Atlantic Tidal Wetland
Rapid Assessment Method Version 3.0. Delaware Department of Natural
Resources and Environmental Control, Dover, USA.
Sifneos, J.C., A.T. Herlihy, A.D. Jacobs and M.E. Kentula. 2010. Calibration of the
Delaware rapid assessment protocol to a comprehensive measure of wetland
condition. Wetlands 30:1011-1022.
State of Delaware. 1994. Statewide Wetland Mapping Project (SWMP). Prepared
for the State of Delaware’s Department of Natural Resources and Environmental
Control (DNREC) and for the Department of Transportation (DELDOT), Dover,
USA.
State of Delaware. 2007. Statewide Wetland Mapping Project (SWMP). Prepared
for the State of Delaware’s Department of Natural Resources and Environmental
Control (DNREC), Dover, USA.
State of Delaware. 2012. Preparing for Tomorrow’s High Tide: Sea Level Rise
Vulnerability Assessment of the State of Delaware. Prepared for the Delaware
Sea Level Rise Advisory Committee by the Delaware Coastal Programs of the
Department of Natural Resources and Environmental Control (DNREC). Dover,
USA.
Stevens, D.L. Jr., and A.R. Olsen. 1999. Spatially restricted surveys over time for
aquatic resources. Journal of Agricultural, Biological, and Environmental
Statistics 4:415-428.
Stevens, D.L. Jr., and A.R. Olsen. 2000. Spatially-restricted random sampling
designs for design-based and model-based estimation. Pages 609-616 in Accuracy
Broadkill Watershed Wetland Report 40
2000: Proceedings of the 4th International symposium on spatial accuracy
assessment in natural resources and environmental sciences. Delft University
Press, Delft, The Netherlands.
Tiner, R.W. 2010. NWIPlus: Geospatial database or watershed-level functional
assessment. Environmental Law Institute, National Wetlands Newsletter
32(3):4-7.
http://www.fws.gov/northeast/wetlands/Publications%20PDFs%20as%20of%20M
arch_2008/Mapping/NWIPlus_NWN.pdf
Tiner, R.W., M.A. Biddle, A.D. Jacobs, A.B. Rogerson and K.G. McGuckin. 2011.
Delaware Wetlands: Status and Changes from 1992 to 2007. Cooperative
National Wetlands Inventory Publication. U.S. Fish and Wildlife Service,
Northeast Region, Hadley, MA and the Delaware Department of Natural
Resources and Environmental Control, Dover, DE. 35pp.
Turner R.E., E.M. Swenson, C.S. Milan, and T.A. Oswald. 2004. Below-ground
biomass in healthy and impaired salt marshes. Ecological Research 19:29-35.
US FWS. 2012. Prime Hook National Wildlife Refuge: Final Comprehensive
Conservation Plan and Environmental Impact Statement. U.S. Fish and
Wildlife Service, Northeast Region, Hadley, MA.
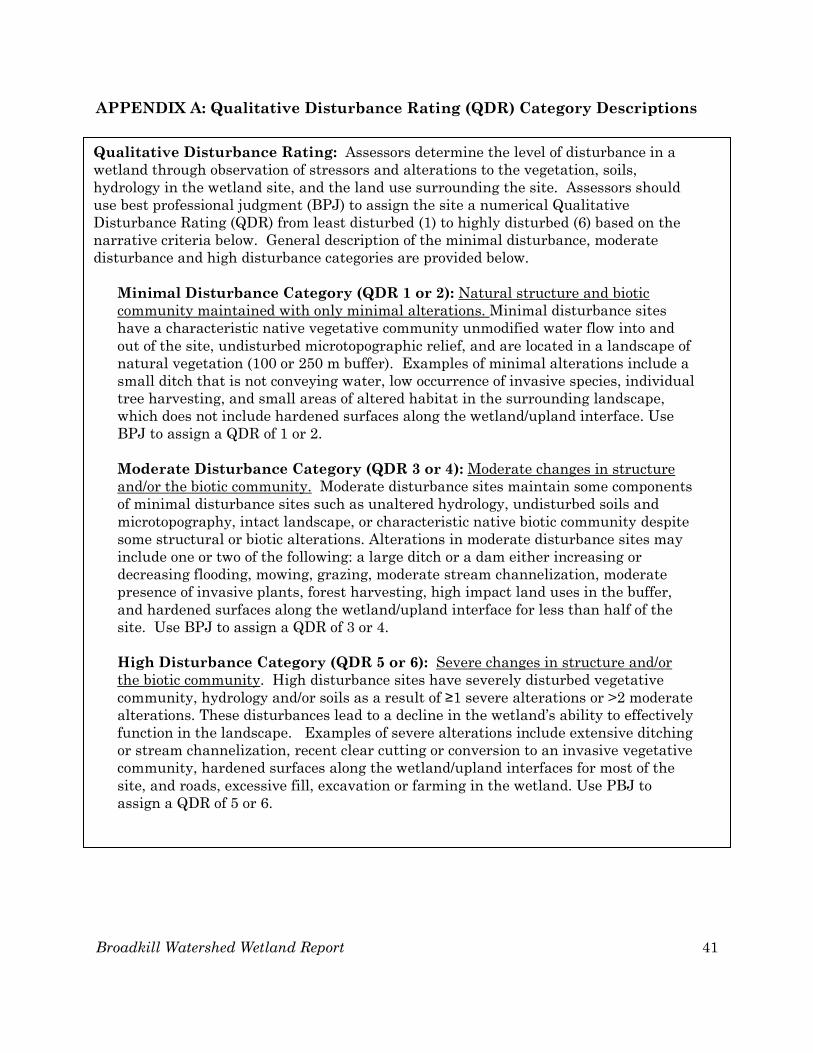
Broadkill Watershed Wetland Report 41
APPENDIX A: Qualitative Disturbance Rating (QDR) Category Descriptions
Qualitative Disturbance Rating: Assessors determine the level of disturbance in a
wetland through observation of stressors and alterations to the vegetation, soils,
hydrology in the wetland site, and the land use surrounding the site. Assessors should
use best professional judgment (BPJ) to assign the site a numerical Qualitative
Disturbance Rating (QDR) from least disturbed (1) to highly disturbed (6) based on the
narrative criteria below. General description of the minimal disturbance, moderate
disturbance and high disturbance categories are provided below.
Minimal Disturbance Category (QDR 1 or 2): Natural structure and biotic
community maintained with only minimal alterations. Minimal disturbance sites
have a characteristic native vegetative community unmodified water flow into and
out of the site, undisturbed microtopographic relief, and are located in a landscape of
natural vegetation (100 or 250 m buffer). Examples of minimal alterations include a
small ditch that is not conveying water, low occurrence of invasive species, individual
tree harvesting, and small areas of altered habitat in the surrounding landscape,
which does not include hardened surfaces along the wetland/upland interface. Use
BPJ to assign a QDR of 1 or 2.
Moderate Disturbance Category (QDR 3 or 4): Moderate changes in structure
and/or the biotic community. Moderate disturbance sites maintain some components
of minimal disturbance sites such as unaltered hydrology, undisturbed soils and
microtopography, intact landscape, or characteristic native biotic community despite
some structural or biotic alterations. Alterations in moderate disturbance sites may
include one or two of the following: a large ditch or a dam either increasing or
decreasing flooding, mowing, grazing, moderate stream channelization, moderate
presence of invasive plants, forest harvesting, high impact land uses in the buffer,
and hardened surfaces along the wetland/upland interface for less than half of the
site. Use BPJ to assign a QDR of 3 or 4.
High Disturbance Category (QDR 5 or 6): Severe changes in structure and/or
the biotic community. High disturbance sites have severely disturbed vegetative
community, hydrology and/or soils as a result of ≥1 severe alterations or >2 moderate
alterations. These disturbances lead to a decline in the wetland’s ability to effectively
function in the landscape. Examples of severe alterations include extensive ditching
or stream channelization, recent clear cutting or conversion to an invasive vegetative
community, hardened surfaces along the wetland/upland interfaces for most of the
site, and roads, excessive fill, excavation or farming in the wetland. Use PBJ to
assign a QDR of 5 or 6.

Broadkill Watershed Wetland Report 42
APPENDIX B: Nontidal Rapid Assessment Stressor Codes and Definitions
Habitat Category (within 40m radius of sample point)
Hmow Mowing in AA
Hfarm Farming activity in AA
Hgraz Grazing in AA
Hnorecov Cleared land not recovering
Hfor31 Forest age 31-50 years
Hfor16 Forest age 16-30 years
Hfor3 Forest age 3-15 years
Hfor2 Forest age ≤2 years
Hcc10 ≤10% of AA clear cut within 50 years
Hcc50 11-50% of AA clear cut within 50 years
Hcc100 >50% of AA clear cut within 50 years
Hforsc Selective cutting forestry
Hherb Excessive Herbivory/Pinebark Beetle/Gypsy Moth
Hinvdom Invasive plants dominating AA
Hinvless Invasive plants not dominating
Hchem Chemical Defoliation
Hpine Managed or Converted to Pine
Htrail Non-elevated road
Hroad Dirt or gravel elevated road in AA
Hpave Paved road in AA
Hnutapp Nutrient indicator species dominating AA
Halgae Nutrients dense algal mats
Hydrology Category (within 40m radius of sample point)
Wditchs Slight Ditching; 1-3 shallow ditches (<.3m deep) in AA
Wditchm Moderate Ditching; 3 shallow ditches (<.3m deep) in AA or 1
ditch >.3m deep within 25m of edge Wditchx Severe Ditching; >1 ditch .3-.6 m deep or 1 ditch > .6m deep
within AA Wditchfloodplain Ditching in floodplain (not including main channel)
Wchannm Channelized stream not maintained
Wchan1 Spoil bank only one side of stream
Wchan2 Spoil bank both sides of stream
Wincision Stream channel incision
Wdamdec WeirDamRoad decreasing site flooding
Wimp10 WeirDamRoad/Impounding water on <10% of AA
Wimp75 WeirDamRoad/Impounding water on 10-75% of AA
Wimp100 WeirDamRoad/Impounding water on >75% of AA
Wstorm Stormwater Inputs
Wpoint Point Source (non-stormwater)
Wfill10 Filling, excavation on <10% of AA
Wfill75 Filling, excavation on 10-75% of AA
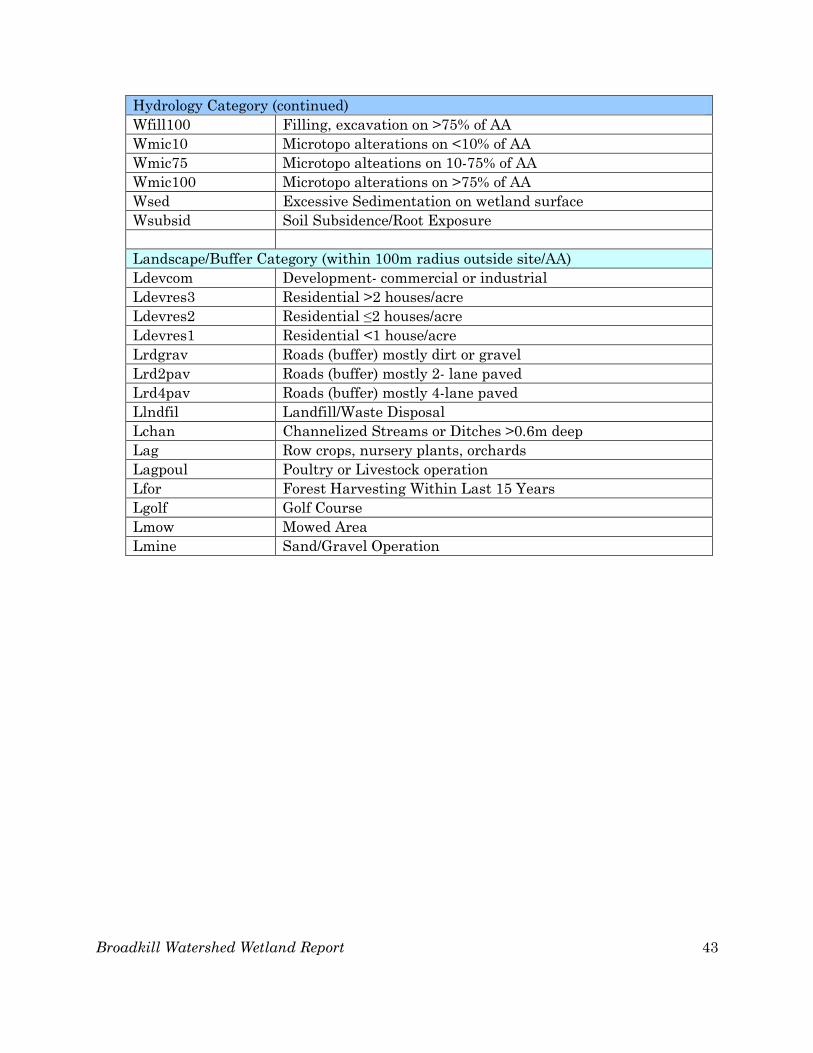
Broadkill Watershed Wetland Report 43
Hydrology Category (continued)
Wfill100 Filling, excavation on >75% of AA
Wmic10 Microtopo alterations on <10% of AA
Wmic75 Microtopo alteations on 10-75% of AA
Wmic100 Microtopo alterations on >75% of AA
Wsed Excessive Sedimentation on wetland surface
Wsubsid Soil Subsidence/Root Exposure
Landscape/Buffer Category (within 100m radius outside site/AA)
Ldevcom Development- commercial or industrial
Ldevres3 Residential >2 houses/acre
Ldevres2 Residential ≤2 houses/acre
Ldevres1 Residential <1 house/acre
Lrdgrav Roads (buffer) mostly dirt or gravel
Lrd2pav Roads (buffer) mostly 2- lane paved
Lrd4pav Roads (buffer) mostly 4-lane paved
Llndfil Landfill/Waste Disposal
Lchan Channelized Streams or Ditches >0.6m deep
Lag Row crops, nursery plants, orchards
Lagpoul Poultry or Livestock operation
Lfor Forest Harvesting Within Last 15 Years
Lgolf Golf Course
Lmow Mowed Area
Lmine Sand/Gravel Operation

Broadkill Watershed Wetland Report 44
APPENDIX C: Nontidal Rapid Assessment IWC Stressors and Weights
** Stressors with weights in boxes were combined during calibration analysis and are counted only once, even
if more than one stressor is present.
Category/Stressor Name* Code Stressor Weights**
*DERAP stressors excluded from this table are not in
the rapid IWC calculation. Flats Riverine Depression
Habitat Category (within 40m radius site)
Mowing in AA Hmow
15 3 24 Farming activity in AA Hfarm
Grazing in AA Hgraz
Cleared land not recovering in AA Hnorecov
Forest age 16-30 years Hfor16 5 4 2
≤10% of AA clear cut within 50 years Hcc10
Forest age 3-15 years Hfor3
19 7 12 Forest age ≤2 years Hfor2
11-50% of AA clear cut within 50 years Hcc50
>50% of AA clear cut within 50 years Hcc100
Excessive Herbivory Hherb 4 2 2
Invasive plants dominating Hinvdom 2 20 7
Invasive plants not dominating Hinvless 0 5 7
Chemical Defoliation Hchem 5 9 1
Managed or Converted to Pine Hpine
Non-elevated road in AA Htrail
2 2 2 Dirt or gravel elevated road in AA Hroad
Paved road in AA Hpave
Nutrient indicator species dominating AA Hnutapp 10 12 10
Nutrients dense algal mats Halgae
Hydrology Category (within 40m radius site)
Slight Ditching Wditchs 10
0
5 Moderate Ditching Wditchm 0
Severe Ditching Wditchx 17 0
Channelized stream not maintained Wchannm 0 13 0
Spoil bank only one side of stream Wchan1 0 31
0
Spoil bank both sides of stream Wchan2 0 0
Stream channel incision Wincision 0 21 0
WeirDamRoad decreasing site flooding Wdamdec
2 2 2 WeirDamRoad/Impounding <10% Wimp10
WeirDamRoad/Impounding 10-75% Wimp75
WeirDamRoad/Impounding >75% Wimp100
Stormwater Inputs Wstorm
2 2 2 Point Source (non-stormwater) Wpoint
Excessive Sedimentation Wsed

Broadkill Watershed Wetland Report 45
APPENDIX C continued
** Stressors with weights in boxes were combined during calibration analysis and are counted only once, even
if more than one stressor is present.
Hydrology Category (continued)
Filling, excavation on <10% of AA Wfill10 2 0 8
Filling, excavation on 10-75% of AA Wfill75 16 11 2
Filling, excavation on >75% of AA Wfill100
Soil Subsidence/Root Exposure Wsubsid 7 0 0
Microtopo alterations on <10% of AA Wmic10
Microtopo alteations on 10-75% of AA Wmic75 16 11 2
Microtopo alterations on >75% of AA Wmic100
Buffer Category (100m radius around site)
Development- commercial or industrial Ldevcom
1 buffer
stressor = 3
2 buffer
stressors = 6
≥ 3 buffer
stressors = 9
1 buffer
stressor = 1
2 buffer
stressors = 2
≥ 3 buffer
stressors = 3
1 buffer
stressor = 4
2 buffer
stressors = 8
≥ 3 buffer
stressors = 12
Residential >2 houses/acre Ldevres3
Residential ≤2 houses/acre Ldevres2
Residential <1 house/acre Ldevres1
Roads (buffer) mostly dirt or gravel Lrdgrav
Roads (buffer) mostly 2- lane paved Lrd2pav
Roads (buffer) mostly 4-lane paved Lrd4pav
Landfill/Waste Disposal Llndfil
Channelized Streams/ditches >0.6m deep Lchan
Row crops, nursery plants, orchards Lag
Poultry or Livestock operation Lagpoul
Forest Harvesting Within Last 15 Years Lfor
Golf Course Lgolf
Mowed Area Lmow
Sand/Gravel Operation Lmine
Intercept/Base Value 95 91 82
Flats IWCrapid= 95 -(∑weights(Habitat+Hydro+Buffer))
Riverine IWCrapid= 91 -(∑weights(Habitat+Hydro+Buffer))
Depression IWCrapid= 82 -(∑weights(Habitat+Hydro+Buffer))

Broadkill Watershed Wetland Report 46
APPENDIX D: Tidal Wetland Raw Data and Scored Metrics from MidTRAM for Broadkill River Sites * **
Site Number
(color coded by condition
group) QDR
H1: Ditching
& Draining
Score
(H2): %
Cover of fill
H2: Fill & Fragmen-
tation Score
H3: Diking &
Restriction Score
H4: Point
Source Score
(B1): % of AA with 5m-
buffer
B1: % of AA with
5m-buffer Score
(B2): Average Buffer Width
(m)
B2: Average Buffer Width Score
(B3): % develop-
ment
B3: Surrounding
Development Score
B4: 250m Landscape Condition
Score
BRT011 2 9 0 12 12 12 100 12 250 12 0 12 9
BRT026 2 12 0 12 12 12 100 12 220 12 0 12 9
BRT009 3 6 0 12 12 12 100 12 208 12 0 12 9
BRT001 2 6 0 12 12 12 100 12 250 12 0 12 9
BRT004 3 6 0 12 12 12 100 12 208 12 0 12 9
BRT007 2 3 0 12 12 12 100 12 244 12 0 12 9
BRT012 3 9 0 12 12 12 100 12 230 12 1.5 9 9
BRT019 3 6 2 9 12 12 100 12 202 12 5 9 9
BRT013 2 3 2 9 12 12 100 12 250 12 0 12 9
BRT028 3 6 0 12 12 12 100 12 218 12 0 12 9
BRT038 2 6 0 12 12 12 100 12 233 12 0 12 9
BRT024 3 3 0 12 12 12 100 12 250 12 0 12 9
BRT030 4 6 1 9 12 12 100 12 214 12 3 9 6
BRT034 4 12 0 12 12 12 100 12 177 9 42.5 3 6
BRT018 2 6 1 9 6 12 100 12 250 12 0 12 9
BRT035 4 6 0 12 12 12 100 12 200 12 25 3 6
BRT003 4 6 0 12 12 12 100 12 185 9 1.5 9 6
BRT017 2 6 5 6 12 12 100 12 189 9 0 12 9
BRT005 4 3 0 12 12 12 100 12 250 12 0 12 6
* Green columns indicate scored metric values; blue columns indicate raw variable values. Site numbers are colored by condition category, see Figure 8.
** Site numbers are colored by condition category (Green is minimally stressed, yellow is moderately stressed, orange is severely stressed)
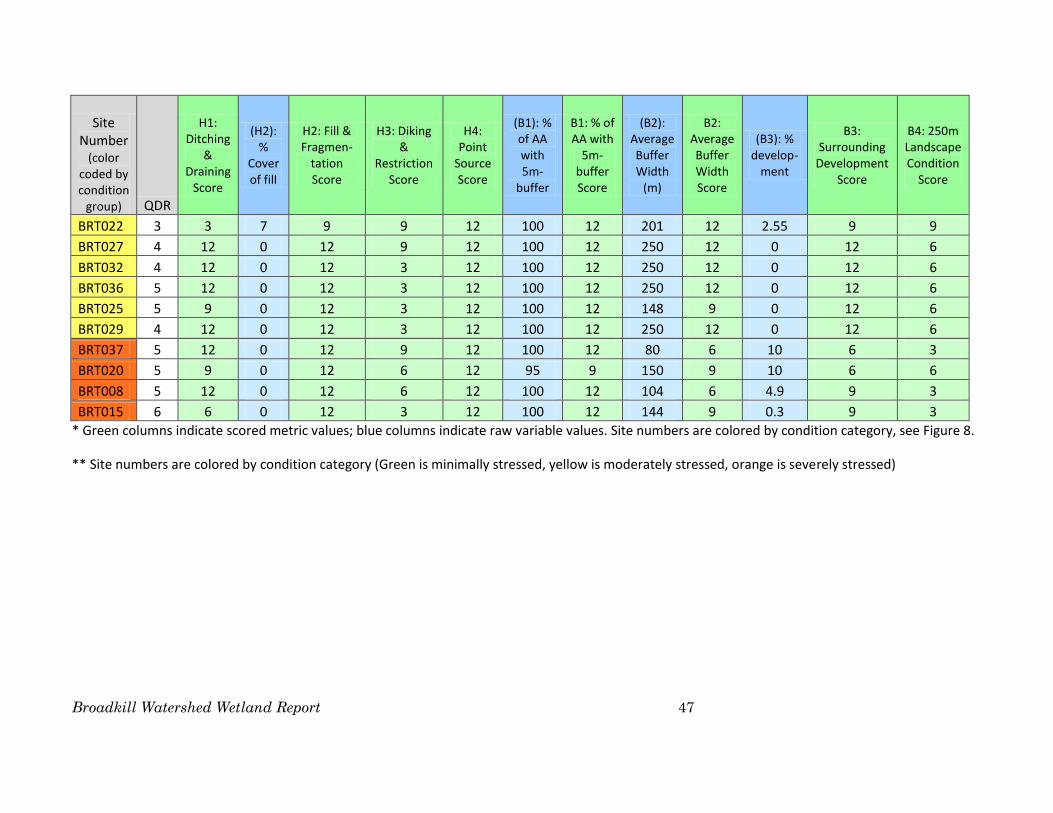
Broadkill Watershed Wetland Report 47
Site Number
(color coded by condition
group) QDR
H1: Ditching
& Draining
Score
(H2): %
Cover of fill
H2: Fill & Fragmen-
tation Score
H3: Diking &
Restriction Score
H4: Point
Source Score
(B1): % of AA with 5m-
buffer
B1: % of AA with
5m-buffer Score
(B2): Average Buffer Width
(m)
B2: Average Buffer Width Score
(B3): % develop-
ment
B3: Surrounding
Development Score
B4: 250m Landscape Condition
Score
BRT022 3 3 7 9 9 12 100 12 201 12 2.55 9 9
BRT027 4 12 0 12 9 12 100 12 250 12 0 12 6
BRT032 4 12 0 12 3 12 100 12 250 12 0 12 6
BRT036 5 12 0 12 3 12 100 12 250 12 0 12 6
BRT025 5 9 0 12 3 12 100 12 148 9 0 12 6
BRT029 4 12 0 12 3 12 100 12 250 12 0 12 6
BRT037 5 12 0 12 9 12 100 12 80 6 10 6 3
BRT020 5 9 0 12 6 12 95 9 150 9 10 6 6
BRT008 5 12 0 12 6 12 100 12 104 6 4.9 9 3
BRT015 6 6 0 12 3 12 100 12 144 9 0.3 9 3
* Green columns indicate scored metric values; blue columns indicate raw variable values. Site numbers are colored by condition category, see Figure 8.
** Site numbers are colored by condition category (Green is minimally stressed, yellow is moderately stressed, orange is severely stressed)

Broadkill Watershed Wetland Report 48
APPENDIX D continued laterally
Site Number
(color coded by condition
group) QDR
(B5): % Obstructed Shoreline
B5: Barriers
to Landward Migration
Score
(HAB1): Avg
Bearing Capacity
(cm)
HAB1: Bearing Capacity
Score
(HAB2:) Avg. Veg
Obstruction
HAB2: Vegetative
Obstruction Score
(HAB3): Number of Plant Layers
HAB3: Number of Plant Layers Score
(HAB4): % Co-
dominant Invasive
Plant Species
HAB4: % Co-
dominant Invasive
Plant Species Score
(HAB5): % Cover
of Invasive Plants
HAB5: %
Invasive Score
BRT011 2 0 12 1.81 12 20 6 3 9 0 12 0 12
BRT026 2 0 12 7.10 3 5.75 12 3 9 0 12 1 9
BRT009 3 0 12 1.72 12 18.5 6 2 9 0 12 0 12
BRT001 2 0 12 5.21 6 11.25 9 2 9 0 12 0 12
BRT004 3 0 12 3.45 9 14.75 6 3 9 0 12 3 9
BRT007 2 0 12 1.28 12 20 6 2 9 0 12 0 12
BRT012 3 0 12 3.80 9 15.5 6 2 9 0 12 3 9
BRT019 3 0 12 1.03 12 18.5 6 2 9 0 12 0 12
BRT013 2 0 12 1.88 12 20 6 3 9 0 12 0 12
BRT028 3 0 12 5.25 6 26 3 2 9 0 12 0 12
BRT038 2 0 12 7.22 3 20.5 6 3 9 0 12 0 12
BRT024 3 0 12 2.69 9 15 6 3 9 0 12 2.5 9
BRT030 4 0 12 1.47 12 25 3 2 9 0 12 0 12
BRT034 4 7 9 5.04 6 5 12 3 9 0 12 2 9
BRT018 2 0 12 1.34 12 20.5 6 2 9 0 12 1 9
BRT035 4 0 12 3.16 9 15 6 4 12 0 12 2 9
BRT003 4 0 12 2.59 9 12.5 6 3 9 0 12 1 9
BRT017 2 0 12 1.38 12 24.75 3 2 9 0 12 0.25 9
BRT005 4 0 12 3.02 9 22.25 3 3 9 33 6 5 9
BRT022 3 25 6 1.38 12 22.5 3 3 9 0 12 0 12
BRT027 4 0 12 5.59 6 4.25 9 1 6 50 3 98 3
* Green columns indicate scored metric values; blue columns indicate raw variable values. Site numbers are colored by condition category, see Figure 8.
** Site numbers are colored by condition category (Green is minimally stressed, yellow is moderately stressed, orange is severely stressed)

Broadkill Watershed Wetland Report 49
Site Number
(color coded by condition
group) QDR
(B5): % Obstructed Shoreline
B5: Barriers
to Landward Migration
Score
(HAB1): Avg
Bearing Capacity
(cm)
HAB1: Bearing Capacity
Score
(HAB2:) Avg. Veg
Obstruction
HAB2: Vegetative
Obstruction Score
(HAB3): Number of Plant Layers
HAB3: Number of Plant Layers Score
(HAB4): % Co-
dominant Invasive
Plant Species
HAB4: % Co-
dominant Invasive
Plant Species Score
(HAB5): % Cover
of Invasive Plants
HAB5: %
Invasive Score
BRT032 4 0 12 3.06 9 10.5 9 3 9 50 3 60 3
BRT036 5 0 12 3.72 9 9.75 9 3 9 80 3 90 3
BRT025 5 0 12 5.38 6 17 6 3 9 25 9 3 9
BRT029 4 0 12 6.81 3 5.25 12 2 9 100 3 95 3
BRT037 5 0 12 5.41 6 3.6 12 1 6 100 3 98 3
BRT020 5 0 12 5.94 6 5.25 12 3 9 67 3 80 3
BRT008 5 40 3 1.03 12 10.25 9 2 9 67 3 78 3
BRT015 6 50 3 3.47 9 26 3 1 6 0 12 0.5 9
* Green columns indicate scored metric values; blue columns indicate raw variable values. Site numbers are colored by condition category, see Figure 8.
** Site numbers are colored by condition category (Green is minimally stressed, yellow is moderately stressed, orange is severely stressed)

Broadkill Watershed Wetland Report 50
APPENDIX E: Vegetative Biomass Data for Broadkill River Tidal Sites 2010
Site Number Above Live
Above Dead
Total Above Below Live
Below Dead
Total Below
Above Live: Below Live
Above Dead: Below Dead
Total Above: Total Below
BRT001 22.087 6.153 28.240 22.250 83.803 106.053 0.266 0.993 0.073
BRT005 6.987 5.717 12.703 30.730 145.933 176.663 0.072 0.227 0.039
BRT009 9.053 4.917 13.970 25.220 157.633 182.853 0.076 0.359 0.031
BRT011 8.723 2.843 11.567 17.520 149.950 167.470 0.069 0.498 0.019
BRT013 9.707 4.377 14.083 23.090 148.683 171.773 0.082 0.420 0.029
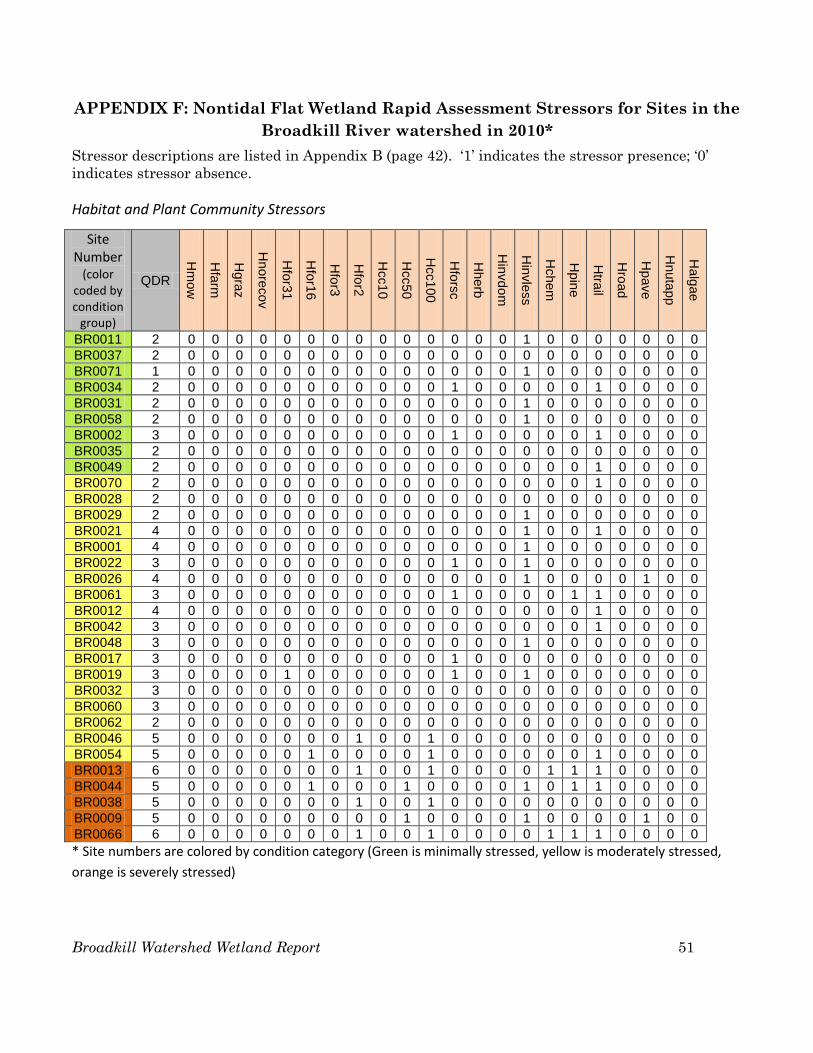
Broadkill Watershed Wetland Report 51
APPENDIX F: Nontidal Flat Wetland Rapid Assessment Stressors for Sites in the
Broadkill River watershed in 2010*
Stressor descriptions are listed in Appendix B (page 42). ‘1’ indicates the stressor presence; ‘0’
indicates stressor absence.
Habitat and Plant Community Stressors
Site Number
(color coded by condition
group)
QDR
Hm
ow
Hfa
rm
Hgra
z
Hnore
cov
Hfo
r31
Hfo
r16
Hfo
r3
Hfo
r2
Hcc10
Hcc50
Hcc100
Hfo
rsc
Hherb
Hin
vdo
m
Hin
vle
ss
Hchem
Hpin
e
Htra
il
Hro
ad
Hpave
Hnuta
pp
Halg
ae
BR0011 2 0 0 0 0 0 0 0 0 0 0 0 0 0 0 1 0 0 0 0 0 0 0
BR0037 2 0 0 0 0 0 0 0 0 0 0 0 0 0 0 0 0 0 0 0 0 0 0
BR0071 1 0 0 0 0 0 0 0 0 0 0 0 0 0 0 1 0 0 0 0 0 0 0
BR0034 2 0 0 0 0 0 0 0 0 0 0 0 1 0 0 0 0 0 1 0 0 0 0
BR0031 2 0 0 0 0 0 0 0 0 0 0 0 0 0 0 1 0 0 0 0 0 0 0
BR0058 2 0 0 0 0 0 0 0 0 0 0 0 0 0 0 1 0 0 0 0 0 0 0
BR0002 3 0 0 0 0 0 0 0 0 0 0 0 1 0 0 0 0 0 1 0 0 0 0
BR0035 2 0 0 0 0 0 0 0 0 0 0 0 0 0 0 0 0 0 0 0 0 0 0
BR0049 2 0 0 0 0 0 0 0 0 0 0 0 0 0 0 0 0 0 1 0 0 0 0
BR0070 2 0 0 0 0 0 0 0 0 0 0 0 0 0 0 0 0 0 1 0 0 0 0
BR0028 2 0 0 0 0 0 0 0 0 0 0 0 0 0 0 0 0 0 0 0 0 0 0
BR0029 2 0 0 0 0 0 0 0 0 0 0 0 0 0 0 1 0 0 0 0 0 0 0
BR0021 4 0 0 0 0 0 0 0 0 0 0 0 0 0 0 1 0 0 1 0 0 0 0
BR0001 4 0 0 0 0 0 0 0 0 0 0 0 0 0 0 1 0 0 0 0 0 0 0
BR0022 3 0 0 0 0 0 0 0 0 0 0 0 1 0 0 1 0 0 0 0 0 0 0
BR0026 4 0 0 0 0 0 0 0 0 0 0 0 0 0 0 1 0 0 0 0 1 0 0
BR0061 3 0 0 0 0 0 0 0 0 0 0 0 1 0 0 0 0 1 1 0 0 0 0
BR0012 4 0 0 0 0 0 0 0 0 0 0 0 0 0 0 0 0 0 1 0 0 0 0
BR0042 3 0 0 0 0 0 0 0 0 0 0 0 0 0 0 0 0 0 1 0 0 0 0
BR0048 3 0 0 0 0 0 0 0 0 0 0 0 0 0 0 1 0 0 0 0 0 0 0
BR0017 3 0 0 0 0 0 0 0 0 0 0 0 1 0 0 0 0 0 0 0 0 0 0
BR0019 3 0 0 0 0 1 0 0 0 0 0 0 1 0 0 1 0 0 0 0 0 0 0
BR0032 3 0 0 0 0 0 0 0 0 0 0 0 0 0 0 0 0 0 0 0 0 0 0
BR0060 3 0 0 0 0 0 0 0 0 0 0 0 0 0 0 0 0 0 0 0 0 0 0
BR0062 2 0 0 0 0 0 0 0 0 0 0 0 0 0 0 0 0 0 0 0 0 0 0
BR0046 5 0 0 0 0 0 0 0 1 0 0 1 0 0 0 0 0 0 0 0 0 0 0
BR0054 5 0 0 0 0 0 1 0 0 0 0 1 0 0 0 0 0 0 1 0 0 0 0
BR0013 6 0 0 0 0 0 0 0 1 0 0 1 0 0 0 0 1 1 1 0 0 0 0
BR0044 5 0 0 0 0 0 1 0 0 0 1 0 0 0 0 1 0 1 1 0 0 0 0
BR0038 5 0 0 0 0 0 0 0 1 0 0 1 0 0 0 0 0 0 0 0 0 0 0
BR0009 5 0 0 0 0 0 0 0 0 0 1 0 0 0 0 1 0 0 0 0 1 0 0
BR0066 6 0 0 0 0 0 0 0 1 0 0 1 0 0 0 0 1 1 1 0 0 0 0
* Site numbers are colored by condition category (Green is minimally stressed, yellow is moderately stressed,
orange is severely stressed)

Broadkill Watershed Wetland Report 52
Appendix F continued
Hydrology Stressors
Site Number (color
coded by condition group)
QDR
Wd
itchs
Wd
itchm
Wd
itchx
Wd
itchflo
od
pla
in
Wchan
nm
Wchan
1
Wchan
2
Win
cis
ion
Wda
mdec
Wim
p1
0
Wim
p7
5
Wim
p1
00
Wsto
rm
Wpo
int
Wsed
Wfill1
0
Wfill7
5
Wfill1
00
Wm
ic10
Wm
ic75
Wm
ic100
Wsubsid
BR0011 2 0 0 0 0 0 0 0 0 0 0 0 0 0 0 0 0 0 0 0 0 0 0
BR0037 2 0 1 0 0 0 0 0 0 0 0 0 0 0 0 0 1 0 0 0 0 0 0
BR0071 1 0 0 0 0 0 0 0 0 0 0 0 0 0 0 0 0 0 0 0 0 0 0
BR0034 2 0 0 0 0 0 0 0 0 0 0 0 0 0 0 0 0 0 0 0 0 0 0
BR0031 2 0 0 0 0 0 0 0 0 0 0 0 0 0 0 0 0 0 0 0 0 0 0
BR0058 2 0 0 0 0 0 0 0 0 0 0 0 0 0 0 0 0 0 0 0 0 0 0
BR0002 3 0 0 0 0 0 0 0 0 0 0 0 0 0 0 0 1 0 0 0 0 0 0
BR0035 2 0 0 0 0 0 0 0 0 0 0 0 0 0 0 0 0 0 0 1 0 0 0
BR0049 2 0 0 0 0 0 0 0 0 0 0 0 0 0 0 0 1 0 0 0 0 0 0
BR0070 2 0 0 0 0 0 0 0 0 0 0 0 0 0 0 0 0 0 0 0 0 0 0
BR0028 2 0 0 0 0 0 0 0 0 0 0 0 0 0 0 0 0 0 0 0 0 0 0
BR0029 2 0 0 0 0 0 0 0 0 0 0 0 0 0 0 0 0 0 0 0 0 0 0
BR0021 4 0 0 0 0 0 0 0 0 0 0 0 0 0 0 0 1 0 0 0 0 0 0
BR0001 4 0 0 0 0 0 0 0 0 0 0 0 0 0 0 0 0 0 0 0 0 0 0
BR0022 3 0 0 0 0 0 0 0 0 0 0 0 0 0 0 0 1 0 0 1 0 0 0
BR0026 4 0 0 0 0 0 0 0 0 0 0 0 0 0 0 0 1 0 0 0 0 0 0
BR0061 3 0 0 0 0 0 0 0 0 0 0 0 0 0 0 0 0 0 0 0 0 0 0
BR0012 4 0 0 0 0 0 0 0 0 0 0 0 0 0 0 0 1 0 0 1 0 0 0
BR0042 3 1 0 0 0 0 0 0 0 0 0 0 0 0 0 0 1 0 0 0 0 0 0
BR0048 3 0 1 0 0 0 0 0 0 0 0 0 0 0 0 0 1 0 0 0 0 0 0
BR0017 3 0 0 0 0 0 0 0 0 0 0 0 0 0 0 0 0 0 0 1 0 0 0
BR0019 3 1 0 0 0 0 0 0 0 0 0 0 0 0 0 0 0 0 0 0 0 0 0
BR0032 3 0 0 0 0 0 0 0 0 0 0 0 0 0 0 0 0 0 0 1 0 0 0
BR0060 3 0 0 0 0 0 0 0 0 0 0 0 0 0 0 0 0 0 0 1 0 0 0
BR0062 2 1 0 0 0 0 0 0 0 0 0 0 0 0 0 0 0 0 0 0 0 0 0
BR0046 5 0 0 0 0 0 0 0 0 0 0 0 0 0 0 0 0 0 0 0 0 0 0
BR0054 5 0 0 0 0 0 0 0 0 0 0 0 0 0 0 0 0 0 0 0 0 0 0
BR0013 6 0 0 0 0 0 0 0 0 0 0 0 0 0 0 0 0 0 0 0 0 0 0
BR0044 5 0 0 0 0 0 0 0 0 0 0 0 0 0 0 0 0 0 0 1 0 0 0
BR0038 5 1 0 0 0 0 0 0 0 0 0 0 0 0 0 0 0 0 0 0 0 1 0
BR0009 5 1 0 0 0 0 0 0 0 0 0 0 0 0 0 0 1 0 0 0 1 0 0
BR0066 6 0 0 1 0 0 0 0 0 0 0 0 0 0 0 0 0 1 0 0 1 0 0
* Site numbers are colored by condition category (Green is minimally stressed, yellow is moderately stressed,
orange is severely stressed)

Broadkill Watershed Wetland Report 53
Appendix F continued
Buffer Stressors
Site Number (color
coded by condition
group)
QDR
Ldevcom
Ldevre
s3
Ldevre
s2
Ldevre
s1
Lrd
gra
v
Lrd
2p
av
Lrd
4p
av
Lln
dfil
Lchan
Lag
Lagp
ou
l
Lfo
r
Lgo
lf
Lm
ow
Lm
ine
BR0011 2 0 0 0 0 0 0 0 0 0 0 0 0 0 0 0
BR0037 2 0 0 0 0 0 1 0 0 1 1 0 0 0 0 0
BR0071 1 0 0 0 0 0 0 0 0 0 0 0 0 0 0 0
BR0034 2 0 0 0 0 0 0 0 0 0 0 0 0 0 0 0
BR0031 2 0 0 0 0 0 0 0 0 0 1 0 0 0 0 0
BR0058 2 0 0 0 0 0 0 0 0 0 0 0 1 0 0 0
BR0002 3 0 0 0 0 0 0 0 0 0 0 0 0 0 0 0
BR0035 2 0 0 0 0 0 0 0 0 0 0 0 0 0 0 0
BR0049 2 0 0 0 0 0 0 0 0 0 0 0 1 0 0 0
BR0070 2 1 0 0 0 0 0 0 0 1 0 0 0 0 0 0
BR0028 2 0 0 0 0 0 0 0 0 1 1 0 1 0 0 0
BR0029 2 0 0 0 0 1 0 0 0 1 0 0 0 0 1 0
BR0021 4 0 0 0 1 0 1 0 0 0 0 0 0 0 0 0
BR0001 4 0 0 0 0 0 1 0 0 1 1 0 0 0 0 0
BR0022 3 0 0 0 0 0 0 0 0 1 0 0 0 0 0 0
BR0026 4 0 0 0 0 0 1 0 1 0 0 0 1 0 0 0
BR0061 3 0 0 0 0 0 1 0 0 0 0 0 1 0 0 0
BR0012 4 0 0 0 0 0 0 0 0 0 1 0 0 0 0 0
BR0042 3 0 0 0 0 0 0 0 0 0 0 0 0 0 0 0
BR0048 3 0 0 0 0 0 0 0 0 0 0 0 0 0 1 0
BR0017 3 0 0 0 0 0 1 0 0 1 1 0 0 0 1 0
BR0019 3 0 0 0 0 0 0 0 0 1 0 0 1 0 0 0
BR0032 3 0 0 0 1 0 1 0 0 1 1 0 0 0 0 0
BR0060 3 0 0 0 1 1 0 0 0 0 1 0 0 0 0 0
BR0062 2 0 0 0 0 0 0 0 0 0 1 0 1 0 0 0
BR0046 5 0 0 0 0 0 0 0 0 1 0 0 1 0 0 0
BR0054 5 0 0 0 0 0 0 0 0 1 0 0 1 0 0 0
BR0013 6 0 0 0 0 0 0 0 0 1 0 0 1 0 0 0
BR0044 5 0 0 0 0 1 0 0 0 0 0 0 1 0 0 0
BR0038 5 0 0 0 0 0 0 0 0 0 0 0 1 0 0 0
BR0009 5 0 0 0 0 0 1 0 0 0 0 0 1 0 0 0
BR0066 6 0 0 0 0 0 0 0 0 1 0 0 1 0 0 0
* Site numbers are colored by condition category (Green is minimally stressed, yellow is moderately stressed,
orange is severely stressed)
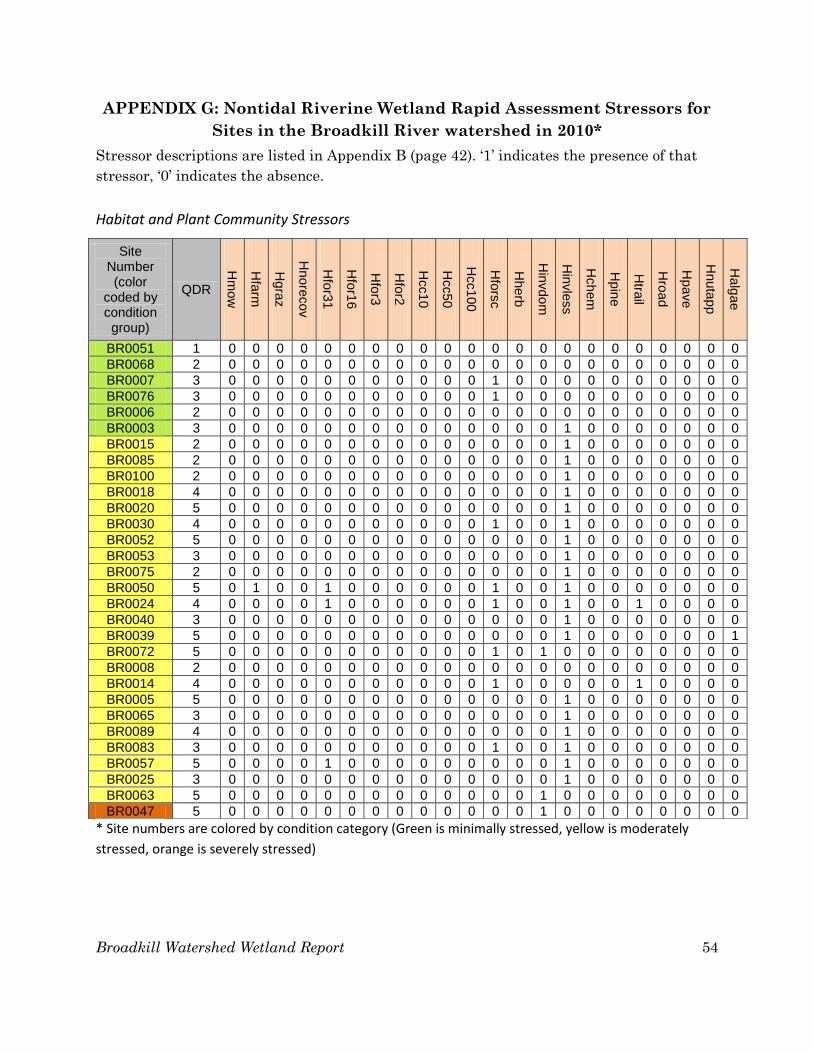
Broadkill Watershed Wetland Report 54
APPENDIX G: Nontidal Riverine Wetland Rapid Assessment Stressors for
Sites in the Broadkill River watershed in 2010*
Stressor descriptions are listed in Appendix B (page 42). ‘1’ indicates the presence of that
stressor, ‘0’ indicates the absence.
Habitat and Plant Community Stressors
* Site numbers are colored by condition category (Green is minimally stressed, yellow is moderately
stressed, orange is severely stressed)
Site Number (color
coded by condition group)
QDR
Hm
ow
Hfa
rm
Hgra
z
Hnore
cov
Hfo
r31
Hfo
r16
Hfo
r3
Hfo
r2
Hcc10
Hcc50
Hcc100
Hfo
rsc
Hherb
Hin
vdo
m
Hin
vle
ss
Hchem
Hpin
e
Htra
il
Hro
ad
Hpave
Hnuta
pp
Halg
ae
BR0051 1 0 0 0 0 0 0 0 0 0 0 0 0 0 0 0 0 0 0 0 0 0 0
BR0068 2 0 0 0 0 0 0 0 0 0 0 0 0 0 0 0 0 0 0 0 0 0 0
BR0007 3 0 0 0 0 0 0 0 0 0 0 0 1 0 0 0 0 0 0 0 0 0 0
BR0076 3 0 0 0 0 0 0 0 0 0 0 0 1 0 0 0 0 0 0 0 0 0 0
BR0006 2 0 0 0 0 0 0 0 0 0 0 0 0 0 0 0 0 0 0 0 0 0 0
BR0003 3 0 0 0 0 0 0 0 0 0 0 0 0 0 0 1 0 0 0 0 0 0 0
BR0015 2 0 0 0 0 0 0 0 0 0 0 0 0 0 0 1 0 0 0 0 0 0 0
BR0085 2 0 0 0 0 0 0 0 0 0 0 0 0 0 0 1 0 0 0 0 0 0 0
BR0100 2 0 0 0 0 0 0 0 0 0 0 0 0 0 0 1 0 0 0 0 0 0 0
BR0018 4 0 0 0 0 0 0 0 0 0 0 0 0 0 0 1 0 0 0 0 0 0 0
BR0020 5 0 0 0 0 0 0 0 0 0 0 0 0 0 0 1 0 0 0 0 0 0 0
BR0030 4 0 0 0 0 0 0 0 0 0 0 0 1 0 0 1 0 0 0 0 0 0 0
BR0052 5 0 0 0 0 0 0 0 0 0 0 0 0 0 0 1 0 0 0 0 0 0 0
BR0053 3 0 0 0 0 0 0 0 0 0 0 0 0 0 0 1 0 0 0 0 0 0 0
BR0075 2 0 0 0 0 0 0 0 0 0 0 0 0 0 0 1 0 0 0 0 0 0 0
BR0050 5 0 1 0 0 1 0 0 0 0 0 0 1 0 0 1 0 0 0 0 0 0 0
BR0024 4 0 0 0 0 1 0 0 0 0 0 0 1 0 0 1 0 0 1 0 0 0 0
BR0040 3 0 0 0 0 0 0 0 0 0 0 0 0 0 0 1 0 0 0 0 0 0 0
BR0039 5 0 0 0 0 0 0 0 0 0 0 0 0 0 0 1 0 0 0 0 0 0 1
BR0072 5 0 0 0 0 0 0 0 0 0 0 0 1 0 1 0 0 0 0 0 0 0 0
BR0008 2 0 0 0 0 0 0 0 0 0 0 0 0 0 0 0 0 0 0 0 0 0 0
BR0014 4 0 0 0 0 0 0 0 0 0 0 0 1 0 0 0 0 0 1 0 0 0 0
BR0005 5 0 0 0 0 0 0 0 0 0 0 0 0 0 0 1 0 0 0 0 0 0 0
BR0065 3 0 0 0 0 0 0 0 0 0 0 0 0 0 0 1 0 0 0 0 0 0 0
BR0089 4 0 0 0 0 0 0 0 0 0 0 0 0 0 0 1 0 0 0 0 0 0 0
BR0083 3 0 0 0 0 0 0 0 0 0 0 0 1 0 0 1 0 0 0 0 0 0 0
BR0057 5 0 0 0 0 1 0 0 0 0 0 0 0 0 0 1 0 0 0 0 0 0 0
BR0025 3 0 0 0 0 0 0 0 0 0 0 0 0 0 0 1 0 0 0 0 0 0 0
BR0063 5 0 0 0 0 0 0 0 0 0 0 0 0 0 1 0 0 0 0 0 0 0 0
BR0047 5 0 0 0 0 0 0 0 0 0 0 0 0 0 1 0 0 0 0 0 0 0 0

Broadkill Watershed Wetland Report 55
Appendix G continued
Hydrology Stressors
Site Number (color
coded by condition group)
QDR
Wd
itchs
Wd
itchm
Wd
itchx
Wd
itchflo
od
pla
in
Wchan
nm
Wchan
1
Wchan
2
Win
cis
ion
Wda
mdec
Wim
p1
0
Wim
p7
5
Wim
p1
00
Wsto
rm
Wpo
int
Wsed
Wfill1
0
Wfill7
5
Wfill1
00
Wm
ic10
Wm
ic75
Wm
ic100
Wsubsid
BR0051 1 0 0 0 0 0 0 0 0 0 0 0 0 0 0 0 0 0 0 0 0 0 0
BR0068 2 0 0 0 0 0 0 0 0 0 0 0 0 0 0 0 0 0 0 0 0 0 0
BR0007 3 0 0 0 0 0 0 0 0 0 0 0 0 0 0 0 1 0 0 1 0 0 0
BR0076 3 0 0 0 0 0 0 0 0 0 0 0 0 0 0 0 0 0 0 0 0 0 0
BR0006 2 0 0 0 0 0 0 0 0 0 0 0 0 0 0 0 1 0 0 0 0 0 0
BR0003 3 0 0 0 0 0 0 0 0 0 0 0 0 0 0 0 0 0 0 0 0 0 0
BR0015 2 0 0 0 0 0 0 0 0 0 0 0 0 0 0 0 0 0 0 0 0 0 0
BR0085 2 0 0 0 0 0 0 0 0 0 0 0 0 0 0 0 0 0 0 0 0 0 0
BR0100 2 0 0 0 0 0 0 0 0 0 0 0 0 0 0 0 0 0 0 0 0 0 0
BR0018 4 0 0 0 0 0 0 0 0 0 0 0 0 0 0 0 0 0 0 0 0 0 0
BR0020 5 0 0 0 0 0 0 0 0 0 0 0 0 0 0 0 0 0 0 0 0 0 0
BR0030 4 0 0 0 0 0 0 0 0 0 0 0 0 0 0 0 0 0 0 0 0 0 0
BR0052 5 0 0 0 0 1 0 0 0 0 0 0 0 0 0 0 0 0 0 0 0 0 0
BR0053 3 0 0 0 0 0 0 0 0 0 0 0 0 0 0 0 0 0 0 0 0 0 0
BR0075 2 0 0 0 0 0 0 0 0 0 0 0 0 0 0 0 0 0 0 0 0 0 0
BR0050 5 0 0 0 0 0 0 0 0 0 0 0 0 0 0 0 0 0 0 0 0 0 0
BR0024 4 0 0 0 0 0 0 0 0 0 0 0 0 0 0 0 1 0 0 1 0 0 0
BR0040 3 0 0 0 0 0 0 0 0 0 0 0 0 0 0 0 0 0 0 1 0 0 0
BR0039 5 0 0 0 0 0 0 0 0 0 0 0 0 0 0 0 0 0 0 0 0 0 0
BR0072 5 0 0 0 0 0 0 0 0 0 0 0 0 0 0 0 0 0 0 0 0 0 0
BR0008 2 0 0 0 0 0 0 0 1 0 0 0 0 0 0 0 0 0 0 0 0 0 0
BR0014 4 0 0 0 0 0 0 0 1 0 0 0 0 0 0 0 0 0 0 0 0 0 0
BR0005 5 0 0 0 0 0 0 0 1 0 0 0 0 0 0 0 0 0 0 0 0 0 0
BR0065 3 0 0 0 0 0 0 0 1 0 0 0 0 0 0 0 0 0 0 0 0 0 0
BR0089 4 0 0 0 0 0 0 0 1 0 0 0 0 0 0 0 0 0 0 0 0 0 0
BR0083 3 0 0 0 0 0 0 0 1 0 0 0 0 1 0 0 0 0 0 0 0 0 0
BR0057 5 0 0 0 0 0 0 1 0 0 0 0 0 0 0 0 0 0 0 0 0 0 1
BR0025 3 0 0 0 0 0 1 0 0 0 0 0 0 0 0 0 0 0 0 0 0 0 0
BR0063 5 0 0 0 0 0 0 0 1 0 0 0 0 0 0 0 0 0 0 0 0 0 0
BR0047 5 0 0 0 0 0 1 0 0 0 0 0 0 0 0 0 0 0 0 0 0 0 0
* Site numbers are colored by condition category (Green is minimally stressed, yellow is moderately
stressed, orange is severely stressed)
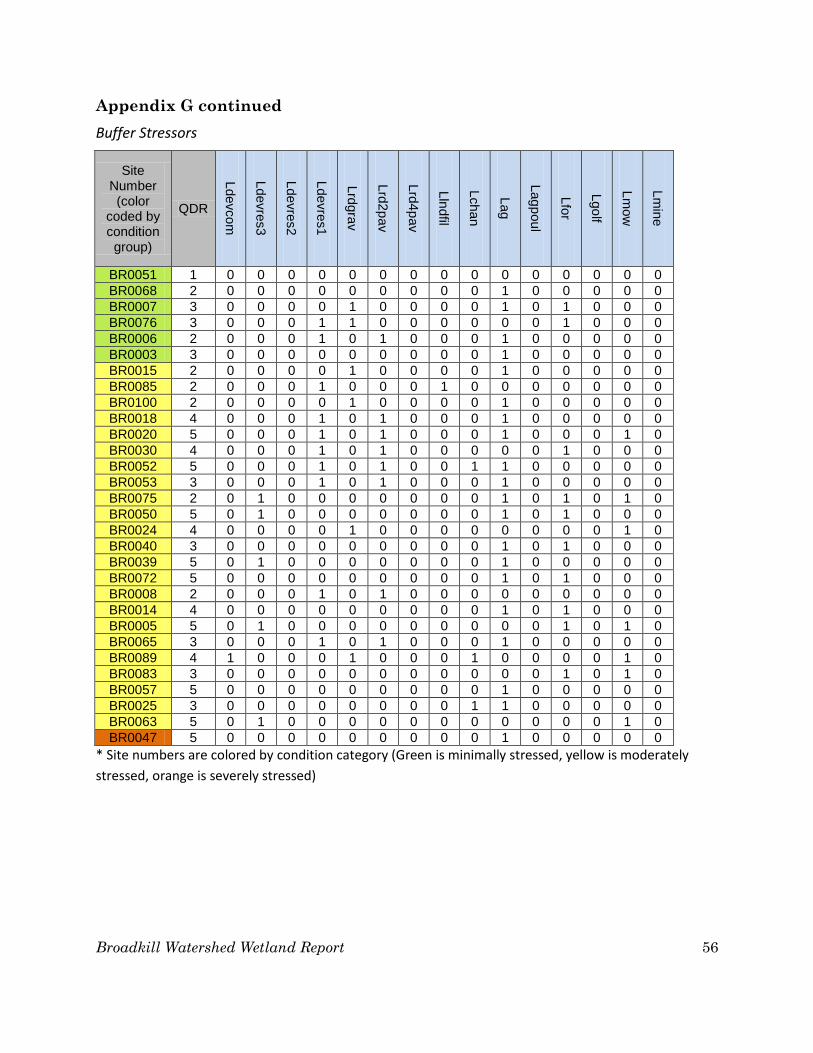
Broadkill Watershed Wetland Report 56
Appendix G continued
Buffer Stressors
Site Number (color
coded by condition group)
QDR
Ldevcom
Ldevre
s3
Ldevre
s2
Ldevre
s1
Lrd
gra
v
Lrd
2p
av
Lrd
4p
av
Lln
dfil
Lchan
Lag
Lagp
ou
l
Lfo
r
Lgo
lf
Lm
ow
Lm
ine
BR0051 1 0 0 0 0 0 0 0 0 0 0 0 0 0 0 0
BR0068 2 0 0 0 0 0 0 0 0 0 1 0 0 0 0 0
BR0007 3 0 0 0 0 1 0 0 0 0 1 0 1 0 0 0
BR0076 3 0 0 0 1 1 0 0 0 0 0 0 1 0 0 0
BR0006 2 0 0 0 1 0 1 0 0 0 1 0 0 0 0 0
BR0003 3 0 0 0 0 0 0 0 0 0 1 0 0 0 0 0
BR0015 2 0 0 0 0 1 0 0 0 0 1 0 0 0 0 0
BR0085 2 0 0 0 1 0 0 0 1 0 0 0 0 0 0 0
BR0100 2 0 0 0 0 1 0 0 0 0 1 0 0 0 0 0
BR0018 4 0 0 0 1 0 1 0 0 0 1 0 0 0 0 0
BR0020 5 0 0 0 1 0 1 0 0 0 1 0 0 0 1 0
BR0030 4 0 0 0 1 0 1 0 0 0 0 0 1 0 0 0
BR0052 5 0 0 0 1 0 1 0 0 1 1 0 0 0 0 0
BR0053 3 0 0 0 1 0 1 0 0 0 1 0 0 0 0 0
BR0075 2 0 1 0 0 0 0 0 0 0 1 0 1 0 1 0
BR0050 5 0 1 0 0 0 0 0 0 0 1 0 1 0 0 0
BR0024 4 0 0 0 0 1 0 0 0 0 0 0 0 0 1 0
BR0040 3 0 0 0 0 0 0 0 0 0 1 0 1 0 0 0
BR0039 5 0 1 0 0 0 0 0 0 0 1 0 0 0 0 0
BR0072 5 0 0 0 0 0 0 0 0 0 1 0 1 0 0 0
BR0008 2 0 0 0 1 0 1 0 0 0 0 0 0 0 0 0
BR0014 4 0 0 0 0 0 0 0 0 0 1 0 1 0 0 0
BR0005 5 0 1 0 0 0 0 0 0 0 0 0 1 0 1 0
BR0065 3 0 0 0 1 0 1 0 0 0 1 0 0 0 0 0
BR0089 4 1 0 0 0 1 0 0 0 1 0 0 0 0 1 0
BR0083 3 0 0 0 0 0 0 0 0 0 0 0 1 0 1 0
BR0057 5 0 0 0 0 0 0 0 0 0 1 0 0 0 0 0
BR0025 3 0 0 0 0 0 0 0 0 1 1 0 0 0 0 0
BR0063 5 0 1 0 0 0 0 0 0 0 0 0 0 0 1 0
BR0047 5 0 0 0 0 0 0 0 0 0 1 0 0 0 0 0
* Site numbers are colored by condition category (Green is minimally stressed, yellow is moderately
stressed, orange is severely stressed)

Broadkill Watershed Wetland Report 57
APPENDIX H: Nontidal Riverine Comprehensive Metric and Variable Data from
Broadkill River watershed site COMP1*
Site # COMP1
Qualitative Condition Ranking 1
Vveg history 1.00
FACU Tree IV 0.15
Vtreecomp 0.25
Tree Basal Area m²/ha 46.60
Vtba 1.00
Vmicrotopo 1.00
% Veg Plots with Rubus 0
Vrubus 1.00
Shrub Density (shrubs/ha) 7427
Vshrubden 1.00
Buffer Tree Basal Area (m²/ha) 30.84
Vbufferba 0.86
% Buffer High Impact Land Use 0
Vbuffuse200 1.00
AA Floodplain Alterations 0
Vfloodplain 1.00
% Coverage Invasive Herbs 0.31
Vinvasive understory 0.75
% Channelization 500m from AA 0
Vchannel_out 1.00
Vinstream 1.00
Vhydroalt_out 0.75
Average CoC 4.68
FQAI' 46.38
Vfqai 1.00
Distance to Nearest Road (m) 400
Vdist_to_road 1.00
*Shaded lines highlight calculated variable scores; unshaded lines denote raw values. The site was assessed in 2010 and scored with the Riverine Variable Scoring Protocol version 2.0.

Broadkill Watershed Wetland Report 58
APPENDIX I: Nontidal Depression Wetland Rapid Assessment Stressors for Sites in
the Broadkill River watershed in 2010*
Stressor definitions are listed in Appendix B (page 42). ‘1’ indicates the presence of that stressor,
‘0’ indicates the absence.
* Site numbers are colored by condition category (Green is minimally stressed, yellow is moderately stressed, orange is
severely stressed)
Habitat and Plant Community Stressors
Site Number (color coded by
condition group)
QDR
Hm
ow
Hfa
rm
Hgra
z
Hnore
cov
Hfo
r31
Hfo
r16
Hfo
r3
Hfo
r2
Hcc10
Hcc50
Hcc100
Hfo
rsc
Hherb
Hin
vdo
m
Hin
vle
ss
Hchem
Hpin
e
Htra
il
Hro
ad
Hpave
Hnuta
pp
Halg
ae
BR0059 2 0 0 0 0 0 0 0 0 0 0 0 0 0 0 0 0 0 0 0 0 0 0
BR0016 4 0 0 0 0 0 0 0 0 0 0 0 1 0 0 1 0 0 1 0 0 0 0
BR0036 3 0 0 0 0 0 0 0 0 0 0 0 0 0 0 1 0 0 0 0 0 0 1
Hydrology Stressors
Site Number (color coded by
condition group)
QDR
Wd
itchs
Wd
itchm
Wd
itchx
Wd
itchflo
od
pla
in
Wchan
nm
Wchan
1
Wchan
2
Win
cis
ion
Wda
mdec
Wim
p1
0
Wim
p7
5
Wim
p1
00
Wsto
rm
Wpo
int
Wsed
Wfill1
0
Wfill7
5
Wfill1
00
Wm
ic10
Wm
ic75
Wm
ic100
Wsubsid
BR0059 2 0 0 0 0 0 0 0 0 0 0 0 0 0 0 0 0 0 0 0 0 0 0
BR0016 4 0 0 0 0 0 0 0 0 0 0 0 0 0 0 0 0 0 0 0 0 0 0
BR0036 3 0 1 0 0 0 0 0 0 0 0 0 0 0 0 0 0 0 0 0 0 0 0
Buffer Stressors
Site Number (color coded by
condition group)
QDR
Ldevcom
Ldevre
s3
Ldevre
s2
Ldevre
s1
Lrd
gra
v
Lrd
2p
av
Lrd
4p
av
Lln
dfil
Lchan
Lag
Lagp
ou
l
Lfo
r
Lgo
lf
Lm
ow
Lm
ine
BR0059 2 0 0 0 0 0 0 0 0 0 1 0 0 0 0 0
BR0016 4 0 0 0 1 0 1 0 0 0 1 0 1 0 1 0
BR0036 3 0 0 0 0 0 0 0 0 1 1 0 0 0 1 0
Broadkill Watershed Wetland Report 59
This report and other watershed condition reports, assessment methods, and scoring
protocols can be found on the Delaware Wetlands website:


