brochure Rocket ® Empowering Business Users with Direct TM1 Connectivity for Quick and Easy Dashboard Creation. Consume TM1 Data YOUR Way! Rocket ® Discover & IBM Cognos TM1 Organizations worldwide use IBM® Cognos® TM1® for planning, budgeting, forecasting, modeling and analysis to drive department and enterprise-wide performance management. At the core of Cognos TM1 is the TM1 cube engine, a multidimensional database with a set of business rules that support sophisticated scenario analytics. While the solution provides a complex feature set, access to data in the TM1 cube is not straightforward. To access data contained within the cube business users must use Microsoft Excel for complex reporting and write-back, TM1 Websheets for freeform layout and charting, and IBM Cognos Insight™ for offline planning. While each of these options is valuable, business users are still searching for an intuitive way to easily access TM1 cubes so they can quickly create rich visualizations that expose trends, outliers, and historical data, and derive insights required for planning and forecasting. Create Visualizations, Gain Greater Insight, and Experience the Full Potential of Cognos TM1 Rocket Discover provides an intuitive, self-service data-visualization solution that empowers quick creation of visualizations and dashboards for exploration, analysis, and real time collaboration with team members. Discover’s native TM1 live connect ensures that with just one click, you can instantly see TM1 updates in each dashboard. And now, when you make changes to the TM1 data, you can write back those values to the original TM1 cube! Knowing that you are working with up-to-date data gives you the confidence you need to make the right forecasting, modelling and business planning decisions. And if you are a business analyst with ideas that won’t wait, use the dimensional modeling in Discover to
Transcript
brochure
Rocket ®
create your own TM1 cube from scratch.
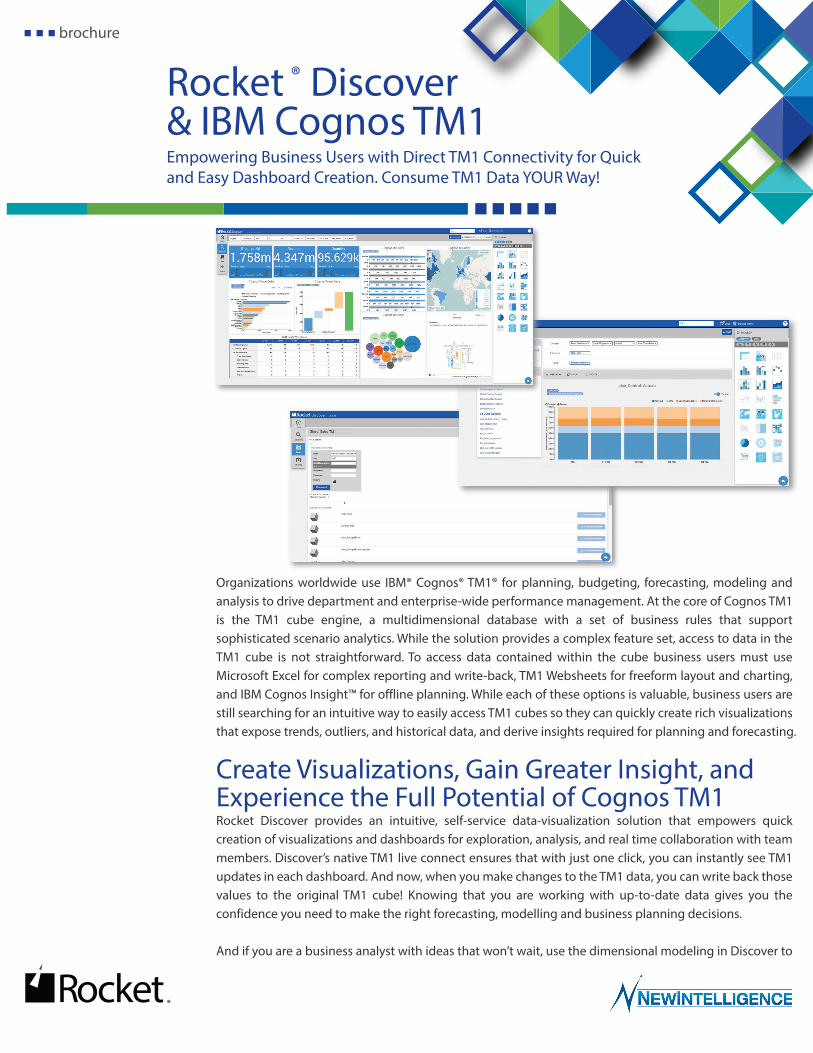
Native, Direct Access to TM1Discover connects directly to TM1 using the REST API. It takes advantage of native TM1 security and/or IBM Cognos Access Manager namespace security for seamless integration. Provide your credentials and Discover displays a simplified preview of the cube views, no modeling environment, middle layer, or scripting required. Discover does all the heavy lifting for you and preserves the hierarchical structure and data dependencies. All you do is choose the TM1 Server you want, followed by the appropriate Cube. (Figure 1)
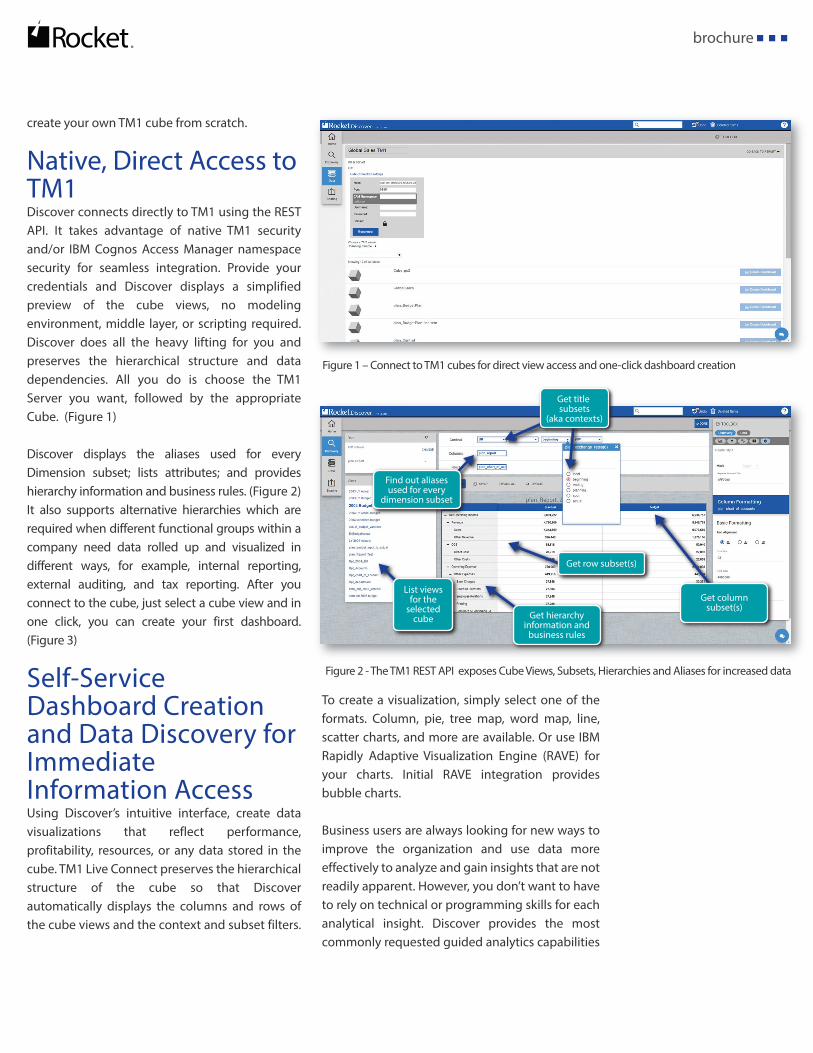
Discover displays the aliases used for every Dimension subset; lists attributes; and provides hierarchy information and business rules. (Figure 2) It also supports alternative hierarchies which are required when different functional groups within a company need data rolled up and visualized in different ways, for example, internal reporting, external auditing, and tax reporting. After you connect to the cube, just select a cube view and in one click, you can create your first dashboard. (Figure 3)
Self-Service Dashboard Creation and Data Discovery for Immediate Information AccessUsing Discover’s intuitive interface, create data visualizations that reflect performance, profitability, resources, or any data stored in the cube. TM1 Live Connect preserves the hierarchical structure of the cube so that Discover automatically displays the columns and rows of the cube views and the context and subset filters.
Empowering Business Users with Direct TM1 Connectivity for Quick and Easy Dashboard Creation. Consume TM1 Data YOUR Way!
Rocket ® Discover & IBM Cognos TM1
To create a visualization, simply select one of the formats. Column, pie, tree map, word map, line, scatter charts, and more are available. Or use IBM Rapidly Adaptive Visualization Engine (RAVE) for your charts. Initial RAVE integration provides bubble charts.
Business users are always looking for new ways to improve the organization and use data more effectively to analyze and gain insights that are not readily apparent. However, you don’t want to have to rely on technical or programming skills for each analytical insight. Discover provides the most commonly requested guided analytics capabilities
Blended Dashboards for Side-by-Side TM1 and Non-TM1 Data AnalysisAs you gain new insights, you might discover that you need to analyze supporting data that is stored outside the cube. Using Discover, you can create dashboards that contain visualizations from different data sources. For example, one visualization might display TM1 forecasting data; another might reveal inventory levels and revenue from an IBM Cognos PowerCube; and a third might display data from a file on your local machine. All related data is captured in one dashboard, and when you want to filter on a specific field, each visualization reflects the filter criteria.
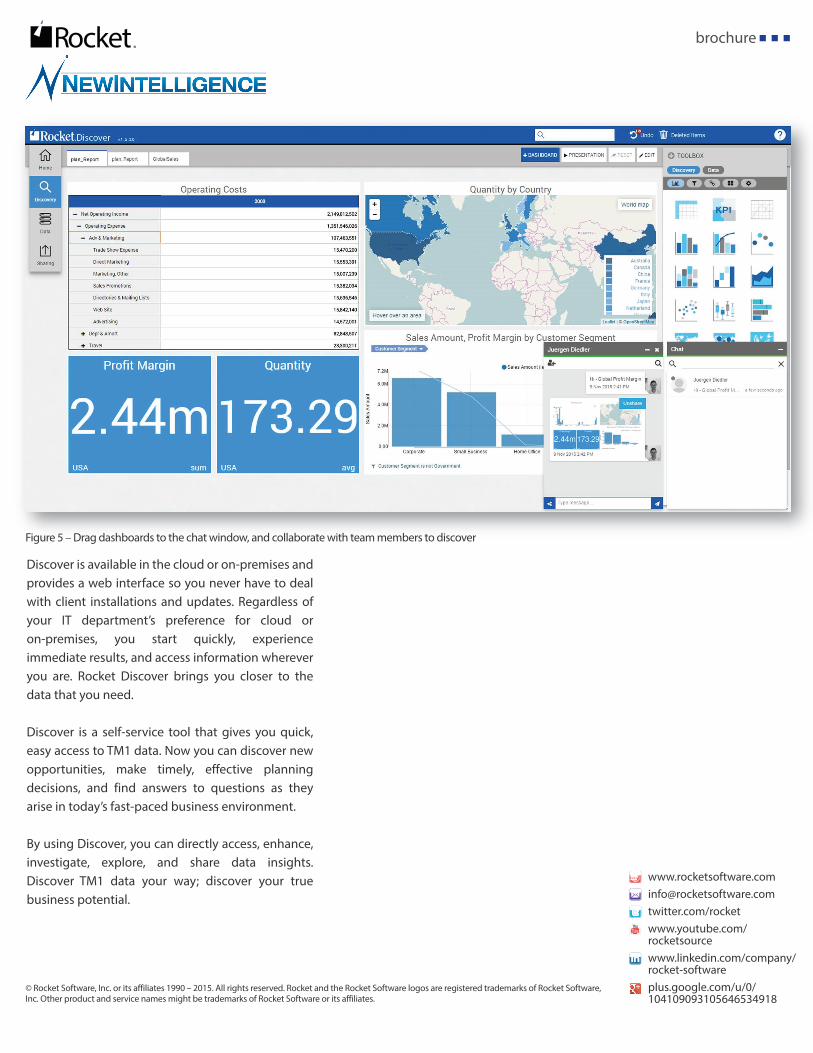
A blended dashboard provides a 360-degree, holistic view that you can use to assess all supporting details before you make your next strategic decision. (Figure 4)
Real Time, Collaboration for Better Decision MakingCollaborate with colleagues to make better decisions. Collaboration occurs directly in the dashboard environment and fosters immediate discussion and action. Just drag a dashboard to the chat window. Then discuss results, strategy, and opportunities; and discover new insights about the data. (Figure 5)
Modern Architecture and DesignDiscover delivers business intelligence when, where, and how you need it. The modern responsive design ensures that you can interact visually and natively with your intelligent device. You stay connected and can quickly and collaboratively resolve business challenges.
Organizations worldwide use IBM® Cognos® TM1® for planning, budgeting, forecasting, modeling and analysis to drive department and enterprise-wide performance management. At the core of Cognos TM1 is the TM1 cube engine, a multidimensional database with a set of business rules that support sophisticated scenario analytics. While the solution provides a complex feature set, access to data in the TM1 cube is not straightforward. To access data contained within the cube business users must use Microsoft Excel for complex reporting and write-back, TM1 Websheets for freeform layout and charting, and IBM Cognos Insight™ for offline planning. While each of these options is valuable, business users are still searching for an intuitive way to easily access TM1 cubes so they can quickly create rich visualizations that expose trends, outliers, and historical data, and derive insights required for planning and forecasting.
Create Visualizations, Gain Greater Insight, and Experience the Full Potential of Cognos TM1 Rocket Discover provides an intuitive, self-service data-visualization solution that empowers quick creation of visualizations and dashboards for exploration, analysis, and real time collaboration with team members. Discover’s native TM1 live connect ensures that with just one click, you can instantly see TM1 updates in each dashboard. And now, when you make changes to the TM1 data, you can write back those values to the original TM1 cube! Knowing that you are working with up-to-date data gives you the confidence you need to make the right forecasting, modelling and business planning decisions.
And if you are a business analyst with ideas that won’t wait, use the dimensional modeling in Discover to
out of the box and integrated into the interface for an intuitive, self-service analysis experience.
When you drill through each visualization, you gain insights as the data begins to tell its own story. Whether you’re assessing actual versus forecasted numbers, detailed sales data, resource gaps, or funding for strategic objectives, in one click you can refresh your dashboards to display the most current cube data.
Discover is available in the cloud or on-premises and provides a web interface so you never have to deal with client installations and updates. Regardless of your IT department’s preference for cloud or on-premises, you start quickly, experience immediate results, and access information wherever you are. Rocket Discover brings you closer to the data that you need.
Discover is a self-service tool that gives you quick, easy access to TM1 data. Now you can discover new opportunities, make timely, effective planning decisions, and find answers to questions as they arise in today’s fast-paced business environment.
By using Discover, you can directly access, enhance, investigate, explore, and share data insights. Discover TM1 data your way; discover your true business potential.
Rocket ®Rocket ®brochure
create your own TM1 cube from scratch.
Native, Direct Access to TM1Discover connects directly to TM1 using the REST API. It takes advantage of native TM1 security and/or IBM Cognos Access Manager namespace security for seamless integration. Provide your credentials and Discover displays a simplified preview of the cube views, no modeling environment, middle layer, or scripting required. Discover does all the heavy lifting for you and preserves the hierarchical structure and data dependencies. All you do is choose the TM1 Server you want, followed by the appropriate Cube. (Figure 1)
Discover displays the aliases used for every Dimension subset; lists attributes; and provides hierarchy information and business rules. (Figure 2) It also supports alternative hierarchies which are required when different functional groups within a company need data rolled up and visualized in different ways, for example, internal reporting, external auditing, and tax reporting. After you connect to the cube, just select a cube view and in one click, you can create your first dashboard. (Figure 3)
Self-Service Dashboard Creation and Data Discovery for Immediate Information AccessUsing Discover’s intuitive interface, create data visualizations that reflect performance, profitability, resources, or any data stored in the cube. TM1 Live Connect preserves the hierarchical structure of the cube so that Discover automatically displays the columns and rows of the cube views and the context and subset filters.
To create a visualization, simply select one of the formats. Column, pie, tree map, word map, line, scatter charts, and more are available. Or use IBM Rapidly Adaptive Visualization Engine (RAVE) for your charts. Initial RAVE integration provides bubble charts.
Business users are always looking for new ways to improve the organization and use data more effectively to analyze and gain insights that are not readily apparent. However, you don’t want to have to rely on technical or programming skills for each analytical insight. Discover provides the most commonly requested guided analytics capabilities
Blended Dashboards for Side-by-Side TM1 and Non-TM1 Data AnalysisAs you gain new insights, you might discover that you need to analyze supporting data that is stored outside the cube. Using Discover, you can create dashboards that contain visualizations from different data sources. For example, one visualization might display TM1 forecasting data; another might reveal inventory levels and revenue from an IBM Cognos PowerCube; and a third might display data from a file on your local machine. All related data is captured in one dashboard, and when you want to filter on a specific field, each visualization reflects the filter criteria.
A blended dashboard provides a 360-degree, holistic view that you can use to assess all supporting details before you make your next strategic decision. (Figure 4)
Real Time, Collaboration for Better Decision MakingCollaborate with colleagues to make better decisions. Collaboration occurs directly in the dashboard environment and fosters immediate discussion and action. Just drag a dashboard to the chat window. Then discuss results, strategy, and opportunities; and discover new insights about the data. (Figure 5)
Modern Architecture and DesignDiscover delivers business intelligence when, where, and how you need it. The modern responsive design ensures that you can interact visually and natively with your intelligent device. You stay connected and can quickly and collaboratively resolve business challenges.
Figure 1 – Connect to TM1 cubes for direct view access and one-click dashboard creation
Figure 2 - The TM1 REST API exposes Cube Views, Subsets, Hierarchies and Aliases for increased data
Organizations worldwide use IBM® Cognos® TM1® for planning, budgeting, forecasting, modeling and analysis to drive department and enterprise-wide performance management. At the core of Cognos TM1 is the TM1 cube engine, a multidimensional database with a set of business rules that support sophisticated scenario analytics. While the solution provides a complex feature set, access to data in the TM1 cube is not straightforward. To access data contained within the cube business users must use Microsoft Excel for complex reporting and write-back, TM1 Websheets for freeform layout and charting, and IBM Cognos Insight™ for offline planning. While each of these options is valuable, business users are still searching for an intuitive way to easily access TM1 cubes so they can quickly create rich visualizations that expose trends, outliers, and historical data, and derive insights required for planning and forecasting.
Create Visualizations, Gain Greater Insight, and Experience the Full Potential of Cognos TM1 Rocket Discover provides an intuitive, self-service data-visualization solution that empowers quick creation of visualizations and dashboards for exploration, analysis, and real time collaboration with team members. Discover’s native TM1 live connect ensures that with just one click, you can instantly see TM1 updates in each dashboard. And now, when you make changes to the TM1 data, you can write back those values to the original TM1 cube! Knowing that you are working with up-to-date data gives you the confidence you need to make the right forecasting, modelling and business planning decisions.
And if you are a business analyst with ideas that won’t wait, use the dimensional modeling in Discover to
out of the box and integrated into the interface for an intuitive, self-service analysis experience.
When you drill through each visualization, you gain insights as the data begins to tell its own story. Whether you’re assessing actual versus forecasted numbers, detailed sales data, resource gaps, or funding for strategic objectives, in one click you can refresh your dashboards to display the most current cube data.
Find out aliases used for every
dimension subset
Get title subsets
(aka contexts)
Get row subset(s)
List views for the
selected cube
Get columnsubset(s)
Get hierarchy information and
business rules
Discover is available in the cloud or on-premises and provides a web interface so you never have to deal with client installations and updates. Regardless of your IT department’s preference for cloud or on-premises, you start quickly, experience immediate results, and access information wherever you are. Rocket Discover brings you closer to the data that you need.
Discover is a self-service tool that gives you quick, easy access to TM1 data. Now you can discover new opportunities, make timely, effective planning decisions, and find answers to questions as they arise in today’s fast-paced business environment.
By using Discover, you can directly access, enhance, investigate, explore, and share data insights. Discover TM1 data your way; discover your true business potential.
Rocket ®Rocket ®brochure
create your own TM1 cube from scratch.
Native, Direct Access to TM1Discover connects directly to TM1 using the REST API. It takes advantage of native TM1 security and/or IBM Cognos Access Manager namespace security for seamless integration. Provide your credentials and Discover displays a simplified preview of the cube views, no modeling environment, middle layer, or scripting required. Discover does all the heavy lifting for you and preserves the hierarchical structure and data dependencies. All you do is choose the TM1 Server you want, followed by the appropriate Cube. (Figure 1)
Discover displays the aliases used for every Dimension subset; lists attributes; and provides hierarchy information and business rules. (Figure 2) It also supports alternative hierarchies which are required when different functional groups within a company need data rolled up and visualized in different ways, for example, internal reporting, external auditing, and tax reporting. After you connect to the cube, just select a cube view and in one click, you can create your first dashboard. (Figure 3)
Self-Service Dashboard Creation and Data Discovery for Immediate Information AccessUsing Discover’s intuitive interface, create data visualizations that reflect performance, profitability, resources, or any data stored in the cube. TM1 Live Connect preserves the hierarchical structure of the cube so that Discover automatically displays the columns and rows of the cube views and the context and subset filters.
To create a visualization, simply select one of the formats. Column, pie, tree map, word map, line, scatter charts, and more are available. Or use IBM Rapidly Adaptive Visualization Engine (RAVE) for your charts. Initial RAVE integration provides bubble charts.
Business users are always looking for new ways to improve the organization and use data more effectively to analyze and gain insights that are not readily apparent. However, you don’t want to have to rely on technical or programming skills for each analytical insight. Discover provides the most commonly requested guided analytics capabilities
Blended Dashboards for Side-by-Side TM1 and Non-TM1 Data AnalysisAs you gain new insights, you might discover that you need to analyze supporting data that is stored outside the cube. Using Discover, you can create dashboards that contain visualizations from different data sources. For example, one visualization might display TM1 forecasting data; another might reveal inventory levels and revenue from an IBM Cognos PowerCube; and a third might display data from a file on your local machine. All related data is captured in one dashboard, and when you want to filter on a specific field, each visualization reflects the filter criteria.
A blended dashboard provides a 360-degree, holistic view that you can use to assess all supporting details before you make your next strategic decision. (Figure 4)
Real Time, Collaboration for Better Decision MakingCollaborate with colleagues to make better decisions. Collaboration occurs directly in the dashboard environment and fosters immediate discussion and action. Just drag a dashboard to the chat window. Then discuss results, strategy, and opportunities; and discover new insights about the data. (Figure 5)
Modern Architecture and DesignDiscover delivers business intelligence when, where, and how you need it. The modern responsive design ensures that you can interact visually and natively with your intelligent device. You stay connected and can quickly and collaboratively resolve business challenges.
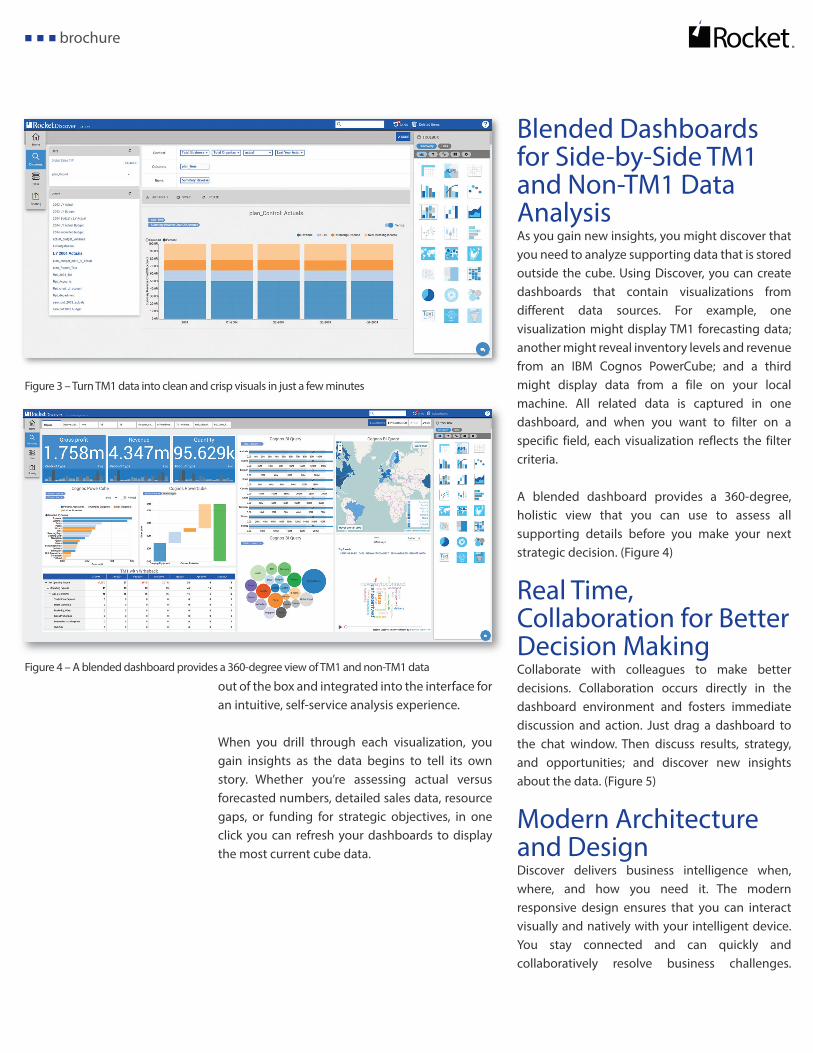
Figure 3 – Turn TM1 data into clean and crisp visuals in just a few minutes
Figure 4 – A blended dashboard provides a 360-degree view of TM1 and non-TM1 data
Organizations worldwide use IBM® Cognos® TM1® for planning, budgeting, forecasting, modeling and analysis to drive department and enterprise-wide performance management. At the core of Cognos TM1 is the TM1 cube engine, a multidimensional database with a set of business rules that support sophisticated scenario analytics. While the solution provides a complex feature set, access to data in the TM1 cube is not straightforward. To access data contained within the cube business users must use Microsoft Excel for complex reporting and write-back, TM1 Websheets for freeform layout and charting, and IBM Cognos Insight™ for offline planning. While each of these options is valuable, business users are still searching for an intuitive way to easily access TM1 cubes so they can quickly create rich visualizations that expose trends, outliers, and historical data, and derive insights required for planning and forecasting.
Create Visualizations, Gain Greater Insight, and Experience the Full Potential of Cognos TM1 Rocket Discover provides an intuitive, self-service data-visualization solution that empowers quick creation of visualizations and dashboards for exploration, analysis, and real time collaboration with team members. Discover’s native TM1 live connect ensures that with just one click, you can instantly see TM1 updates in each dashboard. And now, when you make changes to the TM1 data, you can write back those values to the original TM1 cube! Knowing that you are working with up-to-date data gives you the confidence you need to make the right forecasting, modelling and business planning decisions.
And if you are a business analyst with ideas that won’t wait, use the dimensional modeling in Discover to
out of the box and integrated into the interface for an intuitive, self-service analysis experience.
When you drill through each visualization, you gain insights as the data begins to tell its own story. Whether you’re assessing actual versus forecasted numbers, detailed sales data, resource gaps, or funding for strategic objectives, in one click you can refresh your dashboards to display the most current cube data.
Discover is available in the cloud or on-premises and provides a web interface so you never have to deal with client installations and updates. Regardless of your IT department’s preference for cloud or on-premises, you start quickly, experience immediate results, and access information wherever you are. Rocket Discover brings you closer to the data that you need.
Discover is a self-service tool that gives you quick, easy access to TM1 data. Now you can discover new opportunities, make timely, effective planning decisions, and find answers to questions as they arise in today’s fast-paced business environment.
By using Discover, you can directly access, enhance, investigate, explore, and share data insights. Discover TM1 data your way; discover your true business potential.
Native, Direct Access to TM1Discover connects directly to TM1 using the REST API. It takes advantage of native TM1 security and/or IBM Cognos Access Manager namespace security for seamless integration. Provide your credentials and Discover displays a simplified preview of the cube views, no modeling environment, middle layer, or scripting required. Discover does all the heavy lifting for you and preserves the hierarchical structure and data dependencies. All you do is choose the TM1 Server you want, followed by the appropriate Cube. (Figure 1)
Discover displays the aliases used for every Dimension subset; lists attributes; and provides hierarchy information and business rules. (Figure 2) It also supports alternative hierarchies which are required when different functional groups within a company need data rolled up and visualized in different ways, for example, internal reporting, external auditing, and tax reporting. After you connect to the cube, just select a cube view and in one click, you can create your first dashboard. (Figure 3)
Self-Service Dashboard Creation and Data Discovery for Immediate Information AccessUsing Discover’s intuitive interface, create data visualizations that reflect performance, profitability, resources, or any data stored in the cube. TM1 Live Connect preserves the hierarchical structure of the cube so that Discover automatically displays the columns and rows of the cube views and the context and subset filters.
To create a visualization, simply select one of the formats. Column, pie, tree map, word map, line, scatter charts, and more are available. Or use IBM Rapidly Adaptive Visualization Engine (RAVE) for your charts. Initial RAVE integration provides bubble charts.
Business users are always looking for new ways to improve the organization and use data more effectively to analyze and gain insights that are not readily apparent. However, you don’t want to have to rely on technical or programming skills for each analytical insight. Discover provides the most commonly requested guided analytics capabilities
Blended Dashboards for Side-by-Side TM1 and Non-TM1 Data AnalysisAs you gain new insights, you might discover that you need to analyze supporting data that is stored outside the cube. Using Discover, you can create dashboards that contain visualizations from different data sources. For example, one visualization might display TM1 forecasting data; another might reveal inventory levels and revenue from an IBM Cognos PowerCube; and a third might display data from a file on your local machine. All related data is captured in one dashboard, and when you want to filter on a specific field, each visualization reflects the filter criteria.
A blended dashboard provides a 360-degree, holistic view that you can use to assess all supporting details before you make your next strategic decision. (Figure 4)
Real Time, Collaboration for Better Decision MakingCollaborate with colleagues to make better decisions. Collaboration occurs directly in the dashboard environment and fosters immediate discussion and action. Just drag a dashboard to the chat window. Then discuss results, strategy, and opportunities; and discover new insights about the data. (Figure 5)
Modern Architecture and DesignDiscover delivers business intelligence when, where, and how you need it. The modern responsive design ensures that you can interact visually and natively with your intelligent device. You stay connected and can quickly and collaboratively resolve business challenges.
Figure 5 – Drag dashboards to the chat window, and collaborate with team members to discover
Organizations worldwide use IBM® Cognos® TM1® for planning, budgeting, forecasting, modeling and analysis to drive department and enterprise-wide performance management. At the core of Cognos TM1 is the TM1 cube engine, a multidimensional database with a set of business rules that support sophisticated scenario analytics. While the solution provides a complex feature set, access to data in the TM1 cube is not straightforward. To access data contained within the cube business users must use Microsoft Excel for complex reporting and write-back, TM1 Websheets for freeform layout and charting, and IBM Cognos Insight™ for offline planning. While each of these options is valuable, business users are still searching for an intuitive way to easily access TM1 cubes so they can quickly create rich visualizations that expose trends, outliers, and historical data, and derive insights required for planning and forecasting.
Create Visualizations, Gain Greater Insight, and Experience the Full Potential of Cognos TM1 Rocket Discover provides an intuitive, self-service data-visualization solution that empowers quick creation of visualizations and dashboards for exploration, analysis, and real time collaboration with team members. Discover’s native TM1 live connect ensures that with just one click, you can instantly see TM1 updates in each dashboard. And now, when you make changes to the TM1 data, you can write back those values to the original TM1 cube! Knowing that you are working with up-to-date data gives you the confidence you need to make the right forecasting, modelling and business planning decisions.
And if you are a business analyst with ideas that won’t wait, use the dimensional modeling in Discover to
out of the box and integrated into the interface for an intuitive, self-service analysis experience.
When you drill through each visualization, you gain insights as the data begins to tell its own story. Whether you’re assessing actual versus forecasted numbers, detailed sales data, resource gaps, or funding for strategic objectives, in one click you can refresh your dashboards to display the most current cube data.
Discover is available in the cloud or on-premises and provides a web interface so you never have to deal with client installations and updates. Regardless of your IT department’s preference for cloud or on-premises, you start quickly, experience immediate results, and access information wherever you are. Rocket Discover brings you closer to the data that you need.
Discover is a self-service tool that gives you quick, easy access to TM1 data. Now you can discover new opportunities, make timely, effective planning decisions, and find answers to questions as they arise in today’s fast-paced business environment.
By using Discover, you can directly access, enhance, investigate, explore, and share data insights. Discover TM1 data your way; discover your true business potential.