8/15/2019 Broker Note, Aquarius Platinum, 08/03/2007 (Seymour Pierce)
http://slidepdf.com/reader/full/broker-note-aquarius-platinum-08032007-seymour-pierce 1/28
Year end
30 June
Sales
(US$m)
Pre-tax
(US$m)
Normalised
net (US$m)
EPS
(US¢)
PER
(x)
DPS
(US¢)
Yield
(%)
EV/Sales
(x)
EV/EBITDA
(x)
2006A 431.5 192.1 85.6 100.9 26.9 24.0 0.9 5.1 9.52007E 648.6 349.1 143.0 169.0 16.1 59.1 2.2 3.4 5.62008E 751.0 437.3 186.0 219.7 12.4 109.9 4.0 2.9 4.6
Source: Seymour Pierce Limited full year forecasts
C o m p a n y N o t e
8 M a r c h 2 0 0 7
M e t a l s & M i n i n
g
Aquarius PlatinumGoing platinum
Aquarius Platinum has grown quickly to become the fifth largest
platinum producer in the world. The company has four operations in
South Africa and one in Zimbabwe and expects attributable production
to grow by over 50% in the next three years. With metal prices
expected to remain above long-term historic averages, Aquarius
should generate substantial cash flows enabling the company to make
acquisitions, or become a significant dividend payer. As we believethat the group’s expansion prospects are not fully reflected in the
current share price, we initiate coverage with a Buy recommendation.
Thanks to record platinum group metal output of 277,156oz and strong
metal prices, Aquarius has seen half-year profits to December 2006 triple to
US$85.4m, all but equalling the profit for the full financial year 2006. We
expect the strong financial performance to continue through the second half
of FY2007 and for FY2008 to bring further record earnings as production
increases.
Aquarius is well underway with its aggressive growth strategy at its
existing operations. This will see attributable production rise by 57% to justover 700,000oz of platinum, palladium, rhodium and gold in the next three
years.
The company has reiterated its ongoing efforts to identify a suitable
acquisition target, but opportunities within the South African platinum
sector are limited and expensive. However, ongoing strong metal prices are
changing the perspective on the value of these opportunities. If a suitable
target can not be identified, the company has pledged to return excess cash
to shareholders.
We believe that the shares still have considerable upside potential
despite the marked rise in recent months, coinciding with strong half-year numbers. We have valued the company using both our long-term forecasts
for metal prices and the current spot prices. Overall, our valuations range
between £14.29 and £21.17/share. From this range, we take £17.86/share
as our target price. BUY.
BUY
1465p
LSE AQP.L
No of shares (m) 84.57
Market cap (£m) 1,239.0
Net cash (£m) 54.13
Enterprise value (£m) 1,184.87
(%) 1m 3m 12m
FTA relative +6.4 +28.5 +102.7
12 month high/low (p) 1585.0/602.0
Next news
Q3 FY2007 production results
Business
Platinum mining in Southern Africa
www.aquariusplatinum.com
Price and price relative (2y)
AQUARIUS PL ATINUM 8/3/07
M A M J J A S O N D J F M A M J J A S O N D J F
200
400
600
800
1000
1200
1400
1600
PRICE
PRICE REL. TO FTSE ALL SHARE - PRICE INDEXSource: DATASTREAM
Source : Datastream
ContactsCharles KernotResearch Analyst020 7107 [email protected]
Asa Bridle Research Analyst020 7107 [email protected]
8/15/2019 Broker Note, Aquarius Platinum, 08/03/2007 (Seymour Pierce)
http://slidepdf.com/reader/full/broker-note-aquarius-platinum-08032007-seymour-pierce 2/28
Aquarius Platinum 8 March 2007
Seymour Pierce Research 2
TABLE OF CONTENTS
Investment thesis 3
The facts of the case 3
Overview 3Valuation 3
Recommendation 3
Valuation 4
Valuation 4
Summary 4
Fundamental valuation 4
Relative valuation 6
Peak valuation 6
Company strategy 8Growing production 8
The strategy 8
Operations 10
Where the magic happens 10
South African production 10
Zimbabwean production 15
The PGM market 17
Where does it all go? 17
Key drivers in the PGM markets 17
Financials 21
Reality check 21
Production estimates 21
Earnings 23
Cash flow estimates 26
Balance sheet 27
8/15/2019 Broker Note, Aquarius Platinum, 08/03/2007 (Seymour Pierce)
http://slidepdf.com/reader/full/broker-note-aquarius-platinum-08032007-seymour-pierce 3/28
Aquarius Platinum 8 March 2007
3 Seymour Pierce Research
INVESTMENT THESIS
The facts of the case
In 2006, Aquarius Platinum (Aquarius) achieved attributable production
of the major platinum group elements, platinum, palladium, rhodium
and gold (3E PGE + Au) of 448,000oz. An aggressive growth strategy is
in place and in the next three years we expect output from its five
operations to increase by 57% to just over 700,000oz. Strong demand
for PGMs is expected to maintain prices above historic averages in
coming years, making Aquarius a significant generator of cash. We
value the company at £17.86/share and recommend the stock as a Buy.
Overview
Aquarius’ success is the result of its focus on a specific style of mining
operations and an intelligent partnering strategy with other major producers.
The company has tended to favour relatively small mines, which allow a high
degree of mechanisation. This is in contrast to the traditional, labour-
intensive mining seen elsewhere in the South African platinum industry.
Furthermore, the company has chosen to avoid the substantial financial and
technical barriers associated with downstream processing and sales.
Partnership agreements have been struck with both Anglo Platinum and
Impala Platinum in South Africa, which has resulted in considerable
extensions to the life of two of the company’s major operations. In South
Africa, full compliance with black economic empowerment requirements of the new Mining Act (2002) has been achieved far in advance of the
legislation’s deadlines.
Not only is the company benefiting from strong prices for its headline
products, the major PGMs and gold, but also for the minor PGMs, such as
ruthenium and iridium. The iridium price has risen by 236% since last
January, whilst ruthenium has increased ten-fold in the same period.
Furthermore, the company has notable exposure to nickel, copper and
cobalt which are also found in the orebodies.
ValuationWe have valued the company based on both our own, conservative long-
term metal price forecasts and current spot prices, and provide a range of
valuations, which would apply at differing times in the metal price cycle. We
have also compared the company to Lonmin, another London-listed PGM
producer with South African operations. We believe the key valuation range
lies between £14.29/share and £21.17/share.
Recommendation
Aquarius has a significant and growing production base in a strong suite of
metals. The company is already well on the way to building a substantial
treasury for acquisitions, exploration or dividend payment. We value thecompany at £17.86/share and initiate our coverage with a buy
recommendation.
The company favours smaller, highly
mechanised mining opportunities
Established partnerships with other major
producers have extended the lives of
operations
BEE compliance achieved
Good exposure to high valued minor PGMs
and base metals
We value the company between
£14.29/share and £21.17/share
We set a target price of £17.86 and
recommend a buy
8/15/2019 Broker Note, Aquarius Platinum, 08/03/2007 (Seymour Pierce)
http://slidepdf.com/reader/full/broker-note-aquarius-platinum-08032007-seymour-pierce 4/28
Aquarius Platinum 8 March 2007
Seymour Pierce Research 4
VALUATION
Valuation
Aquarius is now a well established and significant PGM producer. The
company’s share price has increased substantially in the past twelve
months matching developments at its operations and strengthening
metal prices. We have applied three methodologies to valuing the
company, which involve both fundamental and relative valuation of the
producing assets. We have also attempted to highlight the variation in
valuation that might be expected during a PGM price cycle. Overall, our
valuations for the peak of the cycle range between £14.29/share and
£21.17/share. We take the mid-point as our target price at £17.86/share.
Summary
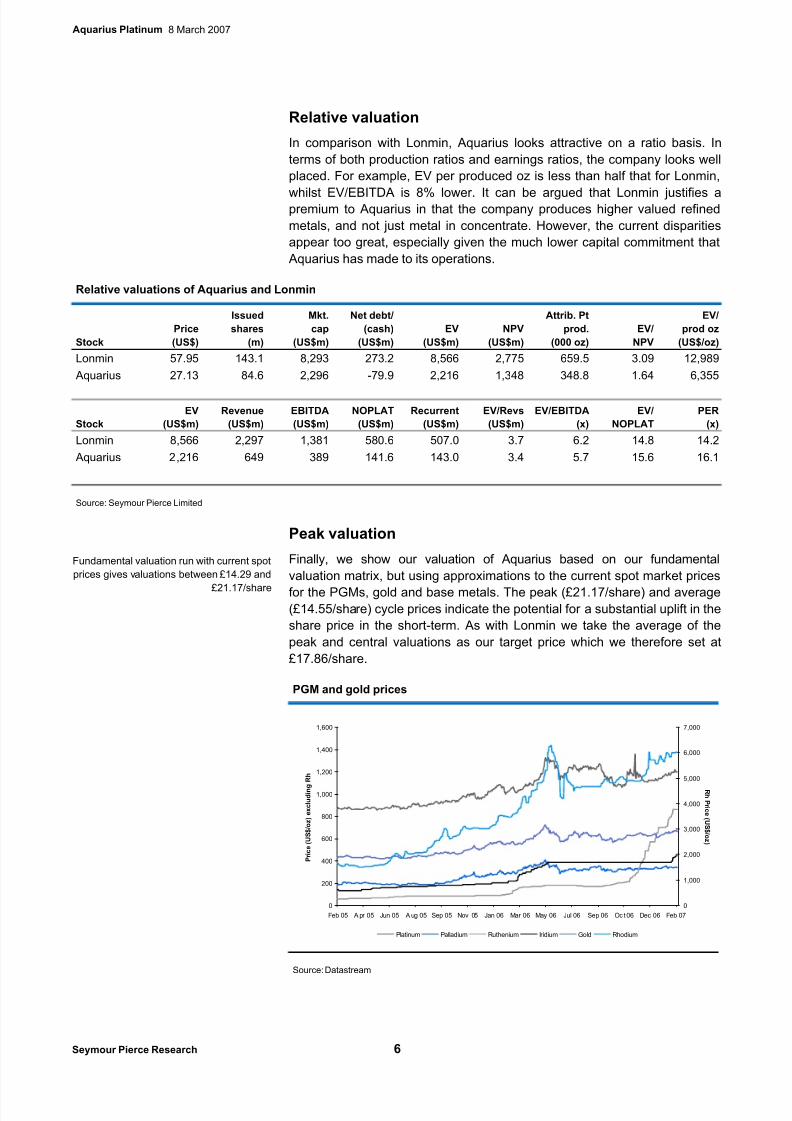
Assuming that 2007 will represent the peak of the current cycle, our
fundamental valuation implies a target price of £14.28p per share, which
represents a premium to the current price. Our relative valuation also implies
some upside, whilst our peak valuation, using current spot prices extended
over the longer term, gives a cycle peak value of £21.17.
Fundamental valuation
Our fundamental valuation of Aquarius looks at the value of the company
based on long term metrics. PGM prices are a key factor, and in general
terms, we expect the major PGM prices to peak in 2007 before easing to the
bottom of the current cycle in 2010. Prices should then climb steadily for theremainder of the forecast period as the next cycle begins. More detail of our
PGM and base metal price forecasts can be found later in the note, but we
regard these estimates as reasonably conservative.
Foreign exchange must be regarded as the other key factor for Aquarius,
with the majority of costs in South African Rand and Zimbabwean dollars
and metal sales in US dollars. South African producers have benefited from
a weakening of the rand in recent times, which has lowered costs in relative
terms. Our forecasts assume a continuation of this trend over the forecast
period. The hyperinflationary environment in Zimbabwe has led to a series of
devaluations against the US dollar in recent years. Future, relative
movements in the currency are hard to forecast, but we believe costs at thecompany’s Zimbabwean operations in US dollar terms should be
manageable.
The matrix below calculates the valuation of Aquarius on a number of
different bases – in order to generate indications of its peak, trough and
average share prices over the course of a platinum cycle. The multiples are
set in line with those exhibited historically. The discounted cash flow and
price/book valuations also reflect minimum levels for the shares, in order to
reflect takeover potential of the stock. It should be noted that the cash flow
model only includes those funds due to Aquarius from its South African
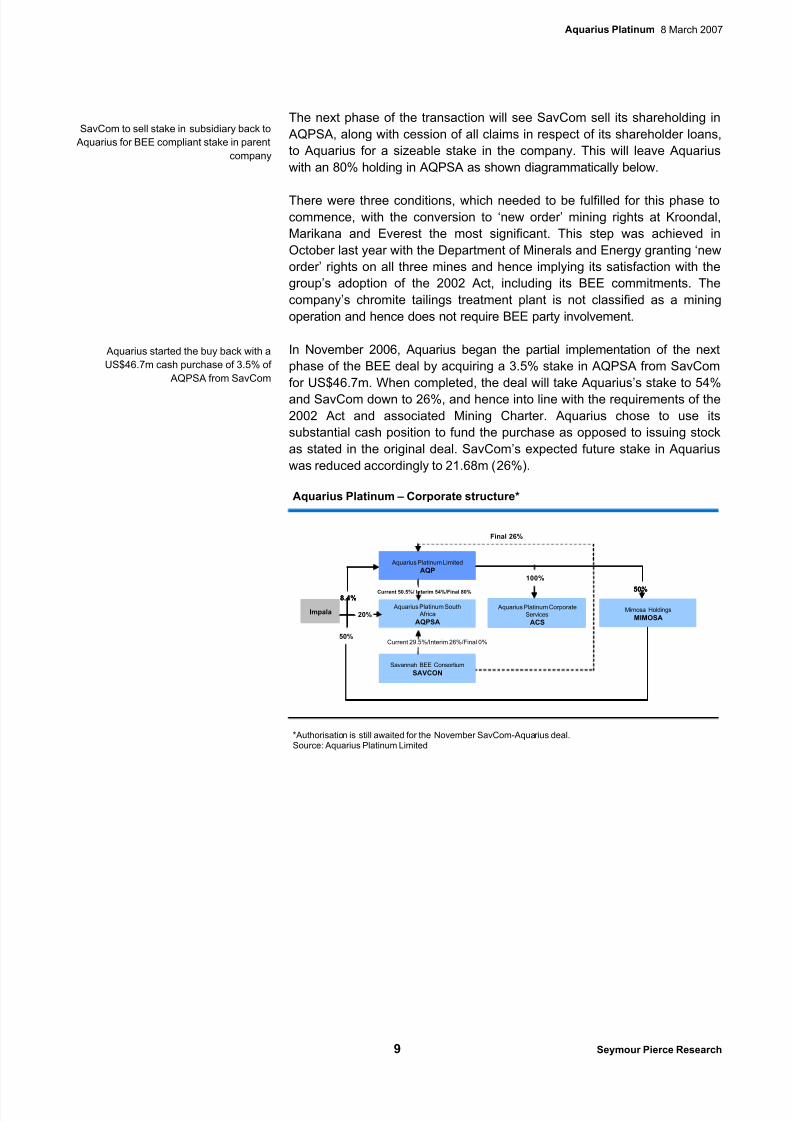
subsidiary as governed by its stake in the subsidiary. This is set to changeassuming the group’s BEE transaction is completed but, even though
ownership of the subsidiary is set to increase, there are likely to be more
shares in issue, reducing per share valuations back to current levels.
Our fundamental valuation is based on our
long term PGM price forecasts…
….and long term Rand-dollar exchange rate
assumptions
We offer potential valuations at various
points in the metal price cycle
8/15/2019 Broker Note, Aquarius Platinum, 08/03/2007 (Seymour Pierce)
http://slidepdf.com/reader/full/broker-note-aquarius-platinum-08032007-seymour-pierce 5/28
Aquarius Platinum 8 March 2007
5 Seymour Pierce Research
South African Rand to US$ spot exchange rate
5
5.5
6
6.5
7
7.5
8
8.5
Feb 05 Apr 05 Jun 05 Aug 05 Oct 05 Dec 05 Feb 06 Apr 06 Jun 06 Aug 06 Oct 06 Dec 06 Feb 07
Z A R : U S $
Source: Datastream & South African Reserve Bank
This valuation relates solely to the earnings generating assets of Aquarius,
together with its potential for increased production and revenue generation
as a consequence of its capital expenditure programme. Development of
these assets is reflected through the use of the long-term NPV calculation.
Together with the price/book valuation, this also allows for capital costs.
Aquarius Platinum - earnings valuation matrix using forecast metals prices
Valuation
summary US$/share Multiple
Value
(US$/share) Weight
Weighted
value
(US$/share)
Peak EPS 2.20 6 13.18 10% 1.32
Peak CFPS 4.00 4 16.00 10% 1.60
Mid-cycle EPS 1.66 18 29.92 15% 4.49
Mid-cycle CFPS 3.14 12 37.66 15% 5.65
Trough EPS 1.38 11 15.19 10% 1.52
Trough CFPS 2.66 7 18.59 10% 1.86
Discounted FCF 8.0% 15.93 20% 3.19
Price to Book 4.83 1.4 6.76 10% 0.68
Average per share (US$/£) 19.15/9.82 20.30/10.41
Peak per share (US$/£) 27.84/14.28Trough per share (US$/£) 12.97/6.65
Source: Seymour Pierce Limited
As the matrix shows, there is a considerable spread in the potential valuation
based on the timing in the price cycle, from £6.65 to £14.28 at the current
peak. Hence, the calculations imply that the fundamental valuation of the
company could more than halve during a cycle trough. Clearly, given the
current strong economic backdrop we believe that such a situation is a
distant prospect.
Valuations lie between £6.65 and £14.28
per share
8/15/2019 Broker Note, Aquarius Platinum, 08/03/2007 (Seymour Pierce)
http://slidepdf.com/reader/full/broker-note-aquarius-platinum-08032007-seymour-pierce 6/28
8/15/2019 Broker Note, Aquarius Platinum, 08/03/2007 (Seymour Pierce)
http://slidepdf.com/reader/full/broker-note-aquarius-platinum-08032007-seymour-pierce 7/28
Aquarius Platinum 8 March 2007
7 Seymour Pierce Research
Aquarius Platinum - earnings valuation matrix using forecast metals prices
Valuation summary US$/share Multiple
Value
(US$/share) Weight
Weighted
value
(US$/share)
Peak EPS 2.76 6 16.56 10% 1.66Peak CFPS 4.93 4 19.71 10% 1.97
Mid-cycle EPS 2.44 18 43.84 15% 6.58
Mid-cycle CFPS 4.41 12 52.94 15% 7.94
Trough EPS 1.69 11 18.59 10% 1.86
Trough CFPS 3.26 7 22.80 10% 2.28
Discounted FCF 8.0% 27.08 20% 5.42
Price to Book 4.83 1.4 6.76 10% 0.68
Average per share (US$/£) 26.03/13.35 28.37/14.55
Peak per share (US$/£) 41.29/21.17
Trough per share (US$/£) 17.53/8.99 Source: Seymour Pierce Limited
Base metal prices
0.00
5.00
10.00
15.00
20.00
25.00
30.00
Feb 05 Apr 05 Ju n 05 Aug 05 Sep 05 Nov 05 Jan 06 Mar 06 May 06 Jul 06 Sep 06 Oct 06 Dec 06 Feb 07
N i & C
o p r i c e ( U S $ / l b )
0.00
1.00
2.00
3.00
4.00
5.00
C u
pr i c e ( U S
$ / l b )
Nickel Cobalt Copper
Source: Datastream
8/15/2019 Broker Note, Aquarius Platinum, 08/03/2007 (Seymour Pierce)
http://slidepdf.com/reader/full/broker-note-aquarius-platinum-08032007-seymour-pierce 8/28
Aquarius Platinum 8 March 2007
Seymour Pierce Research 8
COMPANY STRATEGY
Growing production
Having produced just less than 450,000 oz of PGM in FY2006, and with
production set to grow to around 700,000 oz by FY2008, Aquarius has
become one of the most significant primary platinum group metal
producers in the world. The company is the fifth largest producer of
platinum in the world (260,000oz) with only Norilsk in Russia and the
other established South African producers, Anglo Platinum, Impala
Platinum and Lonmin producing more.
The strategy
Aquarius has found considerable success by focusing on relatively small,
underground and open pit operations, which allow for a high degree of
mechanisation. This has been in contrast to the ‘traditional’ approach of the
South African PGM mining operations, which has tended to focus on long-
life, labour intensive projects. The model is based on the use of key
operational contractors with Aquarius, and its operating subsidiaries,
assuming management roles. This has given Aquarius a strong track record
in project construction and budgeting. First production from the Everest mine
in 2006 on time and under budget gives the most recent example.
The company has also chosen to negate the substantial financial and
technical barriers associated with downstream processing and marketing of
PGMs. PGM-bearing concentrates produced at the company’s operations
are sold under long term contracts to major refiners, such as Impala RefiningServices (IRS). Although this precludes the company from receiving full
value for the metal it produces, the long running saga of Lonmin’s faltering
refining infrastructure suggests the decision has a very rational basis.
Black Economic Empowerment
During 2004, Aquarius completed a Black Economic Empowerment (BEE)
transaction, as required under the South African Mineral and Petroleum
Resources Development Act 2002, with an empowerment consortium of
three companies (SavCom) led by Savannah Resources (Pty) Limited.
The deal saw SavCom take a 29.5% stake in Aquarius’s South Africansubsidiary, AQPSA, for ZAR860m in cash and shareholder loans. These
funds were used in the development of the Everest mine.
Prior to the deal Aquarius held a 75% stake in AQPSA with Impala Platinum
holding the remaining 25%. The deal saw SavCom acquiring both an
existing equity interest in AQPSA from Aquarius and subscribing for new
equity in AQPSA. At the same time Impala acquired new shares in the
enlarged AQPSA to take a 20% stake, leaving Aquarius Platinum with a
50.5% stake.
Focussing on smaller PGM operations,
which allow high levels of mechanisation
The company produces concentrates only,
losing upside value, but reducing financial
exposure and operational risk
BEE compliance achieved through deal
with SavCom consortium in 2004
SavCom paid ZAR860m for a 29.5% stake
in South African operating subsidiary
8/15/2019 Broker Note, Aquarius Platinum, 08/03/2007 (Seymour Pierce)
http://slidepdf.com/reader/full/broker-note-aquarius-platinum-08032007-seymour-pierce 9/28
Aquarius Platinum 8 March 2007
9 Seymour Pierce Research
The next phase of the transaction will see SavCom sell its shareholding in
AQPSA, along with cession of all claims in respect of its shareholder loans,
to Aquarius for a sizeable stake in the company. This will leave Aquarius
with an 80% holding in AQPSA as shown diagrammatically below.
There were three conditions, which needed to be fulfilled for this phase to
commence, with the conversion to ‘new order’ mining rights at Kroondal,
Marikana and Everest the most significant. This step was achieved in
October last year with the Department of Minerals and Energy granting ‘new
order’ rights on all three mines and hence implying its satisfaction with the
group’s adoption of the 2002 Act, including its BEE commitments. The
company’s chromite tailings treatment plant is not classified as a mining
operation and hence does not require BEE party involvement.
In November 2006, Aquarius began the partial implementation of the next
phase of the BEE deal by acquiring a 3.5% stake in AQPSA from SavCom
for US$46.7m. When completed, the deal will take Aquarius’s stake to 54%and SavCom down to 26%, and hence into line with the requirements of the
2002 Act and associated Mining Charter. Aquarius chose to use its
substantial cash position to fund the purchase as opposed to issuing stock
as stated in the original deal. SavCom’s expected future stake in Aquarius
was reduced accordingly to 21.68m (26%).
Aquarius Platinum – Corporate structure*
Aquarius Platinum Limited
AQP
50%
Mimosa Holdings
MIMOSA
Aquarius Platinum CorporateServices
ACS
8.4%
50%
Current 50.5%/ Interim 54%/Final 80%
Aquarius Platinum SouthAfrica
AQPSA
Current 29.5%/Interim 26%/Final 0%
Impala 20%
Final 26%
100%
Savannah BEE Consortium
SAVCON
Aquarius Platinum Limited
AQP
50%
Mimosa Holdings
MIMOSA
Aquarius Platinum CorporateServices
ACS
8.4%
50%
Current 50.5%/ Interim 54%/Final 80%
Aquarius Platinum SouthAfrica
AQPSA
Current 29.5%/Interim 26%/Final 0%
Impala 20%
Final 26%
100%
Savannah BEE Consortium
SAVCON
*Authorisation is still awaited for the November SavCom-Aquarius deal.Source: Aquarius Platinum Limited
SavCom to sell stake in subsidiary back to
Aquarius for BEE compliant stake in parent
company
Aquarius started the buy back with a
US$46.7m cash purchase of 3.5% of
AQPSA from SavCom
8/15/2019 Broker Note, Aquarius Platinum, 08/03/2007 (Seymour Pierce)
http://slidepdf.com/reader/full/broker-note-aquarius-platinum-08032007-seymour-pierce 10/28
Aquarius Platinum 8 March 2007
Seymour Pierce Research 10
OPERATIONS
Where the magic happens
Aquarius has interests in four producing operations in South Africa
and one in Zimbabwe. The four operations in South Africa are located
on the Bushveld Igneous Complex (BIC) in the north of the country.
The BIC contains the single largest PGM deposit in the world. The
Zimbabwean operation is located on the southern section of the Great
Dyke, a sinuous (4-11km wide), igneous body which runs for 550km
across the country.
South African production
Mining on the BIC accounts for over 75% of the world’s platinum production,
34% of the world’s palladium and over 85% of the world’s rhodium. Total
estimated proven and probable reserves of platinum and palladium in the
BIC stand at 203.3Moz ounces and 116.1Moz, respectively. In addition to
these reserves, inferred resources were estimated at 939Moz of platinum
and 711Moz of palladium (source: Prof. G. Cawthorn, University of
Witwatersrand, South Africa). Based on Johnson Matthey’s estimated
demand for platinum and palladium demand in 2006 of 7.02Moz and
6.85Moz, respectively, this equates to 162 years and 120 years of demand.
Aquarius Platinum – Operations
Aquarius has three operations on the western limb of the BIC (Kroondal,
Marikana and the chromite tailings retreatment project) and one (Everest) on
the eastern limb, as shown on the following map.
Aquarius Platinum – Location of South African operations
Source: Johnson Matthey Plc.
The company has stakes in four producing
operations in South Africa and one in
Zimbabwe
Total Busveld Platinum reserves estimated
at 203Moz
8/15/2019 Broker Note, Aquarius Platinum, 08/03/2007 (Seymour Pierce)
http://slidepdf.com/reader/full/broker-note-aquarius-platinum-08032007-seymour-pierce 11/28
Aquarius Platinum 8 March 2007
11 Seymour Pierce Research
Kroondal (50% AQPSA)
Kroondal - key recent production parameters
Processed
(Mt)
Head
grade
(g/t)
Recovery
rate
(%)
Total 3E
PGE+Au
prod (oz)
Attrib 3E
PGE+Au
prod (oz)
Costs
(US$/oz)
2006 6.04 2.89 78.3% 439,444 219,722 403
2007H1 3.36 2.86 77.5% 238,902 119,450 396
Source: Aquarius Platinum Limited
Production began at Kroondal, Aquarius’ first operating mine, in 1999. The
mine is a core asset for Aquarius, accounting for just under 50% of the
company’s attributed 447,693oz 3E PGE and gold ounces during FY2006.
The mine exploits the UG2 reef with platinum accounting for approximately
60% of total PGE output, palladium 29% and rhodium 11%.
In 2003, Aquarius extended the life of the operation by entering into a pool
and share agreement (P&SA1) with Anglo Platinum, which owns the
adjacent property. By incorporating the resources on Anglo’s land, the life of
the mine has been extended from 2008 to 2017 with all revenue, costs and
capital expenditure shared equally between the partners.
Underground operations account for over 90% of production, with five shafts
now in production. Underground mining is by mechanised bord-and-pillar.
Concentrate is treated under an off-take agreement by Impala Refining
Services (IRS). This arrangement comes to an end in 2008 when
concentrate will be treated by Anglo Platinum under the terms of P&SA1.
In 2005 a new 3Mt per annum concentrator was commissioned at the mine,
which effectively doubled Kroondal’s annual production capacity to just over
0.5Moz 3E PGE + Au per annum. The company looks set to achieve this
approximate level of production in the next financial year to June 2008.
Kroondal - Reserves (at 30 June 2006)
Orebody
(Mt)
3E PGE + Au
(g/t)
3E PGE + Au
(Moz)
Proved open pit 0.04 4.17 0.01
Proved underground 57.82 2.95 5.48
Probable underground 9.45 3.23 0.98
Total 67.31 2.99 6.47
Source: Aquarius Platinum Limited
Kroondal opened in 1999. The mine
produced 50% of the company’s
attributable 3E PGE+Au in 2006
Aquarius entered a pool and share
agreement with Anglo Platinum in 2003.
Life of mine extended to 2017
8/15/2019 Broker Note, Aquarius Platinum, 08/03/2007 (Seymour Pierce)
http://slidepdf.com/reader/full/broker-note-aquarius-platinum-08032007-seymour-pierce 12/28
Aquarius Platinum 8 March 2007
Seymour Pierce Research 12
Kroondal - resources (at 30 June 2006)
Orebody
(Mt)
3E PGE + Au
(g/t)
3E PGE + Au
(Moz)
Measured 50.03 5.83 9.38
Indicated 9.26 6.16 1.83Inferred 1.42 6.12 0.28
Total 60.71 5.89 11.49
Source: Aquarius Platinum Limited
Marikana (50% AQPSA)
Marikana - Key recent production parameters
Processed(Mt)
Head
grade(g/t)
Recovery
rate(%)
Total 3E
PGE+Auprod (oz)
Attrib 3E
PGE+Au(oz) Costs(US$/oz)
2006 1.25 3.2 66.8% 85,913 56,617* 782
2007H1 0.99 3.18 69.4% 69,941 34,971 609
*P&SA2 effective from Q2 onwards.
Source: Aquarius Platinum Limited
The Marikana operation, which lies just 8km east of Kroondal on the western
limb of the BIC, became Aquarius’s second operating mine in 2002. The
project is still dominated by open pit production, but in January 2006,
underground production from Kroondal No. 4 shaft was transferred to
Marikana. Development at the operation’s original underground shaft isongoing and by Q2 2007 underground production represented 33% of the
total tonnage. As the operation proceeds, underground mining will become
the major source of ore. The ratio in the PGM basket is very similar to
Kroondal and currently sits at around 61.4% platinum, 28.5% palladium and
9.3% rhodium. The company sells its concentrate to IRS under a life of mine
off-take agreement.
As at Kroondal, life of the operation has been extended via a pool and share
agreement (P&SA2) with Anglo Platinum, which sees the two producers
share production and costs equally. The agreement came into effect in
September 2005 and production is now scheduled to run to 2024. Anglo
Platinum will refine and sell its own share of production under P&SA2. With
the increased resources coming from Anglo Platinum’s RPM property and
increased processing capacity (3Mt per annum) added via the retrofit of a
dense media separation plant at the mine concentrator, annual production at
Marikana is set to reach 250,000oz PGM.
P&SA2 with Anglo Platinum effective from
September 2005. Production to rise to
250,000oz PGM
8/15/2019 Broker Note, Aquarius Platinum, 08/03/2007 (Seymour Pierce)
http://slidepdf.com/reader/full/broker-note-aquarius-platinum-08032007-seymour-pierce 13/28
Aquarius Platinum 8 March 2007
13 Seymour Pierce Research
Marikana - Reserves (at 30 June 2006)
Orebody
(Mt)
3E PGE + Au
(g/t)
3E PGE + Au
(Moz)
Proved open pit 7.66 3.26 0.80
Probable open pit 0.88 5.58 0.16Proved underground 24.52 3.12 2.46
Probable underground 6.07 3.2 0.62
Total 39.13 3.22 4.04
Source: Aquarius Platinum Limited
Marikana - Resources (at 30 June 2006)
Orebody
(Mt)
3E PGE + Au
(g/t)
3E PGE + Au
(Moz)
Measured 29.77 5.05 4.83
Indicated 11.39 5.14 1.88
Inferred 3.67 3.14 0.37
Total 44.83 4.92 7.09
Source: Aquarius Platinum Limited
Everest (100% AQPSA)
Everest - Key recent production parameters
Processed(Mt)
Head
grade(g/t)
Recovery
rate(%)
Total 3E
PGE+Auprod (oz)
Attrib 3E
PGE+Au(oz)
Costs(US$/oz)
2006 1.462 3.04 67.9% 97,031 97,031 375
2007H1 1.265 2.80 72.0% 82,908 82,908 447
Source: Aquarius Platinum Limited
Everest is wholly owned by Aquarius and is the company’s only operation on
the eastern limb of the BIC. Construction began in late 2004 with first
production achieved during 2006, when the mine was brought on-line ahead
of schedule and below budget. The operation consists of an open pit and
underground workings which exploit the UG2 reef from a basin-shaped
section of the eastern limb.
The mine is planned to become an exclusively underground operation next
year, based on bord-and-pillar stoping techniques. Platinum still dominates
the PGM suite, accounting for 58% of production with palladium at 33% and
rhodium at 8%. The targeted production rate is 225,000oz PGM per annum,
with the mine expected to operate until 2016. The concentrate produced and
refined by IRS under an off-take agreement.
First production in 2006 with start up on
time and under budget
Production of 225,000 oz per year is
planned with operations running until 2016
8/15/2019 Broker Note, Aquarius Platinum, 08/03/2007 (Seymour Pierce)
http://slidepdf.com/reader/full/broker-note-aquarius-platinum-08032007-seymour-pierce 14/28
Aquarius Platinum 8 March 2007
Seymour Pierce Research 14
Everest - Reserves (as at 30 June 2006)
Orebody
(Mt)
3E PGE + Au
(g/t)
3E PGE + Au
(Moz)
Proved open pit 0.17 1.89 0.01
Probable open pit 0.17 2.86 0.02Proved underground 14.59 3.15 1.48
Probable underground 9.63 3.11 0.96
Total 24.56 3.12 2.47
Source: Aquarius Platinum Limited
Everest - Resources (as at 30 June 2006)
Orebody
(Mt)
3E PGE + Au
(g/t)
3E PGE + Au
(Moz)
Measured 19.05 3.76 2.30
Indicated 18.17 3.23 1.89
Inferred 6.92 2.36 0.53
Total 44.14 3.32 4.71
Source: Aquarius Platinum Limited
Chromite Tailings Retreatment Plant (50% Aquarius)
Chrome Tailings Retreatment plant - key production parameters
Processed(Mt)
Head grade(g/t)
Recovery
rate(%)
Total 3E
PGE+Auprod (oz)
Attrib 3E
PGE+Au(oz)
Costs(US$/oz)
2006 0.162 3.21 37.3% 6,234 3,117 394
2007H1 0.07 4.04 48.0% 3,576 1,788 300
Source: Aquarius Platinum Limited
Aquarius (50%) and its consortium partners, Ivanhoe Platinum and Nickel
(25%) and Sylvania South Africa (25%), have been treating dumps and
tailings streams from Kroondal and chromite mines surrounding Kroondal
since January 2005. As the feedstock has been processed by these
operations in the past, only a flotation circuit is required to produce a pgm
concentrate. The operation is relatively low cost therefore with no crushing or milling required.
The consortium plans full production of 28,000oz PGM per annum, of which
50% will be attributable to Aquarius Platinum. The project is planned to run
until 2016. This level of production looks some way off with the operation
lacking both the throughput and recovery rates at present. The company is
currently experimenting with the processing circuit to improve the recovery
rates from the various feedstocks. The concentrate is treated under off-take
agreements with Rustenburg Platinum Mines (RPM) and Impala Refining
Services (IRS).
The operation is not managed by AQPSA,
but by a second Aquarius subsidiary, ACS
Planned production of 28,000oz PGM per
annum, but experiencing problems with
recovery rates at present.
8/15/2019 Broker Note, Aquarius Platinum, 08/03/2007 (Seymour Pierce)
http://slidepdf.com/reader/full/broker-note-aquarius-platinum-08032007-seymour-pierce 15/28
Aquarius Platinum 8 March 2007
15 Seymour Pierce Research
Zimbabwean production
The Great Dyke contains four significant pgm-bearing geological complexes.
The Hartley Complex is the largest, containing approximately 80% of the
Dyke’s total PGM resources, and supports the Ngezi and Hartley Platinum
mines operated by Zimplats. Aquarius’ Mimosa mine lies in the WedzaComplex on the southern section of the dyke. Johnson Matthey estimates
total platinum production from Zimbabwe’s Great Dyke at 170,000oz in 2006.
Aquarius Platinum – Location Mimosa, Zimbabwe
Mimosa
Aquarius
Other platinum mines
Mimosa
Aquarius
Other platinum mines
Source: Aquarius Platinum Limited
Mimosa (50% Aquarius)
Mimosa - Key recent production parameters
Processed
(Mt)
Head
grade
(g/t)
Recovery
rate
(%)
Total 3E
PGE+Au
prod (oz)
Attrib 3E
PGE+Au
(oz)
Costs
(US$/oz)
2006 1.713 3.71 69.7% 142,407 71,204 336
2007H1 0.935 3.66 78.0% 76,078 38,039 395
Source: Aquarius Platinum Limited
Mimosa is a 50:50 joint venture with Impala Platinum. As at Kroondal and
Marikana, extraction at Mimosa is by mechanised bord-and-pillar mining.
Concentrate is transported by road across the South African border to
Rustenburg and treated by IRS. This is the least platinum-rich of the
company’s operations, with platinum accounting for just under 51% of the
major metal mix, palladium 38%, rhodium 4% and gold 8%. The mine also
produces around 2,000t of nickel, 2,000t of copper and over 100,000lbs of
cobalt. At present, the mine is expected to have a life of at least 40 years,
giving it the longest operational life of the current portfolio.
50:50 JV with Impala Platinum. US$37m
capex has raised production capacity to
195,000 oz 4E PGE
8/15/2019 Broker Note, Aquarius Platinum, 08/03/2007 (Seymour Pierce)
http://slidepdf.com/reader/full/broker-note-aquarius-platinum-08032007-seymour-pierce 16/28
Aquarius Platinum 8 March 2007
Seymour Pierce Research 16
Concentrator throughput was increased by 25% in FY2006 to 1.8Mt per
annum during the US$14m Wedza Phase IV upgrade, and has recently been
increased again to 2.1Mt per annum in the Phase V upgrade at a cost of
US$23.2m. This gives production capacity of 195,000oz PGM, which is the
long-term target production for the operation.
Operating in the current political climate of Zimbabwe clearly entails certain
challenges. At present, Zimbabwe’s administration is some way behind the
South African Government in implementation of its BEE-equivalent,
‘indigenisation’ policy. The policy is at the discussion stage, but may allow
the Government to acquire a 51% stake in certain projects, including PGM
mines such as Mimosa. 25% would be assumed without payment as soon as
the law was passed with the remaining 26% earned over a five-year period.
Interestingly, Zimplats struck a deal with the government in May last year in
which 36% of its mining claims that lie outside of its long-term mine plans
have been sold to the government for cash and an empowerment credit for
potential development by other parties. This deal also helped to secure longterm tenure over the main mining asset. A similar deal may be possible at
Mimosa, but there has yet to be a comment on the subject from either
member of the JV.
Mimosa - Reserves (as at 30 June 2006)
Orebody
(Mt)
3E PGE + Au
(g/t)
3E PGE + Au
(Moz)
Proved underground 18.52 3.71 2.21
Probable underground 14.98 3.52 1.70
Total 33.50 3.63 3.90
Source: Aquarius Platinum Limited
Mimosa - Resources (as at 30 June 2006)
Orebody
(Mt)
3E PGE + Au
(g/t)
3E PGE + Au
(Moz)
Measured 44.20 4.01 5.70
Indicated 26.21 3.58 3.02
Inferred 21.13 3.84 2.61
Total 91.54 3.85 11.33 Source: Aquarius Platinum Limited
Exploration
In October last year Aquarius signed a farm-in agreement with Bakgaga
Mining to conduct feasibility on its properties to the west of the Anglo
Platinum’s Lebowa mine on the eastern limb of the BIC. The licences
represent greenfield exploration, but Aquarius believes the landholding
contains approximately 2,000hectares underlain by both the Merensky and
UG2 PGM-bearing reefs. Aquarius will pay Bakgaga ZAR1.2m for existing
data and a budget for initial work has been set at ZAR2.5m. Should results
be positive, Aquarius will fund a feasibility study, estimated to cost ZAR20m.
8/15/2019 Broker Note, Aquarius Platinum, 08/03/2007 (Seymour Pierce)
http://slidepdf.com/reader/full/broker-note-aquarius-platinum-08032007-seymour-pierce 17/28
Aquarius Platinum 8 March 2007
17 Seymour Pierce Research
THE PGM MARKET
Where does it all go?
Applications for PGMs span a very broad range, from cancer treatment
through catalysis to jewellery. Supply sources are limited and the small
scale of the markets makes illiquidity and price volatility very regular
features. The platinum and rhodium markets are currently close to
equilibrium in terms of physical supply and demand, whilst the
palladium market is in oversupply. We expect these conditions to
broadly continue in coming years with prices easing as part of the
greater commodity market cycle. Key drivers in the PGM markets
In its latest interim review, Johnson Matthey reports that platinum demand
set a new record in 2006 at 7.02Moz. This was driven by a 15% increase in
demand from the automotive industry for autocatalysis to 4.38Moz. In recent
years, there has been a significant shift in the demand profile for platinum
with autocatalysis surpassing jewellery as the largest application. In 2006,
net demand from the automotive industry (3.6Moz) was twice the demand for
jewellery. This is a complete reversal of the situation in 1999 and 2000.
Although, other applications such as glass making, technology and
chemical/petrochemical applications have important roles to play, it is these
major applications along with the strong commodity investment market and
production rates which will dominate the market going forward.
Major demand applications for platinum in 2006
Autocat (net)
49%
chemical
5%
Electrical
6%
Glass
5%
Jewellery
25%
Petroleum
3%
Other
7%
Source: Johnson Matthey Plc
Automotive demand for platinum is dominated by diesel vehicles. Diesel
vehicles now represent over 50% of the European light duty vehicle market
and this figure is expected to continue to grow. Elsewhere, tightening
emissions legislation is forcing manufacturers to fit platinum-bearing
catalysts to exhaust systems in both heavy and light duty trucks. With the
discrepancy in price and advancement in technology, palladium has nowbegun to make initial inroads into the diesel market. Substitution of palladium
for platinum in gasoline applications has been underway for sometime.
Automotive demand will continue todominate the markets in coming years
Growing popularity of diesel vehicles and
tightening emissions legislation driving
platinum demand
Palladium now being used in some dieselapplications
8/15/2019 Broker Note, Aquarius Platinum, 08/03/2007 (Seymour Pierce)
http://slidepdf.com/reader/full/broker-note-aquarius-platinum-08032007-seymour-pierce 18/28
Aquarius Platinum 8 March 2007
Seymour Pierce Research 18
It appears likely that these substitution trends will continue wherever viable.
This may lead to a small, but significant reduction in platinum demand.
Platinum jewellery demand remains under pressure at these high price
levels as manufacturing margins are squeezed. The crucial, Chinese market
lost a further 11.2%. Palladium jewellery has replaced much of the lower-end
platinum market and this situation is expected to continue.
Rhodium demand is dominated by its use in autocatalysis and its usage is
expected to increase steadily with the growth in car production amongst the
emerging economies and the general tightening of emissions legislation
worldwide.
Amongst the minor PGMs, ruthenium has seen a considerable increase in
demand in recent times from the electronics industry, where it is used to
improve the storage capacity in some hard disks. This has lead to a marked
increase in the metal’s price. Demand for iridium has also risen, driven byincreased usage in the electrochemical and chemical industries.
Major demand applications for palladium in 2006
Autocat (net)
49%
Chemical
5%
Dental
12%
Electronics
15%
Jewellery
16%
Other
3%
Source: Johnson Matthey Plc
Platinum jewellery demand continuing to
wane
Major demand applications for rhodium in 2006
Autocat (net)
87%
Glass5%
Other
2%Electrical
1%
Chemical
5%
Source: Johnson Matthey Plc
8/15/2019 Broker Note, Aquarius Platinum, 08/03/2007 (Seymour Pierce)
http://slidepdf.com/reader/full/broker-note-aquarius-platinum-08032007-seymour-pierce 19/28
Aquarius Platinum 8 March 2007
19 Seymour Pierce Research
Platinum production is dominated by South Africa with the country supplying
78% of global production. We believe, if major producers, such as Aquarius
can continue to make good on their expansion plans, there should be
sufficient metal available for the expected modest growth in demand in
coming years. Furthermore, expansion of platinum mining operations on theBushveld will produce additional palladium and rhodium as by products,
helping to stabilise those markets. Supply of palladium from Russia is
expected to be relatively stable around the 4Moz.
Placing this scenario against the backdrop of the commodity cycle leads us
to forecast a continuation of strong PGM prices during 2007 and 2008. The
greatest unknown at the present time must be the role of commodity
investors within the markets. Trading on the futures market such as TOCOM
and NYMEX typically has the most pronounced effect on short-term price
movement in the platinum and palladium markets. This is likely to continue
and will mean price movement is unlikely to plot a smooth curve.
Expansion in the South African PGM mining
sector will supply additional metal to the
market going forward
Platinum production by country in 2006
South Africa
78%
Russia13%
North America
5%
Others
2%
Zimbabwe
2%
Source: Johnson Matthey Plc
Aquarius Platinum – Palladium production by country in 2006
Zimbabwe
2%
North America
11%
Others
2%
Russia
51%
South Africa
34%
Source: Johnson Matthey Plc
We are forecasting a decline in all PGM
prices from current levels, but must expect
volatility in the short term
8/15/2019 Broker Note, Aquarius Platinum, 08/03/2007 (Seymour Pierce)
http://slidepdf.com/reader/full/broker-note-aquarius-platinum-08032007-seymour-pierce 20/28
Aquarius Platinum 8 March 2007
Seymour Pierce Research 20
Seymour Pierce metal price estimates
Year end 30 June 2004 2005 2006 2007E 2008E
Platinum (US$/oz) 773 863 1,006 1,156 1,044
Palladium (US$/oz) 210 218 268 324 293
Rhodium (US$/oz) 640 1,119 3,015 5,146 5,124Ruthenium (US$/oz) 48 67 131 395 535
Iridium (US$/oz) 133 166 247 367 356
Gold (US$/oz) 410 445 604 620 485
Nickel (US$/lb) 5.30 6.42 8.57 10.64 8.62
Copper (US$/lb) 1.04 1.43 2.31 2.89 2.50
Cobalt (US$/lb) 19.02 14.92 15.15 15.30 15.45
Source: Seymour Pierce Limited estimates
8/15/2019 Broker Note, Aquarius Platinum, 08/03/2007 (Seymour Pierce)
http://slidepdf.com/reader/full/broker-note-aquarius-platinum-08032007-seymour-pierce 21/28
Aquarius Platinum 8 March 2007
21 Seymour Pierce Research
FINANCIALS
Reality check
Aquarius plans to increase production by over 250,000oz (57%) in the
near term. With PGM prices expected to continue above their historic
averages in the short term, Aquarius should enjoy a substantial
increase in earnings and cash generation in coming years. The
company has only modest debt, so how the management plans to
make best use of its cash surplus is the most prominent question at
the current time. At the recent interim results, CEO Stuart Murray
clearly stated that the company was actively evaluating acquisition
opportunities, principally within South Africa. Aquarius is certainly not
alone amongst the South African platinum producers in looking for
acquisitions. Only last month, Impala Platinum tabled a 55p/share
(£297m) cash offer for Aim-listed African Platinum (Afplats),representing a 35% premium to the share price. Afplats’ main asset is
the Leeuwkop project on the western limb of the Bushveld with 92Moz
of resources. Aquarius’ previous concern has been the high
development costs of Bushveld projects, but with strong metal prices
expected to continue, the perspective on such projects appears to be
changing. If suitable projects can’t be found, the pledge has been made
to return cash to shareholders.
Production estimates
The next two years is clearly a key period for Aquarius with increased
production expected at all operations. By FY2008, the company’s long termproduction targets should have been all but achieved at the four major
mines. These targets are 505,000oz at Kroondal, 250,000oz at Marikana,
225,000oz at Everest and 195,000oz at Mimosa in Zimbabwe. We expect
this will boost production attributable to Aquarius by 57% from the 2006 level
of 448,000oz, based on its current stake in AQPSA, to 704,000oz.
The rapid expansion at Everest and Marikana will see these operations
increase their contribution in total attributable production to 32% (+10%) and
18% (+5%), respectively. In contrast the relative shares of production from
Kroondal and Mimosa will fall to 36% and 14%, respectively. However,
Kroondal will remain the most significant operation, producing more thantwice as much metal as the next largest operation, Marikana.
The relative proportions of the company’s PGM basket should show little
change over the next five years with platinum accounting for just over 59% of
total 3E production, palladium 32% and rhodium 9%. Beyond FY2008,
production from existing operations should stabilise at, or around, the target
levels as outlined above for the long term.
As production rises, costs per ounce are expected to fall significantly at all
the company’s South African operations. Marikana should see the greatest
fall corresponding with the large rise in production. We are forecasting a
modest increase in costs at Mimosa in US dollar terms, but with the hyper-inflationary environment of Zimbabwe any forecast may be subject to
change.
Attributable production to rise by 57%
All mines to move to long term targetproduction levels by FY2008
Weighted average production costs to fall
8/15/2019 Broker Note, Aquarius Platinum, 08/03/2007 (Seymour Pierce)
http://slidepdf.com/reader/full/broker-note-aquarius-platinum-08032007-seymour-pierce 22/28
Aquarius Platinum 8 March 2007
Seymour Pierce Research 22
Overall, we forecast production weighted average costs will fall by 8.2%
between FY2006 and FY2008, reaching US$369/(3E PGE+Au) oz by
FY2008.
Aquarius Platinum Limited - Production estimates
Year end 30 June 2004 2005 2006 2007E 2008E
South African Production
Aquarius Platinum South Africa (AQPSA) mines
Kroondal (50% AQPSA)
Total 4E prod. (000 oz) 237.6 324.7 439.4 503.3 503.3
Attrib. 4E prod. (000 oz) 160.2 162.4 219.7 251.7 251.7
Cost (US$/oz) 315 361 379 386 336
Marikana (50% AQPSA)
Total 4E prod. (000 oz) 87.2 99.2 85.9 170.0 250.0Attrib. 4E prod. (000 oz) 87.2 99.2 56.6 85.0 125.0
Cost (US$/oz) 626 628 685 593 506
Everest (100% AQPSA)
Total 4E prod. (000 oz) 0.0 0.0 97.0 175.0 220.0
Cost (US$/oz) - - 353 404 291
AQPSA total production
Total 4E prod. (000 oz) 324.8 423.9 622.4 848.3 973.3
Attrib. 4E prod. (000 oz) 247.4 261.5 373.4 511.7 596.7
Cost (US$/oz) 398 423 417 431 369
Other South African production
Chromite Tailings Retreatment Plant (50% Aquarius)
Total 4E prod. (000 oz) 0.0 2.1 6.2 8.6 12.3
Attrib. 4E prod. (000 oz) 0.0 1.1 3.1 4.3 6.2
Cost (US$/oz) 0 376 370 290 241
Zimbabwean production
Mimosa (50% AQP)
Total 4E prod. (000 oz) 119.4 130.2 142.4 167.7 192.7
Attrib. 4E prod. (000 oz) 59.7 65.1 71.2 83.8 96.4
Cost (US$/oz)) 253 358 336 395 375
Total
Total 4E prod. (000 oz) 444.2 556.2 771.0 1,024.7 1,178.4
Attrib. 4E prod. (000 oz) 307.1 327.7 447.7 599.8 699.2
Cost (US$/oz) 359 408 402 424 369
Source: Aquarius Platinum Limited and Seymour Pierce Limited estimates
8/15/2019 Broker Note, Aquarius Platinum, 08/03/2007 (Seymour Pierce)
http://slidepdf.com/reader/full/broker-note-aquarius-platinum-08032007-seymour-pierce 23/28
Aquarius Platinum 8 March 2007
23 Seymour Pierce Research
Earnings
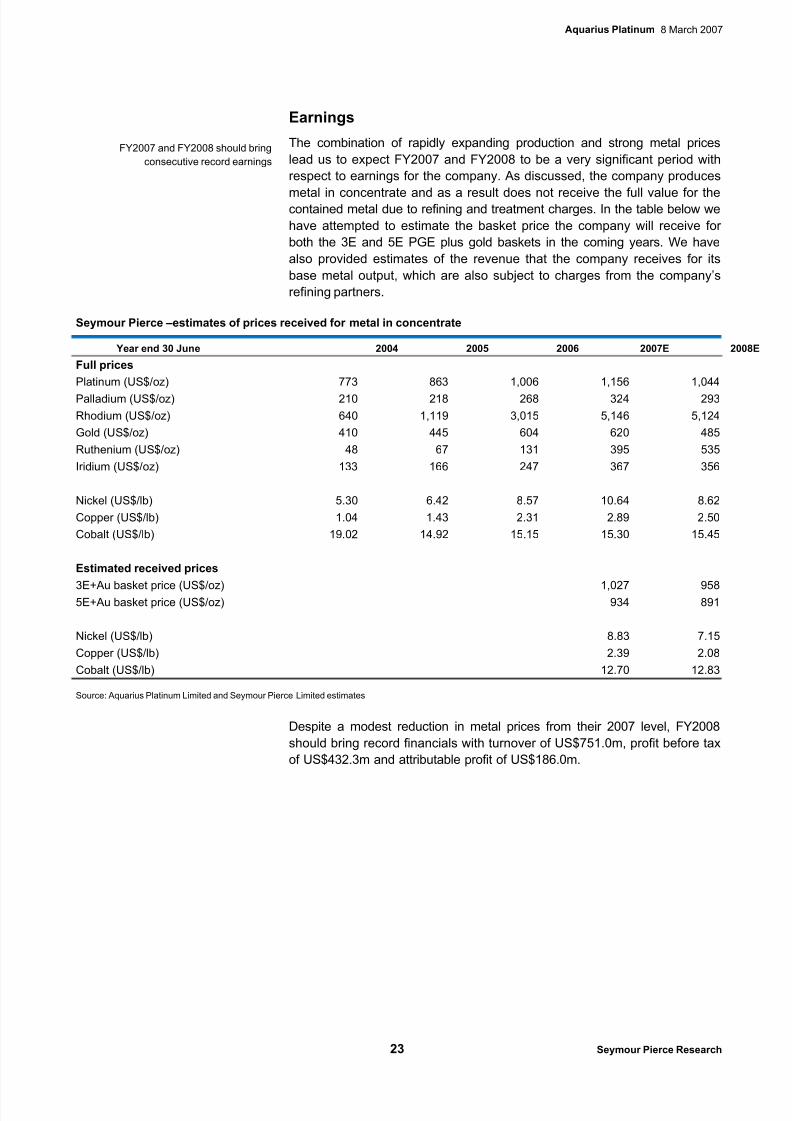
The combination of rapidly expanding production and strong metal prices
lead us to expect FY2007 and FY2008 to be a very significant period with
respect to earnings for the company. As discussed, the company produces
metal in concentrate and as a result does not receive the full value for thecontained metal due to refining and treatment charges. In the table below we
have attempted to estimate the basket price the company will receive for
both the 3E and 5E PGE plus gold baskets in the coming years. We have
also provided estimates of the revenue that the company receives for its
base metal output, which are also subject to charges from the company’s
refining partners.
Seymour Pierce –estimates of prices received for metal in concentrate
Year end 30 June 2004 2005 2006 2007E 2008E
Full prices
Platinum (US$/oz) 773 863 1,006 1,156 1,044
Palladium (US$/oz) 210 218 268 324 293
Rhodium (US$/oz) 640 1,119 3,015 5,146 5,124
Gold (US$/oz) 410 445 604 620 485
Ruthenium (US$/oz) 48 67 131 395 535
Iridium (US$/oz) 133 166 247 367 356
Nickel (US$/lb) 5.30 6.42 8.57 10.64 8.62
Copper (US$/lb) 1.04 1.43 2.31 2.89 2.50
Cobalt (US$/lb) 19.02 14.92 15.15 15.30 15.45
Estimated received prices3E+Au basket price (US$/oz) 1,027 958
5E+Au basket price (US$/oz) 934 891
Nickel (US$/lb) 8.83 7.15
Copper (US$/lb) 2.39 2.08
Cobalt (US$/lb) 12.70 12.83
Source: Aquarius Platinum Limited and Seymour Pierce Limited estimates
Despite a modest reduction in metal prices from their 2007 level, FY2008
should bring record financials with turnover of US$751.0m, profit before tax
of US$432.3m and attributable profit of US$186.0m.
FY2007 and FY2008 should bring
consecutive record earnings
8/15/2019 Broker Note, Aquarius Platinum, 08/03/2007 (Seymour Pierce)
http://slidepdf.com/reader/full/broker-note-aquarius-platinum-08032007-seymour-pierce 24/28
Aquarius Platinum 8 March 2007
Seymour Pierce Research 24
Aquarius Platinum Limited - earnings estimates
Year end 30 June (US$m) 2004 2005 2006 2007E 2008E
Attrib. 3E+Au prod. (000 oz) 307.1 327.7 447.7 599.8 699.2
Mine Sales 175.1 210.1 417.4 634.5 750.1Other income 14.5 8.3 14.1 14.1 0.9
Turnover 189.6 218.5 431.5 648.6 751.0
Operating costs 112.6 153.8 199.5 254.3 264.5
Dep’n & Amor’n 12.2 26.5 28.8 31.2 32.5
Admin 8.6 6.0 8.1 11.1 13.2
Royalties & other 0.6 1.4 1.8 4.8 8.6
Exceptionals 5.0 0.0 0.0 0.0 0.0
PBIT 60.5 30.8 193.3 347.1 432.3
Net interest -11.5 -2.8 -1.2 2.0 5.1
Exceptional items 5.0 0.0 0.0 0.0 0.0
Profit before tax 49.0 28.1 192.1 349.1 437.3
Tax 5.7 3.4 51.1 104.7 131.2
Minorities -4.8 -3.7 -55.4 -101.4 -120.2
Attributable profit 38.6 21.0 85.6 143.0 186.0
Dividend 2.5 5.0 9.1 50.1 93.0
Retained profit 36.2 16.0 76.5 93.0 93.0
Recurrent profit 33.7 21.0 85.6 143.0 186.0
EPS (UScents) 47.18 25.32 100.86 168.98 219.74
Recurrent EPS (UScents) 41.13 25.32 100.86 168.98 219.74
DPS (UScents) 3.00 8.00 24.00 59.14 109.87
Source: Aquarius Platinum Limited and Seymour Pierce Limited estimates
South African Royalties
As with all South African producers, the company’s South African earnings
will be liable for mineral royalties from May 2009 onwards. The company has
been paying revenue-based royalties in Zimbabwe since 2004 at the rate of
3% for precious metals and 2% for base metals. The onset of royaltypayments in South Africa coincides with the deadline for mining companies
to convert their royalty-free ‘old order’ mining rights to ‘new order’ mining
licences under the 2002 Mining Act. The industry had been hoping that the
original revenue-based model proposed in the draft legislation in 2003 would
be revised to a profit-based model. This did not prove to be the case when
new drafts were released in October last year. However, the government did
reduce rates for refined and semi-processed products in an effort to
encourage value-enhancing mineral beneficiation within South Africa. The
table below gives the rates relevant to Aquarius.
South African production royalties to start in
2009
8/15/2019 Broker Note, Aquarius Platinum, 08/03/2007 (Seymour Pierce)
http://slidepdf.com/reader/full/broker-note-aquarius-platinum-08032007-seymour-pierce 25/28
Aquarius Platinum 8 March 2007
25 Seymour Pierce Research
Proposed South African mining royalties
Metal Unrefined (%) Refined (%)
PGM 6.0 3.0
Gold & Silver 3.0 1.5
Base metals 4.0 2.0
Source: South African National Treasury Dept
Although Aquarius only produces metal in concentrate, and not refined
product, we believe the company will be eligible for the lower rate. During a
recent global roadshow by the South African Department of Minerals and
Energy, senior officials implied that companies transferring material for
beneficiation within South Africa would be eligible for lower rates, assuming
an agreement can be reached with the refiner concerned. Although these
rates are yet to be set firm, as the bill has not been put before parliament, we
have applied them to the company’s revenues.
Minorities
The substantial payments to minorities relates to the other stakeholders in
AQPSA, namely SavCom (26%) and Impala Platinum (20%). As discussed
earlier, Aquarius has recently begun a transaction to exchange SavCom’s
stake in AQPSA for a significant shareholding in Aquarius. So far 3.5% of
SavCom’s holding has been acquired for US$46.7m. The deadline for the
remainder of this transaction remains unqualified in any detail and we have
not attempted to predict this in our forecasts. Naturally, attributable profit will
rise as minorities fall, but estimating the revised share base and all
associated distributions of earnings in Aquarius is extremely difficult. If the
company continues to use its growing cash pile to buy out SavCom, dilutionwill be kept to a minimum, but this will be governed ultimately by BEE
regulations.
We believe Aquarius should qualify for the
lower royalty rates
8/15/2019 Broker Note, Aquarius Platinum, 08/03/2007 (Seymour Pierce)
http://slidepdf.com/reader/full/broker-note-aquarius-platinum-08032007-seymour-pierce 26/28
Aquarius Platinum 8 March 2007
Seymour Pierce Research 26
Cash flow estimates
The combination of increasing production and strong metal prices means
Aquarius has the potential to be extremely cash rich in coming years.
Operating cash flow is forecast to rise to US$446.2m in FY2008 and will
continue at a healthy rate thereafter. Best use of the funds is obviously a keystrategy point for Aquarius. The company has already stated its intention to
pay off interest-bearing loans, and we have included full payment of the
US$13.8m loan from SavCom in the FY2007 cash flow. As discussed, a
cash payment for a small percentage of SavCom’s holding in AQPSA has
also been made. Additional uses include acquisitions and exploration. To
this end the company entered a farm-in agreement with Bakgaga Mining late
last year to conduct exploration and feasibility studies over five farms on the
northern tip of the Bushveld’s western limb. We await news of any significant
acquisitions.
Aquarius Platinum Limited - Cash flow estimates
Year end 30 June (US$m) 2004 2005 2006 2007E 2008E
Operating profit 60.5 30.8 193.3 347.1 432.3
Dep'n and Amor’n 12.2 26.5 28.8 31.2 32.5
Other non-cash 0.0 0.0 0.0 0.0 0.0
Change in working cap 16.6 -17.8 -25.6 -31.3 -18.6
Operating cash flow 89.2 39.5 196.5 347.1 446.2
Net interest -8.4 -3.2 -2.1 2.0 5.1
Dividends -4.8 -5.0 -9.1 -50.1 -93.0
Taxation -3.7 -1.6 -32.0 -104.7 -131.2
-16.9 -9.8 -43.3 -152.8 -219.1
Net capital expenditure -28.5 -92.4 -102.9 -54.6 -30.0
Acquisitions/disposals 18.2 4.3 0.0 0.0 0.0
66.8 -53.5 59.5 189.7 290.0
Debt raised 4.6 28.1 29.1 -13.8 0.0
Shares issued 16.0 31.7 7.2 0.0 0.0
BEE Transaction 0.0 0.0 0.0 -46.7 0.0
Cash flow 82.6 1.4 86.7 79.2 197.1
Forex movements 0.0 -0.9 -2.6 0.0 0.0Cash at start of year 40.3 77.9 78.4 162.4 241.6
Cash at end of year 122.9 78.4 162.4 241.6 438.7
Source: Aquarius Platinum Limited and Seymour Pierce Limited estimates
The key point for shareholders remains the dividend policy the company will
adopt in coming years. Dividend payouts from the other major South African
platinum producers in 2006 ranged between 32% (Lonmin) up to 93%
(Northam) of earnings attributable to ordinary shareholders. Aquarius paid
24% in comparison. Going forward, we have assumed Aquarius will increase
its dividend rate to move into line with its producing peers. A rate equivalent
to Northam’s may be too high, but a rate of 50% would place Aquarius in linewith Impala (48%, excluding special dividends). The company has pledged
to return cash to shareholders if suitable corporate projects can not be
found.
Operating cash flow expected to increase
further in FY2008
We include full payment of the SavCom
loan in the FY2007 cash flows
We assume a substantial rise in dividend
payments from FY2007 onwards
8/15/2019 Broker Note, Aquarius Platinum, 08/03/2007 (Seymour Pierce)
http://slidepdf.com/reader/full/broker-note-aquarius-platinum-08032007-seymour-pierce 27/28
Aquarius Platinum 8 March 2007
27 Seymour Pierce Research
Balance sheet
Even with a much more generous dividend policy, cash generation remains
so great that there is a lack of gearing in the balance sheet going forward.
This gives an obvious opportunity for the company to better utilise its ever
strengthening asset base, either via acquisition or major corporatedevelopment. It should be remembered that a significant portion of the
group’s cash sits within AQPSA, and hence Aquarius’ effective stake is
reduced in line with its shareholding in the subsidiary. Even so, the cash pile
remains substantial. This could be considered as a nice problem to have, but
with limited acquisition opportunities available on the Bushveld, two major
mines scheduled to close by 2017 and long lead times on mine
developments, this is certainly a significant issue for management to
consider.
Aquarius Platinum Limited - balance sheet estimates
Year end 30 June (US$m) 2004 2005 2006 2007E 2008E
Tangible assets 361.3 409.3 461.2 484.6 482.1
Intangible assets 0.0 0.0 0.0 0.0 0.0
Fixed assets 361.3 409.3 461.2 484.6 482.1
Stocks 10.7 16.3 19.8 26.6 31.0
Trade Debtors 23.3 44.7 66.7 100.3 116.1
Cash 77.9 75.3 162.4 241.6 438.7
Other 0.0 0.0 0.0 0.0 0.0
Current assets 111.9 136.3 249.0 368.5 585.8
Short-term debt 15.6 0.0 0.0 0.0 0.0Trade creditors 19.1 25.5 32.9 41.9 43.5
Tax and other 7.1 9.9 2.6 2.6 2.6
Current liabilities 41.8 35.5 35.5 44.5 46.2
Long-term debt 59.6 140.1 130.1 130.1 130.1
Interest bearing liabilities 62.7 16.1 45.4 31.6 31.6
Deferred tax liabilities 56.9 53.8 73.3 73.3 73.3
Provisions 18.0 24.5 32.1 32.1 32.1
Non current liabilities 197.3 234.5 280.9 267.1 267.1
Net assets 234.2 275.6 393.8 541.4 754.6
Shareholders' funds 225.0 243.0 315.6 408.5 501.5
Minorities 9.2 32.6 78.3 132.9 253.1
Equity Interests 234.2 275.6 393.8 541.4 754.6
Source: Aquarius Platinum Limited and Seymour Pierce Limited estimates
8/15/2019 Broker Note, Aquarius Platinum, 08/03/2007 (Seymour Pierce)
http://slidepdf.com/reader/full/broker-note-aquarius-platinum-08032007-seymour-pierce 28/28
Important Notes
Our research recommendations are issued and approved for distribution within the UnitedKingdom by Seymour Pierce Limited only to market counterparties and intermediate customersas defined under the FSA rules. Our research is not directed at, may not be suitable for andshould not be relied upon by any other person. The information contained in our research iscompiled from a number of sources and is believed to be correct, but cannot be guaranteed. Itis not to be construed as an offer, invitation or solicitation to buy or sell any securities of any of the companies referred to within it. All statements made and opinions expressed are made asat the date on the face of the material and are subject to change without notice. Where pricesof securities are mentioned, these are the mid-market prices as at the close-of-business on the
business day immediately preceding the date of the research. The meanings of our researchratings, together with the proportion of our recommendations issued during the previous quarter carrying each rating, is set out on our website at www.seymourpierce.com. Seymour PierceLimited and/or its associated companies and ultimate holding company may from time-to-timeprovide investment or other services to, or solicit such business from, any of the companiesreferred to in research material. In addition, they and/or their directors and employees and/or any connected persons may have an interest in the securities of any of the companies in thereport and may from time-to-time add to or dispose of such interests. Details of the significantconflicts relating to the companies that we research are set out on our websitewww.seymourpierce.com, together with a summary of our policies for managing conflicts of interest. Seymour Pierce does not meet all of the FSA standards for managing conflicts of interest, as a result our research should not be regarded as an impartial or objectiveassessment of the value or prospects of its subject matter, though of course we will alwaysensure that it remains clear, fair and not misleading.
Seymour Pierce Limited is authorised and regulated by the Financial Services Authority, and isa member of the London Stock Exchange.
Key to material interests
1. The analyst has a personal holding of the securities issued by the company, or of derivativesrelated to such securities.
2. Seymour Pierce Limited or an affiliate owns more than 5% of the issued share capital of thecompany.
3. Seymour Pierce Limited or an affiliate is party to an agreement with the company relating tothe provision of investment banking services, or has been party to such an agreement withinthe past 12 months. Our corporate broking agreements include a provision that we will
prepare and publish research at such times as we consider appropriate.4. Seymour Pierce or an affiliate has been lead manager or co-lead manager of a publiclydisclosed offer of securities for the company within the past 12 months.
5. Seymour Pierce is a market maker or liquidity provider in the securities issued by thecompany.
6. Seymour Pierce is party to an agreement with the company relating to the production of research recommendations.
Distribution of ratingsOur research ratings are defined with reference to the amount by which we expect the absolutereturn to change over the next 12 months:
Rating Definition
Buy Absolute return expected to increase by more than 10%
Outperform Absolute return expected to increase by between 5% and 10%
Hold Absolute return expected to change by between -5% and +5%Underperform Absolute return expected to decrease by between 5% and 10%
Sell Absolute return expected to decrease by more than 10%
As at 31 December 2006 the distribution of all our published recommendations is as follows:
Rating
Proportion of
recommendations
Proportion of these provided with
investment banking services
Buy 31% 65%
Outperform 26% 20%
Hold 31% 29%
Underperform 7% 6%
Sell 2% 0%