2016 SEMI-ANNUAL REPORT June 30, 2016 Brookfield Global Listed Infrastructure Fund Brookfield Global Listed Real Estate Fund Brookfield U.S. Listed Real Estate Fund Brookfield Real Assets Securities Fund Brookfield Investment Management
Transcript
2016SEMI-ANNUAL REPORT
June 30, 2016
Brookfield Global Listed Infrastructure FundBrookfield Global Listed Real Estate FundBrookfield U.S. Listed Real Estate FundBrookfield Real Assets Securities Fund
Brookfield Investment Management
IN PROFILE
Brookfield Investment Management (the “Firm”) is an SEC-registeredinvestment adviser providing listed real assets strategies including realestate equities, infrastructure equities, real asset debt and diversified realassets. With over $16 billion of assets under management as of June 30,2016, the Firm manages separate accounts, registered funds andopportunistic strategies for institutional and individual clients, includingfinancial institutions, public and private pension plans, insurancecompanies, endowments and foundations, sovereign wealth funds and highnet worth investors. Headquartered in New York, the Firm and its affiliatesalso maintain offices in Boston, Chicago, Hong Kong, London and Toronto.Further information is available at www.brookfieldim.com. BrookfieldInvestment Management Inc. is a wholly owned subsidiary of BrookfieldAsset Management, a leading global alternative asset manager withapproximately $250 billion of assets under management as of June 30,2016. For more information, go to www.brookfield.com.
We are pleased to provide the Semi-Annual Report for Brookfield Global Listed Infrastructure Fund (the“Infrastructure Fund”), Brookfield Global Listed Real Estate Fund (the “Global Real Estate Fund”), Brookfield U.S.Listed Real Estate Fund (the “U.S. Real Estate Fund”) and Brookfield Real Assets Securities Fund (the “RealAssets Securities Fund”) (each a “Fund” and, collectively, the “Funds”) for the six-month period ended June 30,2016.
Many of the issues facing financial markets continued into 2016, including heightened economic and financialuncertainties in China, volatile commodity prices (particularly oil) and monetary policy decisions around the globe.The first six weeks of 2016 were marked by extreme volatility as the MSCI World and S&P 500® Indexes fell11.47% and 10.27%, respectively, through February 11. Markets then staged a historic intra-quarter rally as theprice of crude oil appeared to bottom.
During the second quarter, a more positive narrative around China’s economy emerged, oil prices continued torise, and first-quarter earnings results were generally better than anticipated. Equity markets were relatively quietin the second quarter, grinding higher in April and May; but the quarter then ended in volatile fashion following theJune 23 U.K. referendum, in which voters elected to leave the European Union. Global equities fell sharplyimmediately following the vote, before recouping most losses in the last week of trading.
Despite the rebound that followed the Brexit-related selloff, nervous investors flocked to perceived “safe” assets. InJune, the yield on German 10-year bunds fell into negative territory for the first time to close the quarter at -0.08%.Fitch Ratings estimated the global total of sovereign debt with negative yields had reached $11.7 trillion byJune 27, up 19% from the end of April. In the U.S., 10-year Treasury yields fell 80 basis points during the period, to1.47% as of June 30.
During the period, the U.S. Federal Reserve kept its benchmark lending rate steady at 0.25% to 0.50% and FederalReserve officials reduced estimates of how much they expect to raise the federal funds rate in 2016. In Europe,the European Central Bank continued its easing measures, even expanding its bond-buying program to includecorporate bonds; and in Japan, the Bank of Japan adopted negative interest rates in an effort to stave off thedeflation that has plagued the country since the 1990s.
We believe that bottom-up security selection will take on an even more important role amid the uncertain marketenvironment post-Brexit. While mindful of the potential headwinds, we also view market dislocations asopportunities to buy assets at attractive long-term points of entry. Another potential side benefit of Brexit is thelikely continuation of lower-for-longer interest rates, which should be supportive for real asset securities. Moreover,the fundamentals underlying the cash flows of these companies have potentially defensive characteristics, whichcan be beneficial in periods of market uncertainty.
In addition to performance information, this report provides the Funds’ unaudited financial statements as ofJune 30, 2016.
We welcome your questions and comments, and encourage you to contact our Investor Relations team at (855)777-8001 or visit us at www.brookfieldim.com for more information. Thank you for your support.
Sincerely,
Brian F. Hurley
PresidentBrookfield Investment Funds
Craig Noble
Chief Executive Officer and Chief Financial OfficerBrookfield Investment Management Inc.
LETTER TO SHAREHOLDERS
2016 Semi-Annual Report 1
Must be preceded or accompanied by a prospectus.
Quasar Distributors, LLC is the distributor of Brookfield Investment Funds.
These views represent the opinions of Brookfield Investment Management Inc. and are not intended to predict ordepict the performance of any investment. These views are as of the close of business on June 30, 2016 andsubject to change based on subsequent developments.
The Fund’s portfolio holdings are subject to change without notice. The mention of specific securities is not arecommendation or solicitation for any person to buy, sell or hold any particular security. There is no assurancethat the Brookfield Global Listed Infrastructure Fund currently holds these securities. Please refer to the Scheduleof Investments contained in this report for a full listing of fund holdings.
Mutual fund investing involves risk. Principal loss is possible.
A basis point (bps) is a unit that is equal to 1/100 of 1%, and is used to denote the change in a financialinstrument. Cash flows refer to the amount of cash generated and used by a company over a given period.
Yield refers to the discount rate that can be used to make the present value of all of a bond’s cash flows equal toits price.
The MSCI World Index is a free float-adjusted market capitalization weighted index that is designed to measurethe equity performance of developed markets.
The S&P 500 Index is a broad based unmanaged index of 500 stocks, which is widely recognized asrepresentative of the U.S. equity market in general.
LETTER TO SHAREHOLDERS (continued)
2 Brookfield Investment Management Inc.
As a shareholder of a fund, you may incur two types of costs: (1) transaction costs, including sales charges (loads)on purchase payments and contingent deferred sales charges and redemption fees on redemptions; and (2)ongoing costs, including management fees, distribution (12b-1) fees and other fund expenses. This example isintended to help you understand your ongoing costs (in dollars) of investing in the Funds and to compare thesecosts with the ongoing costs of investing in other mutual funds. The example is based on an investment of $1,000invested at the beginning of the period and held for the entire period as indicated below.
Actual Fund Return
The table below provides information about actual account values and actual expenses. You may use theinformation on this line, together with the amount you invested, to estimate the expense that you paid over theperiod. Simply divide your account value by $1,000 (for example, an $8,600 account value divided by $1,000 =8.6), then multiply the result by the number in the first line under the heading entitled “Expenses Paid DuringPeriod” to estimate the expenses you paid on your account during this period.
Hypothetical Example for Comparison Purposes
The table below also provides information about hypothetical account values and hypothetical expenses based onthe Funds’ actual expense ratio and an assumed rate of return of 5% per year before expenses, which is not theFunds’ actual return. The hypothetical account values and expenses may not be used to estimate the actualending account balance or expenses you paid for the period. You may use this information to compare the ongoingcosts of investing in the Funds and other funds. To do so, compare this 5% hypothetical example with hypotheticalexamples that appear in shareholders’ reports of other funds.
Please note that the expenses shown in the table are meant to highlight your ongoing costs only and do not reflectany transactional costs, such as sales charges (loads) and redemption fees. Therefore, the hypothetical accountvalues and expenses in the table are useful in comparing ongoing costs only, and will not help you determine therelative total costs of owning different funds. In addition, if these transactional costs were included, your costsoverall would have been higher.
(1) Expenses are equal to the Funds’ annualized expense ratio by class multiplied by the average account value over the period, multiplied by182/366 (to reflect a six-month period).
ABOUT YOUR FUND’S EXPENSES (Unaudited)
4 Brookfield Investment Management Inc.
Average Annual Total Returns for Periods Ended June 30, 2016. Six Months† One Year Three Years Since Inception
† Returns for less than one year are not annualized.1 Operations commenced on December 1, 2011.2 Operations commenced on December 29, 2011.3 Operations commenced on May 1, 2012.4 Operations commenced on December 11, 2013.5 Operations commenced on November 19, 2014.6 Returns reference Class I’s inception date.7 The Dow Jones Brookfield Global Infrastructure Composite Index is calculated and maintained by S&P Dow Jones Indices and comprisesinfrastructure companies with at least 70% of their annual cash flows derived from owning and operating infrastructure assets, including MasterLimited Partnerships.8 The FTSE EPRA/NAREIT Developed Index is a free-float adjusted, liquidity, size and revenue screened index designed to track theperformance of listed real estate companies and REITs worldwide.9 The MSCI U.S. REIT Index is a total return market capitalization-weighted index which prices once per day after market close. It is calculatedby MSCI and is composed of equity REITs that are included in the MSCI U.S. Investable Market 2500 Index. The Index does not reflectdeduction for fees, expenses or taxes.10 The MSCI World Index is a free float-adjusted market capitalization weighted index that is designed to measure the equity performance ofdeveloped markets.11 The Blended Index comprises 33.33% FTSE EPRA/NAREIT Developed Index, 33.33% Dow Jones Brookfield Global InfrastructureComposite Index, 13.34% Fixed Income Blend: BAML Global High Yield Index 70%/BAML Global Corporate Index 30%, 10.00% S&P GlobalNatural Resources Index, 6.67% Bloomberg Commodity Index and 3.34% Barclays Global Inflation Linked Bond Index. The Fixed Income
FUND PERFORMANCE (Unaudited)All Periods Ended June 30, 2016
2016 Semi-Annual Report 5
Blend is comprised of 70% BAML Global High Yield Index and 30% BAML Global Corporate Index. The BAML Global High Yield Index is anunmanaged, commonly accepted measure of the performance of global high yield corporate securities. The BAML Global Corporate Index isan unmanaged, commonly accepted measure of the performance of global investment grade corporate securities. The S&P Global NaturalResources Index includes 90 of the largest publically traded companies in natural resources and commodities businesses that meet specificinvestability requirements, offering investors diversified and investable equity exposure across three primary commodity-relatedsectors: agribusiness, energy and metals & mining. The Bloomberg Commodity Index (BCOM) is a broadly diversified commodity price indexthat tracks prices of futures contracts on physical commodities in the commodity markets. The Barclays Global Inflation Linked Bond Indexincludes securities which offer the potential for protection against inflation as their cash flows are linked to an underlying inflation index. Allsecurities included in the index have to be issued by an investment-grade rated sovereign in its local currency. These indices do not reflect anyfees, expenses or sales charges. It is not possible to invest directly in an index. Index performance is shown for illustrative purposes only anddoes not predict or depict the performance of the Fund.
Performance data quoted represents past performance; past performance does not guarantee future results. Theinvestment return and principal value of an investment will fluctuate so that an investor’s shares, when redeemed,may be worth more or less than their original cost. Current performance of the Funds may be lower or higher thanthe performance quoted. Performance data current to the most recent month end may be obtained by calling855.244.4859. The Funds impose a 2.00% redemption fee on shares redeemed within 60 days. Performance datadoes not reflect the imposition of the redemption fee and if it had, performance would have been lower.Performance shown including sales charge reflects the Class A maximum sales charge of 4.75% and the Class CContingent Deferred Sales Charge (CDSC) of 1.00%. Performance data excluding sales charge does not reflectthe deduction of the sales charge or CDSC and if reflected, the sales charge or fee would reduce theperformance quoted.
Investment performance reflects fee waivers, expenses and reimbursements in effect. In the absence of suchwaivers, total return and NAV would be reduced.
FUND PERFORMANCE (Unaudited) (continued)All Periods Ended June 30, 2016
6 Brookfield Investment Management Inc.
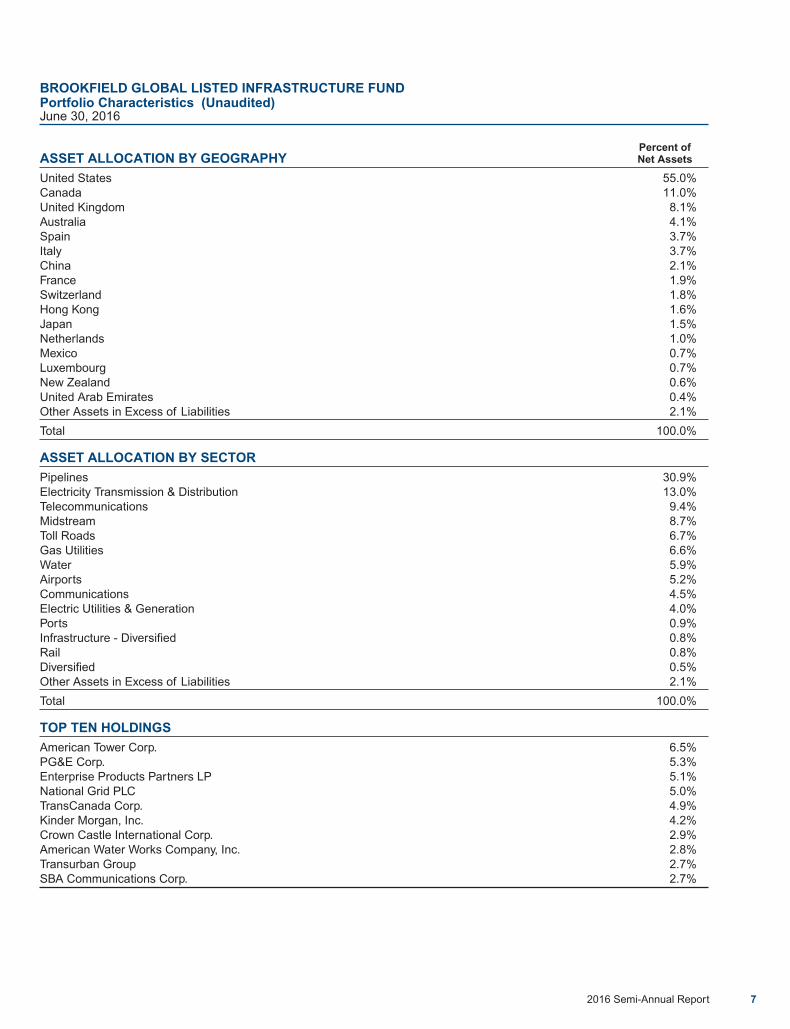
ASSET ALLOCATION BY GEOGRAPHYPercent ofNet Assets
United States 55.0%Canada 11.0%United Kingdom 8.1%Australia 4.1%Spain 3.7%Italy 3.7%China 2.1%France 1.9%Switzerland 1.8%Hong Kong 1.6%Japan 1.5%Netherlands 1.0%Mexico 0.7%Luxembourg 0.7%New Zealand 0.6%United Arab Emirates 0.4%Other Assets in Excess of Liabilities 2.1%
American Tower Corp. 6.5%PG&E Corp. 5.3%Enterprise Products Partners LP 5.1%National Grid PLC 5.0%TransCanada Corp. 4.9%Kinder Morgan, Inc. 4.2%Crown Castle International Corp. 2.9%American Water Works Company, Inc. 2.8%Transurban Group 2.7%SBA Communications Corp. 2.7%
BROOKFIELD GLOBAL LISTED INFRASTRUCTURE FUNDPortfolio Characteristics (Unaudited)June 30, 2016
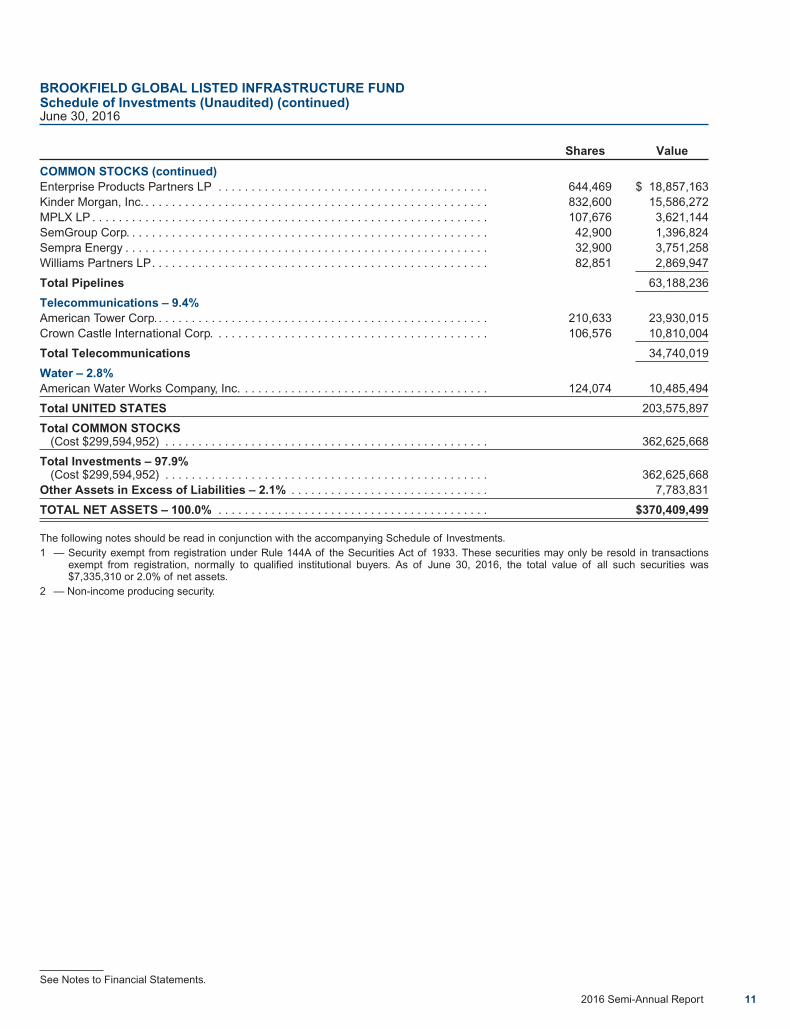
The following notes should be read in conjunction with the accompanying Schedule of Investments.1 — Security exempt from registration under Rule 144A of the Securities Act of 1933. These securities may only be resold in transactions
exempt from registration, normally to qualified institutional buyers. As of June 30, 2016, the total value of all such securities was$7,335,310 or 2.0% of net assets.
2 — Non-income producing security.
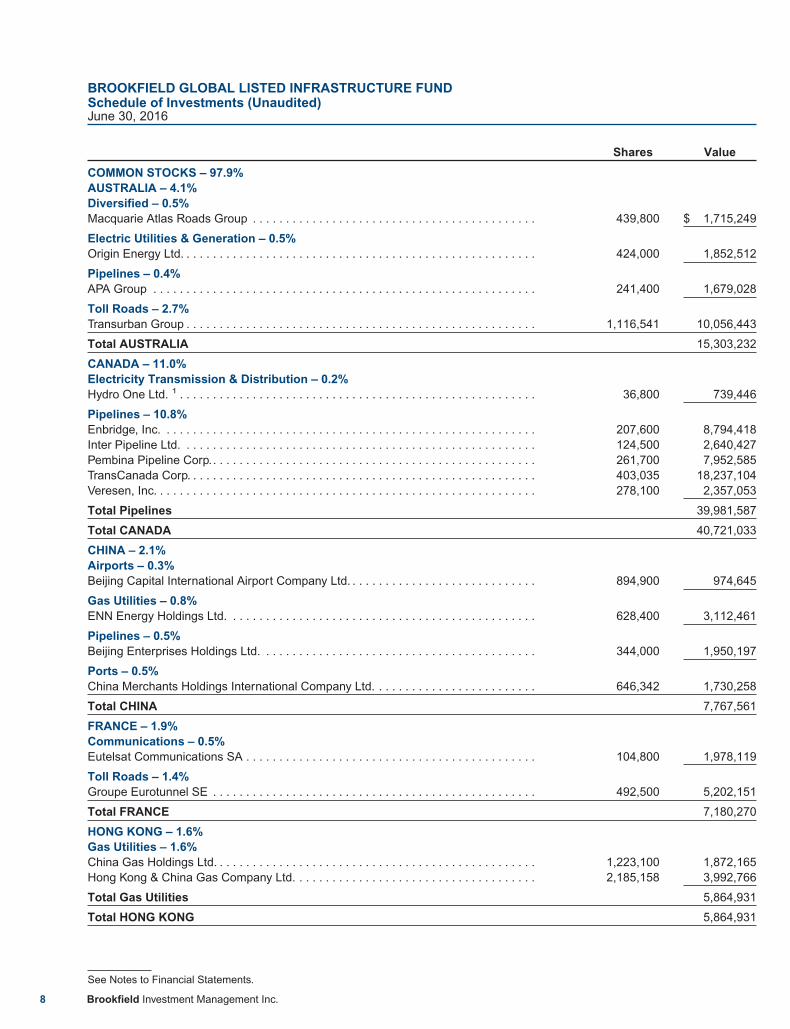
BROOKFIELD GLOBAL LISTED INFRASTRUCTURE FUNDSchedule of Investments (Unaudited) (continued)June 30, 2016
See Notes to Financial Statements.
2016 Semi-Annual Report 11
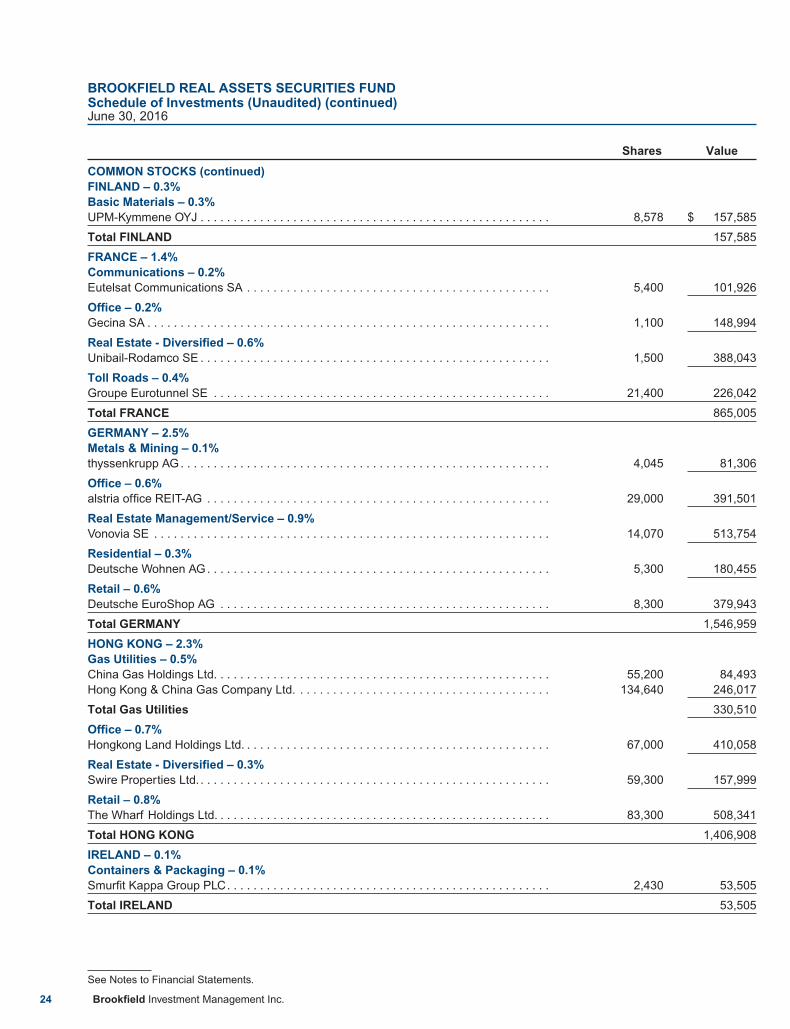
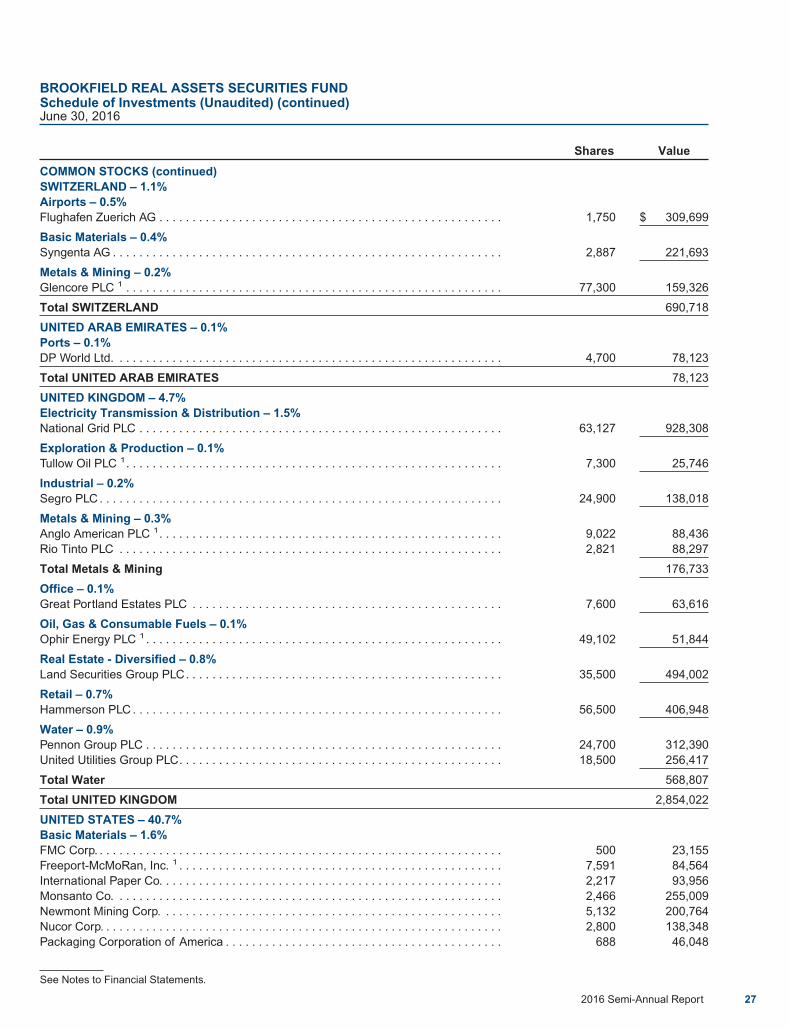
ASSET ALLOCATION BY GEOGRAPHYPercent ofNet Assets
United States 52.9%Germany 9.1%Japan 8.5%Australia 7.0%Hong Kong 6.8%United Kingdom 6.6%France 3.3%Singapore 1.6%China 1.0%Austria 0.9%Netherlands 0.8%New Zealand 0.4%Other Assets in Excess of Liabilities 1.1%
Simon Property Group, Inc. 6.7%Vornado Realty Trust 3.6%Vonovia SE 3.2%The Wharf Holdings Ltd. 3.1%Land Securities Group PLC 3.1%Hongkong Land Holdings Ltd. 2.8%Mitsubishi Estate Company Ltd. 2.7%SL Green Realty Corp. 2.5%Prologis, Inc. 2.5%Welltower, Inc. 2.5%
BROOKFIELD GLOBAL LISTED REAL ESTATE FUNDPortfolio Characteristics (Unaudited)June 30, 2016
The following notes should be read in conjunction with the accompanying Schedule of Investments.1 — Non-income producing security.
BROOKFIELD GLOBAL LISTED REAL ESTATE FUNDSchedule of Investments (Unaudited) (continued)June 30, 2016
See Notes to Financial Statements.
16 Brookfield Investment Management Inc.
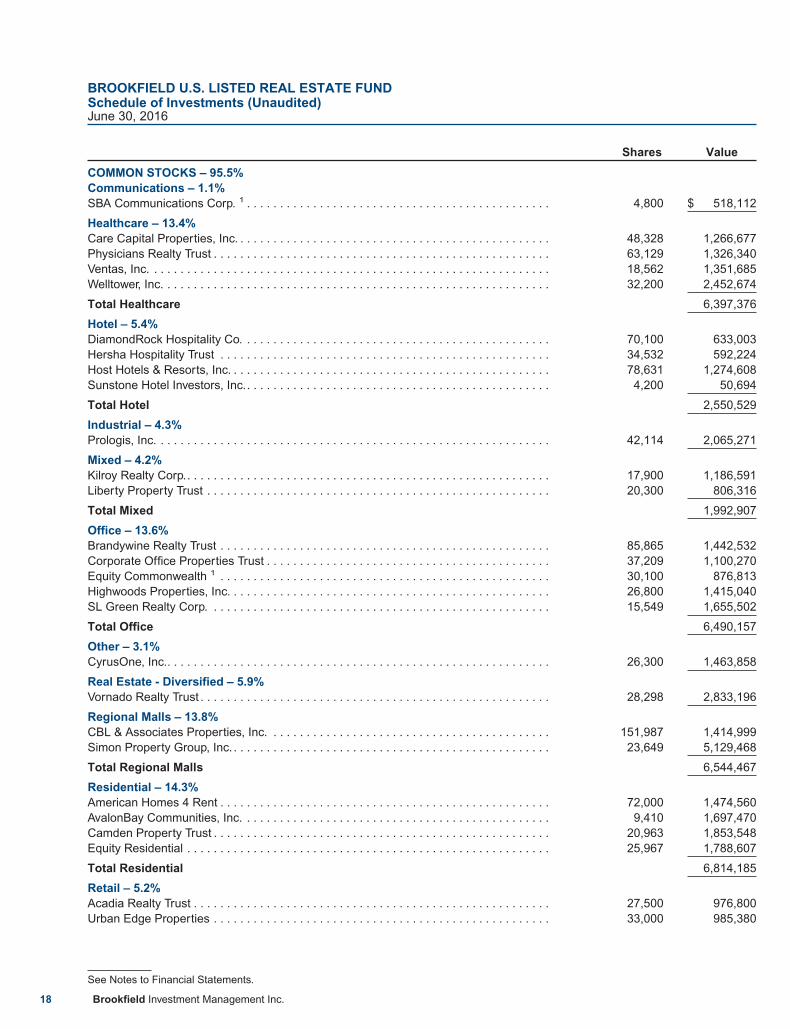
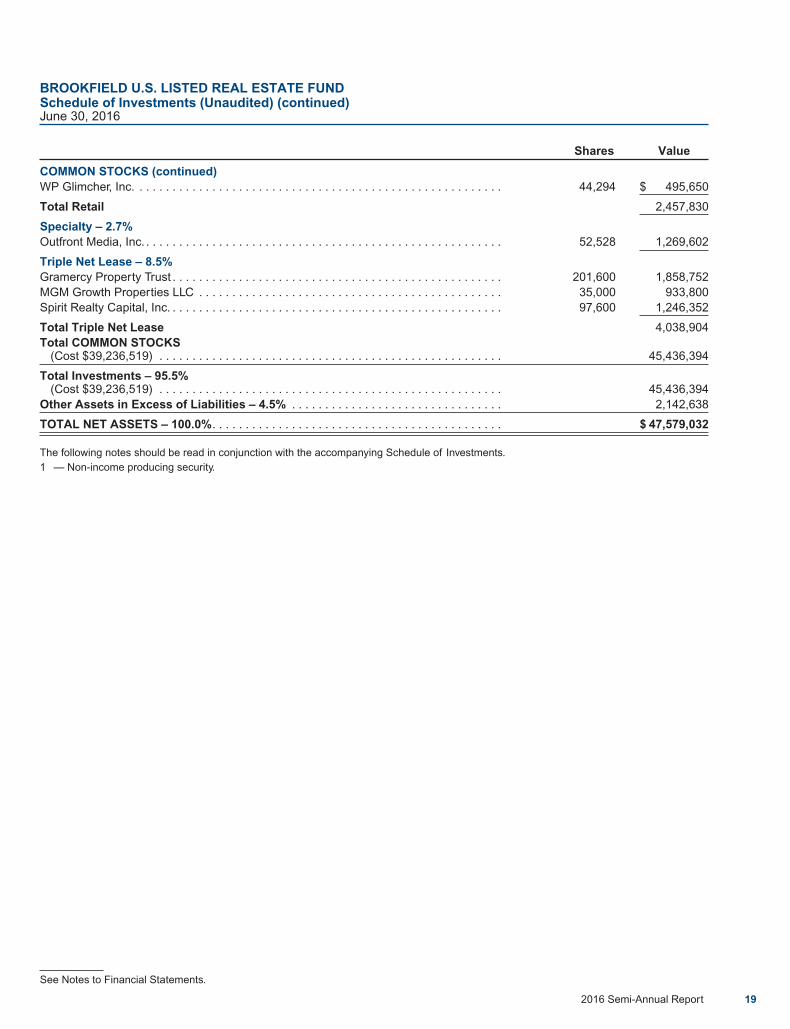
ASSET ALLOCATION BY SECTORPercent ofNet Assets
Residential 14.3%Regional Malls 13.8%Office 13.6%Healthcare 13.4%Triple Net Lease 8.5%Real Estate - Diversified 5.9%Hotel 5.4%Retail 5.2%Industrial 4.3%Mixed 4.2%Other 3.1%Specialty 2.7%Communications 1.1%Other Assets in Excess of Liabilities 4.5%
Total 100.0%
TOP TEN HOLDINGS
Simon Property Group, Inc. 10.8%Vornado Realty Trust 5.9%Welltower, Inc. 5.2%Prologis, Inc. 4.3%Gramercy Property Trust 3.9%Camden Property Trust 3.9%Equity Residential 3.7%AvalonBay Communities, Inc. 3.6%SL Green Realty Corp. 3.5%American Homes 4 Rent 3.1%
BROOKFIELD U.S. LISTED REAL ESTATE FUNDPortfolio Characteristics (Unaudited)June 30, 2016
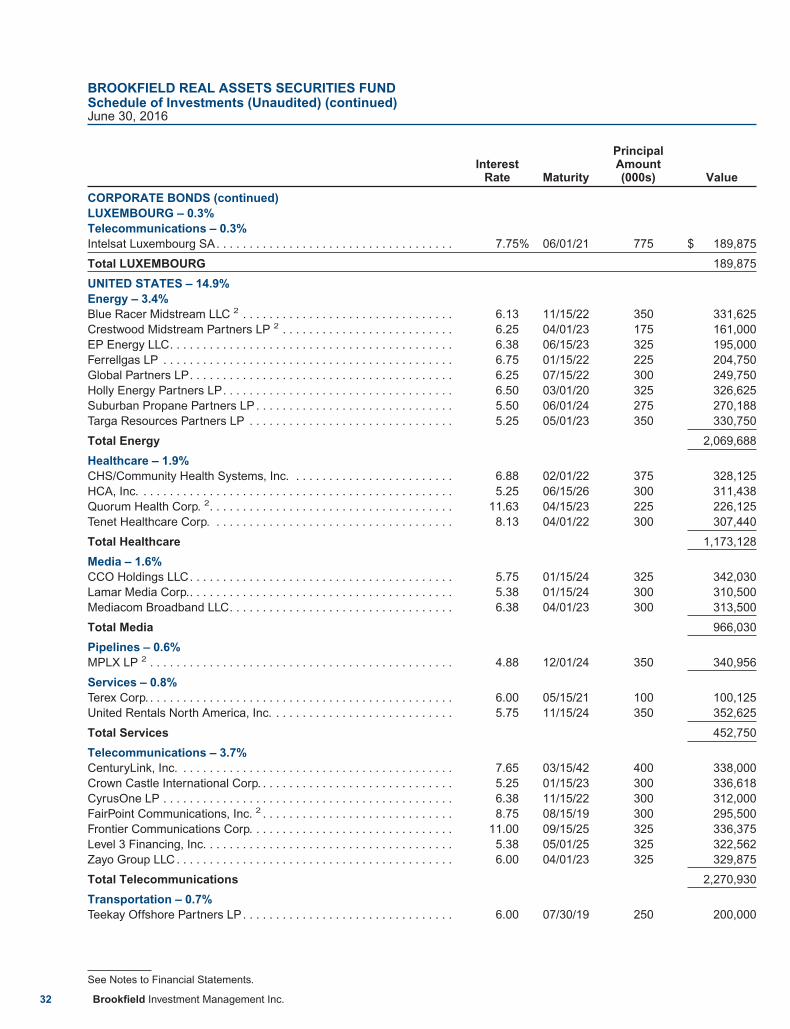
The following notes should be read in conjunction with the accompanying Schedule of Investments.1 — Non-income producing security.2 — Security exempt from registration under Rule 144A of the Securities Act of 1933. These securities may only be resold in transactions
exempt from registration, normally to qualified institutional buyers. As of June 30, 2016, the total value of all such securities was$1,951,198 or 3.2% of net assets.
3 — Private Placement.4 — Variable rate security – Interest rate shown is the rate in effect as of June 30, 2016.
BROOKFIELD REAL ASSETS SECURITIES FUNDSchedule of Investments (Unaudited) (continued)June 30, 2016
†Total investment return is computed based upon the net asset value of the Fund’s shares and excludes the effects of sales charges orcontingent deferred sales charges, if applicable. Distributions are assumed to be reinvested at the net asset value of the Class on theex-date of the distribution.
(1) Class A was incepted on December 29, 2011, Class C was incepted on May 1, 2012 and Classes Y and I were incepted on December 1,2011.
(2) Per share amounts presented are based on average shares outstanding throughout the period indicated.(3) Rounds to less than $0.005.(4) Not annualized.(5) Annualized.(6) For the Six Months Ended June 30, 2016. (Unaudited)
BROOKFIELD GLOBAL LISTED INFRASTRUCTURE FUNDFinancial Highlights
See Notes to Financial Statements.
2016 Semi-Annual Report 39
Per Share Operating Performance: Ratios to Average Net Assets/Supplementary Data:
Net assetvalue,
beginningof period
Netinvestmentincome(2)
Netrealized andunrealized
gain (loss) oninvestment
transactions
Netincrease
(decrease)in net
asset valueresulting from
operations
Distributionsfrom net
investmentincome
Distributionsfrom netrealizedgains
Returnof capital
distributions
Totaldistributions
paidRedemption
fees
Net assetvalue, endof period
TotalInvestment
Return†
Net assets,end of period
(000s)
Grossoperatingexpenses
Net expenses,including feewaivers and
reimbursement
Netinvestment
income
Netinvestment
income (loss),excluding theeffect of feewaivers and
†Total investment return is computed based upon the net asset value of the Fund’s shares and excludes the effects of sales charges orcontingent deferred sales charges, if applicable. Distributions are assumed to be reinvested at the net asset value of the Class on theex-date of the distribution.
(1)Classes A and C were incepted on May 1, 2012 and Classes Y and I were incepted on December 1, 2011.
(2)Per share amounts presented are based on average shares outstanding throughout the period indicated.
(3)Rounds to less than $0.005.
(4)Not annualized.
(5)Annualized.
(6)For the Six Months Ended June 30, 2016. (Unaudited)
BROOKFIELD GLOBAL LISTED REAL ESTATE FUNDFinancial Highlights
See Notes to Financial Statements.
40 Brookfield Investment Management Inc.
Per Share Operating Performance: Ratios to Average Net Assets/Supplementary Data:
Net assetvalue,
beginningof period
Netinvestmentincome(3)
Netrealized andunrealized
gain (loss) oninvestment
transactions
Netincrease
(decrease)in net
asset valueresulting from
operations
Distributionsfrom net
investmentincome
Distributionsfrom netrealizedgains
Totaldistributions
paidRedemption
fees
Net assetvalue, endof period
TotalInvestment
Return†
Net assets,end of period
(000s)
Grossoperatingexpenses
Net expenses,including feewaivers and
reimbursement
Netinvestment
income
Netinvestment
income (loss),excluding theeffect of feewaivers and
†Total investment return is computed based upon the net asset value of the Fund’s shares and excludes the effects of sales charges orcontingent deferred sales charges, if applicable. Distributions are assumed to be reinvested at the net asset value of the Class on theex-date of the distribution.
(1)Classes A, C, Y and I were incepted on December 11, 2013.
(2)Organization costs were not annualized in the calculation of the income and expense ratios. If these expenses were annualized, the grossand net expense ratios would have been 4.16% and 1.20% for Class A, 4.89% and 1.95% for Class C, 3.80% and 0.95% for Class Y and3.93% and 0.95% for Class I, respectively.
(3)Per share amounts presented are based on average shares outstanding throughout the period indicated.
(4)Not annualized.
(5)Annualized.
(6)Rounds to less than $0.005.
(7)For the Six Months Ended June 30, 2016. (Unaudited)
BROOKFIELD U.S. LISTED REAL ESTATE FUNDFinancial Highlights
See Notes to Financial Statements.
2016 Semi-Annual Report 41
Per Share Operating Performance: Ratios to Average Net Assets/Supplementary Data:
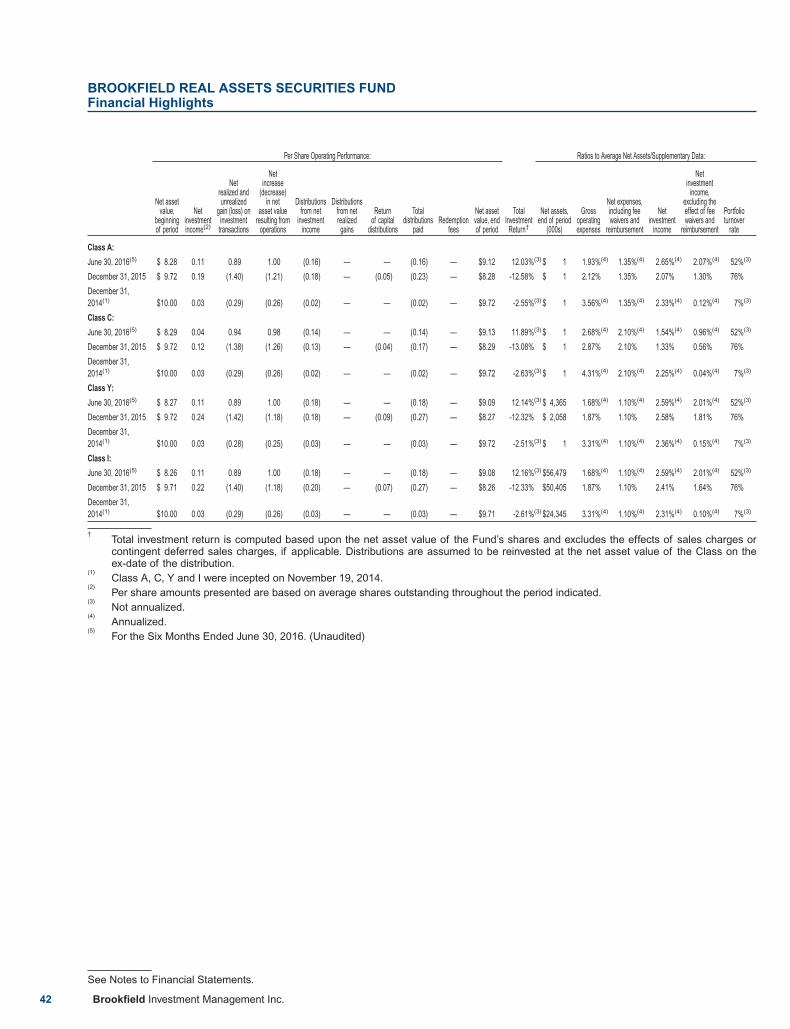
†Total investment return is computed based upon the net asset value of the Fund’s shares and excludes the effects of sales charges orcontingent deferred sales charges, if applicable. Distributions are assumed to be reinvested at the net asset value of the Class on theex-date of the distribution.
(1)Class A, C, Y and I were incepted on November 19, 2014.
(2)Per share amounts presented are based on average shares outstanding throughout the period indicated.
(3)Not annualized.
(4)Annualized.
(5)For the Six Months Ended June 30, 2016. (Unaudited)
BROOKFIELD REAL ASSETS SECURITIES FUNDFinancial Highlights
See Notes to Financial Statements.
42 Brookfield Investment Management Inc.
1. Organization
Brookfield Investment Funds (the “Trust”) was organized as a statutory trust under the laws of the State ofDelaware on May 12, 2011. The Trust is registered under the Investment Company Act of 1940, as amended (the“1940 Act”), as an open-end management investment company. The Trust currently consists of five seriesportfolios: the Brookfield Global Listed Infrastructure Fund (the “Infrastructure Fund”), the Brookfield Global ListedReal Estate Fund (the “Global Real Estate Fund”), the Brookfield U.S. Listed Real Estate Fund (the “U.S. RealEstate Fund”), the Brookfield Real Assets Securities Fund (the “Real Assets Securities Fund”) and the BrookfieldReal Assets Debt Fund (each, a “Fund,” and collectively, the “Funds”). The Infrastructure Fund, Global Real EstateFund and Real Assets Securities Fund are each a diversified open-end management investment company and theU.S. Real Estate Fund is a non-diversified open-end management investment company. The Brookfield RealAssets Debt Fund is not currently available for purchase.
Each Fund currently has four classes of shares: Class A, Class C, Class Y and Class I shares. Each classrepresents an interest in the same portfolio of assets and has identical voting, dividend, liquidation and other rightsexcept that: (i) Class A shares have a maximum front end sales charge of 4.75% and Class C shares have amaximum deferred sales charge of 1.00%; (ii) Class A shares have a 12b-1 fee of 0.25% and Class C shares havea 12b-1 fee of 1.00%; and (iii) each class has exclusive voting rights with respect to matters relating to its owndistribution arrangements. The assets belonging to a particular Fund belong to that Fund for all purposes, and tono other Fund, subject only to the rights of creditors of that Fund.
Brookfield Investment Management Inc. (the “Adviser”), a wholly-owned subsidiary of Brookfield AssetManagement Inc., is registered as an investment adviser under the Investment Advisers Act of 1940, as amended(the “Advisers Act”), and serves as investment adviser to the Funds.
The investment objective of each Fund is to seek total return through growth of capital and current income. EachFund’s investment objective is not fundamental and may be changed by the Trust’s Board of Trustees (the “Board”)without shareholder approval, upon not less than 60 days prior written notice to shareholders. There can be noassurance that each Fund will achieve its investment objective.
2. Significant Accounting Policies
The preparation of financial statements in conformity with accounting principles generally accepted in theUnited States of America (“GAAP”) requires management to make estimates and assumptions that affect thereported amounts of assets and liabilities and disclosure of contingent assets and liabilities at the date of thefinancial statements and the reported amounts of increases and decreases in net assets from operations duringthe reporting period. Actual results could differ from those estimates. Each Fund is an investment company withinthe scope of Financial Accounting Standards Board (“FASB”) Accounting Standard Update (“ASU”) 2013-08,follows accounting and reporting guidance under FASB Accounting Standards Codification Topics (“ASC”) 946,“Financial Services-Investment Companies”.
Valuation of Investments: The Board has adopted procedures for the valuation of each Fund’s securities. TheAdviser oversees the day to day responsibilities for valuation determinations under these procedures. The Boardregularly reviews the application of these procedures to the securities in each Fund’s portfolio. The Adviser’sValuation Committee is comprised of senior members of the Adviser’s management team. There can be noassurance that each Fund could purchase or sell a portfolio security at the price used to calculate each Fund’sNAV.
Debt securities, including U.S. government securities, listed corporate bonds, other fixed income and asset-backedsecurities, and unlisted securities and private placement securities, are generally valued at the bid prices furnishedby an independent pricing service or, if not valued by an independent pricing service, using bid prices obtainedfrom active and reliable market makers in any such security or a broker-dealer. The broker-dealers or pricingservices use multiple valuation techniques to determine fair value. In instances where sufficient market activity
BROOKFIELD INVESTMENT FUNDSNotes to Financial Statements (Unaudited)June 30, 2016
2016 Semi-Annual Report 43
exists, the broker-dealers or pricing services may utilize a market-based approach through which quotes frommarket makers are used to determine fair value. In instances where sufficient market activity may not exist or islimited, the broker-dealers or pricing services also utilize proprietary valuation models which may consider markettransactions in comparable securities and the various relationships between securities in determining fair valueand/or market characteristics such as benchmark yield curves, option-adjusted spreads, credit spreads, estimateddefault rates, coupon-rates, anticipated timing of principal repayments, underlying collateral, and other uniquesecurity features in order to estimate the relevant cash flows, which are then discounted to calculate the fairvalues. Short-term debt securities with remaining maturities of sixty days or less are valued at cost adjusted by theamortization of discount or premium to maturity, unless such valuation, in the judgment of the Adviser’s ValuationCommittee, does not represent fair value.
Investments in equity securities listed or traded on any securities exchange or traded in the over-the-countermarket are valued at the last trade price as of the close of business on the valuation date. Investments inopen-end registered investment companies, if any, are valued at the net asset value (“NAV”) as reported by thoseinvestment companies.
Securities for which market prices are not readily available or which cannot be valued using the sources describedabove will be valued using an internal proprietary fair value methodology. For any security warranting such fairvalue measurement, a memorandum, including the specific methodology and supporting information, will beprovided to the Valuation Committee by a portfolio manager or analyst looking to fair value a particular security. Aportfolio manager or analyst shall use their best efforts to maximize the use of relevant observable inputs andminimize the use of unobservable inputs within their valuation technique. The Valuation Committee shall reviewthe memorandum and supporting information provided by a portfolio manager or analyst and consider all relevantfactors as it deems appropriate before approving the fair value recommendation.
Each Fund may use the fair value of a security to calculate its NAV when, for example, (1) a portfolio security isnot traded in a public market or the principal market in which the security trades is closed, (2) trading in a portfoliosecurity is suspended and not resumed prior to the normal market close, (3) a portfolio security is not traded insignificant volume for a substantial period, or (4) the Adviser determines that the quotation or price for a portfoliosecurity provided by a broker-dealer or an independent pricing service is inaccurate.
The fair value of securities may be difficult to determine and thus judgment plays a greater role in the valuationprocess. The fair valuation methodology may include or consider the following guidelines, as appropriate: (1)evaluation of all relevant factors, including but not limited to, pricing history, current market level, supply anddemand of the respective security; (2) comparison to the values and current pricing of securities that havecomparable characteristics; (3) knowledge of historical market information with respect to the security; (4) otherfactors relevant to the security which would include, but not be limited to, duration, yield, fundamental analyticaldata, the Treasury yield curve, and credit quality.
The values assigned to fair valued investments are based on available information and do not necessarilyrepresent amounts that might ultimately be realized, since such amounts depend on future developments inherentin investments. Changes in the fair valuation of portfolio securities may be less frequent and of greater magnitudethan changes in the price of portfolio securities valued at their last sale price, by an independent pricing service, orbased on market quotations. Imprecision in estimating fair value can also impact the amount of unrealizedappreciation or depreciation recorded for a particular portfolio security and differences in the assumptions usedcould result in a different determination of fair value, and those differences could be material.
The Trust’s Board has adopted procedures for the valuation of each Fund’s securities. The Adviser oversees theday to day responsibilities for valuation determinations under these procedures. The Board regularly reviews theapplication of these procedures to the securities in a Fund’s portfolio. Pursuant to the procedures, securities in aFund are valued using unadjusted quoted market prices, when available, as supplied primarily by third partypricing services or dealers. However, if (i) a market value or price is not readily available, (ii) the availablequotations are not believed to be reflective of market value by the Adviser, or (iii) a significant event has occurred
BROOKFIELD INVESTMENT FUNDSNotes to Financial Statements (Unaudited) (continued)June 30, 2016
44 Brookfield Investment Management Inc.
that would materially affect the value of the security, the security is fair valued, as determined in good faith, by theAdviser’s Valuation Committee. The Adviser’s Valuation Committee is comprised of senior members of theAdviser’s management team. There can be no assurance that a Fund could purchase or sell a portfolio security atthe price used to calculate the Fund’s NAV. As of June 30, 2016, there were no securities held in the Funds thatwere fair valued by the Adviser’s Valuation Committee.
The Funds have established methods of fair value measurements in accordance with GAAP. Fair value denotesthe price that a Fund would receive upon selling an investment in a timely transaction to an independent buyer inthe principal or most advantageous market of the investment. A three-tier hierarchy has been established tomaximize the use of observable market data and minimize the use of unobservable inputs and to establishclassification of fair value measurements for disclosure purposes. Inputs refer broadly to the assumptions thatmarket participants would use in pricing the asset or liability, including assumptions about risk, for example, therisk inherent in a particular valuation technique used to measure fair value including such a pricing model and/orthe risk inherent in the inputs to the valuation technique. Inputs may be observable or unobservable. Observableinputs are inputs that reflect the assumptions market participants would use in pricing the asset or liabilitydeveloped based on market data obtained from sources independent of the reporting entity. Unobservable inputsare inputs that reflect the reporting entity’s own assumptions about the assumptions market participants would usein pricing the asset or liability developed based on the best information available in the circumstances. Thethree-tier hierarchy of inputs is summarized in the three broad levels listed below.
Level 1 - quoted prices in active markets for identical assets or liabilities
Level 2 - quoted prices in markets that are not active or other significant observable inputs (including, but notlimited to: quoted prices for similar assets or liabilities, quoted prices based on recently executedtransactions, interest rates, credit risk, etc.)
Level 3 - significant unobservable inputs (including each Fund’s own assumptions in determining the fair valueof assets or liabilities)
The Adviser’s valuation policy, as previously stated, establishes parameters for the sources and types of valuationanalysis, as well as, the methodologies and inputs the Adviser uses in determining fair value, including the use ofthe Adviser’s Valuation Committee. If the Adviser’s Valuation Committee determines that additional techniques,sources or inputs are appropriate or necessary in a given situation, such additional work will be undertaken.
Significant increases or decreases in any of the unobservable inputs in isolation may result in a lower or higher fairvalue measurement.
To assess the continuing appropriateness of security valuations, the Adviser (or its third party service providers,who are subject to oversight by the Adviser), regularly compares one of its prior day prices, prices on comparablesecurities and sale prices to the current day prices and challenges those prices that exceed certain tolerancelevels with the third party pricing service or broker source. For those securities valued by fair valuations, theAdviser’s Valuation Committee reviews and affirms the reasonableness of the valuations based on suchmethodologies and fair valuation determinations on a regular basis after considering all relevant information that isreasonably available.
The inputs or methodology used for valuing investments are not necessarily an indication of the risk associatedwith investing in those securities.
BROOKFIELD INVESTMENT FUNDSNotes to Financial Statements (Unaudited) (continued)June 30, 2016
2016 Semi-Annual Report 45
Infrastructure Fund
The following table summarizes the Infrastructure Fund’s investments categorized in the disclosure hierarchy as ofJune 30, 2016:
For further information regarding security characteristics, see the Schedule of Investments.
Level 2 securities are fair valued using a factor as a result of market movements following the close of localtrading. During the six months ended June 30, 2016, there was a transfer from Level 2 to Level 1 of $3,199,746,which represents a security that was previously fair valued by the Adviser’s Valuation Committee and is currentlypriced using the market close price. There were no additional transfers between Levels. The basis for recognizingand valuing transfers is as of the end of the period in which transfers occur. During the six months ended June 30,2016, the Infrastructure Fund did not invest in any level 3 securities.
BROOKFIELD INVESTMENT FUNDSNotes to Financial Statements (Unaudited) (continued)June 30, 2016
46 Brookfield Investment Management Inc.
Global Real Estate Fund
The following table summarizes the Global Real Estate Fund’s investments categorized in the disclosure hierarchyas of June 30, 2016:
For further information regarding security characteristics, see the Schedule of Investments.
Level 2 securities are fair valued using a factor as a result of market movements following the close of localtrading. During the six months ended June 30, 2016, there were no transfers between Levels. The basis forrecognizing and valuing transfers is as of the end of the period in which transfers occur. During the six monthsended June 30, 2016, the Global Real Estate Fund did not invest in any Level 3 securities.
U.S. Real Estate Fund
The following table summarizes the U.S. Real Estate Fund’s investments categorized in the disclosure hierarchyas of June 30, 2016:
For further information regarding security characteristics, see the Schedule of Investments.
During the six months ended June 30, 2016, there were no transfers between Levels. The basis for recognizingand valuing transfers is as of the end of the period in which transfers occur. During the six months ended June 30,2016, the U.S. Real Estate Fund did not invest in any Level 2 or Level 3 securities.
BROOKFIELD INVESTMENT FUNDSNotes to Financial Statements (Unaudited) (continued)June 30, 2016
2016 Semi-Annual Report 47
Real Assets Securities Fund
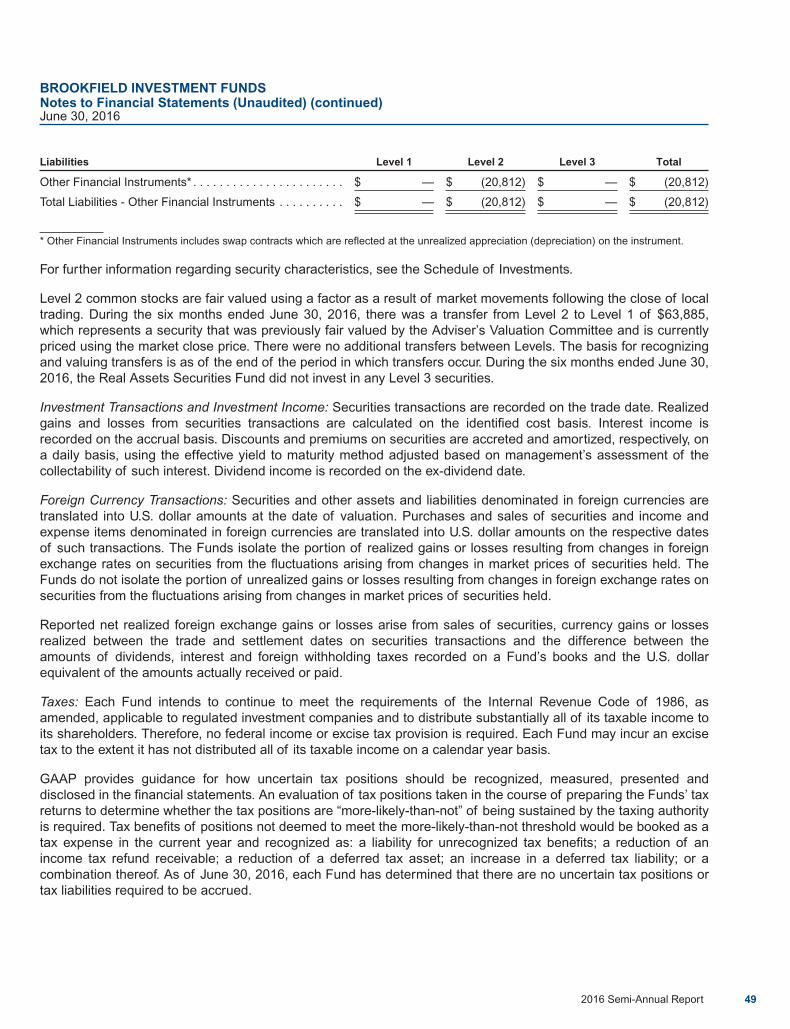
The following table summarizes the Real Assets Securities Fund’s investments categorized in the disclosurehierarchy as of June 30, 2016:
* Other Financial Instruments includes swap contracts which are reflected at the unrealized appreciation (depreciation) on the instrument.
For further information regarding security characteristics, see the Schedule of Investments.
Level 2 common stocks are fair valued using a factor as a result of market movements following the close of localtrading. During the six months ended June 30, 2016, there was a transfer from Level 2 to Level 1 of $63,885,which represents a security that was previously fair valued by the Adviser’s Valuation Committee and is currentlypriced using the market close price. There were no additional transfers between Levels. The basis for recognizingand valuing transfers is as of the end of the period in which transfers occur. During the six months ended June 30,2016, the Real Assets Securities Fund did not invest in any Level 3 securities.
Investment Transactions and Investment Income: Securities transactions are recorded on the trade date. Realizedgains and losses from securities transactions are calculated on the identified cost basis. Interest income isrecorded on the accrual basis. Discounts and premiums on securities are accreted and amortized, respectively, ona daily basis, using the effective yield to maturity method adjusted based on management’s assessment of thecollectability of such interest. Dividend income is recorded on the ex-dividend date.
Foreign Currency Transactions: Securities and other assets and liabilities denominated in foreign currencies aretranslated into U.S. dollar amounts at the date of valuation. Purchases and sales of securities and income andexpense items denominated in foreign currencies are translated into U.S. dollar amounts on the respective datesof such transactions. The Funds isolate the portion of realized gains or losses resulting from changes in foreignexchange rates on securities from the fluctuations arising from changes in market prices of securities held. TheFunds do not isolate the portion of unrealized gains or losses resulting from changes in foreign exchange rates onsecurities from the fluctuations arising from changes in market prices of securities held.
Reported net realized foreign exchange gains or losses arise from sales of securities, currency gains or lossesrealized between the trade and settlement dates on securities transactions and the difference between theamounts of dividends, interest and foreign withholding taxes recorded on a Fund’s books and the U.S. dollarequivalent of the amounts actually received or paid.
Taxes: Each Fund intends to continue to meet the requirements of the Internal Revenue Code of 1986, asamended, applicable to regulated investment companies and to distribute substantially all of its taxable income toits shareholders. Therefore, no federal income or excise tax provision is required. Each Fund may incur an excisetax to the extent it has not distributed all of its taxable income on a calendar year basis.
GAAP provides guidance for how uncertain tax positions should be recognized, measured, presented anddisclosed in the financial statements. An evaluation of tax positions taken in the course of preparing the Funds’ taxreturns to determine whether the tax positions are “more-likely-than-not” of being sustained by the taxing authorityis required. Tax benefits of positions not deemed to meet the more-likely-than-not threshold would be booked as atax expense in the current year and recognized as: a liability for unrecognized tax benefits; a reduction of anincome tax refund receivable; a reduction of a deferred tax asset; an increase in a deferred tax liability; or acombination thereof. As of June 30, 2016, each Fund has determined that there are no uncertain tax positions ortax liabilities required to be accrued.
BROOKFIELD INVESTMENT FUNDSNotes to Financial Statements (Unaudited) (continued)June 30, 2016
2016 Semi-Annual Report 49
The Funds have reviewed the taxable years open for examination (i.e. not barred by the applicable statute oflimitations) by taxing authorities of all major jurisdictions, including the Internal Revenue Service. As of June 30,2016, open taxable periods consisted of the taxable years ended December 31, 2013 through December 31, 2015for the Infrastructure Fund and Global Real Estate Fund, the period December 11, 2013 (commencement ofoperations) through December 31, 2015 for the U.S. Real Estate Fund and the period November 19, 2014(commencement of operations) through December 31, 2015 for the Real Assets Securities Fund. No examinationof the Funds’ tax returns is currently in progress.
Expenses: Expenses directly attributable to a Fund are charged directly to that Fund, while expenses which areattributable to more than one Fund are allocated among the respective Funds based upon relative average netassets, evenly or a combination of both. Income and expenses of a Fund are allocated on a pro rata basis to eachclass of shares, except for distribution fees, which are unique to each class of shares.
Distributions: Each Fund declares and pays dividends quarterly from net investment income. Distributions ofrealized capital gains in excess of capital loss carryforwards are distributed at least annually. Dividends anddistributions are recorded on the ex-dividend date. All common shares have equal dividend and other distributionrights. A notice disclosing the source(s) of a distribution will be provided after a payment is made from any sourceother than net investment income.
Dividends from net investment income and distributions from realized gains from investment transactions havebeen determined in accordance with federal income tax regulations and may differ from net investment incomeand realized gains recorded by each Fund for financial reporting purposes. These differences, which could betemporary or permanent in nature, may result in reclassification of distributions; however, net investment income,net realized gains and losses and net assets are not affected.
3. Investment Advisory Agreements and Related Party Transactions
The Adviser currently serves as the investment adviser to each Fund pursuant to separate investment advisoryagreements (the “Advisory Agreements”) under which the Adviser is responsible for the management of eachFund’s portfolio and provides the necessary personnel, facilities, equipment and certain other services necessaryto the operations of each Fund.
Pursuant to operating expenses limitation agreements (the “Expense Limitation Agreements”), the Adviser hascontractually agreed to waive all or a portion of its investment advisory or administration fees, as presented below,and/or to reimburse certain expenses of each Fund to the extent necessary to maintain each Fund’s total annualoperating expenses (excluding any front-end or contingent deferred charges, brokerage commissions and othertransactional expenses, acquired fund fees and expenses, interest, taxes, and extraordinary expenses, such aslitigation; and other expenses not incurred in the ordinary course of a Fund’s business). The Expense LimitationAgreements will continue until at least May 1, 2017 and may not be terminated by the Funds or the Adviser beforesuch time. Thereafter, the Expense Limitation Agreements may only be terminated or amended to increase theexpense cap as of May 1st of each calendar year, provided that in the case of a termination by the Adviser, theAdviser will provide the Board with written notice of its intention to terminate the arrangement prior to theexpiration of its then current term. Pursuant to the Expense Limitation Agreements, the Adviser retains its right toreceive reimbursement of any payments made by it, or to recoup any fees waived by it during the prior three years,provided that after giving effect to such repayment or recoupment, such adjusted total annual operating expenses(expressed as a percentage of average net assets) for each Fund would not exceed the percentage limitationslisted below.
BROOKFIELD INVESTMENT FUNDSNotes to Financial Statements (Unaudited) (continued)June 30, 2016
50 Brookfield Investment Management Inc.
The Advisory Agreements provide that each Fund shall pay the Adviser a monthly fee at the annual rates statedbelow of each Fund’s average daily net assets:
1 Annual Expense Cap was effective December 11, 2013 (commencement of operations).2 Annual Expense Cap was effective November 19, 2014 (commencement of operations).
The amount of investment advisory fees waived and/or expenses reimbursed available to be recouped are listed inthe table below:
1 From the commencement of operations on November 19, 2014.
For the six months ended June 30, 2016, the Adviser did not recoup any expenses.
Each Fund has entered into separate Administration Agreements with the Adviser and the Adviser has enteredinto a sub-administration agreement with U.S. Bancorp Fund Services, LLC (the “Sub-Administrator”). The Adviserand the Sub-Administrator perform administrative services necessary for the operation of the Funds, includingmaintaining certain books and records of the Funds and preparing reports and other documents required byfederal, state and other applicable laws and regulations, and providing the Funds with administrative officefacilities. For its services under the Administration Agreements, the Adviser receives from each Fund, respectively,
BROOKFIELD INVESTMENT FUNDSNotes to Financial Statements (Unaudited) (continued)June 30, 2016
2016 Semi-Annual Report 51
an annual fee equal to 0.15% of its average daily net assets, payable monthly in arrears. The Adviser isresponsible for any fees due to the Sub-Administrator.
Certain officers and/or trustees of the Trust are officers and/or employees of the Adviser.
4. Purchases and Sales of Investments
Purchases and sales of investments, excluding U.S. Government securities, for the six months ended June 30,2016 were as follows:
During the six months ended June 30, 2016, there were no transactions in U.S. Government securities.
5. Swaps Contracts
Each Fund may enter into total rate of return, credit default or other types of swaps and related derivatives for thepurpose of hedging and risk management. These transactions generally provide for the transfer from onecounterparty to another of certain risks inherent in the ownership of a financial asset such as a debt instrument orcommon stock. Such risks include, among other things, the risk of default and insolvency of the obligor of suchasset, the risk that the credit of the obligor or the underlying collateral will decline or the risk that the commonstock of the underlying issuers will decline in value. The transfer of risk pursuant to a derivative of this type maybe complete or partial, and may be for the life of the related asset or for a shorter period. These derivatives maybe used as a risk management tool for a pool of financial assets, providing a Fund with the opportunity to gain orreduce exposure to one or more reference securities or other financial assets (each, a “Reference Asset”) withoutactually owning or selling such assets in order, for example, to increase or reduce a concentration risk or todiversify a portfolio. Conversely, these derivatives may be used by the Fund to reduce exposure to an owned assetwithout selling it.
Because a Fund would not own the Reference Assets, the Fund may not have any voting rights with respect to theReference Assets, and in such cases all decisions related to the obligors or issuers of the Reference Assets,including whether to exercise certain remedies, will be controlled by the swap counterparties.
Total rate of return swaps and similar derivatives are subject to many risks, including the possibility that the marketwill move in a manner or direction that would have resulted in gain for a Fund had the swap or other derivative notbeen utilized (in which case it would have been better had the Fund not engaged in the interest rate hedgingtransactions), the risk of imperfect correlation between the risk sought to be hedged and the derivativetransactions utilized, the possible inability of the counterparty to fulfill its obligations under the swap and potentialilliquidity of the hedging instrument utilized, which may make it difficult for the Fund to close out or unwind one ormore hedging transactions.
Total rate of return swaps and related derivatives present certain legal, tax and market uncertainties that presentrisks in entering into such arrangements. There is currently little or no case law or litigation characterizing total rateof return swaps or related derivatives, interpreting their positions, or characterizing their tax treatment. In addition,additional regulations and laws may apply to these types of derivatives that have not previously been applied.There can be no assurance that future decisions construing similar provisions to those in any swap agreement orother related documents or additional regulations and laws will not have an adverse effect on a Fund that utilizesthese instruments.
BROOKFIELD INVESTMENT FUNDSNotes to Financial Statements (Unaudited) (continued)June 30, 2016
52 Brookfield Investment Management Inc.
At June 30, 2016, the Real Assets Securities Fund had the following swap contract outstanding:
1 The Real Assets Securities Fund receives monthly payments based on any positive monthly return of the Referenced Obligation. The RealAssets Securities Fund makes payments on any negative monthly return of such Referenced Obligation.2 There are no upfront payments on the swap contracts listed above, therefore the unrealized depreciation on the contract is equal to its marketvalue.
The following table sets forth the fair value of the Fund’s derivative instruments:
Derivatives Statement of Assets and LiabilitiesValue as of
Below is the gross and net information about instruments and transactions eligible for offset in the Statement ofAssets and Liabilities as well as instruments and transactions subject to an agreement similar to a master nettingarrangement:
Gross Amounts not offset in theStatement of Assets and Liabilities
The Trust’s Declaration of Trust authorizes the issuance of an unlimited number of full and fractional shares ofbeneficial interest. With respect to each series, the Trust may offer more than one class of shares. The Trustreserves the right to create and issue additional series or classes. Each share of a series or class represents anequal proportionate interest in that series or class with each other share of that series or class. Currently, eachseries offers four classes of shares of beneficial interest — “Class A” Shares, “Class C” Shares, “Class Y” Shares,and “Class I” Shares.
BROOKFIELD INVESTMENT FUNDSNotes to Financial Statements (Unaudited) (continued)June 30, 2016
2016 Semi-Annual Report 53
The shares of each series or class participate equally in the earnings, dividends and assets of the particularseries or class.
1 For the Six Months Ended June 30, 2016.2 For the Year Ended December 31, 2015.
7. Credit Facility
U.S. Bank, N.A. (the “Bank”) has made available to the Trust, a credit facility, pursuant to a separate Loan andSecurity Agreement, for temporary or extraordinary purposes. The maximum line of credit as of June 30, 2016 forthe Trust is $75,000,000. For the six months ended June 30, 2016, the average interest rate on the outstandingprincipal amount for the Infrastructure Fund was 3.26%. Advances are not collateralized by a first lien against aFund’s assets.
During the six months ended June 30, 2016, the Infrastructure Fund utilized the credit facility for 1 day and had anoutstanding average daily loan balance of $42,000. The maximum amount outstanding during the period was$42,000 and the interest expense amounted to $4. The Global Real Estate Fund, U.S. Real Estate Fund and RealAssets Securities Fund did not utilize the credit facility during the period. At June 30, 2016, the Infrastructure Fund,Global Real Estate Fund, U.S. Real Estate Fund and Real Assets Securities Fund did not have a loan payable.
8. Federal Income Tax Information
Income and capital gain distributions are determined in accordance with federal income tax regulations, which maydiffer from GAAP.
BROOKFIELD INVESTMENT FUNDSNotes to Financial Statements (Unaudited) (continued)June 30, 2016
2016 Semi-Annual Report 57
The Federal income tax information referenced below is as of the Funds’ most recently completed tax year-end ofDecember 31, 2015.
The tax character of distributions paid for the year ended December 31, 2015 were as follows:
A notice disclosing the source(s) of a distribution is provided after a payment is made from any source other thannet investment income. Any such notice is provided only for informational purposes in order to comply with therequirements of Section 19(a) of the 1940 Act and not for tax reporting purposes. The tax composition of theFund’s distributions for each calendar year is reported on IRS Form 1099-DIV.
At December 31, 2015, the Funds’ most recently completed tax year-end, the components of net assets (excludingpaid-in capital) on a tax basis were as follows:
(1) To the extent that future capital gains are offset by capital loss carryforwards, such gains will not be distributed.
As of December 31, 2015, the Infrastructure Fund’s capital loss carryforwards was $38,984,170 from long-termcapital gains, the Real Assets Securities Fund’s capital loss carryforwards was $3,865,841 from short-term gainsand $78,938 from long-term capital gains which will not expire. As of December 31, 2015, the Global Real EstateFund and U.S. Real Estate Fund had no capital loss carryforwards.
Federal Income Tax Basis: The federal income tax basis of each Fund’s investments, not including foreigncurrency translation, at June 30, 2016 was as follows:
BROOKFIELD INVESTMENT FUNDSNotes to Financial Statements (Unaudited) (continued)June 30, 2016
58 Brookfield Investment Management Inc.
Capital Account Reclassifications: Because federal income tax regulations differ in certain respects from GAAP,income and capital gain distributions, if any, determined in accordance with tax regulations may differ from netinvestment income and realized gains recognized for financial reporting purposes. These differences are primarilydue to differing treatments for wash sales, partnership income/expense and return of capital. Permanent book andtax differences, if any, relating to shareholder distributions will result in reclassifications to paid-in-capital or toundistributed capital gains. These reclassifications have no effect on net assets or NAV per share.
9. Indemnification
Under the Funds’ organizational documents, its officers and trustees are indemnified against certain liabilitiesarising out of the performance of their duties to the Funds. In addition, in the normal course of business, the Trust,on behalf of the Funds, enters into contracts with vendors and others that provide for indemnification. The Funds’maximum exposure under these arrangements is unknown, since this would involve the resolution of certainclaims, as well as future claims that may be made, against the Funds. Thus an estimate of the financial impact, ifany, of these arrangements cannot be made at this time. However, based on experience, the Funds expect the riskof loss due to these warranties and indemnities to be unlikely.
10. Subsequent Events
GAAP requires recognition in the financial statements of the effects of all subsequent events that provideadditional evidence about conditions that existed at the date of the Statements of Assets and Liabilities. Fornon-recognized subsequent events that must be disclosed to keep the financial statements from being misleading,the Funds are required to disclose the nature of the event as well as an estimate of their financial effect, or astatement that such an estimate cannot be made.
On August 23, 2016, the Board approved the elimination of each Fund’s redemption fee effective September 1,2016.
Management has evaluated subsequent events in the preparation of the Funds’ financial statements and hasdetermined that herein, there are no additional events that require recognition or disclosure in the financialstatements.
BROOKFIELD INVESTMENT FUNDSNotes to Financial Statements (Unaudited) (concluded)June 30, 2016
2016 Semi-Annual Report 59
At a meeting held on May 12, 2016, the Board, including a majority of the Independent Trustees, considered andapproved the continuation of the investment advisory agreements (the �Advisory Agreements�) between BrookfieldInvestment Management Inc. (the �Adviser�) and the Funds. In approving the Advisory Agreements, the Board,including a majority of the Independent Trustees, determined that the fee structures were fair and reasonable andthat approval of the Advisory Agreements was in the best interests of each Fund and its shareholders. The Boardof Trustees considered a wide range of information, including information regularly received from the Adviser atthe quarterly Board meetings. While attention was given to all information furnished, the following discusses theprimary factors relevant to the Board’s decision.
NATURE, EXTENT AND QUALITY OF SERVICES. The Board considered the level and depth of knowledge ofthe Adviser. In evaluating the quality of services provided by the Adviser, the Board took into account its familiaritywith the Adviser’s management through board meetings, conversations and reports. The Board noted that theAdviser is responsible for managing the Funds’ investment programs, the general operations and the day-to-daymanagement of the Funds and for compliance with applicable laws, regulations, policies and procedures. TheBoard concluded that the nature, extent and quality of the overall services provided by the Adviser and its affiliatesare satisfactory. The Board’s conclusion was based, in part, upon services provided to the Funds such asquarterly reports provided by the Adviser: 1) comparing the performance of each Fund with a peer group, 2)showing that the investment policies and restrictions for each Fund were followed, and 3) covering matters such asthe compliance of investment personnel and other access persons with the Adviser’s and the Funds’ codes ofethics, the adherence to fair value pricing procedures established by the Board, the monitoring of portfoliocompliance and presentations regarding the economic environment. The Board also considered the experience ofthe Adviser as an investment adviser and the experience of the team of portfolio managers that manages theFunds and its current experience in acting as an investment adviser to other investment funds and institutionalclients.
INVESTMENT PERFORMANCE. The Board placed significant emphasis on the investment performance of theFunds in view of its importance to shareholders. While consideration was given to performance reports anddiscussions at Board meetings throughout the year, particular attention in assessing the performance was given toa report (the “Broadridge Report”) for the Funds prepared by Broadridge, an independent third party provider ofinvestment company data, furnished in connection with the contract renewal process. The Broadridge Reportcompared each of the Brookfield Global Listed Infrastructure Fund’s and the Brookfield Global Listed Real EstateFund’s performance with its peer group of other funds (the “Performance Universe”), as selected by Broadridge,for the one-, two-, three- and four-year periods ending April 30, 2016. The Board noted that the Brookfield GlobalListed Infrastructure Fund performed below the median of its Performance Universe for all periods. The BrookfieldGlobal Listed Real Estate Fund performed below the median of its Performance Universe for the one-year periodand above the median of its Performance Universe for the two-, three- and four-year periods. Because theBrookfield U.S. Listed Real Estate Fund had only been in operation since December 11, 2013, its performancewas compared with its Performance Universe for the one- and two-year periods ending April 30, 2016. The Boardnoted that the Brookfield U.S. Listed Real Estate Fund performed below the median of its Performance Universefor both periods. Because the Brookfield Real Assets Securities Fund had only been in operation sinceNovember 19, 2014, its performance was compared with its Performance Universe for the one-year period endingApril 30, 2016. The Board noted that the Brookfield Real Assets Securities Fund performed below the median ofits Performance Universe for the one-year period. Based on the Adviser’s discussion of the current markets and itspositioning of each Fund’s portfolio, as well as the Adviser’s explanation of each Fund’s performance in thecurrent market, the Board concluded that each Fund’s performance was satisfactory.
PROFITABILITY. The Board also considered the level of profits expected to be realized by the Adviser and itsaffiliates in connection with the operation of the Funds. In this regard, the Board reviewed the Fund profitabilityanalysis addressing the overall profitability of the Adviser for its management of the Brookfield fund family, as wellas its expected profits and that of its affiliates for providing administrative support for the Funds. The Board furthernoted that the methodology followed in allocating costs to the Funds appeared reasonable, while also recognizingthat allocation methodologies are inherently subjective. The Board also specifically noted that the Adviser agreedto extend its contractual expense waiver for the Funds, in order to limit the Funds’ net operating expenses. TheBoard concluded that the expected profitability to the Adviser from the Funds was reasonable.
MANAGEMENT FEES AND TOTAL EXPNENSES. The Board also placed significant emphasis on the review ofeach Fund’s expenses. The Board compared the advisory fees and total expense ratios of each of the Funds withvarious comparative data that it had been provided, including comparisons of each Fund’s management fee and
BROOKFIELD INVESTMENT FUNDSBoard Considerations Relating to the Investment Advisory Agreements (Unaudited)June 30, 2016
60 Brookfield Investment Management Inc.
net expense level to those of a peer group selected by Broadridge (the “Expense Group”) and a peer groupselected by management. The Board noted that the Brookfield Global Listed Infrastructure Fund’s total expensesafter the expense waiver and total advisory and administrative fees were higher than the median of its ExpenseGroup, while total expenses after the expense waiver were at the median and total advisory and administrativefees were above the median of its peer group selected by management. The Board noted that the BrookfieldGlobal Listed Real Estate Fund’s total expenses after the expense waiver were below the median and totaladvisory and administrative fees were at the median of its Expense Group and of its peer group selected bymanagement. The Board noted that the Brookfield U.S. Listed Real Estate Fund’s total expenses after the expensewaiver and total advisory and administrative fees were above the median of its Expense Group and of its peergroup selected by management. The Board noted that the Brookfield Real Assets Securities Fund’s total expensesafter the expense waiver were at the median and total advisory and administrative fees were above the median ofits Expense Group, while total expenses after the expense waiver and total advisory and administrative fees wereabove the median of its peer group selected by management. The Board also noted that the fees and expensespayable by the Funds were comparable to those payable by other client accounts managed by the Adviser andconcluded that each Fund’s management fees and total expenses were reasonable.
ECONOMIES OF SCALE. The Board considered the potential economies of scale that may be realized if theassets of the Funds grow. The Board noted that shareholders might benefit from lower operating expenses as aresult of an increasing amount of assets being spread over the fixed expenses of the Funds, while the Funds’expense limitation agreement with the Adviser served to limit the Funds’ expenses until the Funds had theopportunity to grow their assets.
In considering the approval of the Advisory Agreements, the Board, including the Independent Trustees, did notidentify any single factor as controlling. Based on the Board’s evaluation of all factors that it deemed to berelevant, the Board, including the Independent Trustees, concluded that the Adviser has demonstrated that itpossesses the capability and resources necessary to perform the duties required of it under the AdvisoryAgreements; the Adviser was taking steps to address the Funds’ performance; and the proposed Advisory feesare fair and reasonable, given the nature, extent and quality of the services to be rendered by the Adviser.
After carefully reviewing all of these factors, the Board, including the Independent Trustees, unanimously approvedthe continuation of the Advisory Agreements.
BROOKFIELD INVESTMENT FUNDSBoard Considerations Relating to the Investment Advisory Agreements (Unaudited) (continued)June 30, 2016
2016 Semi-Annual Report 61
Brookfield Investment Management Inc. (“BIM”), on its own behalf and on behalf of the funds managed by BIMand its affiliates, recognizes and appreciates the importance of respecting the privacy of our clients andshareholders. Our relationships are based on integrity and trust and we maintain high standards to safeguard yournon-public personal information (“Personal Information”) at all times. This privacy policy (“Policy”) describes thetypes of Personal Information we collect about you, the steps we take to safeguard that information and thecircumstances in which it may be disclosed.
If you hold shares of a Fund through a financial intermediary, such as a broker, investment adviser, bank or trustcompany, the privacy policy of your financial intermediary will also govern how your Personal Information will beshared with other parties.
WHAT INFORMATION DO WE COLLECT?
We collect the following Personal Information about you:
• Information we receive from you in applications or other forms, correspondence or conversations, includingbut not limited to name, address, phone number, social security number, assets, income and date of birth.
• Information about transactions with us, our affiliates, or others, including but not limited to account number,balance and payment history, parties to transactions, cost basis information, and other financial information.
• Information we may receive from our due diligence, such as your creditworthiness and your credit history.
WHAT IS OUR PRIVACY POLICY?
We may share your Personal Information with our affiliates in order to provide products or services to you or tosupport our business needs. We will not disclose your Personal Information to nonaffiliated third parties unless 1)we have received proper consent from you; 2) we are legally permitted to do so; or 3) we reasonably believe, ingood faith, that we are legally required to do so. For example, we may disclose your Personal Information with thefollowing in order to assist us with various aspects of conducting our business, to comply with laws or industryregulations, and/or to effect any transaction on your behalf;
• Unaffiliated service providers (e.g. transfer agents, securities broker-dealers, administrators, investmentadvisors or other firms that assist us in maintaining and supporting financial products and services providedto you);
• Government agencies, other regulatory bodies and law enforcement officials (e.g. for reporting suspicioustransactions);
• Other organizations, with your consent or as directed by you; and
• Other organizations, as permitted or required by law (e.g. for fraud protection)
When we share your Personal Information, the information is made available for limited purposes and undercontrolled circumstances designed to protect your privacy. We require third parties to comply with our standards forsecurity and confidentiality.
HOW DO WE PROTECT CLIENT INFORMATION?
We restrict access to your Personal Information to those persons who require such information to assist us withproviding products or services to you. It is our practice to maintain and monitor physical, electronic, and proceduralsafeguards that comply with federal standards to guard client nonpublic personal information. We regularly trainour employees on privacy and information security and on their obligations to protect client information.
CONTACT INFORMATION
For questions concerning our Privacy Policy, please contact our client services representative at 1-855-777-8001.
BROOKFIELD INVESTMENT FUNDSJoint Notice of Privacy Policy (Unaudited)
62 Brookfield Investment Management Inc.
Investment Adviser and AdministratorBrookfield Investment Management Inc.Brookfield Place250 Vesey Street, 15th FloorNew York, New York 10281-1023www.brookfieldim.com
Please direct your inquiries to:Investor RelationsPhone: 1-855-777-8001E-mail: [email protected]
Transfer AgentShareholder inquiries relating to distributions, addresschanges and shareholder account information shouldbe directed to the Funds’ transfer agent:
U.S. Bancorp Fund Services, LLC615 East Michigan StreetMilwaukee, Wisconsin 532021-855-244-4859
Fund Accounting AgentU.S. Bancorp Fund Services, LLC615 East Michigan StreetMilwaukee, Wisconsin 53202
Sub-AdministratorU.S. Bancorp Fund Services, LLC1201 South Alma School Road, Suite 3000Mesa, Arizona 85210
Independent Registered Public Accounting FirmDeloitte & Touche LLP111 South Wacker DriveChicago, Illinois 60606
Legal CounselPaul Hastings LLP75 East 55th StreetNew York, New York 10022
CustodianU.S. Bank National Association1555 North River Center Drive, Suite 302Milwaukee, Wisconsin 53212
DistributorQuasar Distributors, LLC615 East Michigan StreetMilwaukee, Wisconsin 53202
Trustees of the FundEdward A. Kuczmarski ChairmanLouis P. Salvatore Audit Committee ChairmanHeather S. Goldman TrusteeStuart A. McFarland TrusteeJonathan C. Tyras Trustee (Interested)
Officers of the FundBrian F. Hurley PresidentAngela W. Ghantous TreasurerAlexis I. Rieger SecretarySeth A. Gelman Chief Compliance Officer
The Funds file their complete schedule of portfolio holdings with the SEC for the first and third quarters of each fiscal year on Form N-Q. TheFunds’ Form N-Q will be available on the SEC’s website at www.sec.gov. In addition, the Funds’ Form N-Q may be reviewed and copied at theSEC’s Public Reference Room in Washington, D.C. Information on the operation of the Public Reference Room may be obtained by calling1-800-SEC-0330.
You may obtain a description of the Funds’ proxy voting policies and procedures, and information regarding how the Funds voted proxiesrelating to portfolio securities during the most recent 12-month period ended June 30, without charge, upon request by calling 1-855-777-8001,or go to the SEC’s website at www.sec.gov.