36
Brooklyn Queens Expressway Origin-Desnaon Study NYCDOT 2016 Appendix C

Brooklyn Queens Expressway
Origin-Destination Study
NYCDOT
2016
Appendix C

1
Analysis Background The AKRF Team, in coordination with NYCDOT, coordinated with New York Metropolitan Transportation Council (NYMTC) MPO to obtain the latest version of the New York Best Practice Model (NYBPM). The AKRF Team used to the model to conduct a select link analysis (SLA) for three sections of the BQE to identify preliminary O-D patterns during the morning 6-10 a.m. and evening 4-8 p.m. peak periods for six directional links and extractions of O-D flows per peak period. The analysis summaries include the origins and destinations, O-D flows and percent shares by auto and truck vehicle classes. The three select link analysis sections of I-278 (Figure 1) were:
A. At Smith Street (Gowanus Canal) B. At Triple Cantilever Section C. At Vanderbilt Avenue (East of Manhattan Bridge)
Figure 1: I-278 Select Link Analysis Sections
The detailed O-D tables were summarized by two zonal tiers: (1) NYMTC regional counties and (2) NYC neighborhoods. The first (higher) aggregation level was the 28 counties covered by the NYBPM, plus all external zones grouped together into a 29th category. The second (finer) aggregation level uses the NYCDCP’s neighborhood delineated spatial boundaries. There are 195 neighborhood spatial “zones” in the five boroughs of New York City. For this finer level of aggregation, county-level aggregations were maintained in Manhattan, The Bronx, and Staten Island, as well as outside New York City, while origins and destinations in Brooklyn and Queens were summarized at the NYCDCP neighborhood-level. In total, this second aggregation level has a total of 136 geographic areas.
A
B
C

2
The O-D tables are given by autos, trucks and total autos plus trucks. The resulting 72 O-D tables were used to generate a summary presentation including percentage breakdowns and detailed figures for the Cantilever Section in particular.
Summary of Key Findings Eastbound Cantilever Section On the cantilever section, the following eastbound trip distributions were identified during the modeled 4-hour morning period (6-10 a.m.): Autos by Origin Trucks by Origin
7% of autos are from NJ origins to NYC destinations, of which 4% are destined for Manhattan
27% of autos are from S.I., of which 10% are destined for Manhattan, 11% to Queens and 4% to Brooklyn
The largest share of autos, 58%, are trips from Brooklyn to destinations within NYC, with 19% to the Bronx, 12% to Manhattan, 10% to Queens and 17% within Brooklyn
Approximately 0.5% of autos are from NJ to Long Island
36% of the autos come from the Verrazano Narrows Bridge
84% of autos on the cantilever section are intra-NYC trips
10% of trucks are from NJ and other origins south/west to NYC destinations and 14% are going to Long Island
36% of trucks are from S.I., of which 4% are destined for Manhattan, 16% to Queens, 6% to Brooklyn and 9% to Long Island
33% of truck trips are from Brooklyn to destinations within NYC, with 1% to the Bronx, 5% to Manhattan, 11% to Queens and 16% within Brooklyn
60% of trucks come from the Verrazano Narrows Bridge
60% of trucks on the cantilever section are intra-NYC trips
1% of all trucks on the cantilever section are destined for JFK Airport; of those trucks nearly 65% are from outside NYC

3
Figures 2 and 3 provide a view of morning eastbound auto and truck distributions, respectively, approaching and departing the cantilever section. The percentages listed in the figures represent the share of BQE cantilever traffic that passed each labeled point approaching (blue) or departing (red) the cantilever section (yellow). The figure is to illustrate primary routes to/from the select link.
Figure 2: Eastbound Autos – Morning
Figure 3: Eastbound Trucks – Morning

4
During the modeled 4-hour evening period (4-8 p.m.), the following eastbound trip distributions were identified: Autos by Origin Trucks by Origin
7% of autos are from NJ origins to NYC destinations, of which 3% are destined for Manhattan
16% of autos are from S.I., of which 7% are destined for Manhattan, 5% to Queens and 3% to Brooklyn
The largest share of autos, 65%, are trips from Brooklyn to destinations within NYC, with 7% to the Bronx, 14% to Manhattan, 11% to Queens and 33% within Brooklyn
Approximately 3% of autos are from Brooklyn to Long Island
24% of the autos come from the Verrazano Narrows Bridge
80% of autos on the cantilever section are intra-NYC trips
8% of trucks are from NJ and other origins south/west to NYC destinations and 10% are going to Long Island
31% of trucks are from S.I., of which 3% are destined for Manhattan, 13% to Queens, 6% to Brooklyn and 7% to Long Island
44% of truck trips are from Brooklyn to destinations within NYC, with 1% to the Bronx, 7% to Manhattan, 13% to Queens and 23% within Brooklyn
49% of trucks come from the Verrazano Narrows Bridge
68% of trucks on the cantilever section are intra-NYC trips
The evening period does not indicate a share of JFK Airport-bound trucks on the cantilever section of the BQE.

5
Figures 4 and 5 provide a view of evening eastbound auto and truck distributions, respectively, approaching and departing the cantilever section. The percentages listed in the figures represent the share of BQE cantilever traffic that passed each labeled point approaching (blue) or departing (red) the cantilever section (yellow). The figure is to illustrate primary routes to/from the select link.
Figure 4: Eastbound Autos – Evening
Figure 5: Eastbound Trucks – Evening

6
Westbound Cantilever Section On the cantilever section, the following westbound trip distributions were identified during the modeling 4-hour morning period (6-10 a.m.): Autos by Origin Trucks by Origin
6% of autos are from NJ origins to Brooklyn destinations
41% of autos are from Brooklyn, of which 37% are intra-Brooklyn trips, 3% are to S.I. and 1% are going through to NJ and points west
Approximately 20% of trips are from Manhattan, of which 15% are destined for Brooklyn and 5% are to S.I.
11% are from Queens to Brooklyn and 7% are from the Bronx to Brooklyn
16% of the autos go to the Verrazano Narrows Bridge
82% of autos on the cantilever section are intra-NYC trips
24% of trucks are from Brooklyn, of which 22% are intra-Brooklyn trips, 1% are to S.I. and 1% are going through to NJ and points west
Approximately 49% of trips are from Manhattan, of which 41% are destined for Brooklyn and 8% are to S.I.
17% are from Queens to Brooklyn and 0.5% are from the Bronx to Brooklyn
Approximately 3% of trucks are from Long Island to either Brooklyn or S.I., and another 3% are to NJ
15% of the trucks go to the Verrazano Narrows Bridge
90% of trucks on the cantilever section are intra-NYC trips

7
Figures 6 and 7 provide a view of morning westbound auto and truck distributions, respectively, approaching and departing the cantilever section. The percentages listed in the figures represent the share of BQE cantilever traffic that passed each labeled point approaching (blue) or departing (red) the cantilever section (yellow). The figure is to illustrate primary routes to/from the select link.
Figure 6: Westbound Autos – Morning
Figure 7: Westbound Trucks – Morning

8
During the modeled 4-hour evening period (4-8 p.m.), the following westbound trip distributions were identified: Autos by Origin Trucks by Origin
Less than 1% of autos are from NJ origins to Brooklyn destinations
32% of autos are from Brooklyn, of which 28% are intra-Brooklyn trips, 3% are to S.I. and 1% are going through to NJ and points west
Approximately 22% of trips are from Manhattan, of which 11% are destined for Brooklyn, 10% are to S.I. and 1% are going to Queens
From Queens 16% are to Brooklyn and 10% are to S.I., and 12% are from the Bronx to Brooklyn
28% of the autos go to the Verrazano Narrows Bridge
92% of autos on the cantilever section are intra-NYC trips
28% of trucks are from Brooklyn, of which 27% are intra-Brooklyn trips, and 1% are to S.I.
Approximately 47% of trips are from Manhattan, of which 40% are destined for Brooklyn and 7% are to S.I.
18% are from Queens to Brooklyn and 1% are from the Bronx to Brooklyn
Approximately 3% of trucks are from Long Island to either Brooklyn or S.I.
Between the Prospect Expressway and the VNB, 46% of trucks using the cantilever section exit into Brooklyn from the Gowanus Expressway
10% of the trucks go to the Verrazano Narrows Bridge
95% of trucks on the cantilever section are intra-NYC trips

9
Figures 8 and 9 provide a view of evening westbound auto and truck distributions, respectively, approaching and departing the cantilever section. The percentages listed in the figures represent the share of BQE cantilever traffic that passed each labeled point approaching (blue) or departing (red) the cantilever section (yellow). The figure is to illustrate primary routes to/from the select link.
Figure 8: Westbound Autos – Evening
Figure 9: Westbound Trucks – Evening

10
Additional Findings Additional detailed results and tables for all three analyzed sections are provided in the attached presentation. The O-D tables are available upon request.

HBKBQE
Brooklyn Queens Expressway Cantilever Projects

Summary of Origin‐Destination Study
Methodology Select Link Analysis from NYBPM 2010 base year (latest)
Three sections of the I‐278 traced back to origin and forward to destination
Analysis sections1. At Triple Cantilever Section2. At Smith Street (Gowanus Canal)3. At Vanderbilt Avenue (East of Manhattan Bridge)
Bi‐directional flows by auto, truck, and autos + trucks for 4‐hour morning and evening time periods
OD tables by NYMTC regional counties and by NYC neighborhoods 72 total OD tables
2
FINAL

Table of Contents
FINAL
3
Summary Slide Number(s)
BQE Cantilever Daily Classification Counts 4, 11
BQE Cantilever Eastbound (Northbound) OD Trips 5‐9
BQE Cantilever Eastbound Local / Through Trips 10
BQE Cantilever Westbound (Southbound) OD Trips 12‐16
BQE Cantilever Westbound Local / Through Trips 17
Gowanus Expressway at Smith Street Summary 18‐21
BQE at Vanderbilt Avenue Summary 22‐25

BQE Cantilever Section | Volume Profiles
Eastbound count from NYSDOT (2011)
4
75,610 daily vehicles67,789 autos7,211 trucks
FINAL

BQE Cantilever Section | Eastbound | Morning5
Auto Origins (Blue) – Key findings 7% of autos are from NJ origins to NYC
destinations, of which 4% are destined for Manhattan
27% of autos are from S.I., of which 10% are destined for Manhattan, 11% to Queens and 4% to Brooklyn
The largest share of autos, 58%, are trips from Brooklyn to destinations within NYC, with 19% to the Bronx, 12% to Manhattan, 10% to Queens and 17% within Brooklyn
Approximately 0.5% of autos are from NJ to Long Island
36% of the autos come from the Verrazano Narrows Bridge
84% of autos on the cantilever section are intra‐NYC trips
FINAL
The percentages listed represent the share of BQE cantilever traffic that passed that point going to (blue) or coming from (red) the select link.
Findings listed above are based on detailed O/D tables, and are not meant as a description of the figure to the right. The figure is to illustrate primary routes to/from the select link. Percentages listed above correspond to the tables on slide #8.

BQE Cantilever Section | Eastbound | Morning6
Truck Origins (Blue) – Key findings 10% of trucks are from NJ and other origins
south/west to NYC destinations and 14% are going to Long Island
36% of trucks are from S.I., of which 4% are destined for Manhattan, 16% to Queens, 6% to Brooklyn and 9% to Long Island
33% of truck trips are from Brooklyn to destinations within NYC, with 1% to the Bronx, 5% to Manhattan, 11% to Queens and 16% within Brooklyn
60% of trucks come from the Verrazano Narrows Bridge
60% of trucks on the cantilever section are intra‐NYC trips
1% of all trucks on the cantilever section are destined for JFK Airport; of those trucks nearly 65% are from outside NYC
FINAL
The percentages listed represent the share of BQE cantilever traffic that passed that point going to (blue) or coming from (red) the select link.
Findings listed above are based on detailed O/D tables, and are not meant as a description of the figure to the right. The figure is to illustrate primary routes to/from the select link. Percentages listed above correspond to the tables on slide #8.

BQE Cantilever Section | Eastbound | Evening7
Auto Origins (Blue) – Key findings 7% of autos are from NJ origins to NYC
destinations, of which 3% are destined for Manhattan
16% of autos are from S.I., of which 7% are destined for Manhattan, 5% to Queens and 3% to Brooklyn
The largest share of autos, 65%, are trips from Brooklyn to destinations within NYC, with 7% to the Bronx, 14% to Manhattan, 11% to Queens and 33% within Brooklyn
Approximately 3% of autos are from Brooklyn to Long Island
24% of the autos come from the Verrazano Narrows Bridge
80% of autos on the cantilever section are intra‐NYC trips
FINAL
The percentages listed represent the share of BQE cantilever traffic that passed that point going to (blue) or coming from (red) the select link.
Findings listed above are based on detailed O/D tables, and are not meant as a description of the figure to the right. The figure is to illustrate primary routes to/from the select link. Percentages listed above correspond to the tables on slide #8.

BQE Cantilever Section | Eastbound | Evening8
Truck Origins (Blue) – Key findings 8% of trucks are from NJ and other origins
south/west to NYC destinations and 10% are going to Long Island
31% of trucks are from S.I., of which 3% are destined for Manhattan, 13% to Queens, 6% to Brooklyn and 7% to Long Island
44% of truck trips are from Brooklyn to destinations within NYC, with 1% to the Bronx, 7% to Manhattan, 13% to Queens and 23% within Brooklyn
49% of trucks come from the Verrazano Narrows Bridge
68% of trucks on the cantilever section are intra‐NYC trips
The evening period does not indicate a share of JFK Airport‐bound trucks on the cantilever section of the BQE.
FINAL
The percentages listed represent the share of BQE cantilever traffic that passed that point going to (blue) or coming from (red) the select link.
Findings listed above are based on detailed O/D tables, and are not meant as a description of the figure to the right. The figure is to illustrate primary routes to/from the select link. Percentages listed above correspond to the tables on slide #8.

BQE Cantilever Section | Eastbound9
Auto SummariesMorning
Evening
Truck SummariesMorning
Evening
MN QN BX BK SI LI NJ OtherMN 0% 0% 0% 0% 0% 0% 0% 0%QN 1% 0% 0% 0% 0% 0% 0% 0%BX 0% 0% 0% 0% 0% 0% 0% 0%BK 12% 10% 19% 17% 0% 2% 2% 1%SI 10% 11% 1% 4% 0% 2% 0% 0%LI 0% 0% 0% 0% 0% 0% 0% 0%NJ 4% 3% 0% 1% 0% 0% 0% 0%Other 0% 1% 0% 0% 0% 0% 0% 0%
MN QN BX BK SI LI NJ OtherMN 0% 0% 0% 0% 0% 0% 0% 0%QN 0% 0% 0% 0% 0% 0% 0% 0%BX 0% 0% 0% 0% 0% 0% 0% 0%BK 5% 11% 1% 17% 0% 1% 5% 1%SI 4% 16% 1% 6% 0% 9% 0% 0%LI 0% 0% 0% 0% 0% 0% 0% 0%NJ 0% 1% 0% 2% 0% 1% 0% 0%Other 0% 6% 0% 0% 0% 13% 0% 0%
MN QN BX BK SI LI NJ OtherMN 0% 0% 0% 0% 0% 0% 0% 0%QN 0% 0% 0% 0% 0% 0% 0% 0%BX 0% 0% 0% 0% 0% 0% 0% 0%BK 14% 12% 7% 33% 0% 3% 3% 5%SI 7% 5% 1% 3% 0% 0% 0% 1%LI 0% 0% 0% 0% 0% 0% 0% 0%NJ 3% 3% 0% 1% 0% 0% 0% 0%Other 0% 1% 0% 0% 0% 0% 0% 0%
MN QN BX BK SI LI NJ OtherMN 0% 0% 0% 0% 0% 0% 0% 0%QN 0% 0% 0% 0% 0% 0% 0% 0%BX 0% 0% 0% 0% 0% 0% 0% 0%BK 7% 13% 1% 24% 0% 1% 5% 1%SI 4% 13% 1% 5% 0% 7% 0% 1%LI 0% 0% 0% 0% 0% 0% 0% 0%NJ 0% 1% 0% 1% 0% 0% 0% 0%Other 0% 6% 0% 0% 0% 10% 0% 0%
* Reading tables: origins are down the left and destinations are across the top; percentages are based on total trips for all O/D pairs. FINAL

MorningMorning EveningEvening
FINAL
Eastbound autos exiting within the potential tunnel area: 54% of eastbound autos exit the BQE
31% go westbound on Brooklyn Bridge 18% go westbound on Manhattan Bridge 5% exit locally to Downtown Brooklyn area via
Exits 28 and 29 The remaining 46% continue north on the BQE
Eastbound trucks exiting within the potential tunnel area: 21% of eastbound trucks and commercial vehicles
exit the BQE 14% go westbound on Manhattan Bridge;
Brooklyn Bridge is prohibited 7% exit locally to Downtown Brooklyn area via
Exits 28 and 29 The remaining 79% continue north/east on the BQE
Eastbound autos exiting within the potential tunnel area: 45% of eastbound autos exit the BQE
30% go westbound on Brooklyn Bridge 11% go westbound on Manhattan Bridge 4% exit locally to Downtown Brooklyn area via
Exits 28 and 29 The remaining 55% continue north on the BQE
Eastbound trucks exiting within the potential tunnel area: 25% of eastbound trucks and commercial vehicles
exit the BQE 16% go westbound on Manhattan Bridge;
Brooklyn Bridge is prohibited 9% exit locally to Downtown Brooklyn area via
Exits 28 and 29 The remaining 75% continue north/east on the BQE
10
Local vs. Through Findings for Tunnel Option

BQE Cantilever Section | Volume Profiles
Westbound count from NYSDOT (2011) – 82,967 daily vehicles
11
82,967 daily vehicles75,783 autos6,535 trucks
FINAL

BQE Cantilever Section | Westbound | Morning12
Auto Origins (Blue) – Key findings 6% of autos are from NJ origins to Brooklyn
destinations
41% of autos are from Brooklyn, of which 37% are intra‐Brooklyn trips, 3% are to S.I. and 1% are going through to NJ and points west
Approximately 20% of trips are from Manhattan, of which 15% are destined for Brooklyn and 5% are to S.I.
11% are from Queens to Brooklyn and 7% are from the Bronx to Brooklyn
16% of the autos go to the Verrazano Narrows Bridge
82% of autos on the cantilever section are intra‐NYC trips
FINAL
The percentages listed represent the share of BQE cantilever traffic that passed that point going to (blue) or coming from (red) the select link.
Findings listed above are based on detailed O/D tables, and are not meant as a description of the figure to the right. The figure is to illustrate primary routes to/from the select link. Percentages listed above correspond to the tables on slide #14.

BQE Cantilever Section | Westbound | Morning13
Truck Origins (Blue) – Key findings 24% of trucks are from Brooklyn, of
which 22% are intra‐Brooklyn trips, 1% are to S.I. and 1% are going through to NJ and points west
Approximately 49% of trips are from Manhattan, of which 41% are destined for Brooklyn and 8% are to S.I.
17% are from Queens to Brooklyn and 0.5% are from the Bronx to Brooklyn
Approximately 3% of trucks are from Long Island to either Brooklyn or S.I., and another 3% are to NJ
15% of the trucks go to the Verrazano Narrows Bridge
90% of trucks on the cantilever section are intra‐NYC trips
FINAL
The percentages listed represent the share of BQE cantilever traffic that passed that point going to (blue) or coming from (red) the select link.
Findings listed above are based on detailed O/D tables, and are not meant as a description of the figure to the right. The figure is to illustrate primary routes to/from the select link. Percentages listed above correspond to the tables on slide #14.

BQE Cantilever Section | Westbound | Evening14
Auto Origins (Blue) – Key findings Less than 1% of autos are from NJ origins to
Brooklyn destinations
32% of autos are from Brooklyn, of which 28% are intra‐Brooklyn trips, 3% are to S.I. and 1% are going through to NJ and points west
Approximately 22% of trips are from Manhattan, of which 11% are destined for Brooklyn, 10% are to S.I. and 1% are going to Queens
From Queens 16% are to Brooklyn and 10% are to S.I., and 12% are from the Bronx to Brooklyn
28% of the autos go to the Verrazano Narrows Bridge
92% of autos on the cantilever section are intra‐NYC trips
FINAL
The percentages listed represent the share of BQE cantilever traffic that passed that point going to (blue) or coming from (red) the select link.
Findings listed above are based on detailed O/D tables, and are not meant as a description of the figure to the right. The figure is to illustrate primary routes to/from the select link. Percentages listed above correspond to the tables on slide #14.

BQE Cantilever Section | Westbound | Evening15
Truck Origins (Blue) – Key findings 28% of trucks are from Brooklyn, of which
27% are intra‐Brooklyn trips, and 1% are to S.I.
Approximately 47% of trips are from Manhattan, of which 40% are destined for Brooklyn and 7% are to S.I.
18% are from Queens to Brooklyn and 1% are from the Bronx to Brooklyn
Approximately 3% of trucks are from Long Island to either Brooklyn or S.I.
Between the Prospect Expwy and the VNB, 46% of trucks using the cantilever section exit into Brooklyn from the Gowanus Expwy
10% of the trucks go to the Verrazano Narrows Bridge
95% of trucks on the cantilever section are intra‐NYC trips
FINAL
The percentages listed represent the share of BQE cantilever traffic that passed that point going to (blue) or coming from (red) the select link.
Findings listed above are based on detailed O/D tables, and are not meant as a description of the figure to the right. The figure is to illustrate primary routes to/from the select link. Percentages listed above correspond to the tables on slide #14.

BQE Cantilever Section | Westbound16
Auto SummariesMorning
Evening
Truck SummariesMorning
Evening
MN QN BX BK SI LI NJ OtherMN 0% 0% 0% 15% 5% 0% 0% 0%QN 0% 0% 0% 11% 3% 0% 2% 1%BX 0% 0% 0% 7% 0% 0% 0% 0%BK 0% 0% 0% 37% 3% 0% 1% 0%SI 0% 0% 0% 0% 0% 0% 0% 0%LI 0% 0% 0% 4% 0% 0% 0% 0%NJ 0% 0% 0% 4% 0% 0% 0% 0%Other 0% 0% 0% 6% 0% 0% 0% 0%
MN QN BX BK SI LI NJ OtherMN 0% 0% 0% 41% 8% 0% 0% 0%QN 0% 0% 0% 17% 0% 0% 1% 1%BX 0% 0% 0% 0% 0% 0% 0% 0%BK 0% 0% 0% 23% 1% 0% 0% 1%SI 0% 0% 0% 0% 0% 0% 0% 0%LI 0% 0% 0% 2% 1% 0% 3% 0%NJ 0% 0% 0% 1% 0% 0% 0% 0%Other 0% 0% 0% 1% 0% 0% 0% 0%
MN QN BX BK SI LI NJ OtherMN 0% 1% 0% 11% 10% 0% 0% 0%QN 0% 0% 0% 16% 10% 0% 1% 0%BX 0% 0% 0% 12% 0% 0% 0% 0%BK 0% 0% 0% 28% 4% 0% 0% 0%SI 0% 0% 0% 0% 0% 0% 0% 0%LI 0% 0% 0% 3% 2% 0% 0% 0%NJ 0% 0% 0% 0% 0% 0% 0% 0%Other 0% 0% 0% 1% 0% 0% 0% 0%
MN QN BX BK SI LI NJ OtherMN 0% 0% 0% 40% 7% 0% 0% 0%QN 0% 0% 0% 18% 0% 0% 0% 0%BX 0% 0% 0% 1% 0% 0% 0% 0%BK 0% 0% 0% 28% 1% 0% 0% 0%SI 0% 0% 0% 0% 0% 0% 0% 0%LI 0% 0% 0% 1% 1% 0% 0% 0%NJ 0% 0% 0% 1% 0% 0% 0% 0%Other 0% 0% 0% 1% 0% 0% 0% 0%
* Reading tables: origins are down the left and destinations are across the top; percentages are based on total trips for all O/D pairs. FINAL

MorningMorning EveningEvening
FINAL
Westbound autos exiting within the potential tunnel area: 57% of westbound autos exit the BQE
28% at ramp to Tillary Street (Exit 29) 25% at ramp to Old Fulton Street (Exit 28) 4% at ramp to Columbia Street (Exit 27)
The remaining 43% continue north on the BQE
Westbound trucks exiting within the potential tunnel area: 63% of westbound trucks and commercial vehicles
exit the BQE 47% at ramp to Tillary Street (Exit 29) 10% at ramp to Old Fulton Street (Exit 28) 6% at ramp to Columbia Street (Exit 27)
The remaining 37% continue south/west on the BQE
Westbound autos exiting within the potential tunnel area: 29% of westbound autos exit the BQE
20% at ramp to Tillary Street (Exit 29) 4% at ramp to Old Fulton Street (Exit 28) 5% at ramp to Columbia Street (Exit 27)
The remaining 71% continue north on the BQE
Westbound trucks exiting within the potential tunnel area: 69% of westbound trucks and commercial vehicles
exit the BQE 51% at ramp to Tillary Street (Exit 29) 12% at ramp to Old Fulton Street (Exit 28) 6% at ramp to Columbia Street (Exit 27)
The remaining 31% continue south/west on the BQE
17
Local vs. Through Findings for Tunnel Option

FINAL
18
Gowanus ExpresswaySection over Smith Street
Northbound @ Smith StNorthbound @ Smith St Southbound @ Smith StSouthbound @ Smith St
FINAL
0
1,000
2,000
3,000
4,000
5,000
6,000
12‐1a
1‐2a
2‐3a
3‐4a
4‐5a
5‐6a
6‐7a
7‐8a
8‐9a
9‐10
a10
‐11a
11‐12p
12‐1p
1‐2p
2‐3p
3‐4p
4‐5p
5‐6p
6‐7p
7‐8p
8‐9p
9‐10
p10
‐11p
11‐12a
COUNT
HOUR
Autos Trucks Buses Total Vehicles
0
1,000
2,000
3,000
4,000
5,000
6,000
12‐1a
1‐2a
2‐3a
3‐4a
4‐5a
5‐6a
6‐7a
7‐8a
8‐9a
9‐10
a10
‐11a
11‐12p
12‐1p
1‐2p
2‐3p
3‐4p
4‐5p
5‐6p
6‐7p
7‐8p
8‐9p
9‐10
p10
‐11p
11‐12a
COUNT
HOUR
Autos Trucks Buses Total Vehicles
19
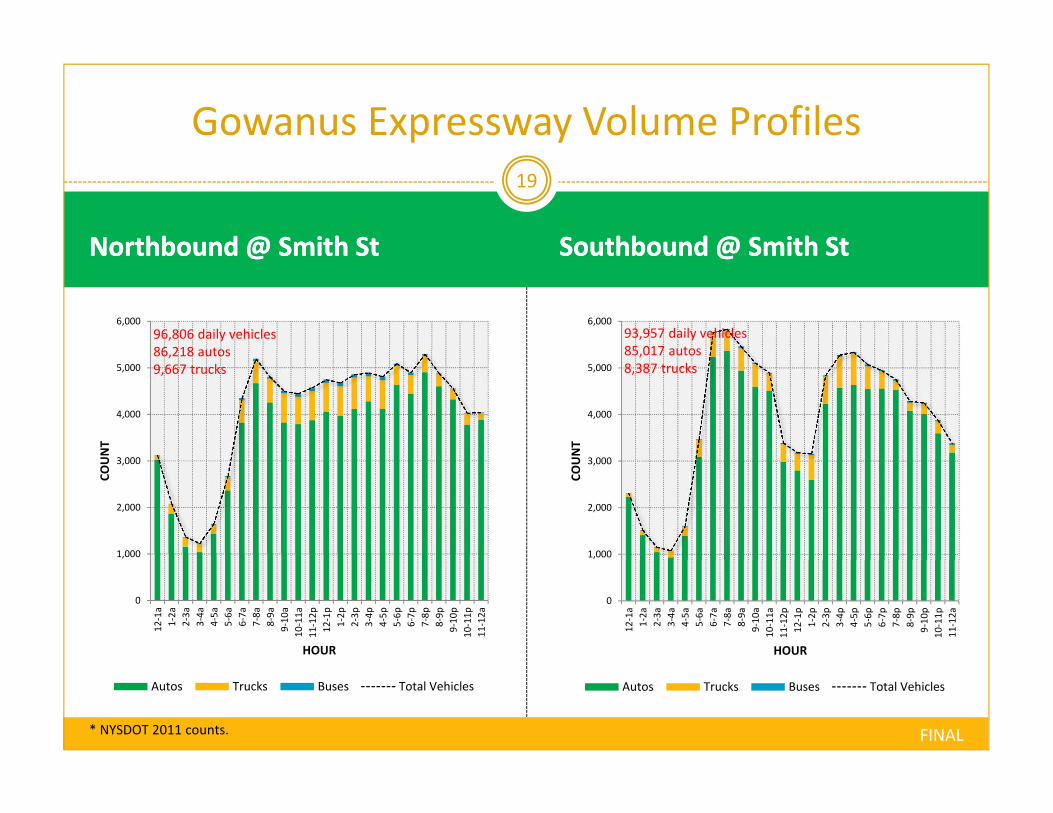
Gowanus Expressway Volume Profiles
* NYSDOT 2011 counts.
96,806 daily vehicles86,218 autos9,667 trucks
93,957 daily vehicles85,017 autos8,387 trucks

AutosAutos TrucksTrucks
FINAL
40% of autos use the VNB
8% of autos are from NJ to NYC destinations; 4% go to MN
31% of autos are from SI; 14% to MN, 9% to QN, 6% to BK
58% of autos are from BK; 19% to BX, 14% to MN, 5% to QN, 15% within BK
2% of autos are from NJ to LI
84% of autos are intra‐NYC trips
17% of autos go to the Brooklyn Bridge
10% of autos go to the Manhattan Bridge
29% of autos continue north on the BQE past the Sands St
5% exit to Atlantic Avenue
4% exit to Cadman Plaza W
30% of autos go to the BBT
64% of trucks use the VNB
26% of trucks are from NJ and points west; 14% are to NYC, 12% are to LI
38% of trucks are from SI; 1% to BX, 6% to MN, 14% to QN, 9% to BK
60% of trucks are intra‐NYC trips
7% of trucks go to the Manhattan Bridge
59% of trucks continue north on the BQE past Sands St
13% exit to Atlantic Avenue
4% exit to Cadman Plaza W
10% of trucks go to the BBT
20
Gowanus @ Smith St | Northbound | Morning

AutosAutos TrucksTrucks
FINAL
28% of autos use the VNB
33% of autos are from MN; 18% to BK, 13% to SI, 1% to QN
32% of autos are from BK
26% are intra‐Brooklyn trips
94% of autos are intra‐NYC trips
19% of autos come from the Brooklyn Bridge
6% of autos come from the Manhattan Bridge
35% of autos come from the BQE north of Sands St
37% of autos split off to the Prospect Expressway
15% of autos exit before the Belt Parkway split
12% of trucks use the VNB
53% of trucks are from MN; 45% to BK, 8% to SI
35% of trucks are from BK
32% are intra‐Brooklyn trips
97% of trucks are intra‐NYC trips
21% of trucks come from the Manhattan Bridge
35% of trucks come from the BQE north of Sands St
33% of trucks split off to the Prospect Expressway
37% of trucks exit before the Belt Parkway split
21
Gowanus @ Smith St | Southbound | Evening

FINAL
22
Brooklyn‐Queens ExpresswaySection at Vanderbilt Avenue

Northbound @ Vanderbilt AvNorthbound @ Vanderbilt Av Southbound @ Vanderbilt AvSouthbound @ Vanderbilt Av
FINAL
23
Brooklyn‐Queens Expressway Volume Profiles
* NYSDOT 2011 counts.
0
1,000
2,000
3,000
4,000
5,000
6,000
12‐1a
1‐2a
2‐3a
3‐4a
4‐5a
5‐6a
6‐7a
7‐8a
8‐9a
9‐10
a10
‐11a
11‐12p
12‐1p
1‐2p
2‐3p
3‐4p
4‐5p
5‐6p
6‐7p
7‐8p
8‐9p
9‐10
p10
‐11p
11‐12a
COUNT
HOUR
Autos Trucks Buses Total Vehicles
0
1,000
2,000
3,000
4,000
5,000
6,000
12‐1a
1‐2a
2‐3a
3‐4a
4‐5a
5‐6a
6‐7a
7‐8a
8‐9a
9‐10
a10
‐11a
11‐12p
12‐1p
1‐2p
2‐3p
3‐4p
4‐5p
5‐6p
6‐7p
7‐8p
8‐9p
9‐10
p10
‐11p
11‐12a
COUNT
HOUR
Autos Trucks Buses Total Vehicles
68,546 daily vehicles63,257 autos4,890 trucks
63,714 daily vehicles57,183 autos6,090 trucks

AutosAutos TrucksTrucks
FINAL
8% of autos use the VNB
49% of autos are from QN; 28% to MN, 14% to BK, 3% to SI, 4%
to NJ and points west
13% of autos are from LI; 9% to BK, 4% to MN
38% of autos are from BK
33% are intra‐Brooklyn trips
82% of autos are intra‐NYC trips
28% exit to Tillary Street
25% exit to Old Fulton Street
4% exit to Columbia Street
5% of trucks use the VNB
14% of trucks are from MN; 13% to BK, 1% to SI
37% of trucks are from QN; 30% to BK, the rest to NJ and
points west
34% of trucks are from BK
27% are intra‐Brooklyn trips
79% of trucks are intra‐NYC trips
47% exit to Tillary Street
10% exit to Old Fulton Street
6% exit to Columbia Street
24
BQE @ Vanderbilt Av | Southbound | Morning

AutosAutos TrucksTrucks
FINAL
12% of autos use the VNB
6% of autos are from NJ to NYC destinations; 5% go to QN, 1% to BK
6% of autos are from SI; 4% to QN, 2% to BK
57% of autos are from BK; 17% to QN, 7% to LI, 33% within BK
1% of autos are from NJ to LI
80% of autos are intra‐NYC trips
29% of autos on the section are from MN (using the Brooklyn and Manhattan Bridges), with 24% to QN and 4% to LI, the rest to BK
4% entered the BQE at Atlantic Avenue
23% entered the BQE at Sands Street
27% entered the BQE at Tillary Street
29% of trucks use the VNB
13% of trucks are from NJ and points west; 6% are to NYC, 7% are to LI
18% of trucks are from SI; 1% to BX, 9% to QN, 3% to BK, 5% to LI
69% of trucks are intra‐NYC trips
23% of trucks on the section are from MN (using the Manhattan Bridge), with 11% to QN and 11% to LI, the rest to BK
4% entered the BQE at Atlantic Avenue
21% entered the BQE at Sands Street
29% entered the BQE at Tillary Street
25
BQE @ Vanderbilt Av | Northbound | Evening


