What explains voters’ negative attitudes toward immigration? Self-interested voters care about their
personal economic and social circumstances. Sociotropic voters display in-group bias and perceive
migrants as threats to their customs and culture. We study the electoral effects of forced internal and
international migration in Colombia to provide evidence on the relative importance of these two
hypotheses. We exploit the fact that migrants disproportionally locate in places with earlier
settlements of people from their place of origin. In line with the sociotropic hypothesis, we find that
only international migration inflows increase political participation and shift votes from left- to right-
wing ideologies. Also consistent with the sociotropic hypothesis, we show that these results are not
accounted for by the observed changes caused by migration inflows on socioeconomic variables.
JEL Classification: D72, F2, O15, R23.
Keywords: immigration, electoral outcomes, political economy.
ACKNOWLEDGEMENTS AND FINANCIAL DISCLOSURE
We thank participants of the conferences on the Empirical Studies of Conflict at UC San Diego, the
RIDGE/LACEA-PEG workshop on Political Economy at Medellín, the Impacts of Refugees in
Hosting Economies at USC, the Pacific Development Meeting at USC, and applied economic
seminars at the Inter -American Development Bank, University of Southern California, Universidad
del Rosario, and Universidad de los Andes for thoughtful suggestions. We would also like to thank
Ana Maria Mayda, Jean-Francois Maystadt, Katherine Casey, Ana Maria Ibáñez, Leopoldo Ferguson,
Isabel Ruiz, Dorothy Kronick, Micaela Sviastchi, Luis Roberto Martínez, Austin Wright, Jacob
Shapiro, John Matsusaka, and Odilon Camara for useful suggestions. We are also grateful to thank
Maria José Urbina for her excellent job as a research assistant.
“The fear of immigration is poisoning Western politics. Donald Trump owes his job to it. Brexit
would not be happening without it. Strident nationalists wield power in Italy, Hungary, Poland,
and Austria, and have gained influence elsewhere.” The Economist1
I Introduction
A growing stream of studies has documented a strong correlation between migration inflows and
voter’s antipathy toward pro-migrant political views.2 However, there is an ongoing debate on the
mechanisms driving these effects. Studies grounded in political economy suggests that voters pe-
nalize politicians who are more welcoming to migrants if the latter displace local labor, depress
wages, or engage in criminal behavior, and thus threaten their personal socioeconomic well-being.3
This hypothesis is called the self-interest motive, as defined by Hainmueller and Hopkins (2014).
Other literature grounded in political social-psychology, state that voter’s antipathy toward immi-
gration is driven by group-related concerns about the cultural impacts of migrants, due to factors
such as race, religion, language, nationality, or social norms.4 This hypothesis is known as the
sociotropic motive.5
We study the relative empirical support of the self-interest and socio-tropic hypotheses by ex-
ploiting a unique natural experiment that took place in Colombia between 1994 and 2018. During
1Last accessed August 30, 2018, from: https://www.economist.com/leaders/2018/08/25/the-way-forward-on-immigration-to-the-west?cid1=cust/ednew/n/bl/n/2018/08/23n/owned/n/n/nwl/n/n/LA/146317/n.
2Examples of these studies include Gerdes and Wadensjo (2008); Otto and Steinhardt (2014); Mendez and Cutillas(2014); Barone et al. (2016); Harmon (2017); Halla et al. (2017); Dustmann et al. (2019). Current examples includethe rise in support for the anti-immigration Swedish Democrats, which increased their vote share in the parliamentaryelections of September 2018 by 5 percentage points relative to the 2014 elections, giving them 18% of the seats inthe Riksdag. Over the past few years, right-wing parties have also seen their vote share increase significantly in otherparts of Europe, including Italy, Poland, and Germany.
3See Scheve and Slaughter (2001); Mayda (2006); Dustmann and Preston (2006); Hanson et al. (2007); Facchiniand Mayda (2009); Malhotra et al. (2013) for examples.
4A few notable examples include Citrin et al. (1997); Sniderman et al. (2004); Card et al. (2012); Tingley (2012).5These hypotheses need not be mutually exclusive and can complement each other. A migration shock that de-
presses local conditions can upset voters if migrants are perceived as “different.” In contrast, a migration shock thatstimulates local material conditions may not translate into higher electoral support for the incumbent if migrantscannot easily mingle with the host population. Empirically disentangling the relative contribution of each of thesemechanisms is consequently challenging.
2
this period, Colombia experienced two different large migration waves. On the one hand, the in-
tensification of the internal armed conflict resulted in nearly 10 percent of the country’s population
being forcefully displaced within the country.6 On the other hand, economic depression, political
turmoil, and a surge of criminal violence in neighboring Venezuela induced a large migration wave
to Colombia. According to Colombian migration authorities by 2018 the number of registered
Venezuelans in Colombia was over 1.3 million.7 Because they are driven by crises, both migration
shocks disproportionately feature poor, vulnerable, and uneducated households that flee conflict or
political turmoil without much previous planning or preparation.8
If the self-interest hypothesis is valid, we should observe that the voter’s response to migra-
tion shocks is mediated by how migrants impact the socioeconomic conditions of the receiving
community. If the sociotropic hypothesis has empirical leverage, we should see voters responding
to international migration more than to internal migration, assuming that foreigners are perceived
as part of an out-group relative to co-nationals from other municipalities. This is valid if internal
migrants are likely to be perceived more positively by local voters as they share common char-
acteristics such as nationality and culture. In contrast, international migrants may be more easily
perceived as potential threats to cultural and social norms.9
We assess the effects of migration in voting behavior using longitudinal data at the municipal
level in Colombia between 1994 and 2018.10 Since migrants choose their arrival municipalities and
their choices may be correlated with voting behavior inside those areas, we cannot simply compare
differences in electoral outcomes across municipalities with higher and lower migration inflows.
Consequently, we exploit the fact that crisis-induced migrants tend to move disproportionately
to municipalities where they have networks that were formed before the beginning of the crises.
6See Dube and Vargas, 2013 and Rozo, 2018 for a detailed description of the Colombian internal conflict.7The actual figure is likely higher as registration is not enforced and a large share of migrants may actively avoid
it and work in the informal sector.8This does not preclude the existence of relatively wealthy migrants, who flee from crisis-origin locations to save
their assets. But this type of migrant does not constitute a majority.9This is a relative statement. Colombia and Venezuela share a language as well as a number of other traits due,
among other reasons, to their common colonial heritage. All we need to make our argument, however, is that localvoters perceive Venezuelan migrants as an out-group, relative to how they perceive other Colombians.
10Colombia’s roughly 1,100 municipalities are equivalent to U.S. counties.
3
In particular, we leverage identification from two sources of exogenous variation in crisis-driven
migration inflows at the municipality-year level. Municipal variation comes from the share of
population within each receiving municipality that was born in expulsion regions and arrived before
the crisis began. Annual variation comes from the number of individuals leaving each municipality
(in the case of the internally displaced population) or arriving to Colombia from Venezuela, as the
crises worsened. We interact these two sources of variation to create our predicted migrant inflows
measure.
Our main identification assumption is that predicted migration inflows affect voting behavior
only through actual migration and not through any other channel after controlling for a flexible set
of municipal-level characterictics. First, because our estimates include fixed effects by municipal-
ity and year, they are not confounded by time-invariant differences across municipalities nor by
annual aggregate shocks. Second, since the pre-existing networks of migrants coming from expul-
sion regions might be larger in places with specific characteristics that might have evolved over
time in a way correlated with future electoral behavior, we include interactions between year dum-
mies and a large set pre-migration shock municipal covariates. They include variables related to
the incidence of conflict and violence, the magnitude of local and national public expenditures, the
number of public institutions, poverty, inequality, labor market conditions, and economic growth.
Third, we control for full interactions between department and year indicators in all our estimates.
The inclusion of these controls is important as identification relies on the exogeneity of the
early settlements, an equivalence that is shown by Goldsmith-Pinkham et al. (2019) for the general
case of Bartik instruments. Even when the share of early migrants is not exogenous, Borusyak et al.
(2018) show that identification can be achieved if the aggregate shocks are as good as random, a
condition that is satisfied when: i) one controls by observable municipal characteristics weighted
by shock exposure and ii) there is a large number of observed shocks per period and a large number
of periods. We meet these criteria.11
11One additional recent criticism to the validity of using early migrants networks to study the impacts of migrationin that is settings in which migration flows to specific locations are stable over time one cannot disentangle the short-and long-term causal effects of migration (Jaeger et al., 2018). Our empirical strategy is not sensitive to this threat
4
Our analysis is structured in two parts. First, we examine the effects of migration inflows on
political participation and the support of right-, center-, and left-wing ideologies in the presiden-
tial (first- and second-round) and the mayoral elections in Colombia. We find that only interna-
Venezuelan inflows result in higher political participation in the first and second round presidential
elections. The point estimates suggest that when Venezuelan municipal predicted inflows increase
by one standard deviation turnout increases by approximately 1.6 and 0.98 percentage points in the
first and second presidential elections, respectively.
We also find that only larger inflows of international migration affect the composition of pres-
idential votes from left- to right-wing political ideologies. We find that a one-standard-deviation
increase in the predicted inflow of Venezuelan migrants reduces the share of votes for left-wing
political ideologies by 0.8 percentage points and increase the share of votes for right-wing ideolo-
gies by exactly the same amount in the first round elections. Considering that the mean support for
left-wing ideologies was approximately 10 percent during the first round presidential elections, a
reduction of 0.8 percentage points represents a substantial impact. When looking at the mayoral
elections, nonetheless, we only find evidence supporting the fact that larger inflows of Venezuelan
immigration result in higher political participation in the form of electoral turnout.
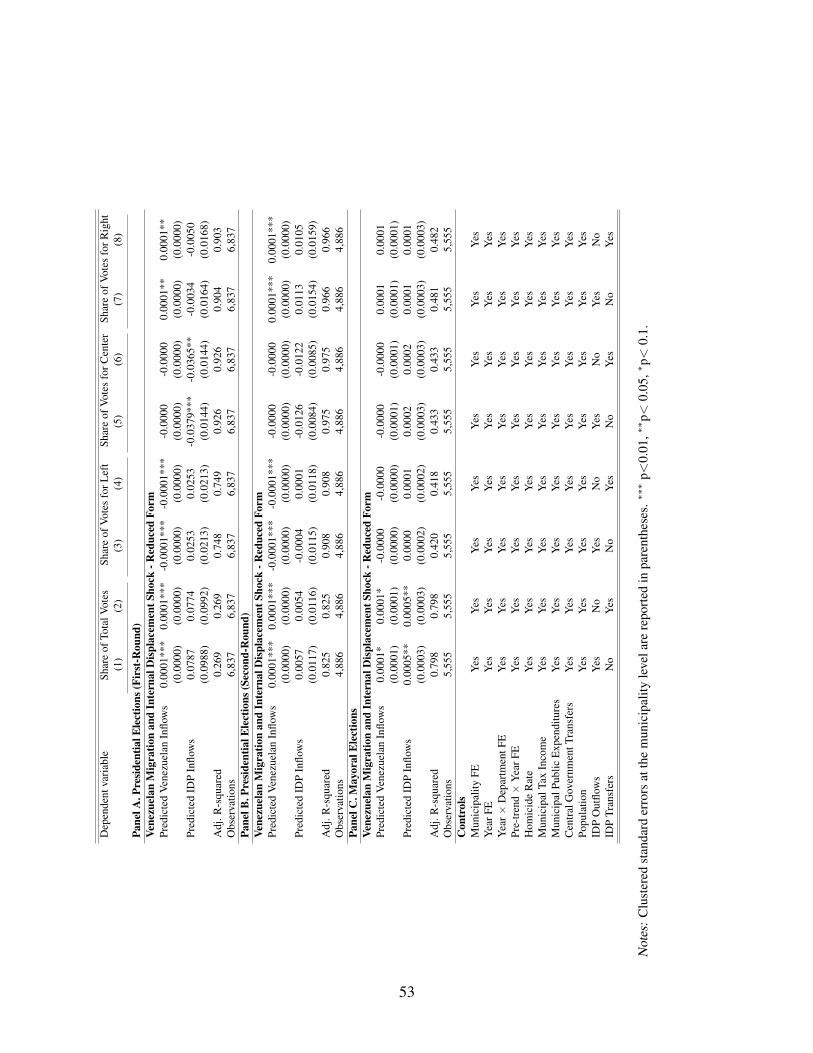
In a second stage, we test the validity of the self-interest motive mechanism. We do so by
exploring whether the observed effects of migration inflows on political outcomes change when
adding controls for contemporary variables that may have been affected by the migration flows
and that are correlated with the socioeconomic conditions of receiving communities. These in-
clude violent crime, local and central government expenditures and income, population outflows,
and transfers from the central government to internally displaced people. When we include these
variables as controls in our baseline estimates, we do not see any changes in our core results.12
because the inflows of crisis-driven migrants are not stable in time, they are sudden and large in scale as a consequenceof the intensification of the internal and the Venezuelan crises.
12These are arguably ‘bad controls’ (Angrist and Pischke, 2009) because they are likely affected by the migrationshock. We however include them purposefully to investigate the extent to which these controls absorbe (part of) theeffect of migration on electoral outcomes.
5
Additionally, recall that we also include interactions of year dummies and pre-trend municipal
characteristics and so we discard the possibility that differences in these dimensions between mu-
nicipalities may be driving our main results. Consequently, we do not find evidence supporting the
validity of the self-interest hypothesis.
Overall, we find that only international forced migration induces changes in voting behavior.
Since Venezuelan migrants may be perceived more as outsiders relative to internally displaced
Colombians, we do not find support for the validity of the self-interest hypothesis. Instead, our
results support the validity of the socio-tropic hypothesis. However, it is also possible that the
effects of Venezuelan migration on voting composition are explained by what we call electoral po-
larization, to describe the possibility that, pushed by the campaigning strategy of specific political
parties, voters associate left-wing political ideologies with the current Venezuelan regime and they
reduce their support for the left as a consequence of their fear of becoming like Venezuela. Al-
though no municipal data is available to formally test this alternative mechanism, recent national
perception surveys do point toward and increasing worry of Colombians with the possibility of a
Venezuela-nization of the country. Therefore, with the available information we cannot disentangle
the socio-tropic and electoral polarization channels.
Lastly, we examine whether municipalities that hosted different levels of IDP react heteroge-
neously to Venezuelan forced migration. We find that although all municipalities respond to larger
Venezuelan migration by increasing political participation, only those municipalities that had been
less exposed to IDP migration experience a change in the composition of votes from left- to right-
wing political ideologies. This result also supports the validity of the socio-tropic hypothesis as
it suggests that individuals who have been less exposed to relative cultural diversity show more
antipathy toward migrants.
This paper contributes to the study of the effects of migration on political outcomes. Most
of the work in this area has focused on studying the effects of voluntary migrants in developed
countries (see Gerdes and Wadensjo, 2008; Otto and Steinhardt, 2014; Barone et al., 2016; Mayda
6
et al., 2016; Harmon, 2017; Halla et al., 2017 for examples). Our contribution to this literature is
two-fold. First, we study the effects of forced, crisis-induced migrants within a developing country.
Forced migrants arrive in large numbers and are often traumatized by conflict, economic turmoil,
crime victimization, or political persecution. They typically arrive with little economic means, and
face large levels of uncertainty regarding the duration of their stay. As such, their impact on host
economies may be vastly different than that of economic migrants arriving in developed countries.
Additionally, developing countries host the bulk of forced migration in the world and have lower
resources to attend these populations. This suggests that the effects of forced migration in these
countries may be larger than what has been estimated for developed countries. Second, our set
up allows us to disentangle the relative empirical relevance of the self-interest and sociotropic
mechanisms in mediating the electoral effects of migration.
The article that comes closest to our study is Dustmann and Preston (2006) who study the
effects of refugee migration on voting outcomes in Denmark. In line with our study the authors
find that the allocation of a larger share of refugees leads to an increase on the vote share of
right-leaning parties with an anti-immigration agenda. Our study adds to their contribution by
contrasting the validity of the self-interest and sociotropic motive hypotheses inside a developing
country. This is done by comparing the effects of internal and international migration on voting
behavior.
The rest of the paper is organized as follows. Section II provides some context on the two
migration shocks that we analyze. Section III describes the sources of information we use to test the
effect of different migration shocks on electoral outcomes and the mechanisms that may potentially
explain them. Section IV discusses the empirical strategy used to identify the causal effect of
migration shocks on voting behavior as well as several robustness tests. Section V summarizes the
main results. Section VI explores the validity of the mechanisms driving our results. Finally, the
last section concludes.
7
II Forced Migrants in Colombia
We study the political effects of internal forced migration as well as those of international migration
originating in Venezuela and caused by that country’s economic and political turmoil. Because
both migration waves were induced by crises, they are characterized by large inflows of poorly
educated and young individuals whose primary destinations are the major urban areas in Colombia.
II.1 Internal forced displacement
Colombia’s internal armed conflict originated with the formation of the left-wing guerrilla organi-
zations FARC and ELN in the mid-1960s. The conflict was a Cold War proxy war until the end of
the 1980s. Yet, it escalated during the 1990s, fueled by the involvement of the guerrillas in illegal
drug trafficking and the consolidation of right-wing paramilitary groups, who effectively became
a third force in the conflict when splintered paramilitary armies colluded under an umbrella or-
ganization (the AUC). The escalation of the conflict was the main driver of the internal forced
displacement witnessed in Colombia in the late 1990s and the early 2000s.13
Data from Colombia’s Victims’ Registry—which consolidates information on forced displace-
ment and other forms of victimization obtained from local, national, public, and private institutions—
suggests that the population of forced migrants is balanced in terms of gender (51 percent women)
and disproportionally young. In particular, 39 percent of forcefully displaced individuals were
15 years old or younger at the time of displacement, an age group that represents 28 percent of
Colombia’s population. Survey-based evidence suggests that displaced individuals have low ed-
ucation levels (on average around 5 years of education) and that most of them are poor (Ibanez
and Moya, 2006; Garay, 2008; Carrillo, 2009). Moreover, because displacement originates mostly
in rural areas, the main economic activity prior to the displacement of most victims is agriculture
(Ibanez and Moya, 2006; Carrillo, 2009).
13see Engel and Ibanez, 2007; Dube and Vargas, 2013; Rozo, 2018 for detailed descriptions of the Colombianconflict.
8
Importantly, for our identification strategy, it has been documented that forced migrants in
Colombia largely move to areas where they have friends or relatives, and that are relatively close in
distance to their municipalities of origin (Ibanez and Moya, 2006; Carrillo, 2009; Lozano-Gracia
et al., 2010).14 Internal migrants also value the provision of public goods when choosing their
destination (Carrillo, 2009; Lozano-Gracia et al., 2010).
II.2 International migration from Venezuela
The beginning of the Venezuelan political crisis can be traced back to the election of Hugo Chavez
as president on December 6, 1998. Chavez’ socialist regime was characterized by constitutional
amendments, land expropriations, the implementation of populist social programs, nationaliza-
tions, and restrictions on private businesses (Crasto and Alvarez, 2017). These policies were con-
tinued by Nicolas Maduro, who was elected president of Venezuela in 2013. Maduro’s regime has
dramatically worsened the economic and social crisis in Venezuela. Shortages of food and basic
necessities became extremely common, and looting began to occur systematically throughout the
country (Revista Semana, 2017). Moreover, insecurity became endemic, repression of the opposi-
tion became common, and systematic human rights violations by public authorities were repeatedly
reported by the international media (see El Nuevo Herald, 2014; BBC News, 2017; BBC, 2016).
This situation triggered large waves of out-migration by Venezuelans, who most often moved to
neighboring Colombia.
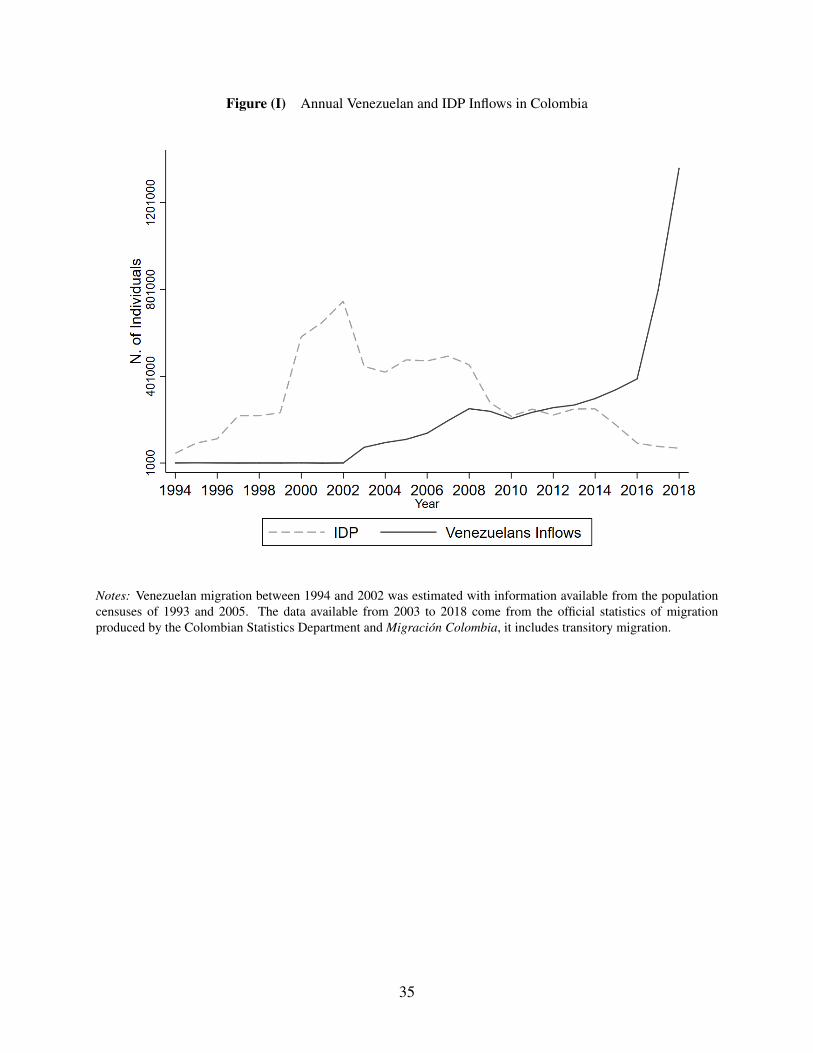
Figure I shows the annual evolution of the total number of registered Venezuelan migrants
entering Colombia between 1995 and 2018, as recorded at the different migration points estab-
lished by the Colombian government. According to the official statistics, Venezuelan migration
increased five-fold during this period, as the humanitarian crisis caused by Chavez and Maduro’s
regimes worsened.
14In regions facing extreme violence, however, individuals prefer to migrate to more distant locations and to rel-atively large cities. This is because of the sense of anonymity provided by urban areas located far from where thevictimization episode occurred (Carrillo, 2009; Lozano-Gracia et al., 2010).
9
Initially, Venezuelan migrants consisted mainly of wealthy Venezuelans and entrepreneurs who
came to invest in Colombia and fled to save their capital from expropriations and from high infla-
tion (Revista Semana, 2017; Crasto and Alvarez, 2017). As the crisis intensified, however, the core
of Venezuelan migration shifted to the poorly educated population who report fleeing to Colombia
to escape violent crime, political repression, and to look for basic necessities for survival (NPR,
2018). Indeed, according to recent characterizations of Venezuelan migrants based on the Colom-
bian household surveys of 2015 and 2016, over 80 percent of registered migrants have not com-
pleted a high school education, at least half are 25 years old or less, and they are balanced in terms
of gender (see OLR, 2017).
III Data
III.1 Crises-driven displacement
We employ two sources of information on forced displacement. Data on internal forced displace-
ment come from Colombia’s Victims’ Registry (known by its Spanish acronym, RUV), which reg-
isters the number of individuals displaced as a consequence of the armed conflict. The RUV data
includes information collected in the past by both private and public institutions, and the database
is updated continuously with the aim of being a census of conflict victims who are eligible for
reparations and assistance under Law 1448 of 2011 (known informally as the Victims’ Law). The
RUV is the best source of information on the victims of Colombia’s armed conflict. While its
coverage begins in 1985, in this article we focus on the period between 1994 and 2018 because of
the availability of data on political outcomes during that period.
Data on the total number of Venezuelans arriving annually in Colombia is available through
the Colombian Statistics Department for the period 1994 to 2018. The information between 1994
and 2002 was constructed using the population censuses of 1993 and 2005 and corresponds to the
Venezuelan nationals that arrived to Colombia each year. The data from 2003 to 2018 come from
10
the information recorded at official migration points.
Figure I shows the aggregate IDP and Venezuelan migration inflows observed in Colombia
during our period of analysis.
III.2 Voting behavior
Data on voting behavior for each municipality come from Colombia’s electoral agency. We use
data on municipal-level electoral results in presidential and mayoral elections to study the effects
of forced migration on political participation, measured by the share of individuals who vote as a
share of voting-age population (18 years or older),15 and support for left-, center-, or right-wing
political ideologies. For each election, we classify all candidates according to their political party
into left-, right-, and center-oriented ideologies, following the methodology proposed by Fergusson
et al. (2017). Appendix A describes in detail the steps followed to classify each candidate.
III.2.1 Presidential elections
Our analysis of presidential elections focuses on the period 1994-2018, when there is information
available on the votes for all presidential candidates.16 Presidents are elected by majority rule.
If no candidate receives half plus 1 vote or more on election day, a run-off election between the
two candidates with the most votes in the first round takes place three weeks later. The winning
candidate governs for a 4-year period. We use information on the 6 first-round and 5 second-round
(run-off) elections that occurred between 1994 and 2018.15Municipal-level voting registries were not available for the entire sample period. They are available since 2002. If
we compare turnout using registered voters or the voting-age municipal population 1as the denominator for the period2002-2018 we observe a distribution that is extremely similar across measures. The difference is not statisticallysignificant.
16Prior to 1994 the Colombian Electoral Bureau only recorded the municipal votes of the winning candidate.
11
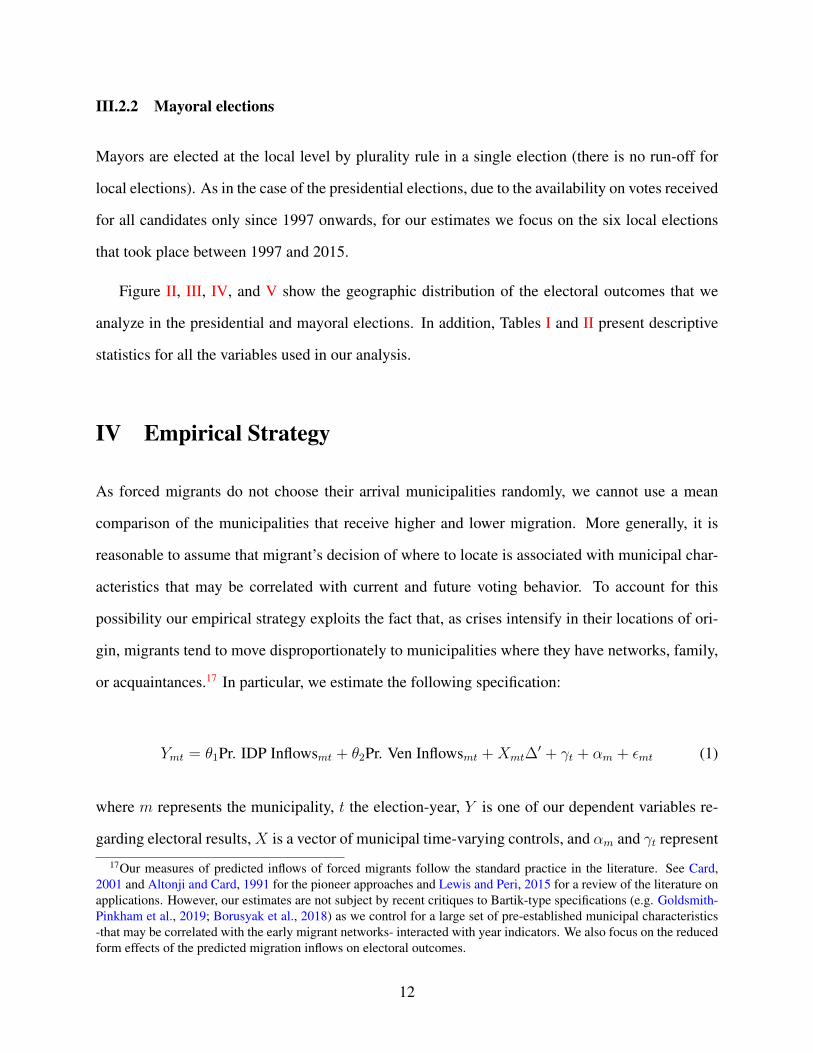
III.2.2 Mayoral elections
Mayors are elected at the local level by plurality rule in a single election (there is no run-off for
local elections). As in the case of the presidential elections, due to the availability on votes received
for all candidates only since 1997 onwards, for our estimates we focus on the six local elections
that took place between 1997 and 2015.
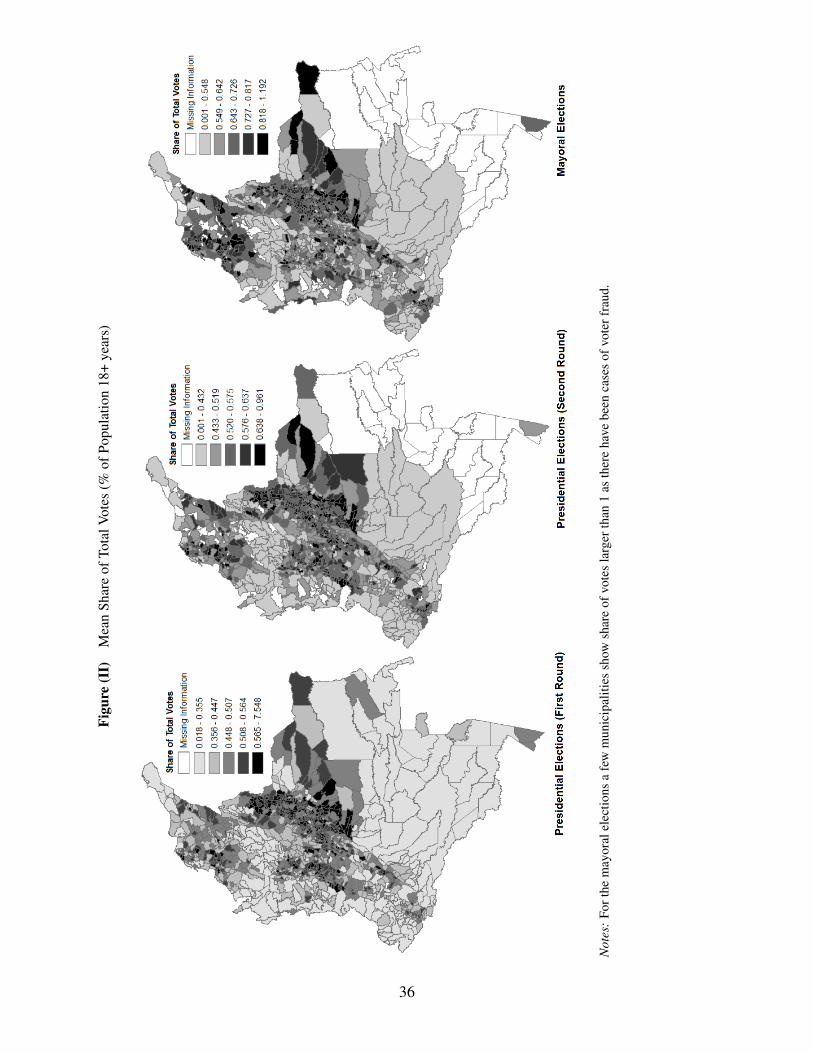
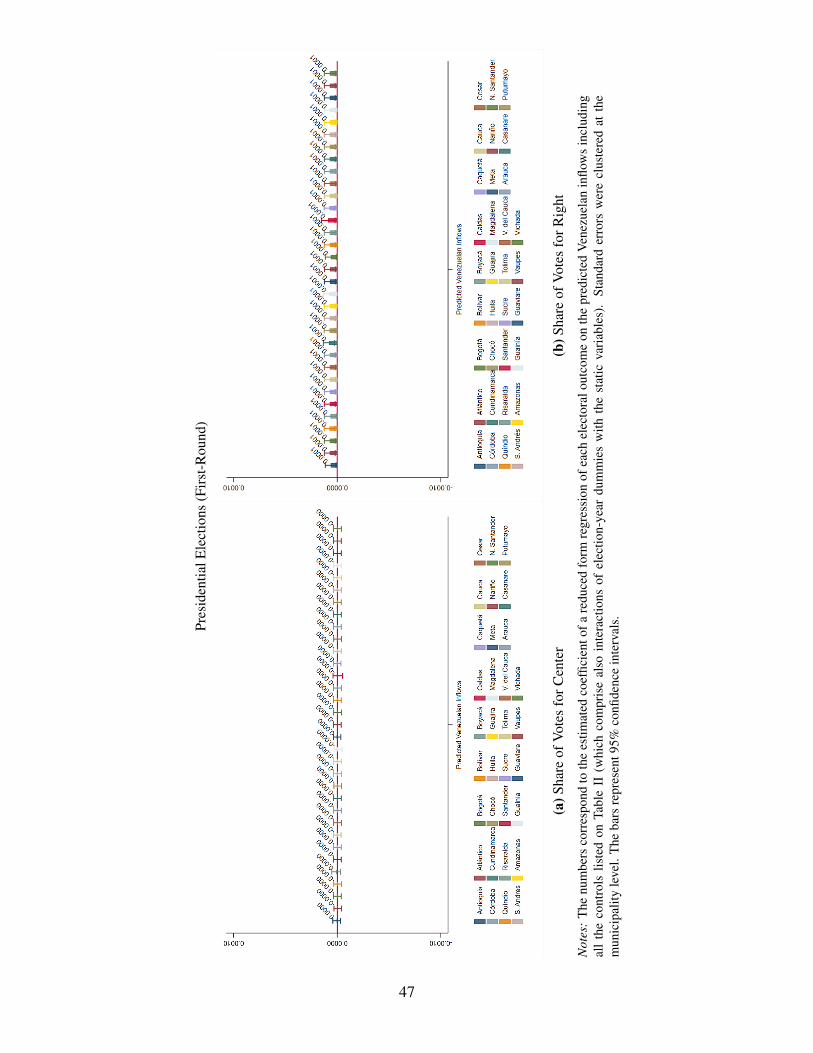
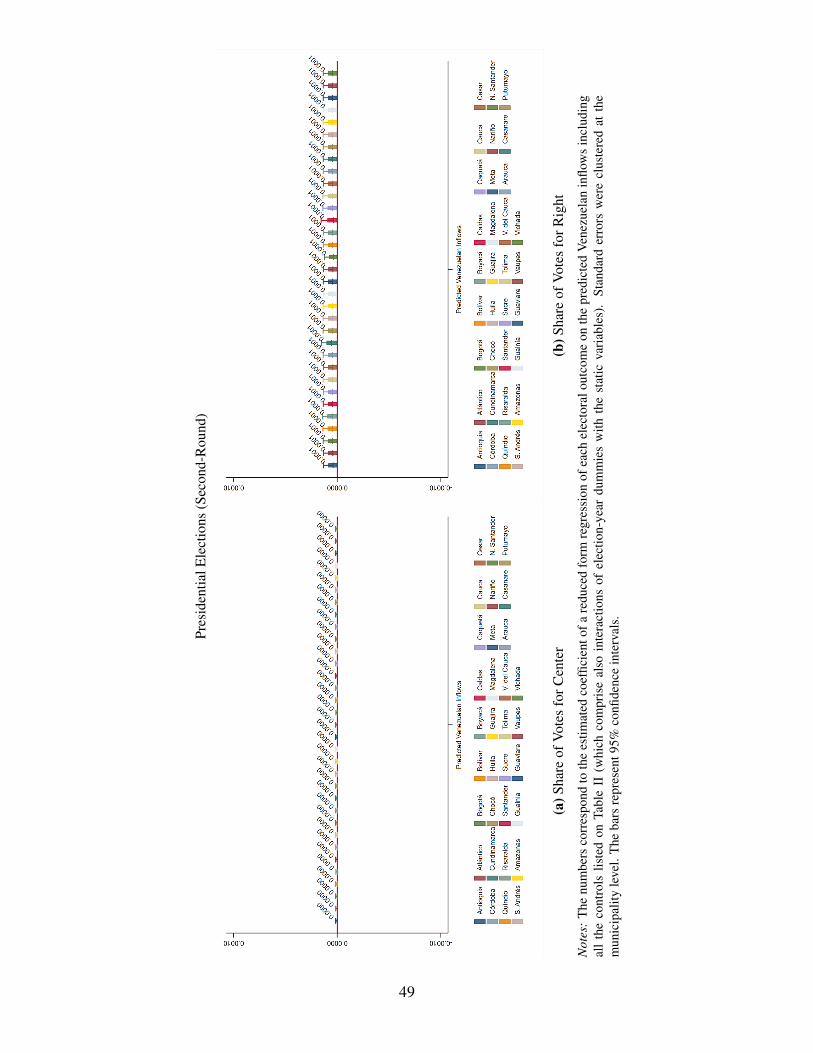
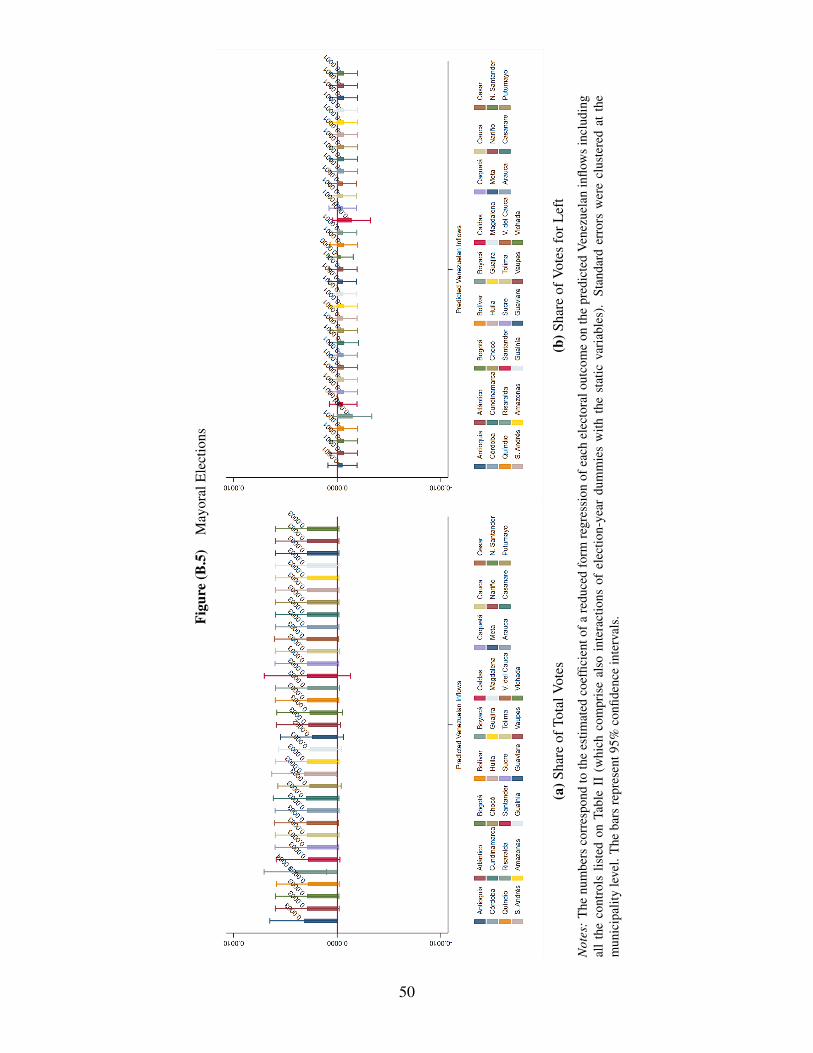
Figure II, III, IV, and V show the geographic distribution of the electoral outcomes that we
analyze in the presidential and mayoral elections. In addition, Tables I and II present descriptive
statistics for all the variables used in our analysis.
IV Empirical Strategy
As forced migrants do not choose their arrival municipalities randomly, we cannot use a mean
comparison of the municipalities that receive higher and lower migration. More generally, it is
reasonable to assume that migrant’s decision of where to locate is associated with municipal char-
acteristics that may be correlated with current and future voting behavior. To account for this
possibility our empirical strategy exploits the fact that, as crises intensify in their locations of ori-
gin, migrants tend to move disproportionately to municipalities where they have networks, family,
or acquaintances.17 In particular, we estimate the following specification:
where m represents the municipality, t the election-year, Y is one of our dependent variables re-
garding electoral results,X is a vector of municipal time-varying controls, and αm and γt represent
17Our measures of predicted inflows of forced migrants follow the standard practice in the literature. See Card,2001 and Altonji and Card, 1991 for the pioneer approaches and Lewis and Peri, 2015 for a review of the literature onapplications. However, our estimates are not subject by recent critiques to Bartik-type specifications (e.g. Goldsmith-Pinkham et al., 2019; Borusyak et al., 2018) as we control for a large set of pre-established municipal characteristics-that may be correlated with the early migrant networks- interacted with year indicators. We also focus on the reducedform effects of the predicted migration inflows on electoral outcomes.
12
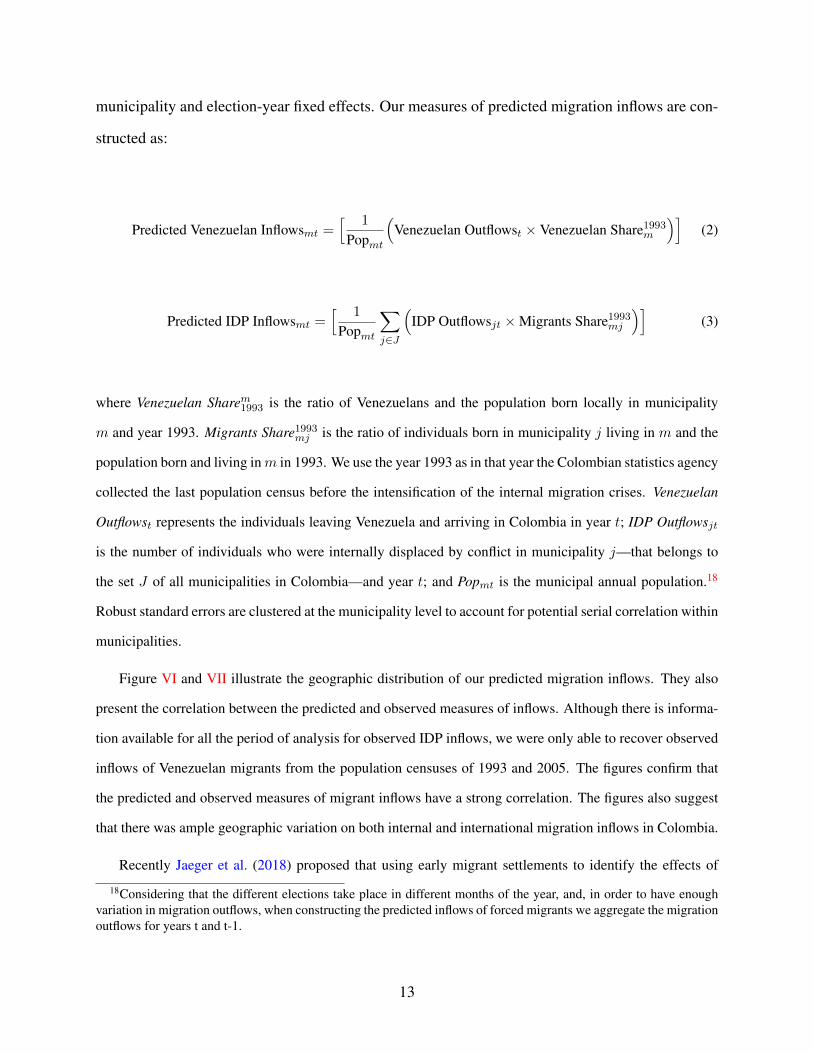
municipality and election-year fixed effects. Our measures of predicted migration inflows are con-
structed as:
Predicted Venezuelan Inflowsmt =[ 1
Popmt
(Venezuelan Outflowst × Venezuelan Share1993m
)](2)
Predicted IDP Inflowsmt =[ 1
Popmt
∑j∈J
(IDP Outflowsjt ×Migrants Share1993mj
)](3)
where Venezuelan Sharem1993 is the ratio of Venezuelans and the population born locally in municipality
m and year 1993. Migrants Share1993mj is the ratio of individuals born in municipality j living in m and the
population born and living in m in 1993. We use the year 1993 as in that year the Colombian statistics agency
collected the last population census before the intensification of the internal migration crises. Venezuelan
Outflowst represents the individuals leaving Venezuela and arriving in Colombia in year t; IDP Outflowsjt
is the number of individuals who were internally displaced by conflict in municipality j—that belongs to
the set J of all municipalities in Colombia—and year t; and Popmt is the municipal annual population.18
Robust standard errors are clustered at the municipality level to account for potential serial correlation within
municipalities.
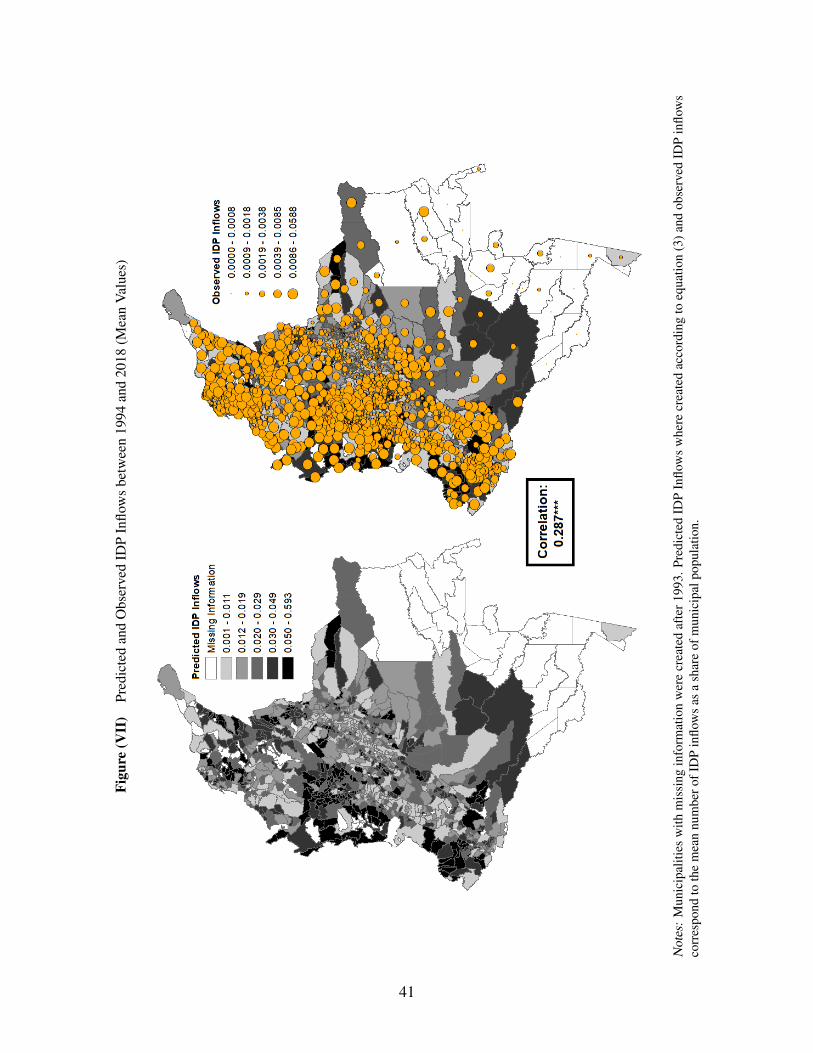
Figure VI and VII illustrate the geographic distribution of our predicted migration inflows. They also
present the correlation between the predicted and observed measures of inflows. Although there is informa-
tion available for all the period of analysis for observed IDP inflows, we were only able to recover observed
inflows of Venezuelan migrants from the population censuses of 1993 and 2005. The figures confirm that
the predicted and observed measures of migrant inflows have a strong correlation. The figures also suggest
that there was ample geographic variation on both internal and international migration inflows in Colombia.
Recently Jaeger et al. (2018) proposed that using early migrant settlements to identify the effects of
18Considering that the different elections take place in different months of the year, and, in order to have enoughvariation in migration outflows, when constructing the predicted inflows of forced migrants we aggregate the migrationoutflows for years t and t-1.
13
migration in hosting regions may confound its short- and long-term causal effects in countries where mi-
gration patters are consistently directed to the same areas and are stable in time. Our empirical strategy is
not sensitive to their critique because the inflows of internal and international migration were sudden and
dramatically large in scale after the intensification of the crises.
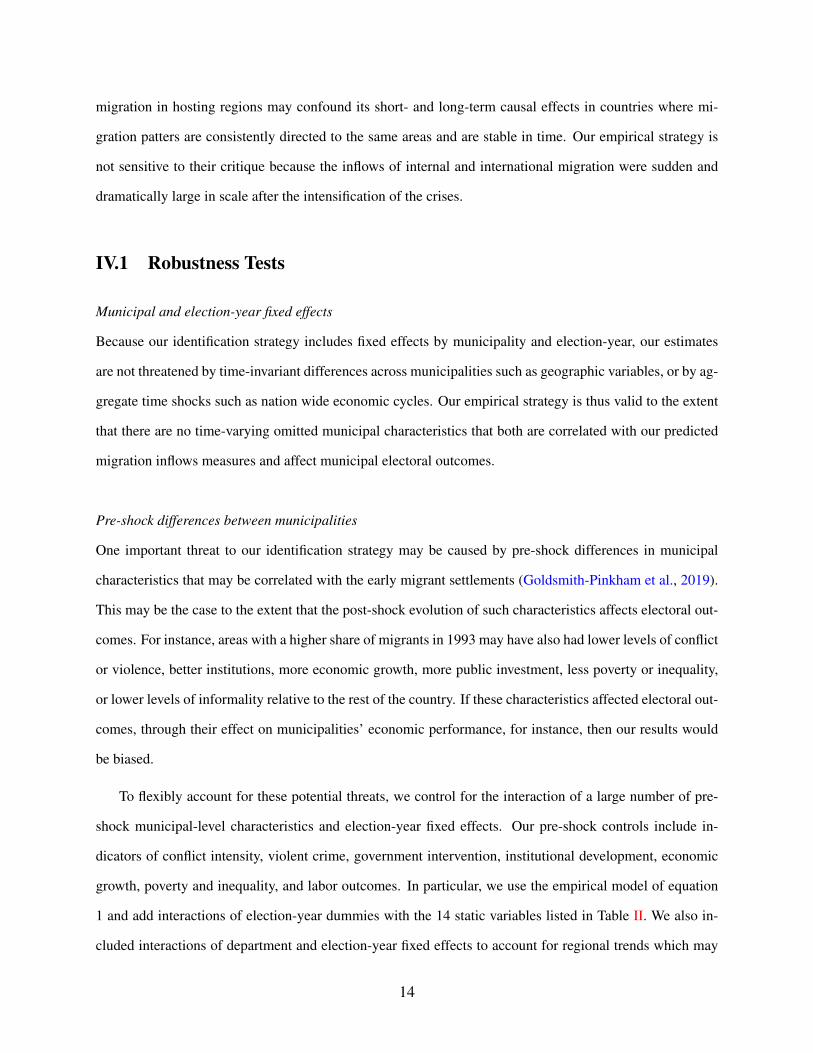
IV.1 Robustness Tests
Municipal and election-year fixed effects
Because our identification strategy includes fixed effects by municipality and election-year, our estimates
are not threatened by time-invariant differences across municipalities such as geographic variables, or by ag-
gregate time shocks such as nation wide economic cycles. Our empirical strategy is thus valid to the extent
that there are no time-varying omitted municipal characteristics that both are correlated with our predicted
migration inflows measures and affect municipal electoral outcomes.
Pre-shock differences between municipalities
One important threat to our identification strategy may be caused by pre-shock differences in municipal
characteristics that may be correlated with the early migrant settlements (Goldsmith-Pinkham et al., 2019).
This may be the case to the extent that the post-shock evolution of such characteristics affects electoral out-
comes. For instance, areas with a higher share of migrants in 1993 may have also had lower levels of conflict
or violence, better institutions, more economic growth, more public investment, less poverty or inequality,
or lower levels of informality relative to the rest of the country. If these characteristics affected electoral out-
comes, through their effect on municipalities’ economic performance, for instance, then our results would
be biased.
To flexibly account for these potential threats, we control for the interaction of a large number of pre-
shock municipal-level characteristics and election-year fixed effects. Our pre-shock controls include in-
dicators of conflict intensity, violent crime, government intervention, institutional development, economic
growth, poverty and inequality, and labor outcomes. In particular, we use the empirical model of equation
1 and add interactions of election-year dummies with the 14 static variables listed in Table II. We also in-
cluded interactions of department and election-year fixed effects to account for regional trends which may
14
be confounding our results.
Excluding bordering municipalities
Another possible threat to our identification strategy is that most of the variation that we use is driven by
Colombian municipalities that share a border with Venezuela where there are larger pre-settlements of the
Venezuelan population. These municipalities may be affected by the Venezuelan crisis not only through mi-
gration shocks, but also through lower trade with Venezuela or larger demand for basic consumption items
that are no longer available in Venezuela. These additional shocks may also be affecting voting behavior.
To test for this possibility, we run our estimates excluding from our sample each one of the 32 Colombian
departments at a time, to verify that our results where not driven by the high interactions of the Venezuelan
economy with some departments such as La Guajira and Norte de Santander (which comprise most of the
Venezuelan-Colombian border). Our results are robust to every one of the 32 sample restrictions (see Ap-
pendix B).
Using an alternative source of cross-sectional variation: distance to border-crossing locations
One alternative to computing our measure of Predicted Venezuelan Inflows is to interact the annual Venezue-
lan Outflows with the average distance from every municipality to each one of the border-crossing sites
between Colombia and Venezuela. Our results are robust of using this alternative source of shock expo-
sure, which by and large picks up the same variation as our baseline measure. The correlation between the
average distance to the bilateral border-crossing sites and the share of Venezuelan population in 1993 is 0.64.
Checking the validity of the 2SLS coefficients
As an additional robustness check, we use our Predicted IDP inflows measure to instrument the observed
yearly IDP inflows to each municipality. The identification assumption is that the predicted flows do not
influence electoral outcomes through any channel other than the actual forced migration. The results for
the first stage regression are reassuring across elections as they suggest that our predicted migration inflows
measure has a strong correlation with the actual observed number of individuals arriving in each munici-
pality (see panel F of Tables III, IV, and V). Unfortunately, the lack of available data on yearly arrivals of
Venezuelans to each municipality prevents us from estimating an equivalent instrumental variables specifi-
15
cation for the case of the effects of the Venezuelan migration shock on electoral results.
Cumulative Migration Inflows
In our main estimates, when constructing the predicted inflows of forced migrants, we aggregate the migra-
tion outflows for years t and t-1 considering that the different elections take place in different months of the
year. Consequently, in Appendix C we test whether our results change when accumulating the migration
outflows between elections (which includes roughly 4 years). Our results remain unchanged, which might
suggest that voters may be most sensitive to short-term migration inflows.
V Results
Presidential Elections
Our main results are presented in Tables III and IV. We find consistent and positive effects of Venezuelan
migration on political participation in the form of electoral turnout for the presidential elections. We also
find that larger inflows of Venezuelan migrants result in a re-composition of the number of votes from left-
to right-wing political ideologies. These results are robust across the first- and second-round presidential
elections (Tables III and IV, respectively) and to the inclusion of flexible trends parametrized in terms of
pre-shock municipal characteristics.
For the case of the internal displacement inflows, we do not distinguish a significant effect in any of
the outcomes that we study. It is worth noting that the lack of an effect in turnout in this case is consistent
with the anecdotal evidence that suggests that internally displaced populations in Colombia, while entitled
to vote, do not do so in practice. This is both because most internal migrants are below the voting age (see
section II.1) and because many of the adults lack formal identification documents which are required for
voting. This issue is so widespread that the provision of a cedula was included among the main benefits to
be distributed to conflict victims under the Victims’ Law by the Colombian government.19
The estimated effects of the migration shocks on electoral outcomes are economically meaningful. Fo-
cusing on Panel A and the specification that includes differential trends parametrized by pre-shock municipal
19If anything, there is weak evidence that turnout decreases in the run-off presidential election (Table IV) when nocontrols are included other than municipality fixed effects, year fixed effects and department trends (column 1).
16
characteristics (even columns), a one-standard-deviation increase in the predicted Venezuelan (IDP) migra-
tion inflow increases political participation in the first (second) round presidential elections by 1.6 (0.98)
percentage points. In turn, a one-standard-deviation increase in the predicted inflow of Venezuelan migrants
reduces the share of votes for left-wing political ideologies by 0.8 percentage points and increases the share
of votes for right-wing ideologies by exactly the same amount in the first round elections. Since the mean
support for left-wing ideologies was only 10 percent during the first round presidential elections, a reduction
of 0.8 percentage points in the support for left-wing political ideologies is substantial. The estimated coef-
ficients for the impacts of Venezuelan and IDP migration are also statistically different across all elections.20
Mayoral Elections
When we look at mayoral elections in Table V, we find weaker effects. Particularly, we only find evidence
supporting the fact that larger inflows of Venezuelan immigration result in higher political participation
(panel A). In particular, we observe that a one-standard-deviation increase in the predicted level of Venezue-
lan migration inflow causes an increase of 0.96 percentage points in political participation, an effects that is
remarkably similar to that found for the second-round presidential election. These results are robust to the
inclusion of controls and the estimation procedure, they are also not observed for IDP inflows. Although
the estimated coefficients of the effects of Venezuelan inflows on the left–, center-, and right-wing support
show similar signs relative to the presidential elections, it is plausible that they are not significant because
there are no mayoral elections after 2015, when the Venezuelan migration showed the largest increment. As
such, our mayoral elections sample has a lower variation on Venezuelan inflows than the one observed for
the presidential elections.
VI Mechanisms
Our results point to the existence of asymmetric effects of international and internal migration on electoral
outcomes. Particularly, only Venezuelan migration inflows result in higher political participation and a re-
composition of votes from left- to right-wing ideologies. In this section we explore the validity of plausible
mechanisms driving the asymmetric responses to migration inflows.
20We carried this test using the coefficient values, variances, and covariances obtained from Panel A across elections.
17
VI.1 Self-interest Motives
First, it is possible that the effect of migration shocks on the electoral behavior of host communities is
explained by self-interested voters, who react to the way migration affects their economic and social well-
being. This mechanism can be tested by examining how the estimated effect of migration shocks on electoral
outcomes changes when controlling for socio-economic variables that are likely to be affected by the shocks.
Large forced migration inflows, for example, may be associated with a disproportionate targeting of public
resources to support these populations, or with larger business profits as wages fall due to an increased
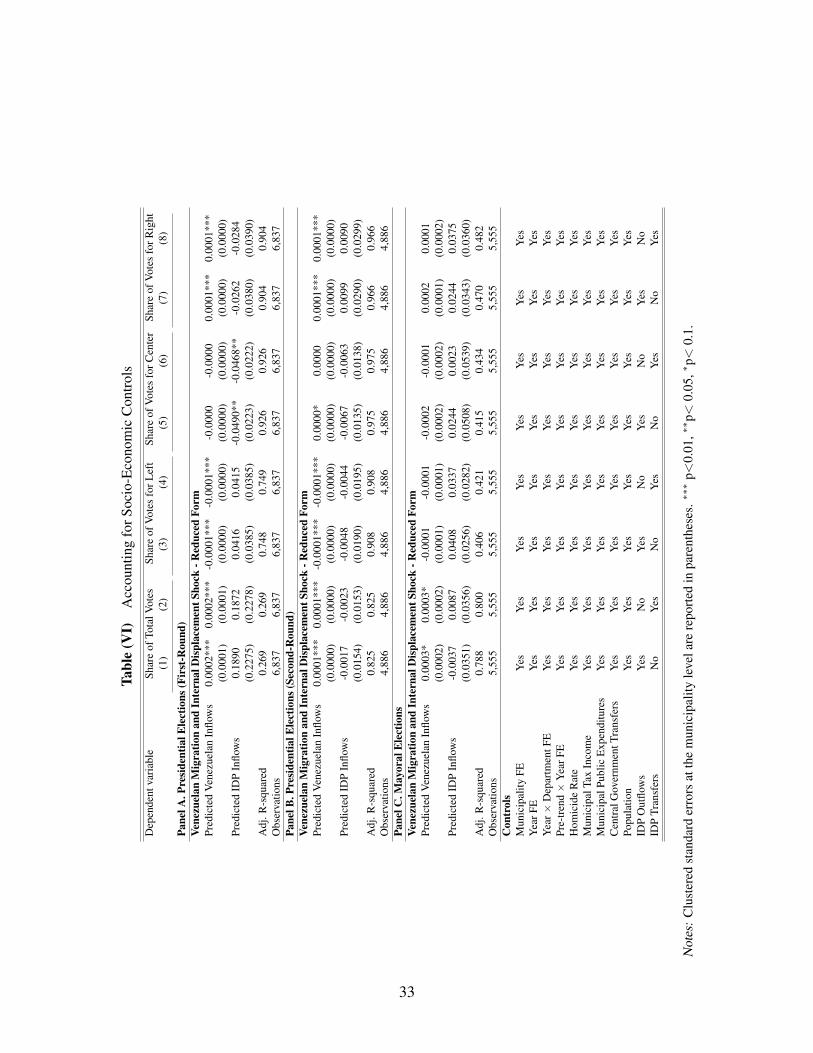
supply of labor.21 We test for these mechanism on Table VI by re-estimating the specification of equation
1 (including all the previous controls listed in Tables III to V) and adding as covariates the time-varying
outcomes that may have changed in response to migration shocks. While we acknowledge that these may
be endogenous or ‘bad’ controls (Angrist and Pischke, 2009), we are purposefully interested in examining
how the reduced-form effect of internal and international migration waves on electoral outcomes changes
when controlling for the potential intermediate variables. These variables include homicide rate, municipal
tax income, municipal public expenditure, central government transfers to municipalities, population, and
IDP outflows. These variables include all the available observable variation for all the municipalities in our
sample throughout our complete period of study. Importantly, all of our estimates are robust to the inclusion
of these controls, suggesting that none of the observed effects are driven by changes on these endogenous
variables.22
Another possible explanation for the asymmetric effects observed for Venezuelan and IDP migration in-
flows is that we have not accounted for the large response to IDP migration from the Colombian government.
Beginning in 1997 the Colombian government started creating institutions and social programs (mainly in
the form of transfers) to support the victims of conflict, including IDP. For instance, Law 387 of 1997 cre-
ated the Fondo Nacional para La Atencion Integral a la Poblacion Desplazada, an special fund dedicated
to the holistic attention of IDP population, facilitating food security, health, education, and housing access.
21As documented by Scheve and Slaughter (2001); Mayda (2006); Hanson et al. (2007); Facchini and Mayda (2009);Malhotra et al. (2013); Del Carpio and Wagner (2015); Altindag et al. (2018).
22To the extent that we are also controlling for interaction effects of year dummies with pre-trend characteristicsrelated with conflict intensity, violent crime, government intervention, institutional development, economic growth,poverty, inequality, and labor outcomes (as listed in Table II). We can also discard the possibility that differences inthese dimensions between municipalities may be driving the observed effects of migration on electoral outcomes.
18
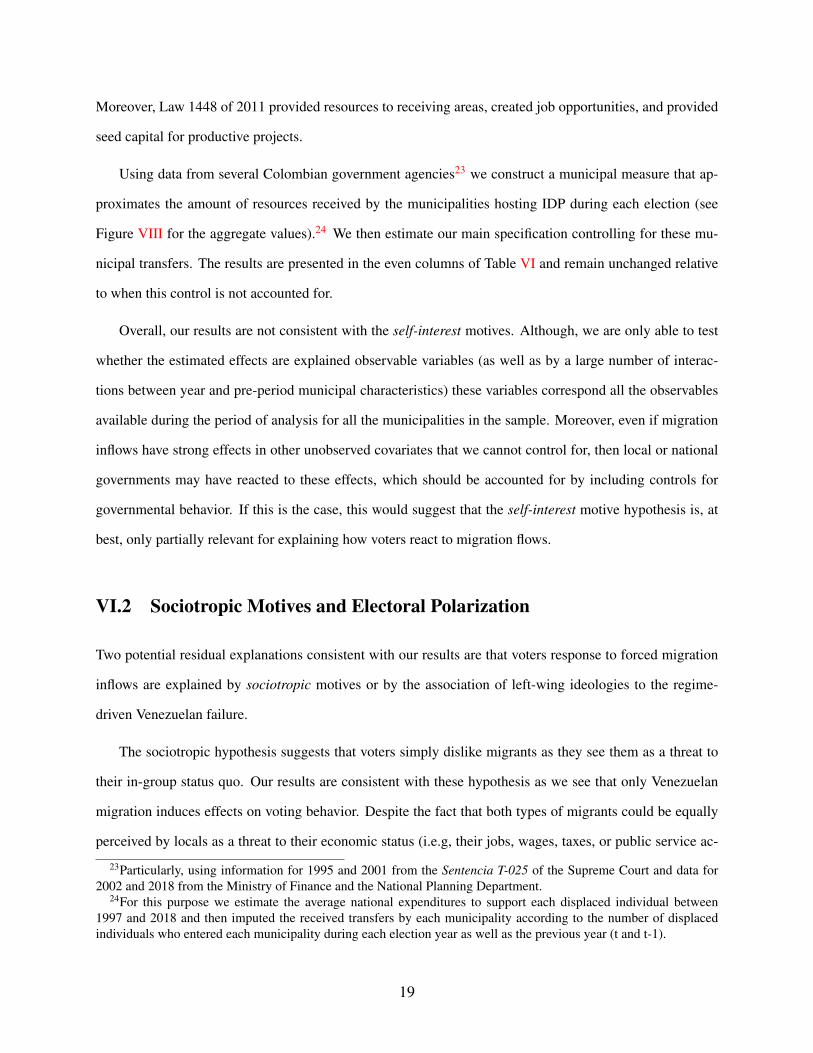
Moreover, Law 1448 of 2011 provided resources to receiving areas, created job opportunities, and provided
seed capital for productive projects.
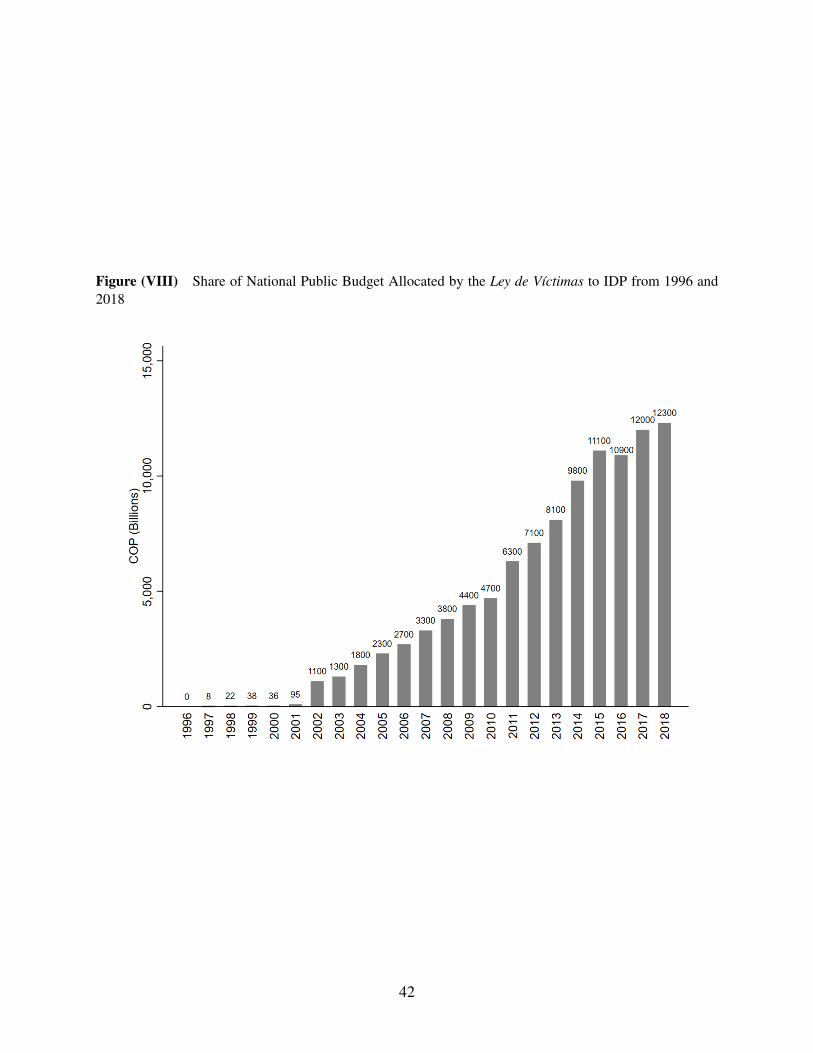
Using data from several Colombian government agencies23 we construct a municipal measure that ap-
proximates the amount of resources received by the municipalities hosting IDP during each election (see
Figure VIII for the aggregate values).24 We then estimate our main specification controlling for these mu-
nicipal transfers. The results are presented in the even columns of Table VI and remain unchanged relative
to when this control is not accounted for.
Overall, our results are not consistent with the self-interest motives. Although, we are only able to test
whether the estimated effects are explained observable variables (as well as by a large number of interac-
tions between year and pre-period municipal characteristics) these variables correspond all the observables
available during the period of analysis for all the municipalities in the sample. Moreover, even if migration
inflows have strong effects in other unobserved covariates that we cannot control for, then local or national
governments may have reacted to these effects, which should be accounted for by including controls for
governmental behavior. If this is the case, this would suggest that the self-interest motive hypothesis is, at
best, only partially relevant for explaining how voters react to migration flows.
VI.2 Sociotropic Motives and Electoral Polarization
Two potential residual explanations consistent with our results are that voters response to forced migration
inflows are explained by sociotropic motives or by the association of left-wing ideologies to the regime-
driven Venezuelan failure.
The sociotropic hypothesis suggests that voters simply dislike migrants as they see them as a threat to
their in-group status quo. Our results are consistent with these hypothesis as we see that only Venezuelan
migration induces effects on voting behavior. Despite the fact that both types of migrants could be equally
perceived by locals as a threat to their economic status (i.e.g, their jobs, wages, taxes, or public service ac-
23Particularly, using information for 1995 and 2001 from the Sentencia T-025 of the Supreme Court and data for2002 and 2018 from the Ministry of Finance and the National Planning Department.
24For this purpose we estimate the average national expenditures to support each displaced individual between1997 and 2018 and then imputed the received transfers by each municipality according to the number of displacedindividuals who entered each municipality during each election year as well as the previous year (t and t-1).
19
cess), local voters seem to react more drastically towards international migrants. Our results, consequently,
support the idea that negative political attitudes towards immigration are more related to concerns related to
cultural rather than self-interest economic motives.
In turn, the electoral polarization hypothesis suggests that political parties may highlight the association
between left-wing ideologies and the Venezuelan crisis in their campaigning as a way to create fear among
voters and reduce the electoral support to left-leaning parties. Indeed, during the last presidential elections in
Colombia (2018) right-wing political parties pushed forward the theory that voting for the left was equivalent
to transforming Colombia into another Venezuela (see El Espectador, 2018; BBC, 2018; or El Paıs, 2018 for
media evidence). For instance, billboards were posted across the country with messages such as: “Vote para
que Colombia no sea otra Venezuela” [Vote so Colombia will not become another Venezuela] (see BBC,
2018) or “No quiero vivir como Venezolano” [I do not want to live like a Venezuelan] (see Letras Libres,
2018). This type of publicity was sponsored by right-wing presidential candidates, which in turn won the
elections.
A formal test of the these two potential mechanisms is more difficult since Colombia lacks perception
surveys covering our sample period that contain information for enough municipalities.25 We therefore
acknowledge that any support for a mechanism other than the self-interest channel (which we rule out) is
only residual.
Existing aggregate perception surveys, however, support the validity of the socio-tropic and electoral
polarization hypotheses. For instance, a survey carried out to 1,200 individuals representative of 96% of
Colombian voters every two months between September of 2017 and November of 2018 in 57 municipalities
including the 14 most populated Colombian cities, suggested that roughly 50% of voters thought Colombia
could repeat Venezuelan history and 45% of voters disagree with the statement that Colombia should host
Venezuelan migrants (See Figure IX).26
Overall, our findings imply that voters respond only to international migration inflows by increasing po-
25Latinobarometer surveys about 1,200 individuals in Colombia in 20 of the 33 departments–the second admin-istrative level, equivalent to U.S. states—with department samples ranging from 20 to 100 individuals (and 205 inBogota). This provides neither representativeness nor the ability to directly test the effect of migration shocks on theperceptions of local communities.
26The surveys were carried out by Invamer S.A.S. Gallup and were funded by three large news outlets includingCaracol Television, Semana, and Blu radio. See Invamer (2018).
20
litical participation and shifting their votes towards right-wing political ideologies. We do not find evidence
supporting the idea that any of these effects are explained by self-interested motives. Moreover, we argue
that these effects are explained by the fact that Venezuelan migrants may have triggered in-group bias or
that left-wing ideologies are now associated to the Venezuelan crises.
VI.3 Exploring the Role of Ethnic or Regional Diversity
In this section we explore whether municipalities that have been more exposed to IDP migration responded
in different ways to the international Venezuelan migration inflows. This idea was originally proposed by
Allport (1954), who argues that the attitudes towards minorities may be affected by the ethnic composition
of the locality in which individuals live. The author poses that the interaction between ethnic groups can lead
to more understanding under four conditions: equal group status, common goals, inter-group cooperation
and authority support. To test for these heterogeneous effects, we estimate the median of the cumulative
IDP inflows received between 1995 and 2018 by municipality and use it to split our sample between mu-
nicipalities more and less exposed to IDP migration. We then estimate the effects of Venezuelan migration
separately for municipalities above and below the median level of IDP inflows.
The results are presented in Table VII and suggest two interesting facts. First, electoral participation in
the form of turnout increased disproportionately in municipalities more exposed to IDP migration following
the Venezuelan migration shock. Second, however, the re-composition of votes from left to right-wing
political ideologies is only observed for municipalities that have been exposed to relatively small IDP shocks.
This is consistent with the interpretation that voters antipathy towards Venezuelan migrants is less prevalent
in areas that have been disproportionately affected by past migration shocks and that as such have higher
ethnic or regional diversity. This result is in line with the socio-tropic motive hypothesis and suggests that
Colombian voters antipathy towards international immigration has deep roots in out-group discrimination.
21
VII Discussion
This paper contributes to the growing literature that examines the effects of migration inflows on voting
behavior. Unlike previous literature, however, we examine the empirical validity of two potential mecha-
nisms: the self-interest and the sociotropic hypotheses. Our focus on Colombia allows us to identify the
relative empirical relevance of these mechanisms, because the country has experienced simultaneous shocks
on crisis-driven internal displacement as well as international migration from neighboring Venezuela.
Our empirical strategy relies on estimating predicted measures of internal and external migration flows.
These are obtained by multiplying the aggregate annual flow of internal refugees and Venezuelan migrants
to Colombia, with the pre-shock (1993) population share of migrants. The predicted flows are exogenous to
the municipal electoral outcomes after controlling for differential municipal trends parametrized by a large
number of pre-shock municipal characteristics.
We only find evidence of significant effects of international migration on voting behavior. Particularly,
larger international migration inflows are associated with an increase in political participation and a re-
composition of votes from left to right-wing oriented political ideologies. Notably, these results are, by and
large, not accounted for by the observed changes caused by migrants in such socioeconomic variables.
We interpret these findings as consistent with the idea that negative political perceptions about Venezue-
lan migrants are not fully explained by a deterioration of the economic and social well-being of host com-
munities. Voters thus appear to have sociotropic motives when reacting to Venezuelan migration at the polls.
This may be explained by the perception among Colombians that migrants with different nationalities, races,
or religions are a threat to local social or cultural norms. Our results are also in line with the possibility that
voters respond to larger inflows of international migrants by associating their originating crises with the
legacy of left-wing regimes.
References
Allport, G. (1954). The Nature of Prejudice. Reading MA: Addison-Wesley.
Altindag, O., O. Bakis, and S. Rozo (2018). Blessing or burden? the impact of refugees on businesses and
22
the informal economy. SSRN Working Paper N. 3188406.
Altonji, J. G. and D. Card (1991). The effects of immigration on the labor market outcomes of less-skilled
natives. In Immigration, Trade, and the Labor Market, pp. 201–234. University of Chicago Press.
Angrist, J. and J.-S. Pischke (2009). Mostly Harmless Econometrics: An Empiricist’s Companion (1 ed.).
Princeton University Press.
Barone, G., A. D’Ignazio, G. de Blasio, and P. Naticchioni (2016). Mr. Rossi, Mr. Hu and politics. The role
of immigration in shaping natives’ voting behavior. Journal of Public Economics 136, 1–13.
BBC (2016, November). “Una pena de muerte disimulada”: la polemica Operacion de Lib-
eracion del Pueblo, la mano dura del gobierno de Venezuela contra el crimen. Accessed from:
Rozo, S. (2018). Is Murder Bad for Business? Evidence from Colombia. The Review of Economic and
Statistics 100(5), 769–782.
26
Scheve, K. F. and M. J. Slaughter (2001). Labor market competition and individual preferences over immi-
gration policy. Review of Economics and Statistics 83(1), 133–145.
Sniderman, P. M., L. Hagendoorn, and M. Prior (2004). Predisposing factors and situational triggers: Ex-
clusionary reactions to immigrant minorities. American Political Science Review 98(1), 35–49.
Tingley, D. (2012). Public finance and immigration preferences: A lost connection? Polity 45(1), 4–33.
27
Table (I) Descriptive Statistics
Year Obs. Average St. DeviationPanel A. Presidential Elections First Round [election years: 1994, 1998, 2002, 2006, 2010, 2014, and 2018]IDP Inflows (Indv.) 1994-2018 6,837 546.83 2,947.87IDP Inflows (% Pop.) 1994-2018 6,837 0.01 0.04Predicted IDP Inflows 1994-2018 6,837 0.07 0.13Predicted Venezuelan Inflows 1994-2018 6,837 20.46 84.19Population (by municipality) 1994-2018 6,837 42,388.36 253,751.5Population 18+ (by municipality) 1994-2018 6,837 27,331.45 175,061.7Total Votes 1994-2018 6,837 12,225.87 85,847.1Votes for Left 1994-2018 6,837 1660.51 17,512.04Votes for Center 1994-2018 6,837 5,588.79 42,007.01Votes for Right 1994-2018 6,837 4,338.44 33,479.78Share of Total Votes (% Pop. 18+) 1994-2018 6,837 0.48 0.62Share of Votes for Left 1994-2018 6,837 0.10 0.13Share of Votes for Center 1994-2018 6,837 0.50 0.33Share of Votes for Right 1994-2018 6,837 0.35 0.28Panel B. Presidential Elections Second Round [election years: 1994, 1998, 2010, 2014, and 2018]IDP Inflows (Indv.) 1994-2018 4,886 317.24 1,817.44IDP Inflows (% Pop.) 1994-2018 4,886 0.01 0.03Predicted IDP Inflows 1994-2018 4,886 0.05 0.12Predicted Venezuelan Inflows 1994-2018 4,886 26.61 98.44Population (by municipality) 1994-2018 4,886 42,798.38 256,869.2Population 18+ (by municipality) 1994-2018 4,886 27,837.05 178,817.2Total Votes 1994-2018 4,886 13,374.79 87,750.99Votes for Left 1994-2018 4,886 1,562.39 28,700.8Votes for Center 1994-2018 4,886 6,018.10 43,606.9Votes for Right 1994-2018 4,886 5,100.85 38,203.95Share of Total Votes (% Pop. 18+) 1994-2018 4,886 0.54 0.17Share of Votes for Left 1994-2018 4,886 0.07 0.16Share of Votes for Center 1994-2018 4,886 0.51 0.41Share of Votes for Right 1994-2018 4,886 0.38 0.35Panel C. Mayoral Elections [election years: 1997, 2000, 2003, 2007, 2011, and 2015]IDP Inflows (Indv.) 1997-2015 5,555 681.39 3,334.75IDP Inflows (% Pop.) 1997-2015 5,555 0.01 0.04Predicted IDP Inflows 1997-2015 5,555 0.08 0.12Predicted Venezuelan Inflows 1997-2015 5,555 10.58 32.16Population (by municipality) 1997-2015 5,555 43,226.03 258,377.9Population 18+ (by municipality) 1997-2015 5,555 27,742.76 176,833.3Total Votes 1997-2015 5,555 14,405.39 74,185.56Votes for Left 1997-2015 5,555 1,201.54 20,807.4Votes for Center 1997-2015 5,555 8,850.54 41,671.98Votes for Right 1997-2015 5,555 1,707 7,947.282Share of Total Votes (% Pop. 18+) 1997-2015 5,555 0.68 0.21Share of Votes for Left 1997-2015 5,555 0.04 0.12Share of Votes for Center 1997-2015 5,555 0.71 0.26Share of Votes for Right 1997-2015 5,555 0.13 0.20
28
Table (II) Descriptive Statistics - Control Variables
Variable Year Obs. Average Standard Deviation ClassificationHectares of Coca Crops 1999 1,124 142.46 960.24 Conflict and ViolenceN. of Terrorist Attacks 1993 1,124 0.66 2.63 Conflict and ViolenceHomicide Rate (per 100,000 Indv.) 1995 1,048 52.92 66.89 Conflict and ViolenceMunicipal Tax Income (Millions) 1995 1,098 1,033 16,066 Government FinanceMun. Public Expenditure (Thousands) 1995 1,098 2,909 28,866 Government FinanceCentral Gov.Transfers (Millions) 1995 1,098 1,168 5,348 Government FinanceNumber of Financial Institutions 1995 1,046 1.75 8.92 InstitutionsNumber of Tax Collection Offices 1995 1,046 36.05 182.37 InstitutionsPer capita GDP (Millions) 2005 1,097 6.38 6.63 Economic GrowthNight Light Density 1995 1,048 3.97 7.47 Economic GrowthGINI 1993 1,043 0.46 0.04 Poverty and InequalityUnsatisfied Basic Needs (UBN, % Households ) 1993 1,035 52.98 19.21 Poverty and InequalitySubsidized Health System Cov. (%Pop.with UBN) 1998 1,136 0.72 0.41 Poverty and InequalityInformal Labor* (% Household) 2005 1,114 0.95 0.06 Labor MarketHomicide Rate (per 100,000 Indv.) 1994-2015 24,411 45.32 64.80 EndogenousMunicipal Tax Income (Millions) 1994-2015 24,189 6,585 109,238 EndogenousMun. Public Expenditure (Thousands) 1994-2015 24,156 22,486 221,487 EndogenousCentral Gov. Transfers (Millions) 1994-2015 24,156 616.81 1,524.35 EndogenousPopulation 1994-2015 24,684 37,975 231,550 EndogenousIDP Outflows (Individuals) 1994-2015 24,684 302.60 1,079.34 EndogenousIDP Transfers (Billions) 1994-2018 28,075 3.55 27.35 Endogenous
Notes: *Informal Labor is a dummy variable equal to one if less than 100% of the economically active populationwithin a household does not contribute to the pension system.
29
Tabl
e(I
II)
Eff
ects
ofcr
ises
-driv
enm
igra
tion
onpr
esid
entia
lele
ctio
ns(F
irst
-Rou
nd)
Dep
ende
ntva
riab
leSh
are
ofTo
talV
otes
Shar
eof
Vote
sfo
rLef
tSh
are
ofVo
tes
forC
ente
rSh
are
ofVo
tes
forR
ight
(1)
(2)
(3)
(4)
(5)
(6)
(7)
(8)
Pane
lA.V
enez
uela
nM
igra
tion
and
Inte
rnal
Dis
plac
emen
tSho
ck-R
educ
edFo
rmPr
edic
ted
Ven
ezue
lan
Inflo
ws
0.00
01**
*0.
0002
***
-0.0
001*
**-0
.000
1***
-0.0
0001
*-0
.000
00.
0001
***
0.00
01**
*(0
.000
0)(0
.000
1)(0
.000
0)(0
.000
0)(0
.000
0)(0
.000
0)(0
.000
0)(0
.000
0)Pr
edic
ted
IDP
Inflo
ws
0.18
900.
1877
0.04
570.
0416
-0.0
332
-0.0
471*
*-0
.055
6-0
.028
3(0
.255
5)(0
.227
8)(0
.040
1)(0
.038
6)(0
.020
3)(0
.022
2)(0
.052
2)(0
.039
0)A
dj.R
-squ
ared
0.26
30.
269
0.72
80.
748
0.91
90.
926
0.89
00.
903
Pane
lB.V
enez
uela
nM
igra
tion
Shoc
k-R
educ
edFo
rmPr
edic
ted
Ven
ezue
lan
Inflo
ws
0.00
01**
*0.
0002
***
-0.0
001*
**-0
.000
1***
-0.0
0001
*-0
.000
00.
0001
***
0.00
01**
*(0
.000
0)(0
.000
1)(0
.000
0)(0
.000
0)(0
.000
0)(0
.000
0)(0
.000
0)(0
.000
0)A
dj.R
-squ
ared
0.26
30.
268
0.72
70.
748
0.91
90.
926
0.88
90.
903
Pane
lC.I
nter
nalD
ispl
acem
entS
hock
-Red
uced
Form
Pred
icte
dID
PIn
flow
s0.
1850
0.18
510.
0483
0.04
27-0
.032
1-0
.047
0**
-0.0
595
-0.0
295
(0.2
54)
(0.2
26)
(0.0
41)
(0.0
39)
(0.0
20)
(0.0
22)
(0.0
54)
(0.0
40)
Adj
.R-s
quar
ed0.
263
0.26
80.
727
0.74
70.
919
0.92
60.
889
0.90
3Pa
nelD
.Int
erna
lDis
plac
emen
tSho
ck-O
LS
IDP
(%To
talP
opul
atio
n)
-0.1
633*
-0.1
095
0.17
58*
0.17
04*
0.00
96-0
.039
9-0
.222
7***
-0.1
610*
*(0
.084
)(0
.107
)(0
.099
)(0
.099
)(0
.069
)(0
.073
)(0
.079
)(0
.065
)A
dj.R
-squ
ared
0.26
20.
268
0.72
80.
748
0.91
90.
926
0.88
90.
904
Pane
lE.I
nter
nalD
ispl
acem
entS
hock
-2SL
S(S
econ
d-St
age)
IDP
(%To
talP
opul
atio
n)2.
5708
2.48
740.
6718
0.57
42-0
.445
5-0
.632
1**
-0.8
276
-0.3
965
(3.3
93)
(2.9
01)
(0.4
65)
(0.4
31)
(0.3
30)
(0.3
15)
(0.5
85)
(0.4
47)
Pane
lF.I
nter
nalD
ispl
acem
entS
hock
-2SL
S(F
irst
-Sta
ge)
Pred
icte
dID
PIn
flow
s0.
072*
**0.
074*
**0.
072*
**0.
074*
**0.
072*
**0.
074*
**0.
072*
**0.
074*
**(0
.021
)(0
.023
)(0
.021
)(0
.023
)(0
.021
)(0
.023
)(0
.021
)(0
.023
)F-
test
(Exc
lude
dIn
stru
men
t)11
.66
11.0
611
.66
11.0
611
.66
11.0
611
.66
11.0
6O
bser
vatio
ns(A
llPa
nels
)6,
837
6,83
76,
837
6,83
76,
837
6,83
76,
837
6,83
7C
ontr
ols(
allp
anel
s)M
unic
ipal
ityFE
Yes
Yes
Yes
Yes
Yes
Yes
Yes
Yes
Yea
rFE
Yes
Yes
Yes
Yes
Yes
Yes
Yes
Yes
Yea
r×D
epar
tmen
tFE
Yes
Yes
Yes
Yes
Yes
Yes
Yes
Yes
Con
flict
and
Vio
lenc
e×
Yea
rFE
No
Yes
No
Yes
No
Yes
No
Yes
Gov
ernm
entF
inan
ce×
Yea
rFE
No
Yes
No
Yes
No
Yes
No
Yes
Inst
itutio
ns×
Yea
rFE
No
Yes
No
Yes
No
Yes
No
Yes
Gro
wth×
Yea
rFE
No
Yes
No
Yes
No
Yes
No
Yes
Pove
rty
and
Ineq
ualit
y×
Yea
rFE
No
Yes
No
Yes
No
Yes
No
Yes
Lab
orM
arke
t×Y
earF
EN
oY
esN
oY
esN
oY
esN
oY
esSt
anda
rdD
evia
tion
(Ind
p.Va
riab
les)
Pred
icte
dV
enez
uela
nIn
flow
s84
.194
Pred
icte
dID
PIn
flow
s0.
1282
IDP
(%Po
p.)
0.03
82
Not
es:
Clu
ster
edst
anda
rder
rors
atth
em
unic
ipal
ityle
vela
rere
port
edin
pare
nthe
ses.∗∗∗
p<0.
01,∗∗ p<
0.05
,∗p<
0.1.
30
Tabl
e(I
V)
Eff
ects
ofcr
ises
-driv
enm
igra
tion
onpr
esid
entia
lele
ctio
ns(S
econ
d-R
ound
)D
epen
dent
vari
able
Shar
eof
Tota
lVot
esSh
are
ofVo
tes
forL
eft
Shar
eof
Vote
sfo
rCen
ter
Shar
eof
Vote
sfo
rRig
ht(1
)(2
)(3
)(4
)(5
)(6
)(7
)(8
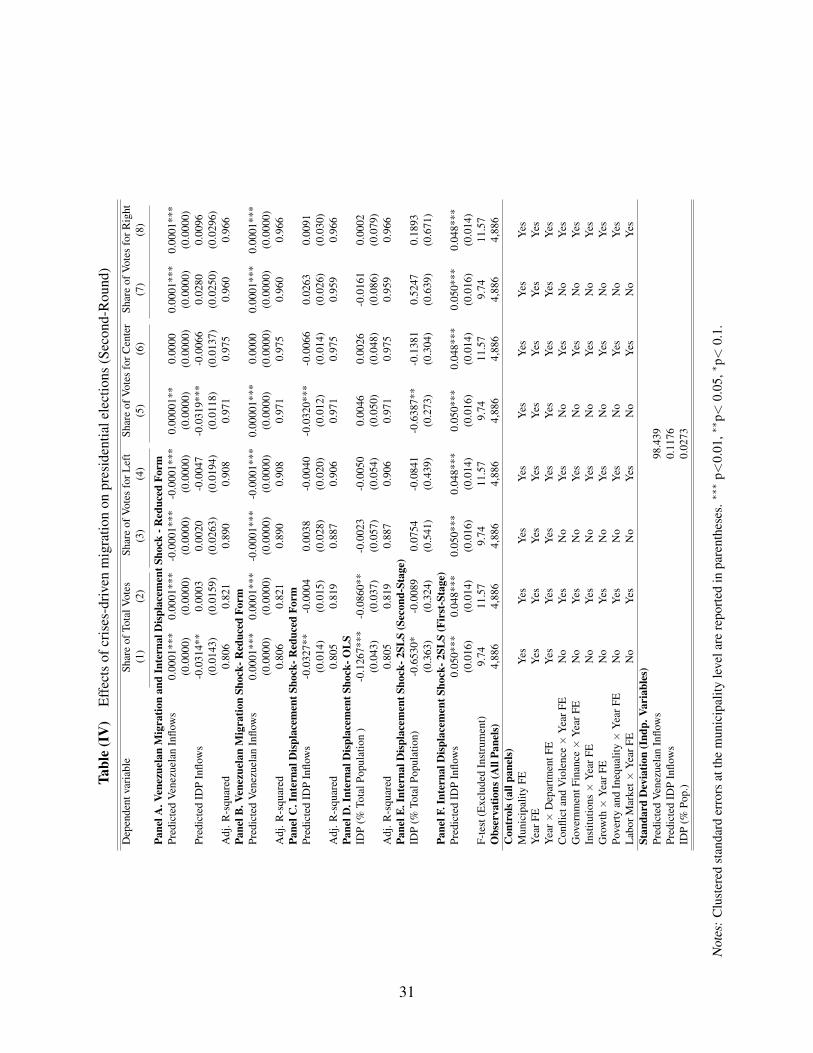
)
Pane
lA.V
enez
uela
nM
igra
tion
and
Inte
rnal
Dis
plac
emen
tSho
ck-R
educ
edFo
rmPr
edic
ted
Ven
ezue
lan
Inflo
ws
0.00
01**
*0.
0001
***
-0.0
001*
**-0
.000
1***
0.00
001*
*0.
0000
0.00
01**
*0.
0001
***
(0.0
000)
(0.0
000)
(0.0
000)
(0.0
000)
(0.0
000)
(0.0
000)
(0.0
000)
(0.0
000)
Pred
icte
dID
PIn
flow
s-0
.031
4**
0.00
030.
0020
-0.0
047
-0.0
319*
**-0
.006
60.
0280
0.00
96(0
.014
3)(0
.015
9)(0
.026
3)(0
.019
4)(0
.011
8)(0
.013
7)(0
.025
0)(0
.029
6)A
dj.R
-squ
ared
0.80
60.
821
0.89
00.
908
0.97
10.
975
0.96
00.
966
Pane
lB.V
enez
uela
nM
igra
tion
Shoc
k-R
educ
edFo
rmPr
edic
ted
Ven
ezue
lan
Inflo
ws
0.00
01**
*0.
0001
***
-0.0
001*
**-0
.000
1***
0.00
001*
**0.
0000
0.00
01**
*0.
0001
***
(0.0
000)
(0.0
000)
(0.0
000)
(0.0
000)
(0.0
000)
(0.0
000)
(0.0
000)
(0.0
000)
Adj
.R-s
quar
ed0.
806
0.82
10.
890
0.90
80.
971
0.97
50.
960
0.96
6Pa
nelC
.Int
erna
lDis
plac
emen
tSho
ck-R
educ
edFo
rmPr
edic
ted
IDP
Inflo
ws
-0.0
327*
*-0
.000
40.
0038
-0.0
040
-0.0
320*
**-0
.006
60.
0263
0.00
91(0
.014
)(0
.015
)(0
.028
)(0
.020
)(0
.012
)(0
.014
)(0
.026
)(0
.030
)A
dj.R
-squ
ared
0.80
50.
819
0.88
70.
906
0.97
10.
975
0.95
90.
966
Pane
lD.I
nter
nalD
ispl
acem
entS
hock
-OL
SID
P(%
Tota
lPop
ulat
ion
)-0
.126
7***
-0.0
860*
*-0
.002
3-0
.005
00.
0046
0.00
26-0
.016
10.
0002
(0.0
43)
(0.0
37)
(0.0
57)
(0.0
54)
(0.0
50)
(0.0
48)
(0.0
86)
(0.0
79)
Adj
.R-s
quar
ed0.
805
0.81
90.
887
0.90
60.
971
0.97
50.
959
0.96
6Pa
nelE
.Int
erna
lDis
plac
emen
tSho
ck-2
SLS
(Sec
ond-
Stag
e)ID
P(%
Tota
lPop
ulat
ion)
-0.6
530*
-0.0
089
0.07
54-0
.084
1-0
.638
7**
-0.1
381
0.52
470.
1893
(0.3
63)
(0.3
24)
(0.5
41)
(0.4
39)
(0.2
73)
(0.3
04)
(0.6
39)
(0.6
71)
Pane
lF.I
nter
nalD
ispl
acem
entS
hock
-2SL
S(F
irst
-Sta
ge)
Pred
icte
dID
PIn
flow
s0.
050*
**0.
048*
**0.
050*
**0.
048*
**0.
050*
**0.
048*
**0.
050*
**0.
048*
**(0
.016
)(0
.014
)(0
.016
)(0
.014
)(0
.016
)(0
.014
)(0
.016
)(0
.014
)F-
test
(Exc
lude
dIn
stru
men
t)9.
7411
.57
9.74
11.5
79.
7411
.57
9.74
11.5
7O
bser
vatio
ns(A
llPa
nels
)4,
886
4,88
64,
886
4,88
64,
886
4,88
64,
886
4,88
6C
ontr
ols(
allp
anel
s)M
unic
ipal
ityFE
Yes
Yes
Yes
Yes
Yes
Yes
Yes
Yes
Yea
rFE
Yes
Yes
Yes
Yes
Yes
Yes
Yes
Yes
Yea
r×D
epar
tmen
tFE
Yes
Yes
Yes
Yes
Yes
Yes
Yes
Yes
Con
flict
and
Vio
lenc
e×
Yea
rFE
No
Yes
No
Yes
No
Yes
No
Yes
Gov
ernm
entF
inan
ce×
Yea
rFE
No
Yes
No
Yes
No
Yes
No
Yes
Inst
itutio
ns×
Yea
rFE
No
Yes
No
Yes
No
Yes
No
Yes
Gro
wth×
Yea
rFE
No
Yes
No
Yes
No
Yes
No
Yes
Pove
rty
and
Ineq
ualit
y×
Yea
rFE
No
Yes
No
Yes
No
Yes
No
Yes
Lab
orM
arke
t×Y
earF
EN
oY
esN
oY
esN
oY
esN
oY
esSt
anda
rdD
evia
tion
(Ind
p.Va
riab
les)
Pred
icte
dV
enez
uela
nIn
flow
s98
.439
Pred
icte
dID
PIn
flow
s0.
1176
IDP
(%Po
p.)
0.02
73
Not
es:
Clu
ster
edst
anda
rder
rors
atth
em
unic
ipal
ityle
vela
rere
port
edin
pare
nthe
ses.∗∗∗
p<0.
01,∗∗ p<
0.05
,∗p<
0.1.
31
Tabl
e(V
)E
ffec
tsof
cris
es-d
riven
mig
ratio
non
may
oral
elec
tions
Dep
ende
ntva
riab
leSh
are
ofTo
talV
otes
Shar
eof
Vote
sfo
rLef
tSh
are
ofVo
tes
forC
ente
rSh
are
ofVo
tes
forR
ight
(1)
(2)
(3)
(4)
(5)
(6)
(7)
(8)
Pane
lA.V
enez
uela
nM
igra
tion
and
Inte
rnal
Dis
plac
emen
tSho
ck-R
educ
edFo
rmPr
edic
ted
Ven
ezue
lan
Inflo
ws
0.00
03*
0.00
03*
-0.0
001
-0.0
001
-0.0
002
-0.0
001
0.00
020.
0001
(0.0
002)
(0.0
002)
(0.0
001)
(0.0
001)
(0.0
002)
(0.0
002)
(0.0
001)
(0.0
002)
Pred
icte
dID
PIn
flow
s-0
.003
70.
0078
0.04
080.
0354
0.02
440.
0076
0.02
440.
0344
(0.0
351)
(0.0
362)
(0.0
256)
(0.0
280)
(0.0
508)
(0.0
541)
(0.0
343)
(0.0
360)
Adj
.R-s
quar
ed0.
788
0.79
80.
406
0.42
00.
415
0.43
30.
470
0.48
2Pa
nelB
.Ven
ezue
lan
Mig
ratio
nSh
ock-
Red
uced
Form
Pred
icte
dV
enez
uela
nIn
flow
s0.
0003
*0.
0003
*-0
.000
1-0
.000
1-0
.000
2-0
.000
10.
0002
0.00
01(0
.000
2)(0
.000
2)(0
.000
1)(0
.000
1)(0
.000
2)(0
.000
2)(0
.000
1)(0
.000
2)A
dj.R
-squ
ared
0.78
80.
798
0.40
50.
420
0.41
50.
433
0.47
00.
482
Pane
lC.I
nter
nalD
ispl
acem
entS
hock
-Red
uced
Form
Pred
icte
dID
PIn
flow
s-0
.007
60.
0054
0.04
170.
0359
0.02
700.
0083
0.02
160.
0333
(0.0
35)
(0.0
36)
(0.0
26)
(0.0
28)
(0.0
51)
(0.0
54)
(0.0
35)
(0.0
36)
Adj
.R-s
quar
ed0.
787
0.79
70.
405
0.42
00.
415
0.43
30.
469
0.48
2Pa
nelD
.Int
erna
lDis
plac
emen
tSho
ck-O
LS
IDP
(%To
talP
opul
atio
n)
-0.1
443*
**-0
.149
0**
0.04
39-0
.043
9-0
.078
80.
0527
0.06
750.
0875
(0.0
52)
(0.0
66)
(0.0
53)
(0.0
47)
(0.0
89)
(0.1
08)
(0.0
67)
(0.0
88)
Adj
.R-s
quar
ed0.
788
0.79
80.
405
0.42
00.
415
0.43
30.
469
0.48
2Pa
nelE
.Int
erna
lDis
plac
emen
tSho
ck-2
SLS
(Sec
ond-
Stag
e)ID
P(%
Tota
lPop
ulat
ion)
-0.0
595
0.04
760.
3252
0.31
630.
2108
0.07
280.
1685
0.29
41(0
.270
)(0
.320
)(0
.223
)(0
.264
)(0
.389
)(0
.474
)(0
.276
)(0
.327
)Pa
nelF
.Int
erna
lDis
plac
emen
tSho
ck-2
SLS
(Fir
st-S
tage
)Pr
edic
ted
IDP
Inflo
ws
0.12
8***
0.11
3***
0.12
8***
0.11
3***
0.12
8***
0.11
3***
0.12
8***
0.11
3***
(0.0
31)
(0.0
26)
(0.0
31)
(0.0
26)
(0.0
31)
(0.0
26)
(0.0
31)
(0.0
26)
F-te
st(E
xclu
ded
Inst
rum
ent)
17.0
419
.63
17.0
419
.63
17.0
419
.63
17.0
419
.63
Obs
erva
tions
(All
Pane
ls)
5,55
55,
555
5,55
55,
555
5,55
55,
555
5,55
55,
555
Con
trol
s(al
lpan
els)
Mun
icip
ality
FEY
esY
esY
esY
esY
esY
esY
esY
esY
earF
EY
esY
esY
esY
esY
esY
esY
esY
esY
ear×
Dep
artm
entF
EY
esY
esY
esY
esY
esY
esY
esY
esC
onfli
ctan
dV
iole
nce×
Yea
rFE
No
Yes
No
Yes
No
Yes
No
Yes
Gov
ernm
entF
inan
ce×
Yea
rFE
No
Yes
No
Yes
No
Yes
No
Yes
Inst
itutio
ns×
Yea
rFE
No
Yes
No
Yes
No
Yes
No
Yes
Gro
wth×
Yea
rFE
No
Yes
No
Yes
No
Yes
No
Yes
Pove
rty
and
Ineq
ualit
y×
Yea
rFE
No
Yes
No
Yes
No
Yes
No
Yes
Lab
orM
arke
t×Y
earF
EN
oY
esN
oY
esN
oY
esN
oY
esSt
anda
rdD
evia
tion
(Ind
p.Va
riab
les)
Pred
icte
dV
enez
uela
nIn
flow
s32
.158
Pred
icte
dID
PIn
flow
s0.
1242
IDP
(%Po
p.)
0.03
99
Not
es:
Clu
ster
edst
anda
rder
rors
atth
em
unic
ipal
ityle
vela
rere
port
edin
pare
nthe
ses.∗∗∗
p<0.
01,∗∗ p<
0.05
,∗p<
0.1.
32
Tabl
e(V
I)A
ccou
ntin
gfo
rSoc
io-E
cono
mic
Con
trol
sD
epen
dent
vari
able
Shar
eof
Tota
lVot
esSh
are
ofVo
tes
forL
eft
Shar
eof
Vote
sfo
rCen
ter
Shar
eof
Vote
sfo
rRig
ht(1
)(2
)(3
)(4
)(5
)(6
)(7
)(8
)
Pane
lA.P
resi
dent
ialE
lect
ions
(Fir
st-R
ound
)Ve
nezu
elan
Mig
ratio
nan
dIn
tern
alD
ispl
acem
entS
hock
-Red
uced
Form
Pred
icte
dV
enez
uela
nIn
flow
s0.
0002
***
0.00
02**
*-0
.000
1***
-0.0
001*
**-0
.000
0-0
.000
00.
0001
***
0.00
01**
*(0
.000
1)(0
.000
1)(0
.000
0)(0
.000
0)(0
.000
0)(0
.000
0)(0
.000
0)(0
.000
0)Pr
edic
ted
IDP
Inflo
ws
0.18
900.
1872
0.04
160.
0415
-0.0
490*
*-0
.046
8**
-0.0
262
-0.0
284
(0.2
275)
(0.2
278)
(0.0
385)
(0.0
385)
(0.0
223)
(0.0
222)
(0.0
380)
(0.0
390)
Adj
.R-s
quar
ed0.
269
0.26
90.
748
0.74
90.
926
0.92
60.
904
0.90
4O
bser
vatio
ns6,
837
6,83
76,
837
6,83
76,
837
6,83
76,
837
6,83
7Pa
nelB
.Pre
side
ntia
lEle
ctio
ns(S
econ
d-R
ound
)Ve
nezu
elan
Mig
ratio
nan
dIn
tern
alD
ispl
acem
entS
hock
-Red
uced
Form
Pred
icte
dV
enez
uela
nIn
flow
s0.
0001
***
0.00
01**
*-0
.000
1***
-0.0
001*
**0.
0000
*0.
0000
0.00
01**
*0.
0001
***
(0.0
000)
(0.0
000)
(0.0
000)
(0.0
000)
(0.0
000)
(0.0
000)
(0.0
000)
(0.0
000)
Pred
icte
dID
PIn
flow
s-0
.001
7-0
.002
3-0
.004
8-0
.004
4-0
.006
7-0
.006
30.
0099
0.00
90(0
.015
4)(0
.015
3)(0
.019
0)(0
.019
5)(0
.013
5)(0
.013
8)(0
.029
0)(0
.029
9)A
dj.R
-squ
ared
0.82
50.
825
0.90
80.
908
0.97
50.
975
0.96
60.
966
Obs
erva
tions
4,88
64,
886
4,88
64,
886
4,88
64,
886
4,88
64,
886
Pane
lC.M
ayor
alE
lect
ions
Vene
zuel
anM
igra
tion
and
Inte
rnal
Dis
plac
emen
tSho
ck-R
educ
edFo
rmPr
edic
ted
Ven
ezue
lan
Inflo
ws
0.00
03*
0.00
03*
-0.0
001
-0.0
001
-0.0
002
-0.0
001
0.00
020.
0001
(0.0
002)
(0.0
002)
(0.0
001)
(0.0
001)
(0.0
002)
(0.0
002)
(0.0
001)
(0.0
002)
Pred
icte
dID
PIn
flow
s-0
.003
70.
0087
0.04
080.
0337
0.02
440.
0023
0.02
440.
0375
(0.0
351)
(0.0
356)
(0.0
256)
(0.0
282)
(0.0
508)
(0.0
539)
(0.0
343)
(0.0
360)
Adj
.R-s
quar
ed0.
788
0.80
00.
406
0.42
10.
415
0.43
40.
470
0.48
2O
bser
vatio
ns5,
555
5,55
55,
555
5,55
55,
555
5,55
55,
555
5,55
5C
ontr
ols
Mun
icip
ality
FEY
esY
esY
esY
esY
esY
esY
esY
esY
earF
EY
esY
esY
esY
esY
esY
esY
esY
esY
ear×
Dep
artm
entF
EY
esY
esY
esY
esY
esY
esY
esY
esPr
e-tr
end×
Yea
rFE
Yes
Yes
Yes
Yes
Yes
Yes
Yes
Yes
Hom
icid
eR
ate
Yes
Yes
Yes
Yes
Yes
Yes
Yes
Yes
Mun
icip
alTa
xIn
com
eY
esY
esY
esY
esY
esY
esY
esY
esM
unic
ipal
Publ
icE
xpen
ditu
res
Yes
Yes
Yes
Yes
Yes
Yes
Yes
Yes
Cen
tral
Gov
ernm
entT
rans
fers
Yes
Yes
Yes
Yes
Yes
Yes
Yes
Yes
Popu
latio
nY
esY
esY
esY
esY
esY
esY
esY
esID
PO
utflo
ws
Yes
No
Yes
No
Yes
No
Yes
No
IDP
Tran
sfer
sN
oY
esN
oY
esN
oY
esN
oY
es
Not
es:
Clu
ster
edst
anda
rder
rors
atth
em
unic
ipal
ityle
vela
rere
port
edin
pare
nthe
ses.∗∗∗
p<0.
01,∗∗ p<
0.05
,∗p<
0.1.
33
Tabl
e(V
II)
Impa
cts
ofV
enez
uela
nM
igra
tion
inM
unic
aliti
esw
ithH
igh
IDP
Mig
ratio
nD
epen
dent
vari
able
Shar
eof
Tota
lVot
esSh
are
ofVo
tes
forL
eft
Shar
eof
Vote
sfo
rCen
ter
Shar
eof
Vote
sfo
rRig
htM
edia
nof
IDP
Inflo
ws
Abo
veB
elow
Abo
veB
elow
Abo
veB
elow
Abo
veB
elow
(1)
(2)
(3)
(4)
(5)
(6)
(7)
(8)
Pane
lA.P
resi
dent
ialE
lect
ions
(Fir
st-R
ound
)Ve
nezu
elan
Mig
ratio
nSh
ock
-Red
uced
Form
Pred
icte
dV
enez
uela
nIn
flow
s0.
0006
***
0.00
01**
*-0
.000
1-0
.000
1***
-0.0
001
-0.0
000
0.00
030.
0001
**(0
.000
2)(0
.000
0)(0
.000
1)(0
.000
0)(0
.000
2)(0
.000
0)(0
.000
2)(0
.000
0)A
dj.R
-squ
ared
0.99
50.
877
0.79
00.
838
0.92
90.
951
0.91
20.
934
Obs
erva
tions
3,41
73,
420
3,41
73,
420
3,41
73,
420
3,41
73,
420
Pane
lB.P
resi
dent
ialE
lect
ions
(Sec
ond-
Rou
nd)
Vene
zuel
anM
igra
tion
Shoc
k-R
educ
edFo
rmPr
edic
ted
Ven
ezue
lan
Inflo
ws
0.00
06**
*0.
0001
***
0.00
00-0
.000
1***
-0.0
002
0.00
000.
0001
0.00
01**
*(0
.000
2)(0
.000
0)(0
.000
3)(0
.000
0)(0
.000
2)(0
.000
0)(0
.000
2)(0
.000
0)A
dj.R
-squ
ared
0.86
90.
860
0.94
40.
932
0.97
00.
987
0.97
60.
978
Obs
erva
tions
2,06
22,
824
2,06
22,
824
2,06
22,
824
2,06
22,
824
Pane
lC.M
ayor
alE
lect
ions
Vene
zuel
anM
igra
tion
Shoc
k-R
educ
edFo
rmPr
edic
ted
Ven
ezue
lan
Inflo
ws
0.00
15*
0.00
02-0
.000
50.
0000
0.00
13-0
.000
2-0
.000
60.
0002
(0.0
008)
(0.0
002)
(0.0
004)
(0.0
001)
(0.0
011)
(0.0
002)
(0.0
007)
(0.0
002)
Adj
.R-s
quar
ed0.
789
0.87
00.
549
0.53
20.
531
0.52
30.
581
0.56
0O
bser
vatio
ns2,
748
2,80
72,
748
2,80
72,
748
2,80
72,
748
2,80
7C
ontr
ols
Mun
icip
ality
FEY
esY
esY
esY
esY
esY
esY
esY
esY
earF
EY
esY
esY
esY
esY
esY
esY
esY
esY
ear×
Dep
artm
entF
EY
esY
esY
esY
esY
esY
esY
esY
esC
onfli
ctan
dV
iole
nce×
Yea
rFE
Yes
Yes
Yes
Yes
Yes
Yes
Yes
Yes
Gov
ernm
entF
inan
ce×
Yea
rFE
Yes
Yes
Yes
Yes
Yes
Yes
Yes
Yes
Inst
itutio
ns×
Yea
rFE
Yes
Yes
Yes
Yes
Yes
Yes
Yes
Yes
Gro
wth×
Yea
rFE
Yes
Yes
Yes
Yes
Yes
Yes
Yes
Yes
Pove
rty
and
Ineq
ualit
y×
Yea
rFE
Yes
Yes
Yes
Yes
Yes
Yes
Yes
Yes
Lab
orM
arke
t×Y
earF
EY
esY
esY
esY
esY
esY
esY
esY
esE
ndog
enou
sC
ontr
ols
Yes
Yes
Yes
Yes
Yes
Yes
Yes
Yes
Not
es:
Clu
ster
edst
anda
rder
rors
atth
em
unic
ipal
ityle
vela
rere
port
edin
pare
nthe
ses.∗∗∗
p<0.
01,∗∗ p<
0.05
,∗p<
0.1.
34
Figure (I) Annual Venezuelan and IDP Inflows in Colombia
Notes: Venezuelan migration between 1994 and 2002 was estimated with information available from the populationcensuses of 1993 and 2005. The data available from 2003 to 2018 come from the official statistics of migrationproduced by the Colombian Statistics Department and Migracion Colombia, it includes transitory migration.
35
Figu
re(I
I)M
ean
Shar
eof
Tota
lVot
es(%
ofPo
pula
tion
18+
year
s)
Not
es:
Fort
hem
ayor
alel
ectio
nsa
few
mun
icip
aliti
essh
owsh
are
ofvo
tes
larg
erth
an1
asth
ere
have
been
case
sof
vote
rfra
ud.
36
Figu
re(I
II)
Ave
rage
Shar
eof
Vote
forL
eft-
,Cen
ter-
,and
Rig
ht-W
ing
Polit
ical
Ideo
logi
es(P
resi
dent
ialE
lect
ions
Firs
t-R
ound
)
37
Figu
re(I
V)
Mea
nSh
are
ofVo
tefo
rLef
t-,C
ente
r-,a
ndR
ight
-Win
gPo
litic
alId
eolo
gies
(Pre
side
ntia
lEle
ctio
nsSe
cond
-Rou
nd)
38
Figu
re(V
)A
vera
geSh
are
ofVo
tefo
rLef
t-,C
ente
r-,a
ndR
ight
-Win
gPo
litic
alId
eolo
gies
(May
oral
Ele
ctio
ns)
39
Figu
re(V
I)Pr
edic
ted
Ven
ezue
lan
Inflo
ws
in19
93an
dA
ggre
gate
Ven
ezue
lan
Inflo
ws
betw
een
1993
and
2005
Not
es:
Mun
icip
aliti
esw
ithm
issi
ngin
form
atio
nw
ere
crea
ted
afte
r199
3.T
hem
aps
wer
eco
nstr
ucte
dus
ing
info
rmat
ion
from
the
popu
latio
nsce
nsus
esof
1993
and
2005
.Pre
dict
edVe
nezu
elan
Inflo
ws
in19
93an
dVe
nezu
elan
Inflo
ws
betw
een
1993
and
2005
wer
eco
nstr
ucte
dus
ing
the
follo
win
gfo
rmul
as:
Pred
icte
dV
enez
uela
nIn
flow
s19
93=
[Ven
ezue
lans
in19
93m/
Popu
latio
nB
orne
dA
broa
din
1993
m]
Ven
ezue
lan
Inflo
ws
betw
een
1993
-200
5=
[Agg
rega
teV
enez
uela
nIn
flow
s19
93-2
005 m
/Pop
ulat
ion
Bor
ned
Abr
oad
betw
een
1993
-200
5 m]
40
Figu
re(V
II)
Pred
icte
dan
dO
bser
ved
IDP
Inflo
ws
betw
een
1994
and
2018
(Mea
nV
alue
s)
Not
es:
Mun
icip
aliti
esw
ithm
issi
ngin
form
atio
nw
ere
crea
ted
afte
r199
3.Pr
edic
ted
IDP
Inflo
ws
whe
recr
eate
dac
cord
ing
toeq
uatio
n(3
)and
obse
rved
IDP
inflo
ws
corr
espo
ndto
the
mea
nnu
mbe
rofI
DP
inflo
ws
asa
shar
eof
mun
icip
alpo
pula
tion.
41
Figure (VIII) Share of National Public Budget Allocated by the Ley de Vıctimas to IDP from 1996 and2018
42
Figure (IX) Voters Perceptions towards Venezuelan Migration
43
Appendix I: Political Elections Data Base Construction
We constructed three data bases two for presidential and one mayor elections. The databases were
constructed with original data from the Registradurıa Nacional del Estado Civil, the Colombian
electoral authority. We begin all data bases after 1994, since after this year the electoral data has
information on the total votes received for all candidates.
To begin we identify the political party of each candidate for mayor or presidential elections
and then classify it in left, center, or right following the methodology proposed by Fergusson et al.
(2017). The classification for each political party includes three steps.
1. Check party names, mottos, and slogans for words that identify the mayor’s/president’s party
clearly as left leaning or right-leaning (e.g., communist, or socialist for left-wing oriented
and conservative or Christian for right-wing oriented).
2. Since few parties can be classified using the method outlined in the previous step, check
the party statutes (when available) for policy stances that are clearly left- or right-leaning.
A party is coded left-wing if the party statutes include at least three of the following five