25
Brazil Pharma Institutional Presentation August, 2012
Brazil Pharma
Institutional Presentation
August, 2012

2
127 / 155 / 202
127 / 127 / 127
0 / 56 / 150
217 / 217 / 217
204 / 215 / 234
Shareholder’s Structure Analysis
BTG Pactual + FIPs Managers Operating Partners Free Float
35.7% 36.6% 27.1% 0.6%
100% 100% 100% 100% 100% 100%
Note: Considering 15 millions shares to be issued from Sant’ana’s incorporation.
Company Overview
and Industry
Dynamics

4
127 / 155 / 202
127 / 127 / 127
0 / 56 / 150
217 / 217 / 217
204 / 215 / 234
7.008.30 9.40 10.30 11.20 11.60
13.1014.80
17.2019.20
21.5023.60
26.40
30.20
36.00
43.00
1996 1997 1998 1999 2000 2001 2002 2003 2004 2005 2006 2007 2008 2009 2010 2011
Sales Performance in the Brazilian Pharmacy Retail Sector from 1996-2011 (R$ Billion)
Drugstores A Growth and Accelerating History
Source: IBGE. Farmácia Popular. Health. OMS IMS. Brazil Banco Central do Brasil
Drivers Micro Timing
Regional Brands Fragmented
Market Formalization and
Consolidation
Drivers Macro
Income Growth Population Aging Generics Drugs
1997 – 2000
1997: Asian Crisis
1998: Russian Crisis
1999: Real Depreciation
2000: Internet Bubble burst
2001 - 2002
2002: Crisis pre-Lula
election
2001: Argentine Default
2003 – 2005
2003-04: First years of
Lula´s election
2004: Mensalão scandal
2006 – 2007
2006: Second Lula
election
2008 – 2011
2008: Subprime
Crisis
2010: Greece Debt
Crisis
5
127 / 155 / 202
127 / 127 / 127
0 / 56 / 150
217 / 217 / 217
204 / 215 / 234
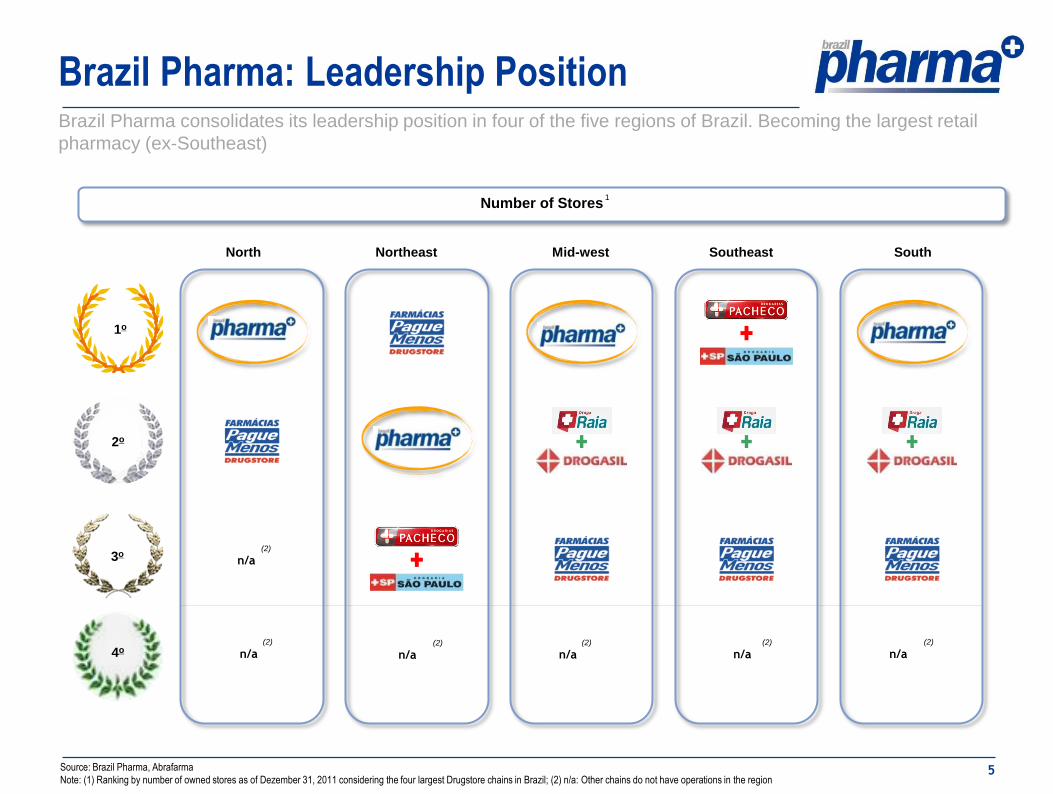
Source: Brazil Pharma, Abrafarma
Note: (1) Ranking by number of owned stores as of Dezember 31, 2011 considering the four largest Drugstore chains in Brazil; (2) n/a: Other chains do not have operations in the region
Brazil Pharma consolidates its leadership position in four of the five regions of Brazil. Becoming the largest retail
pharmacy (ex-Southeast)
Number of Stores 1
4o
2o
1o
Northeast
n/a (2)
3o
North
n/a (2)
n/a (2)
Southeast
n/a (2)
Mid-west
n/a (2)
South
n/a (2)
Brazil Pharma: Leadership Position

6
127 / 155 / 202
127 / 127 / 127
0 / 56 / 150
217 / 217 / 217
204 / 215 / 234
Brazil Pharma: Footprint
86
Largest Drugstore Chain in the Brazilian Retail: Ready to Growth and Consolidating
North 104
Northest 242
Midwest 118
Southeast
South 201
REGIONS Owned stores
10
1
103 20
15
19
10
193
7
75
114
1
8
232 ¹ Owned stores
114 ² Owned stores
118 Owned stores
352 Franchises
201 Owned stores
05³ Distribution centers
Footprint
1.017 stores
665 owned stores
352 Franchises
89
1) Includes 69 stores from Guararapes’ platform ; 2) Includes 11 stores acquired from Estrela Galdino on April 2012 and added to Sant’Ana’s store count in June 30, 2012.Therefore they generated no revenues in
2Q12 ; 3) Sant’Ana’s Distribution Center has suffered a fire on December 2011. A new distribution center will be inaugurated in the second half of 2012.

7
127 / 155 / 202
127 / 127 / 127
0 / 56 / 150
217 / 217 / 217
204 / 215 / 234
Large Growth Capacity
Organic Growth (# owned stores)
Brazil Pharma: Market Penetration
Brazil Pharma Abrafarma
Branded Generics HPC
Diversified Sales Mix
(2Q12)
Market Growth
(CAGR07’-11’)
Maturation of Owned Stores
(2Q12)
Growth already contracted
8
127 / 155 / 202
127 / 127 / 127
0 / 56 / 150
217 / 217 / 217
204 / 215 / 234
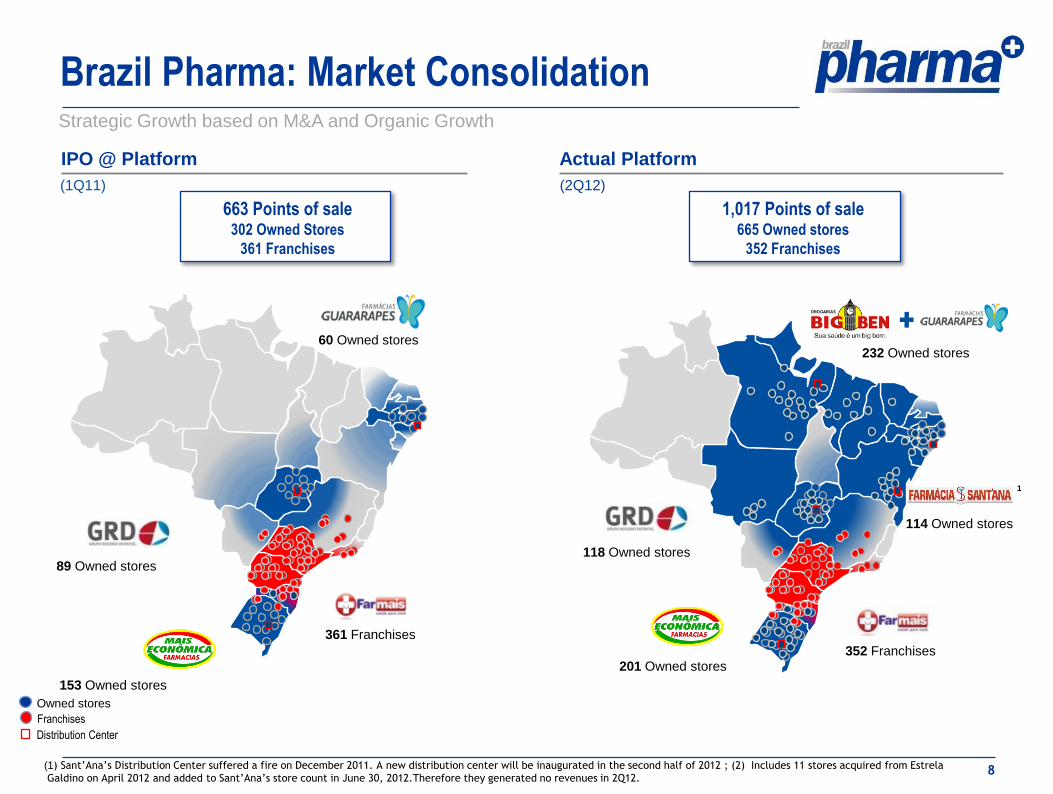
Brazil Pharma: Market Consolidation Strategic Growth based on M&A and Organic Growth
663 Points of sale 302 Owned Stores
361 Franchises
IPO @ Platform Actual Platform
201 Owned stores
352 Franchises
232 Owned stores
118 Owned stores
114 Owned stores
1,017 Points of sale 665 Owned stores
352 Franchises
89 Owned stores
60 Owned stores
153 Owned stores
361 Franchises
(1) Sant’Ana’s Distribution Center suffered a fire on December 2011. A new distribution center will be inaugurated in the second half of 2012 ; (2) Includes 11 stores acquired from Estrela
Galdino on April 2012 and added to Sant’Ana’s store count in June 30, 2012.Therefore they generated no revenues in 2Q12.
1
(1Q11) (2Q12)
Distribution Center
Owned stores
Franchises
Focus on Integration
10
127 / 155 / 202
127 / 127 / 127
0 / 56 / 150
217 / 217 / 217
204 / 215 / 234
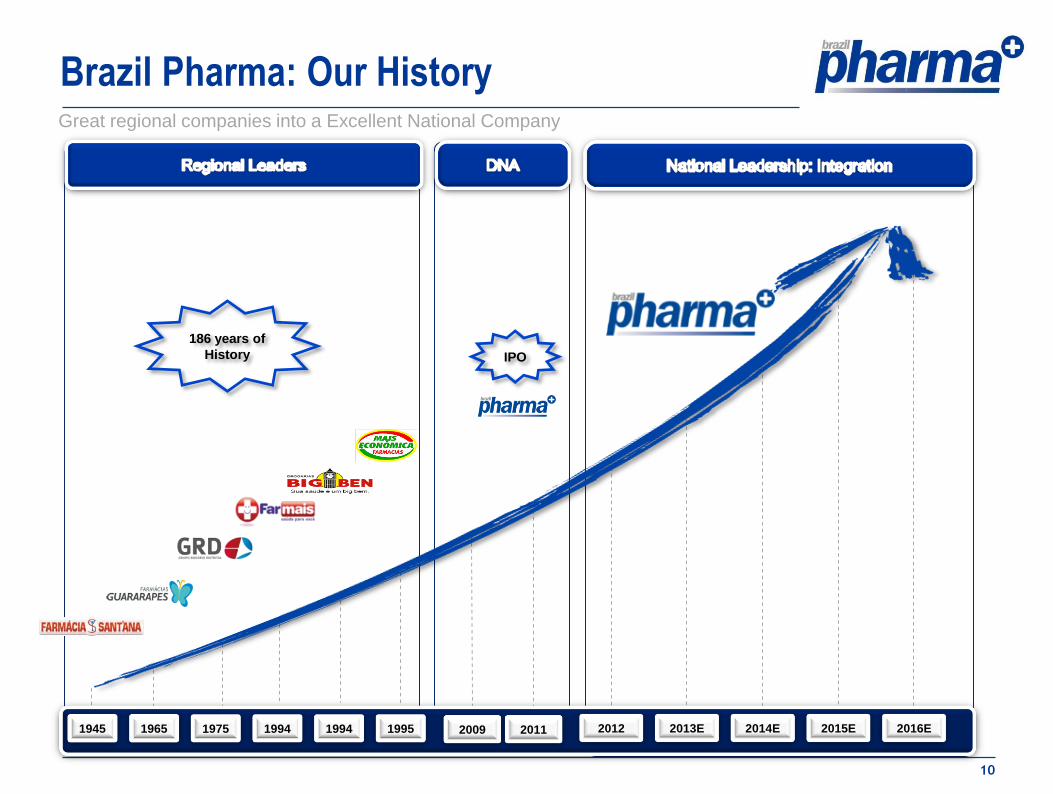
Brazil Pharma: Our History Great regional companies into a Excellent National Company
2012 2013E 2014E 2016E2015E1945 1965 1975 1994
IPO
1994 2009 20111995
186 years of
History
11
127 / 155 / 202
127 / 127 / 127
0 / 56 / 150
217 / 217 / 217
204 / 215 / 234
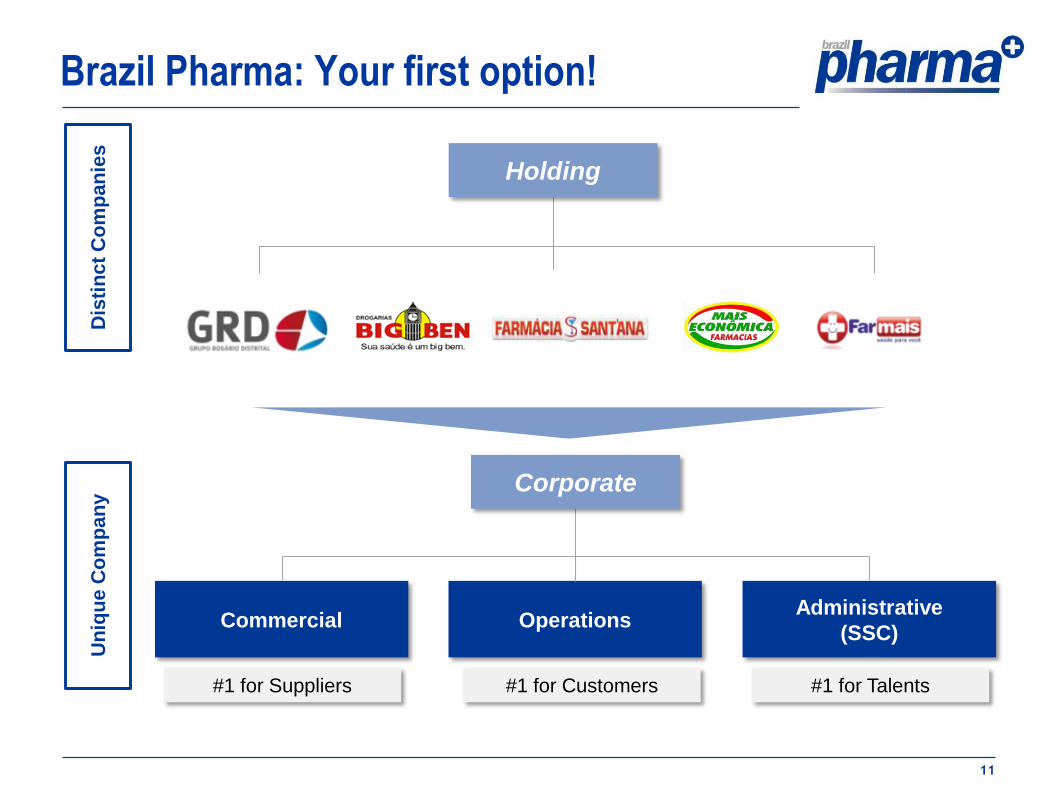
Brazil Pharma: Your first option!
Holding
OperationsAdministrative
(SSC)Commercial
Corporate
#1 for Suppliers #1 for Customers #1 for Talents
Dis
tin
ct
Co
mp
an
ies
Un
iqu
eC
om
pa
ny
12
127 / 155 / 202
127 / 127 / 127
0 / 56 / 150
217 / 217 / 217
204 / 215 / 234
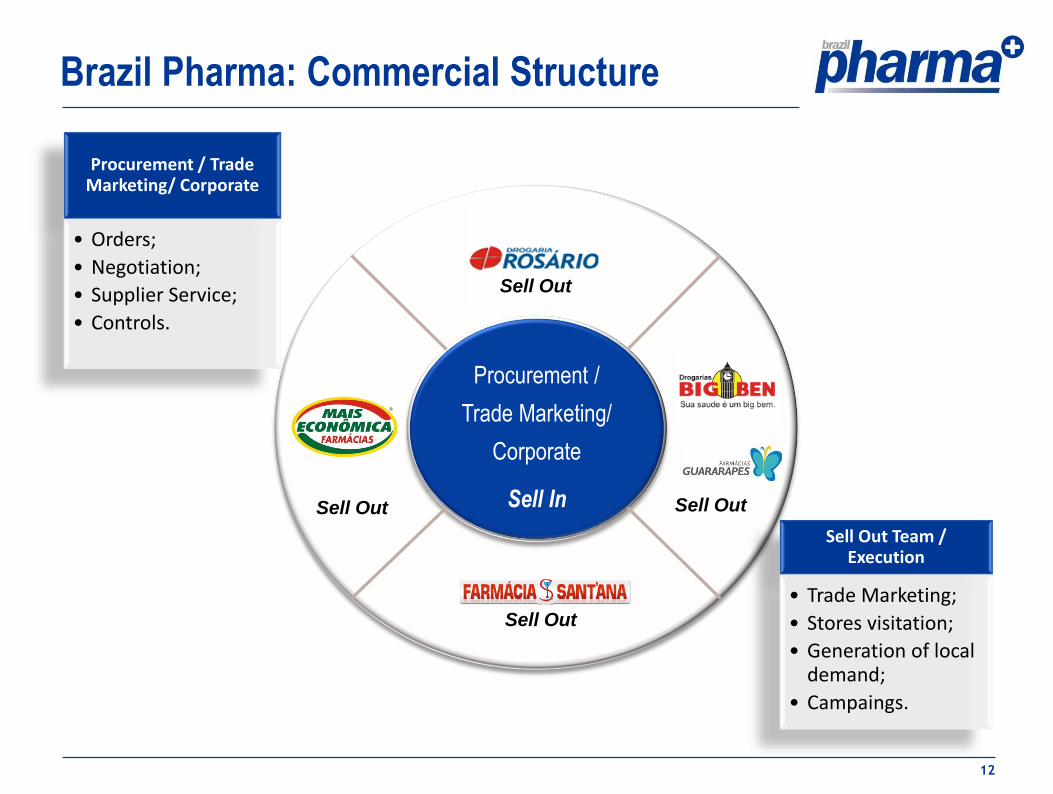
Brazil Pharma: Commercial Structure
Procurement /
Trade Marketing/
Corporate
Sell In
Sell Out Team / Execution
• Trade Marketing;
• Stores visitation;
• Generation of local demand;
• Campaings.
Sell Out
Sell Out
Sell Out
Sell Out
Procurement / Trade Marketing/ Corporate
• Orders;
• Negotiation;
• Supplier Service;
• Controls.

Company
Highlights
14
127 / 155 / 202
127 / 127 / 127
0 / 56 / 150
217 / 217 / 217
204 / 215 / 234
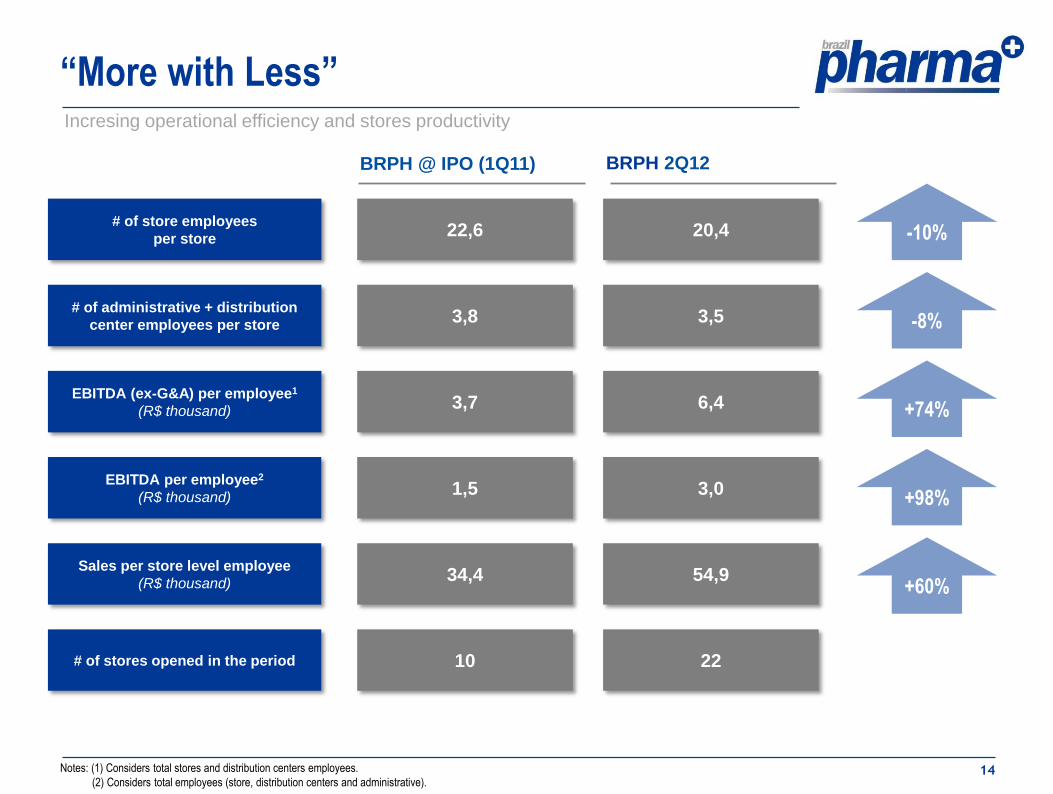
“More with Less” Incresing operational efficiency and stores productivity
Notes: (1) Considers total stores and distribution centers employees.
(2) Considers total employees (store, distribution centers and administrative).
3,8 3,5
3,7 6,4
22,6 20,4
BRPH @ IPO (1Q11)
34,4 54,9
BRPH 2Q12
10 22
1,5 3,0
-10%
-8%
+74%
+98%
+60%
# of administrative + distribution
center employees per store
EBITDA (ex-G&A) per employee1
(R$ thousand)
# of store employees
per store
Sales per store level employee
(R$ thousand)
# of stores opened in the period
EBITDA per employee2
(R$ thousand)
15
127 / 155 / 202
127 / 127 / 127
0 / 56 / 150
217 / 217 / 217
204 / 215 / 234
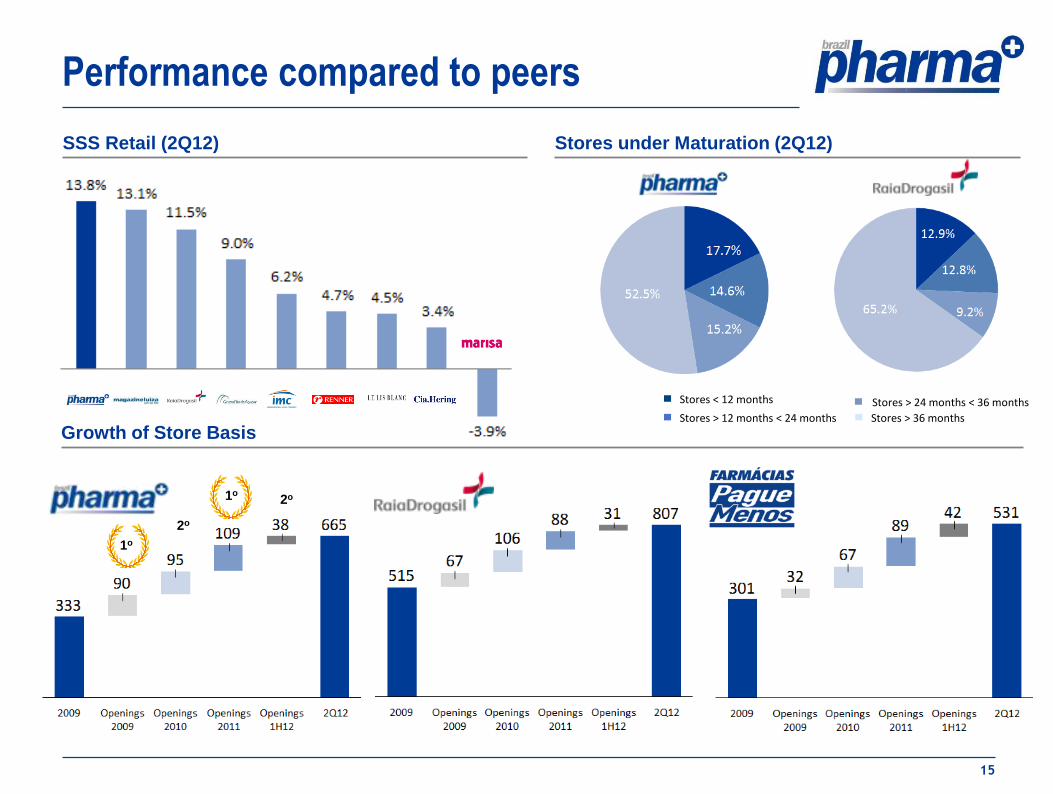
Performance compared to peers
Stores under Maturation (2Q12)
Growth of Store Basis
SSS Retail (2Q12)
Stores < 12 months Stores > 24 months < 36 months
Stores > 12 months < 24 months Stores > 36 months
1o
1o
2o
2o
16
127 / 155 / 202
127 / 127 / 127
0 / 56 / 150
217 / 217 / 217
204 / 215 / 234
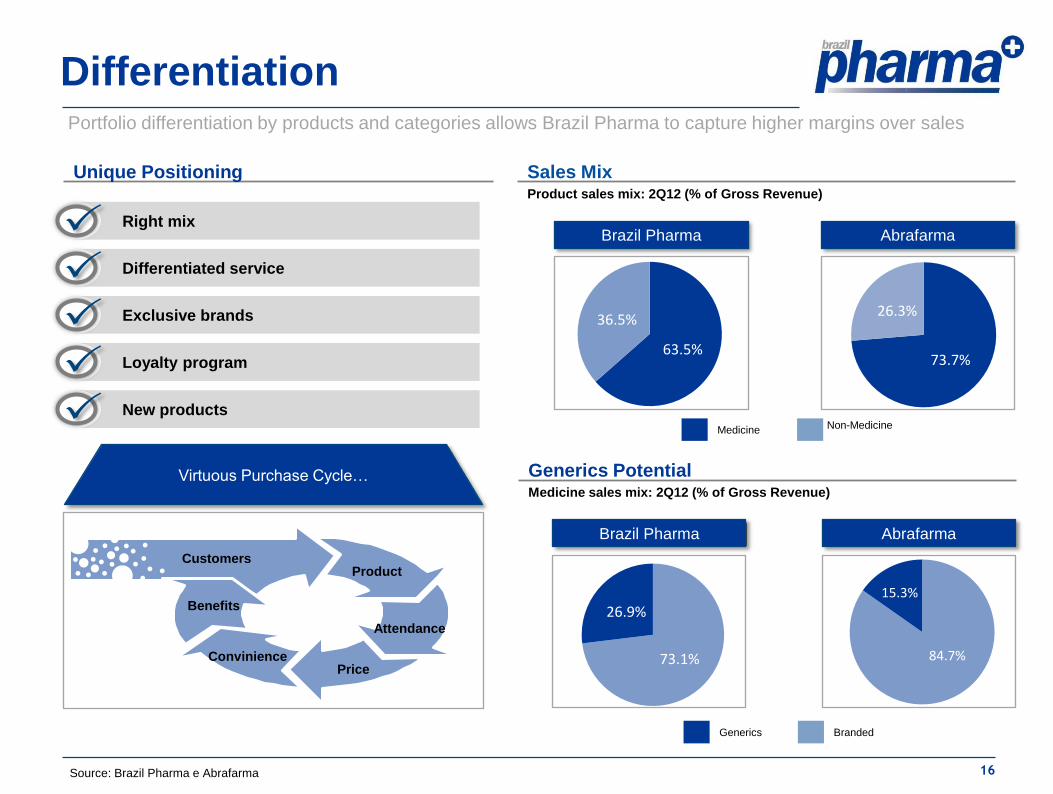
Differentiation Portfolio differentiation by products and categories allows Brazil Pharma to capture higher margins over sales
Medicine sales mix: 2Q12 (% of Gross Revenue)
Generics Potential
Brazil Pharma Abrafarma
Generics Branded
Product sales mix: 2Q12 (% of Gross Revenue)
Sales Mix
Abrafarma
Medicine Non-Medicine
Brazil Pharma
Unique Positioning
Source: Brazil Pharma e Abrafarma
Virtuous Purchase Cycle…
Customers Product
Attendance
Price Convinience
Benefits
73.7%
26.3%
73.1%
26.9%
63.5%
36.5%
84.7%
15.3%
Right mix
Differentiated service
Exclusive brands
Loyalty program
New products
17
127 / 155 / 202
127 / 127 / 127
0 / 56 / 150
217 / 217 / 217
204 / 215 / 234
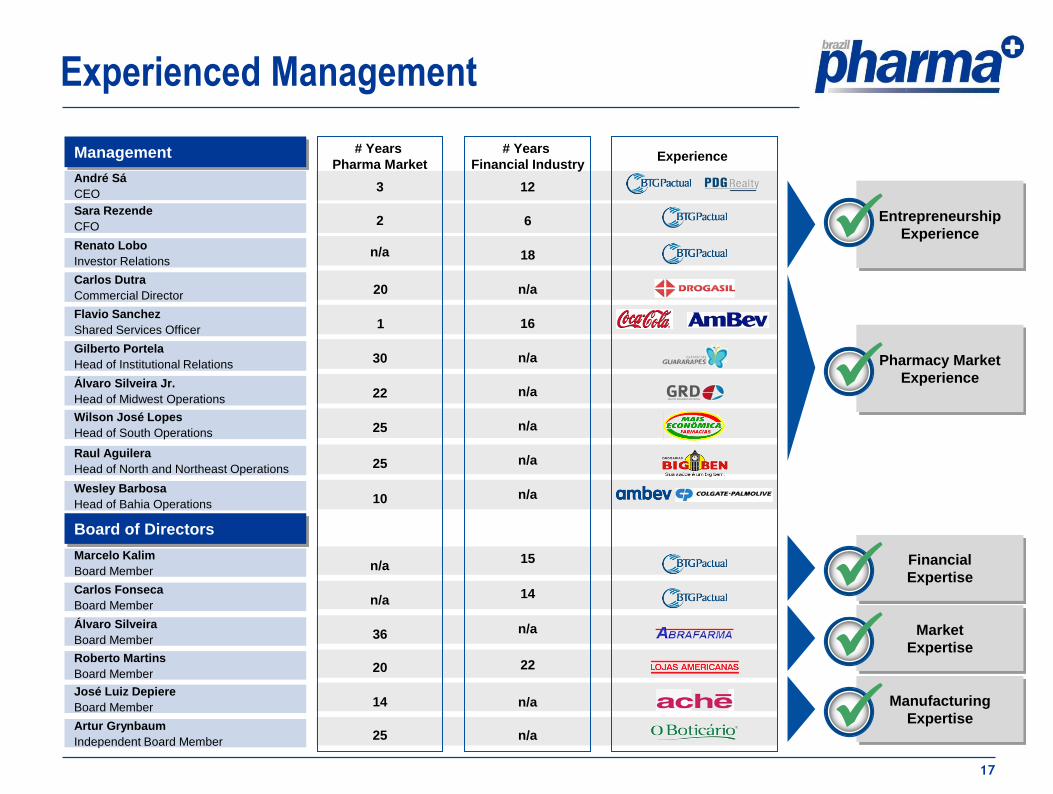
Experienced Management
Roberto Martins
Board Member 20
José Luiz Depiere
Board Member 14
Artur Grynbaum
Independent Board Member 25
Álvaro Silveira
Board Member 36
Marcelo Kalim
Board Member n/a
Carlos Fonseca
Board Member n/a
Álvaro Silveira Jr.
Head of Midwest Operations 22
Wilson José Lopes
Head of South Operations 25
Gilberto Portela
Head of Institutional Relations 30
Sara Rezende
CFO 2
Raul Aguilera
Head of North and Northeast Operations 25
Carlos Dutra
Commercial Director 20
André Sá
CEO 3
Renato Lobo
Investor Relations n/a
Wesley Barbosa
Head of Bahia Operations 10
Flavio Sanchez
Shared Services Officer 1
Management
Board of Directors
Entrepreneurship
Experience
# Years
Pharma Market
# Years
Financial Industry
n/a
n/a
n/a
22
n/a
n/a
n/a
6
n/a
n/a
12
18
15
14
n/a
16
Experience
Pharmacy Market
Experience
Financial
Expertise
Market
Expertise
Manufacturing
Expertise

18
127 / 155 / 202
127 / 127 / 127
0 / 56 / 150
217 / 217 / 217
204 / 215 / 234
Performance of BPHA3 versus IBOV Since its IPO, Brazil Pharma stock outperformed the Ibovespa by 48.2%.
Indexed Stock Price (Base 100)
06/27/2011 to 09/05/2012
12/26/2011:
Stock Split
11/28/2011:
Estrela
Galdino MoU
11/03/2011:
Big Ben
MoU
02/13/2012:
Sant’ana
MoU
04/16/2012:
Beauty’In
MoU
Acquisitions Corporate Events
Source: Econométrica in 05 September, 2012.
Note: “MoU” means Memorandum of Undestanding
06/21/2012:
Follow-on
R$ 12.77
R$ 22.00
56.863
Since IPO (06/24/11):
Brazil Pharma: + 48.2%
Raia Drogasil: + 115.3%
Ibovespa: (6.8%)
2012 YTD:
Brazil Pharma: + 46.0%
Raia Drogasil: + 67.3%
Ibovespa: (1.7%)
IPO
Operational and
Financial Highlights
20
127 / 155 / 202
127 / 127 / 127
0 / 56 / 150
217 / 217 / 217
204 / 215 / 234
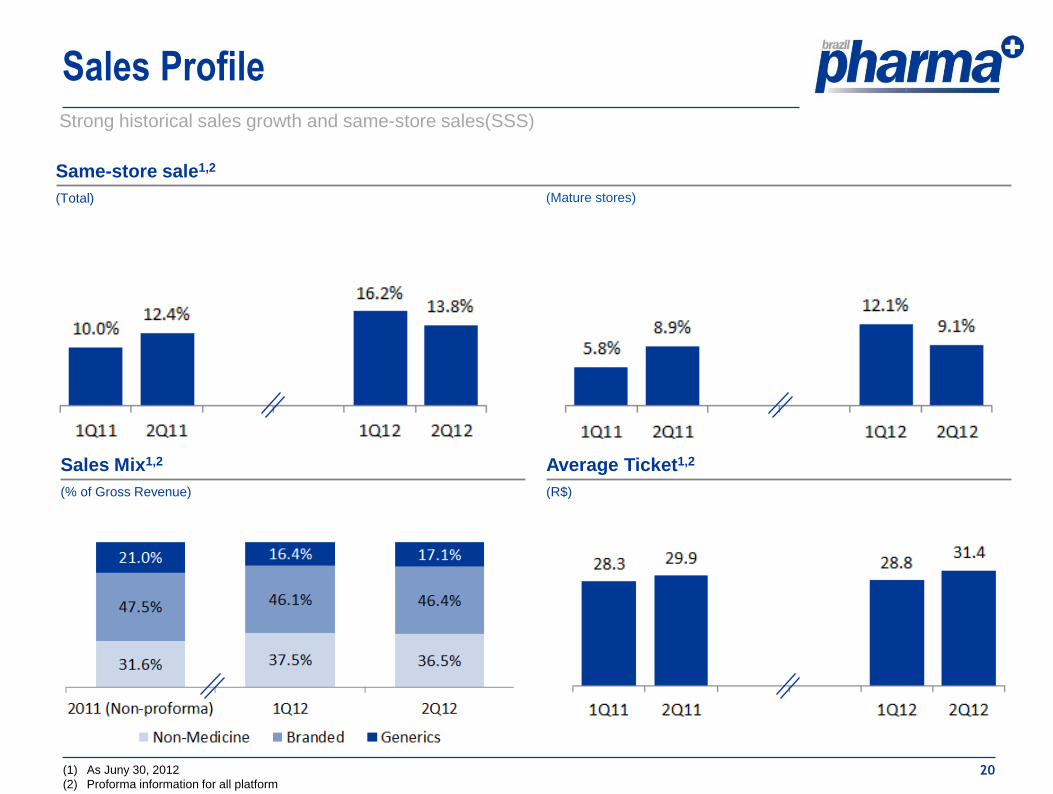
Strong historical sales growth and same-store sales(SSS)
Sales Profile
Sales Mix1,2
(% of Gross Revenue)
Average Ticket1,2
(R$)
(1) As Juny 30, 2012
(2) Proforma information for all platform
Same-store sale1,2
(Total)
(Mature stores)
21
127 / 155 / 202
127 / 127 / 127
0 / 56 / 150
217 / 217 / 217
204 / 215 / 234
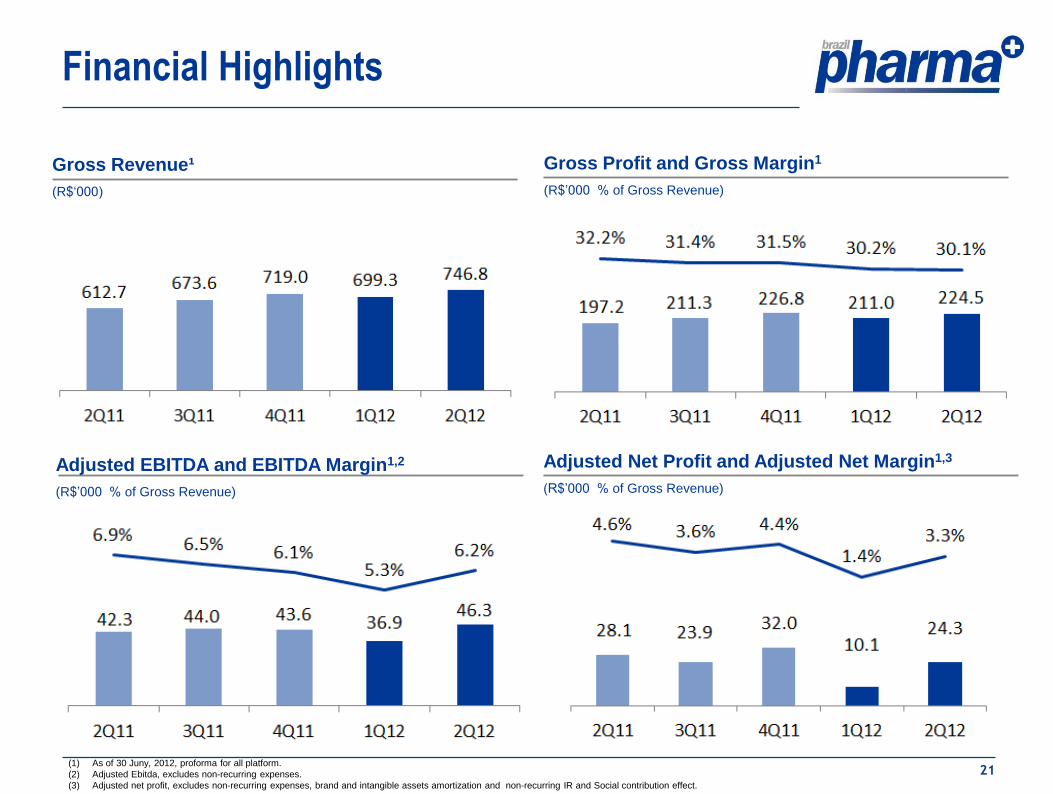
Financial Highlights
Gross Profit and Gross Margin1
(R$’000 % of Gross Revenue)
Adjusted Net Profit and Adjusted Net Margin1,3
(R$’000 % of Gross Revenue)
Adjusted EBITDA and EBITDA Margin1,2
(R$’000 % of Gross Revenue)
Gross Revenue¹
(R$‘000)
(1) As of 30 Juny, 2012, proforma for all platform.
(2) Adjusted Ebitda, excludes non-recurring expenses.
(3) Adjusted net profit, excludes non-recurring expenses, brand and intangible assets amortization and non-recurring IR and Social contribution effect.

22
127 / 155 / 202
127 / 127 / 127
0 / 56 / 150
217 / 217 / 217
204 / 215 / 234
Use of Proceeds
R$
476mm
R$
190mm
R$
238mm
R$
48mm
Constant focus on the reduction of the cash cycle
100 news stores in 2012; (~R$650 thousand for each new store)
Improvement and capacity expansion on the DCs
Invested Capex of R$47,7 million in 2012
Non current Debt Amortization timetable2
(1) Considers net cash of R$69,8 million related to the exercise of the Supplemental Option (Green Shoe)
(2) Non current debt amortization of R$613,2 million, as of 30 June, 2012 (2Q12).
Source of Proceeds
(Primary Offering¹) Use of
Proceeds
Optimization
of the capital
structure
Operational
Efficiency and
Systems
Working Capital,
M&A and
Organic Growth
IT and systems: first class ERP and managing and integration
system optimization
SSC and unification of the call center
48.5
99.7 91.1
229.4
144.6

Appendix
24
127 / 155 / 202
127 / 127 / 127
0 / 56 / 150
217 / 217 / 217
204 / 215 / 234
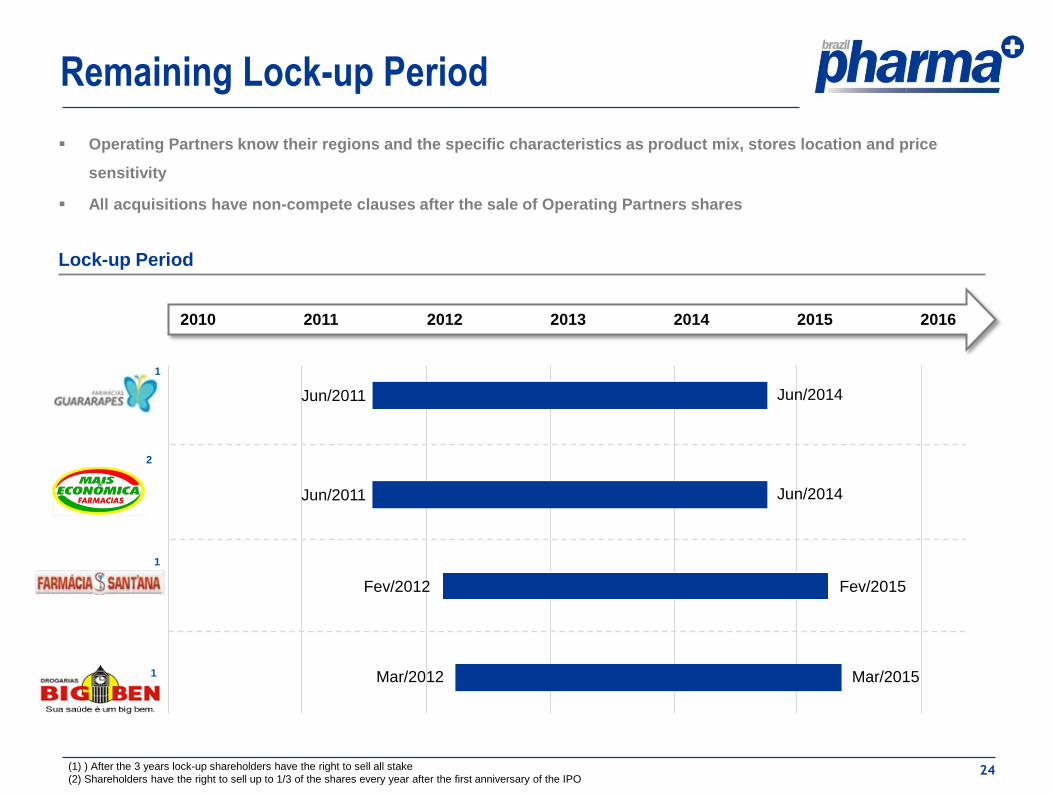
Remaining Lock-up Period
Lock-up Period
Operating Partners know their regions and the specific characteristics as product mix, stores location and price
sensitivity
All acquisitions have non-compete clauses after the sale of Operating Partners shares
(1) ) After the 3 years lock-up shareholders have the right to sell all stake
(2) Shareholders have the right to sell up to 1/3 of the shares every year after the first anniversary of the IPO
2010 2011 2012 2013 2014 2015 2016
Fev/2012 Fev/2015
Mar/2012 Mar/2015
Jun/2011 Jun/2014
Jun/2011 Jun/2014
1
2
1
1
25
127 / 155 / 202
127 / 127 / 127
0 / 56 / 150
217 / 217 / 217
204 / 215 / 234
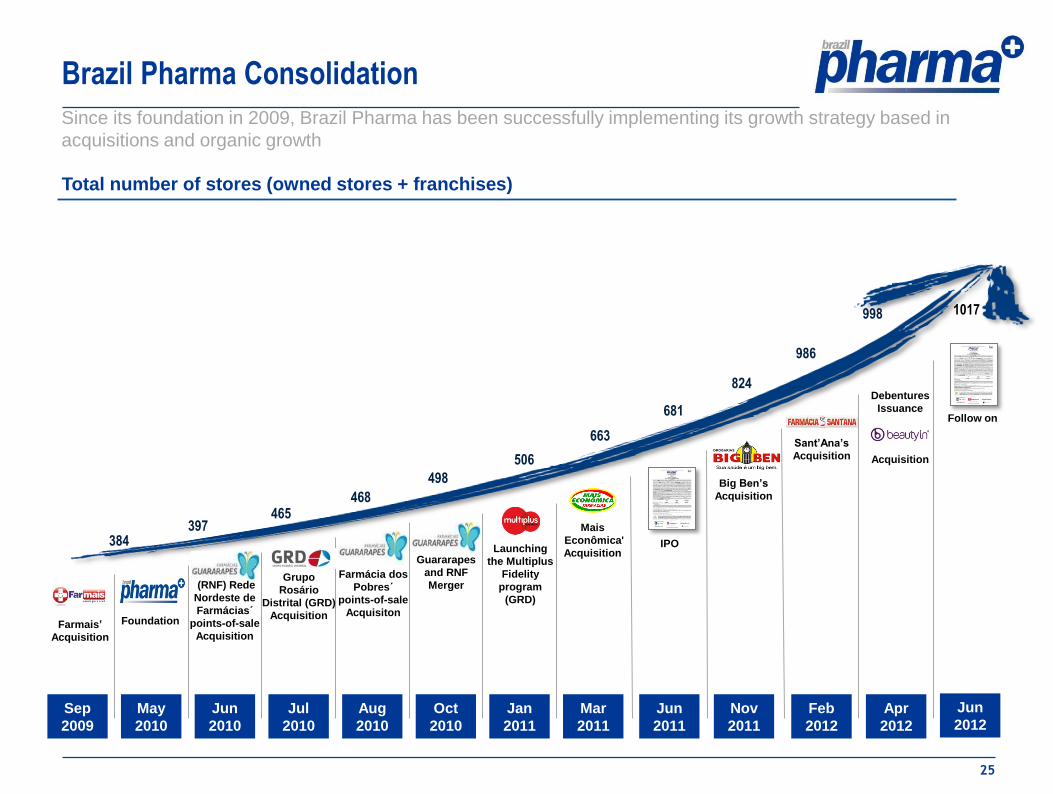
Brazil Pharma Consolidation
Since its foundation in 2009, Brazil Pharma has been successfully implementing its growth strategy based in
acquisitions and organic growth
Total number of stores (owned stores + franchises)
Farmais’
Acquisition
Foundation
Farmácia dos
Pobres´
points-of-sale
Acquisiton
Guararapes
and RNF
Merger (RNF) Rede
Nordeste de
Farmácias´
points-of-sale
Acquisition
Launching
the Multiplus
Fidelity
program
(GRD)
Mais
Econômica'
Acquisition
Grupo
Rosário
Distrital (GRD)
Acquisition
384 397
465 468
506
663
Sep
2009
Aug
2010
Oct
2010
May
2010
Jun
2010
Jan
2011
Mar
2011
Nov
2011
681
IPO
Jul
2010
Jun
2011
498 Big Ben’s
Acquisition
824
Feb
2012
Sant’Ana’s
Acquisition
986
998
Apr
2012
Debentures
Issuance
Acquisition
Jun
2012
Follow on
1017


